
Abstract
In order to study the influence of floating raft isolation system (FRIS) on the vibration characteristics of marine pump, a marine centrifugal pump with/without FRIS under the same operation condition, which specific speed is 66.7, was experimentally measured. The maximum efficiency of the pump is 75.8%, which is under 1.2Qd. Results show that the characteristic frequencies in the vibration spectrums of the pump with/without FRIS are APF (axial passing frequency), the BPF (blade passing frequency) and its high-order harmonic frequency. After installing FRIS, under 0.8Qd, 1.0Qd and 1.2Qd, the vibration intensity of the pump at inlet flange is slighter than that at pump base and larger than that at pump bracket. The vibration intensity at outlet flange is slighter than that at the pump bracket and larger than that at pump body, and the vibration intensity at connecting plate is the lowest. The vibration velocity level of pump base decreases with the increase of flow rate, the maximum vibration intensity at M1–M4 is reduced by 88% than that without FRIS, and the maximum vibration velocity of the APF at M1–M4 is reduced by 83.3% than that without FRIS.
Keywords
Introduction
As vessels in the ship system, marine centrifugal pumps are widely used in the ship's bilge ballast system, cooling water system, fire protection system, drainage system, circulating water system, and so on. 1 However, the vibration and noise generated by the marine centrifugal pumps during the operation process causes environmental pollution, which seriously affects the health of the crew, reduces the service life of equipment, and exposes the position of the ship. 2 Therefore, reducing the vibration and noise of marine centrifugal pumps has become one of key problems in the research of marine pumps.3–5
In recent years, scholars have done numerous researches on the vibration and noise in the pump and obtained encouraging achievements. Wang et al. 6 experimentally studied vibration, and noise characteristics of a five-stage centrifugal pump in different flow rate. Cernetic 7 adopted vibration and noise detection technology to monitor the cavitation in kinetic pumps. Experimental results showed that cavitation can be detected by vibration and noise detection in the audible spectrum. Lu et al. 8 analyzed the vibration characteristics and instabilities when cavitation occurred in a centrifugal pump. Gao et al. 9 investigated cavitation-induced vibration characteristics and discussed the vibration energy in 10–500 Hz frequency band. Chen et al. 10 used a hybrid numerical method to simulate vibration and noise induced by flow in a centrifugal pump. Numerical results showed that the pressure fluctuation amplitude depended on near-wall grid size and the vibration spectrum of volute was BPF. Zhang et al. 11 obtained vibration signals at different flow rate of a slope volute pump by experiment, and compared with the vibration characteristics of the traditional spiral volute pump. Liu et al. 12 adopted CFD/FEM analysis method and CFD/FEM/BEM coupling method to detect the sound radiation and vibration of the volute under fluid excitation force. Results showed that the sound pressure effect on the structure of the centrifugal pump was not significant. Wang et al. 13 studied the vibration and dynamic stress of volute casting for a centrifugal pump, based on the transient fluid–structure interaction theory.
From the above studies, we can see that the research of vibration and noise reduction in the pump is concentrated on the vibration-induced mechanism. In recent years, scholars have done numerous researches on the floating raft for vibration isolation.14–16 Kim et al. 17 used the parametric modeling method to establish the floating geometry model, and analyzed the influence of the main structural parameters on the vibration isolation performance. Wang and Mak 18 experimentally measured the deformation load and radial displacement curve of the floating raft frame under load, and researched the influence of the scorpion size on the raft performance. Li and Xu 19 presented a vibration isolation floating raft system constructed with a double-layer QZS mechanism. Wang and Mak 20 presented the theoretical of the inertial actuator connected to the accelerometer and introduced an active vibration control of the floating raft by the local feedback loop. Song et al. 21 established discrete transfer function mathematics of floating raft active vibration isolation system based on system identification method model. Huang et al. 22 proposed a system modeling and optimization method for analyzing the typical floating raft system of submarine and studied the optimization problem under different vibro-acoustic targets.
Nowadays, researches on floating raft mainly focus on vibration isolation mechanism, design, optimization and installation. However, vibration control using FRIS for marine centrifugal pump is still inadequate. In this paper, under the same operation condition, a marine centrifugal pump with/without FRIS were experimentally measured and analyzed, which can provide some foundations for the optimization design of the FRIS for marine centrifugal pump.
Experiment bench
Marine centrifugal pump
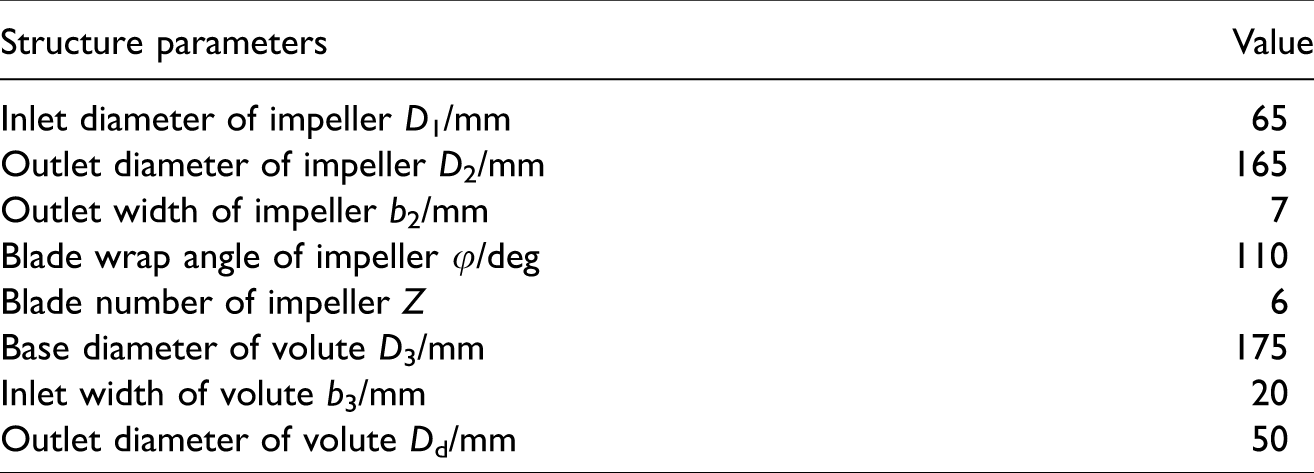
The research object in this research is a marine centrifugal pump. Its design parameters are as follows: Flow rate Qd is 25 m3/h, head H is 34 m, the rotation speed n is 2950 r/min, and specific speed ns is 66.7 (
Main structure parameters.
Structure of the marine pump with FRIS
Structure of the pump with FRIS is shown in Figure 1, which contains floating raft, vibration isolator, connecting plate, pump and motor. The floating raft is fixed on the base of the cast iron platform by anchor bolts. Four vibration isolators of 6JX-70 model are installed symmetrically on the upper part of the floating raft, which are bolted to the connecting plate. The centrifugal marine pump and motor are installed on the connecting plate by bolts. Among them, FRIS includes the floating raft and vibration isolator. The size of the floating raft is 500 × 500 × 510 mm, the thickness of the ribs is 25 mm and the numbers of reinforcing ribs are 12. In addition, its material is marine grade B-type steel, which is made up of the material ZG25MnNi. The surface of the vibration isolator is covered with nitrile rubber, which can effectively prevent the metal parts from being rusted.
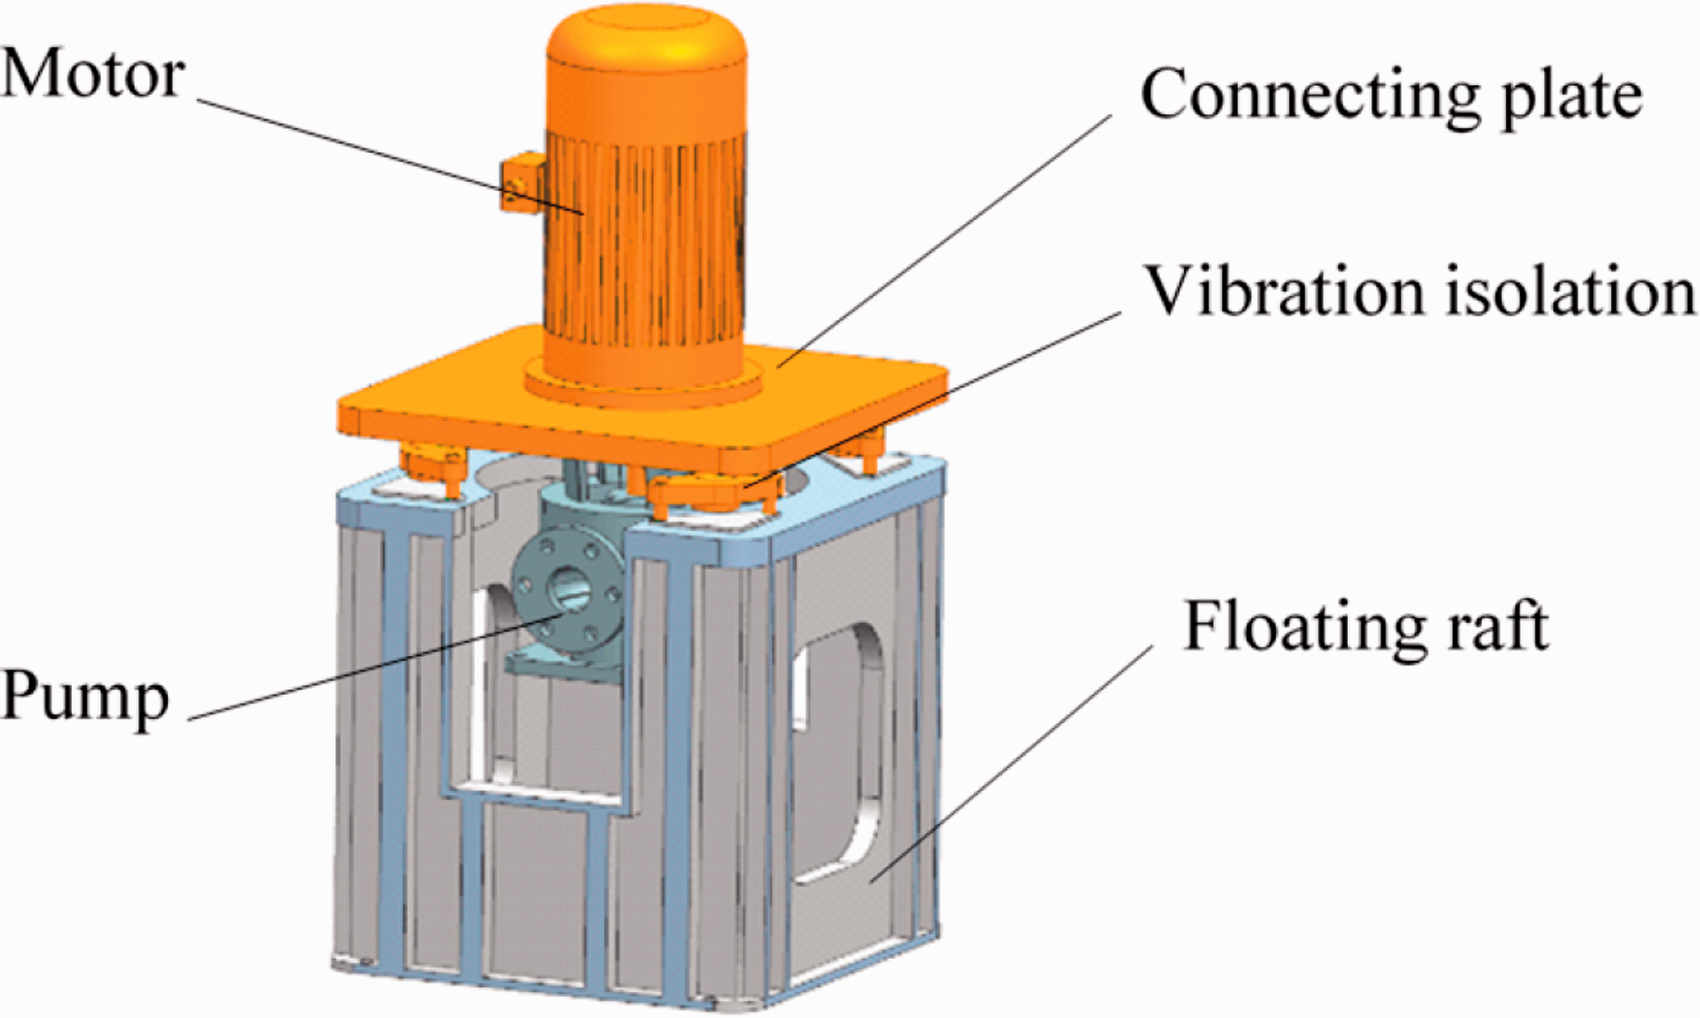
Structure of the marine pump with FRIS. FRIS: floating raft isolation system.
Experiment bench
The marine pump performance with FRIS is experimented in the closed experiment bench shown in Figure 2, which is mainly composed of signal data acquisition instrument, electromagnetic flowmeter, gate valve, water tank, pressure sensors, motor, marine pump, FRIS, base and computer. When measuring the characteristics of the pump without FRIS, it is necessary to remove FRIS, as shown in Figure 3. The quality of the base of vibration bench has a significant influence on the vibration acceleration magnitude of the experiment results. Under the same amount of motivation, the vibration of the base decreases as the mass of the base itself increases. In order to meet the quality requirements of vibration experiment bench base of the marine centrifugal pump, a cast iron base is designed. According to the position of the base anchor bolt, the T-shaped slot is designed on the base. According to the size of the experiment bench, the size of cast iron platform is set to 900 × 600 × 100 mm, and its weight is about 230 kg. In addition, the marine centrifugal pump itself weighs 72 kg, and the vertical pipes weigh about 15 kg.
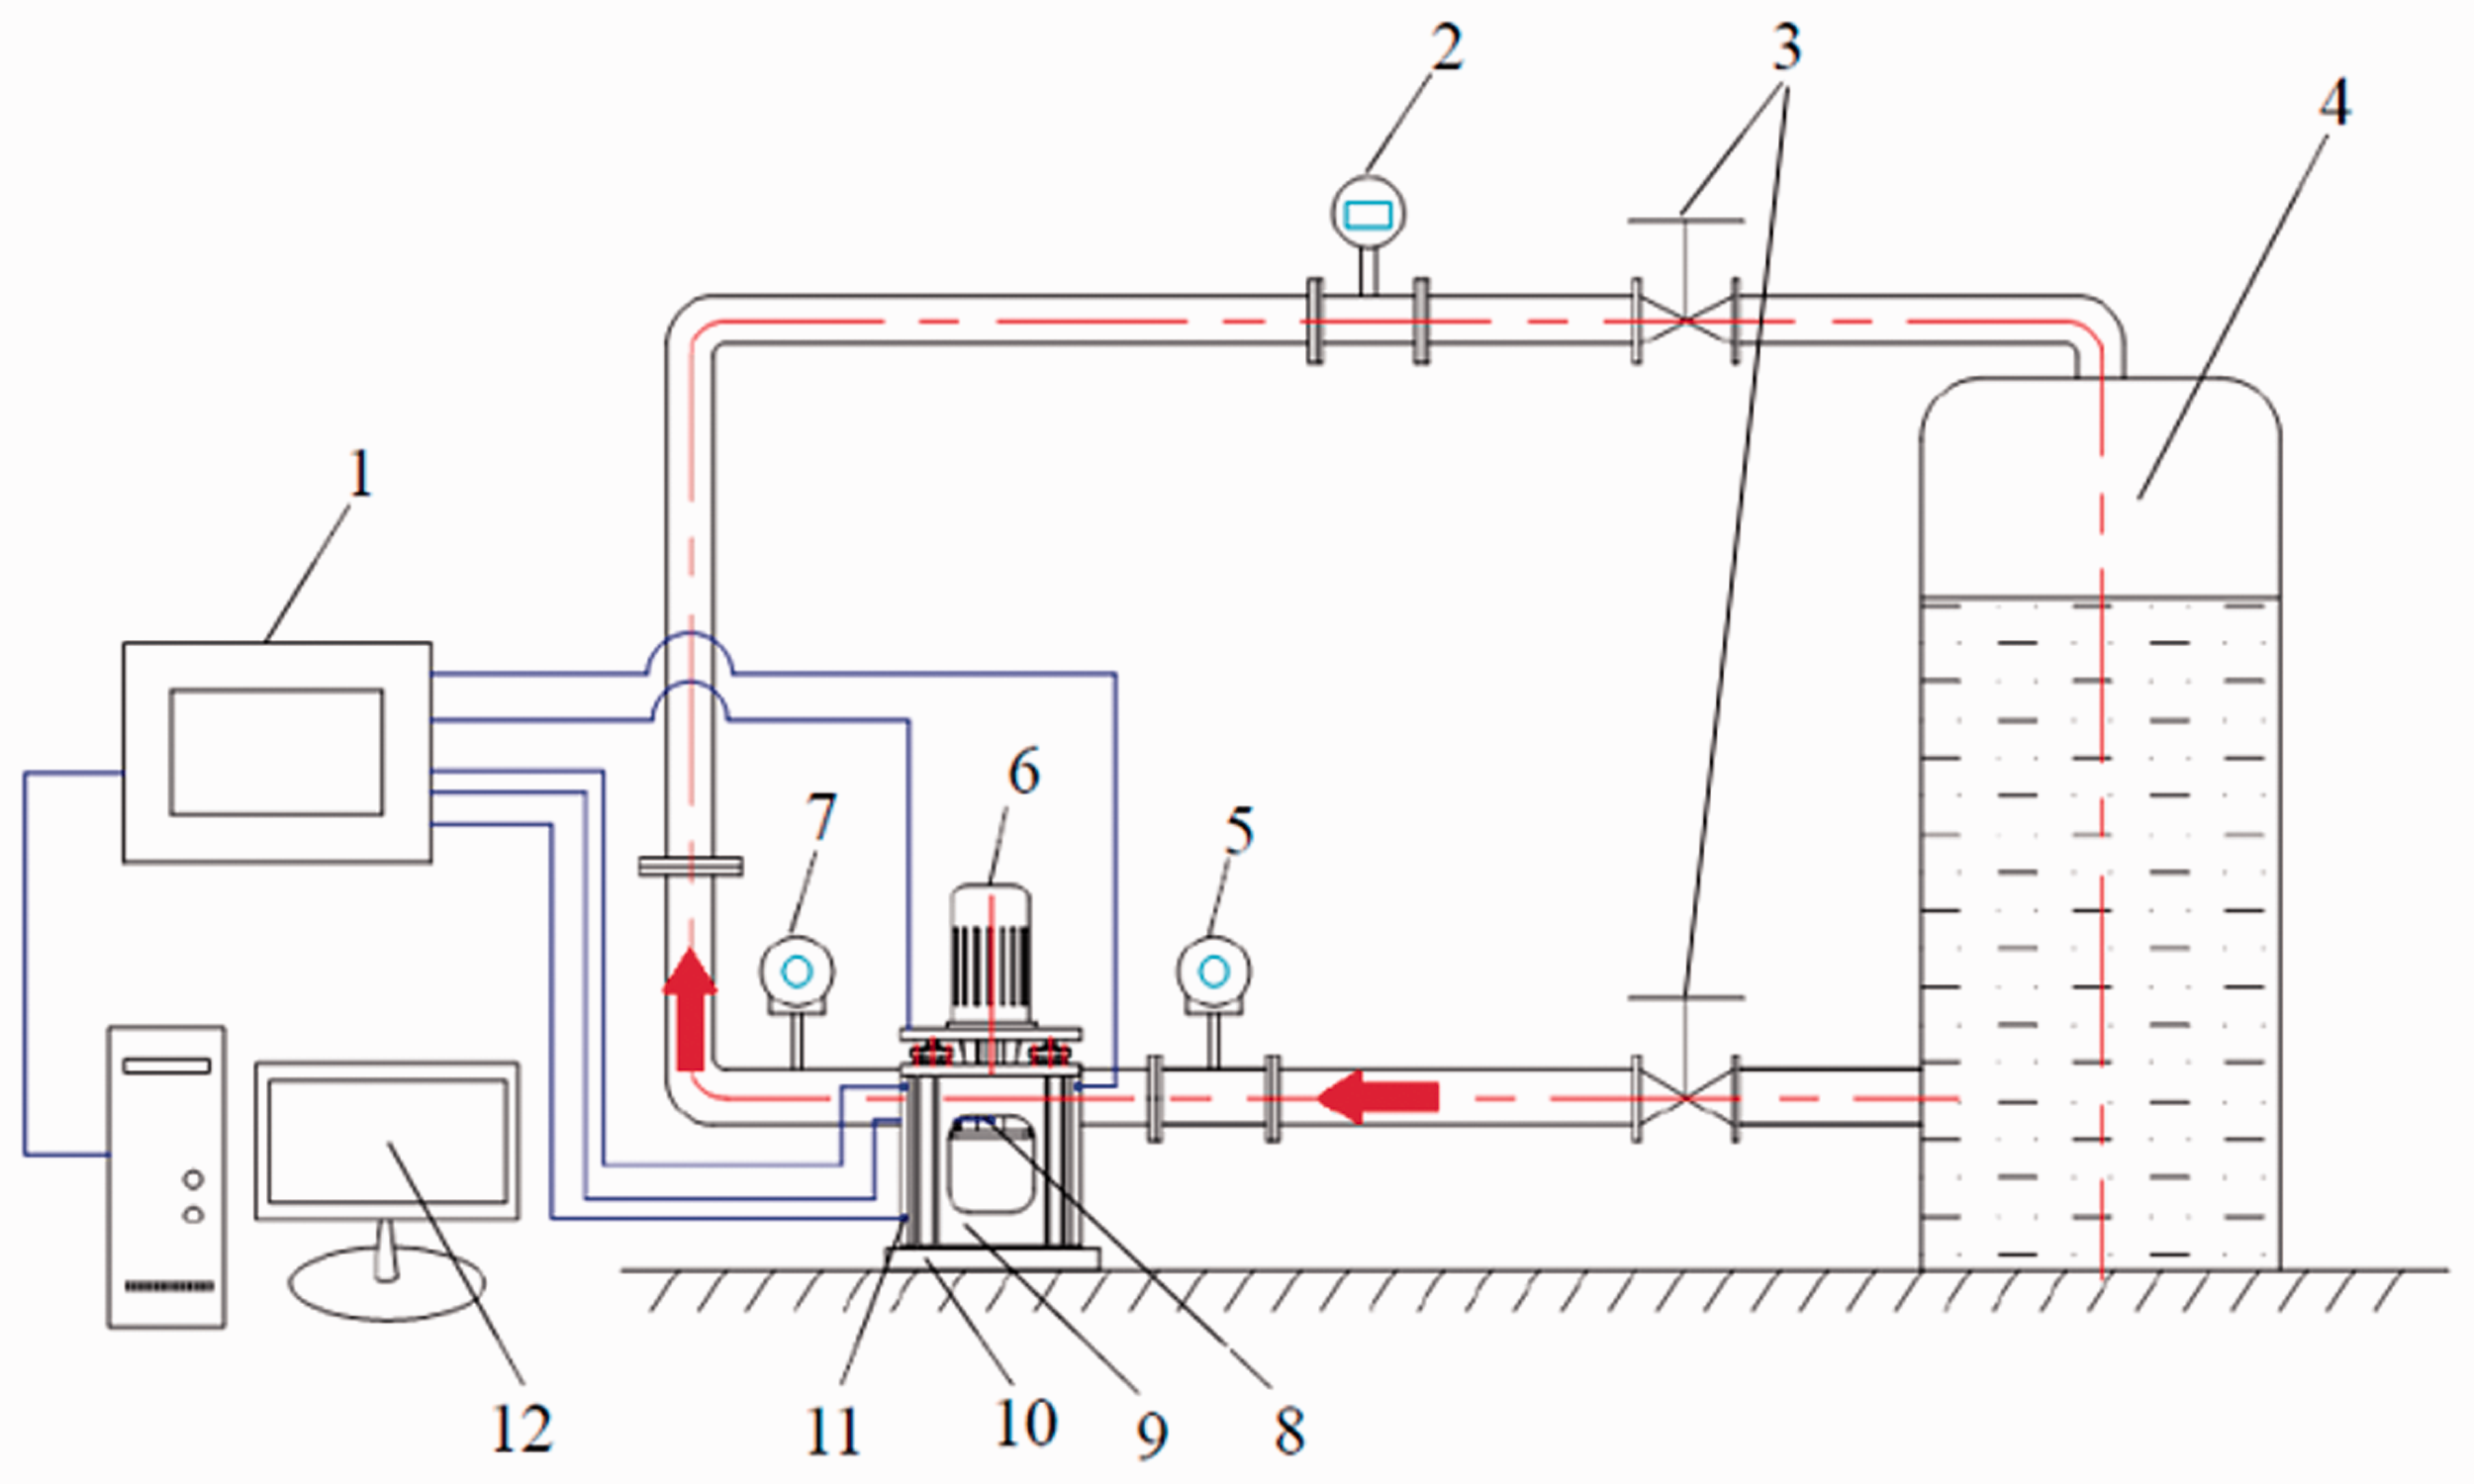
Schematic diagram of vibration experiment bench for marine centrifugal pump.
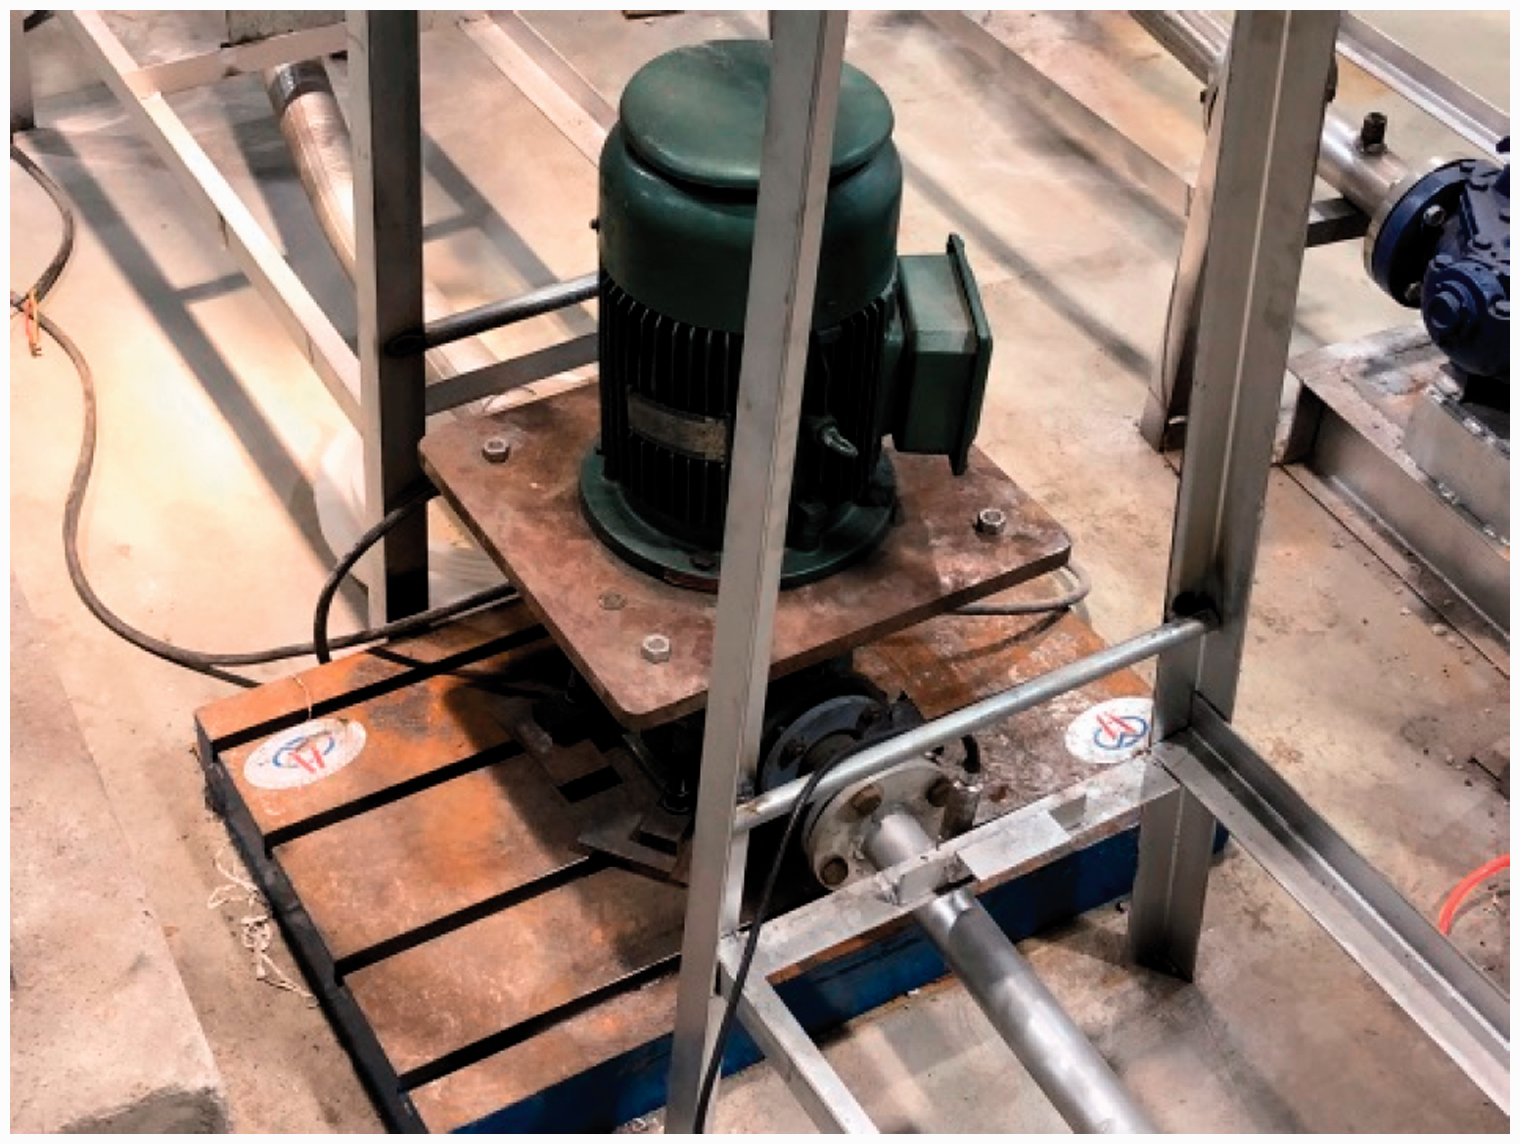
Base of vibration bench.
Arrangement of vibration monitoring points
A total of 12 vibration monitoring points are set in the pump, as shown in Figure 4. The monitoring points M1–M4 of the pump with the floating raft are arranged at the bottom of the floating raft, which are shown in Figure 4(a), but M2 is invisible. The monitoring points M1–M4 of the pump without the floating raft are placed in the pump base, which is shown in Figure 4(b), but M3 and M4 are invisible. Other monitoring points of the pump with/without floating raft are set in the same position, which are shown in Figure 4(b). Monitoring points M5–M8 are at the connecting plate. M9 is set at the inlet flange. M10 is located in the pump body. M11 is located in the pump bracket. And M12 is located in the outlet flange.
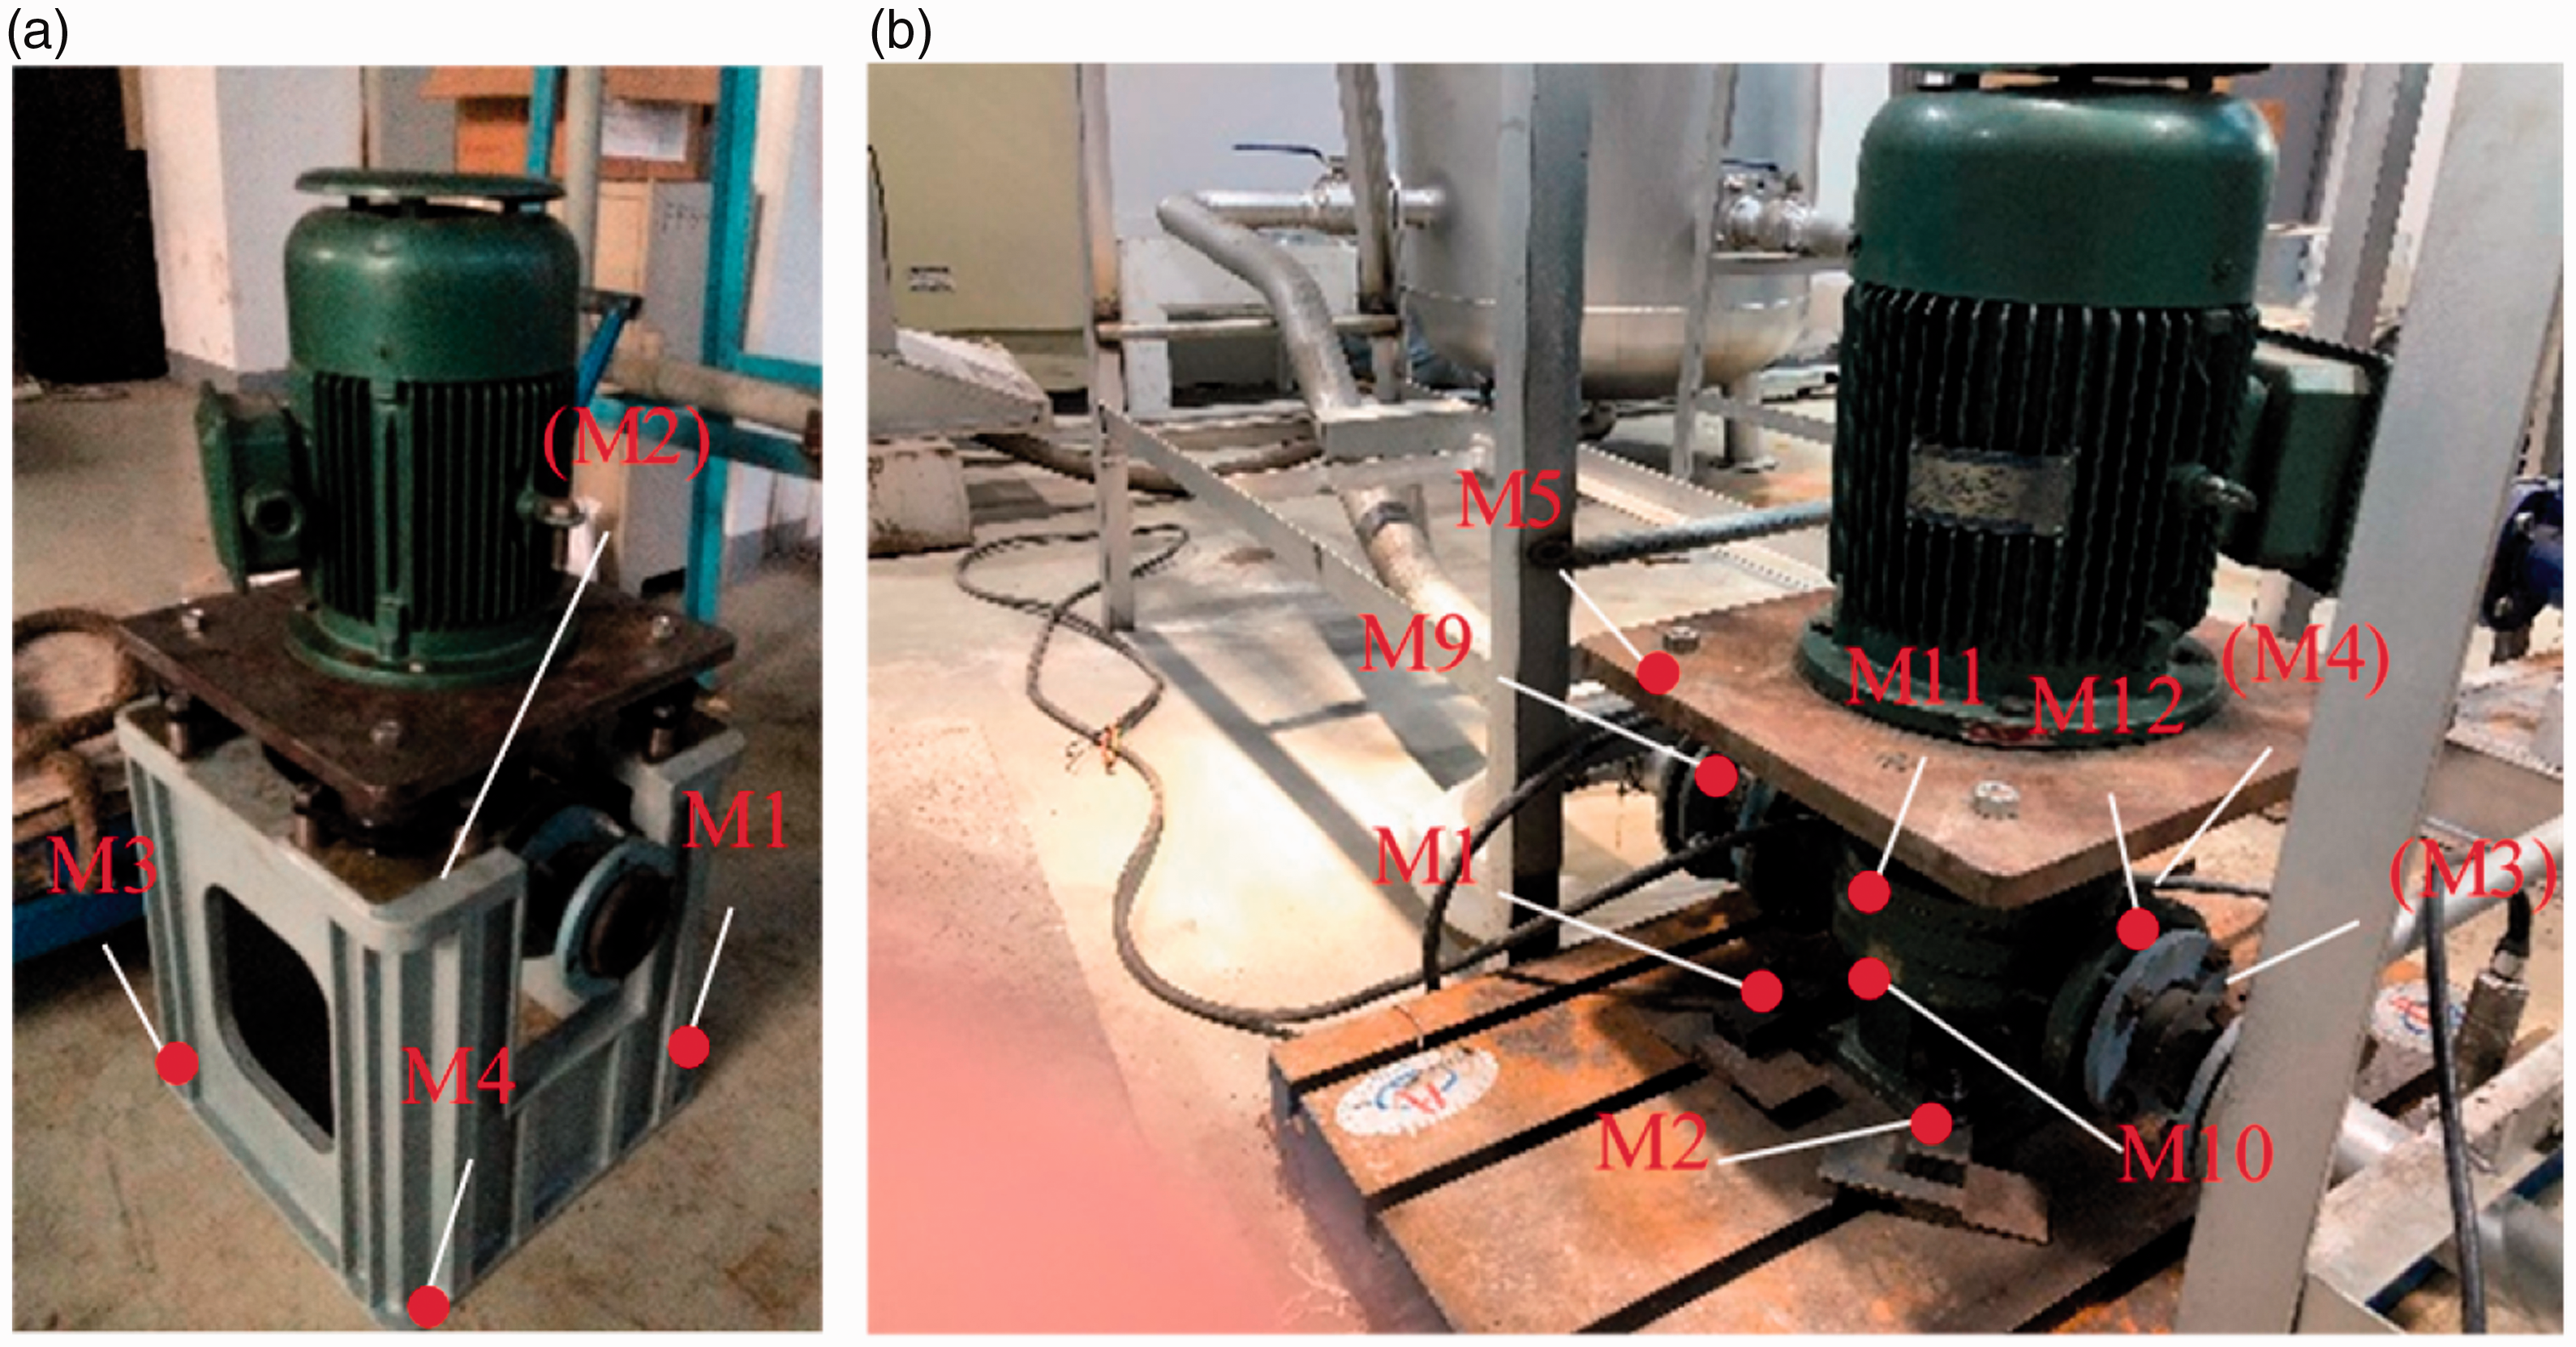
Location of vibration monitoring points. (a) With FRIS. (b) Without FRIS. FRIS: floating raft isolation system.
The processing method of vibration data
Experiment instruments
In this experiment, the INV3020C system is adopted to collect the vibration signals, subsequently through which the time domain and frequency domain analysis are employed to analyze the collected data. The INV9832 piezoelectric three-axis accelerometer is used to measure the vibration of the marine centrifugal pump, which could measure the vibration acceleration in three mutually perpendicular directions. The vibration frequency of centrifugal pump is usually small, which is lower than 1000 Hz. Therefore, this paper set the sampling frequency as 6.4 kHz and sampling time as 60 s. The integral function of DASP software is used to convert the collecting the data of vibration acceleration into vibration velocity data.
Vibration data processing method
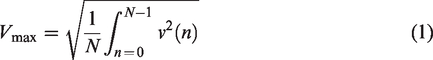
The vibration intensity concept is generally used to evaluate the vibration level of construction machinery. It is not only reflected in the three directions, but also in the maximum value of the RMS value of the vibration velocity under small flow rate, design flow rate and large flow rate. Therefore, in this experiment, vibration intensities of the pump with/without floating raft are measured, and the data are extracted under 0.8Qd, 1.0Qd and 1.2Qd. The calculated value of the vibration intensity Vmax can be obtained by the following equation
In order to intuitively reflect the change of vibration level of the pump with/without FRIS, the vibration spectrums of each monitoring points are measured. Marine centrifugal pumps are generally installed vertically on the deck of the ship, so the focus is on the vibration spectrum in the Z direction. In this paper, the vibration spectrums of each monitoring points at the Z direction under 0.6Qd, 0.8Qd, 1.0Qd, 1.2Qd and 1.4Qd are selected for comparative analysis.
Results and analysis
Energy performance
Figure 5 shows the energy performance curves of the marine centrifugal pump. It can be seen from Figure 5 that under 0.8Qd, the head of the pump is 37.1 m and the efficiency of the pump is 71.9%. Under 1.0Qd, the head of the pump is 35.7 m and the efficiency of the pump is 74.6%. Under 1.2Qd, the head of the pump is 33.5 m, and the efficiency of the pump is 75.8%. Under 1.4Qd, the head of the pump is 29.6 m, and the efficiency of the pump is 71.8%. Therefore, the maximum efficiency of the pump is under 1.2Qd and the efficiency of the pump is 75.8%.
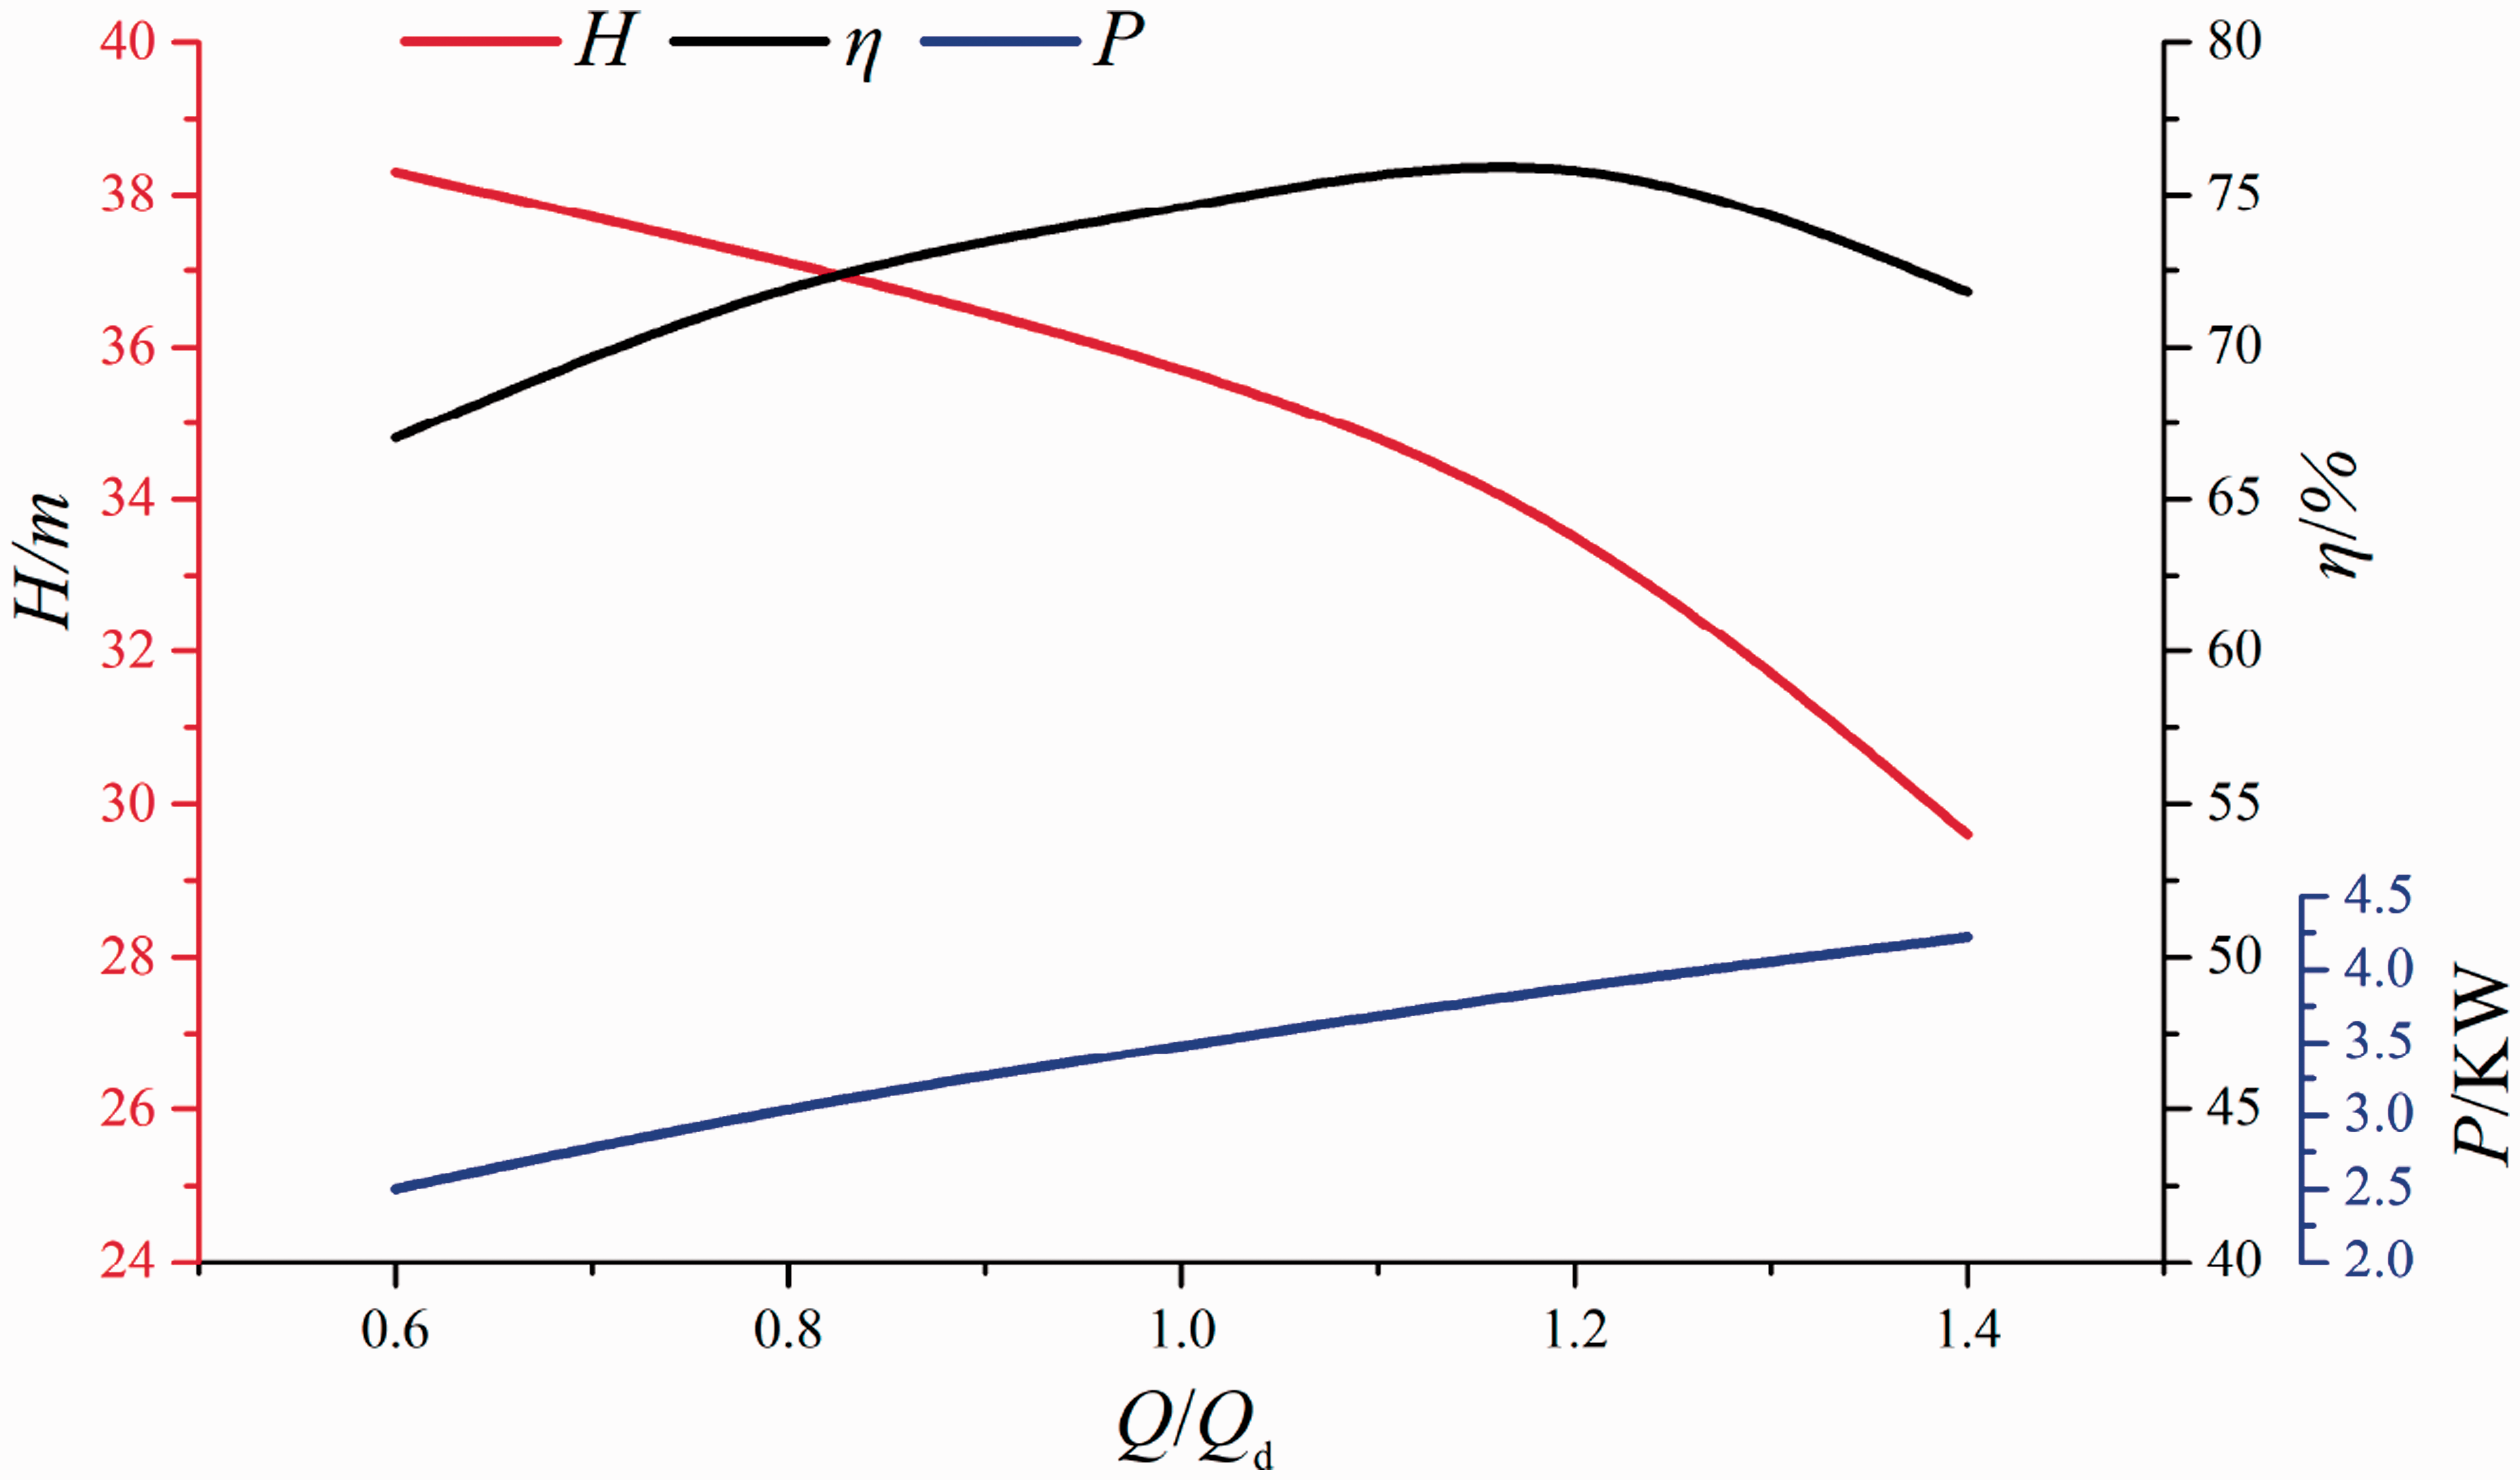
Energy performance of the pump.
Vibration characteristics
Vibration characteristics at M1–M4
Table 2 shows the vibration intensities at M1–M4 of the pump with/without FRIS. It can be seen that under 0.8Qd, 1.0Qd and 1.2Qd, the maximum vibration intensities of the pump at the base monitoring points as the pump with/without FRIS are 0.03 mm/s and 0.25 mm/s, respectively. After FRIS is installed, the maximum intensity at the base monitoring points is reduced by 88.0%, which indicates that FRIS has a significant influence on the maximum vibration intensity at the base monitoring points. In other words, FRIS can effectively dissipate the vibration energy transmitted from the mechanical structure to the ship, and the noise level caused by the vibration excitation of the hull is greatly reduced.
Vibration intensities at M1–M4.
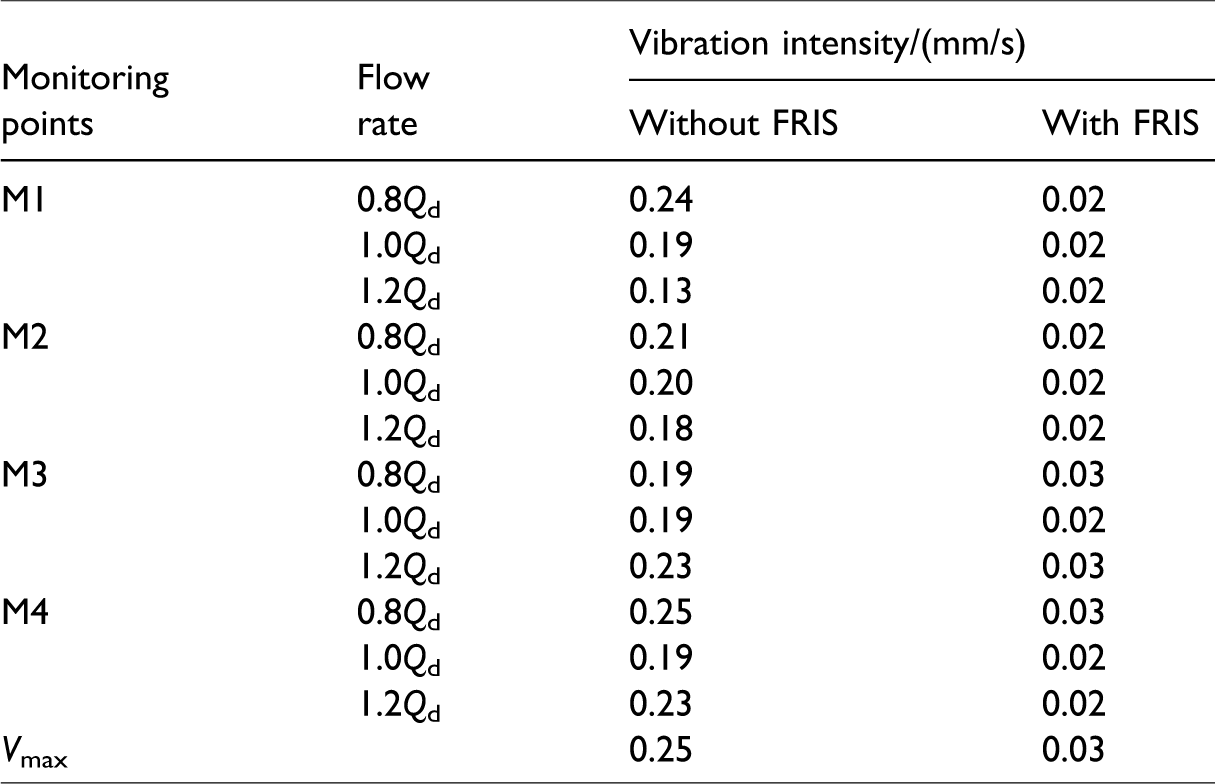
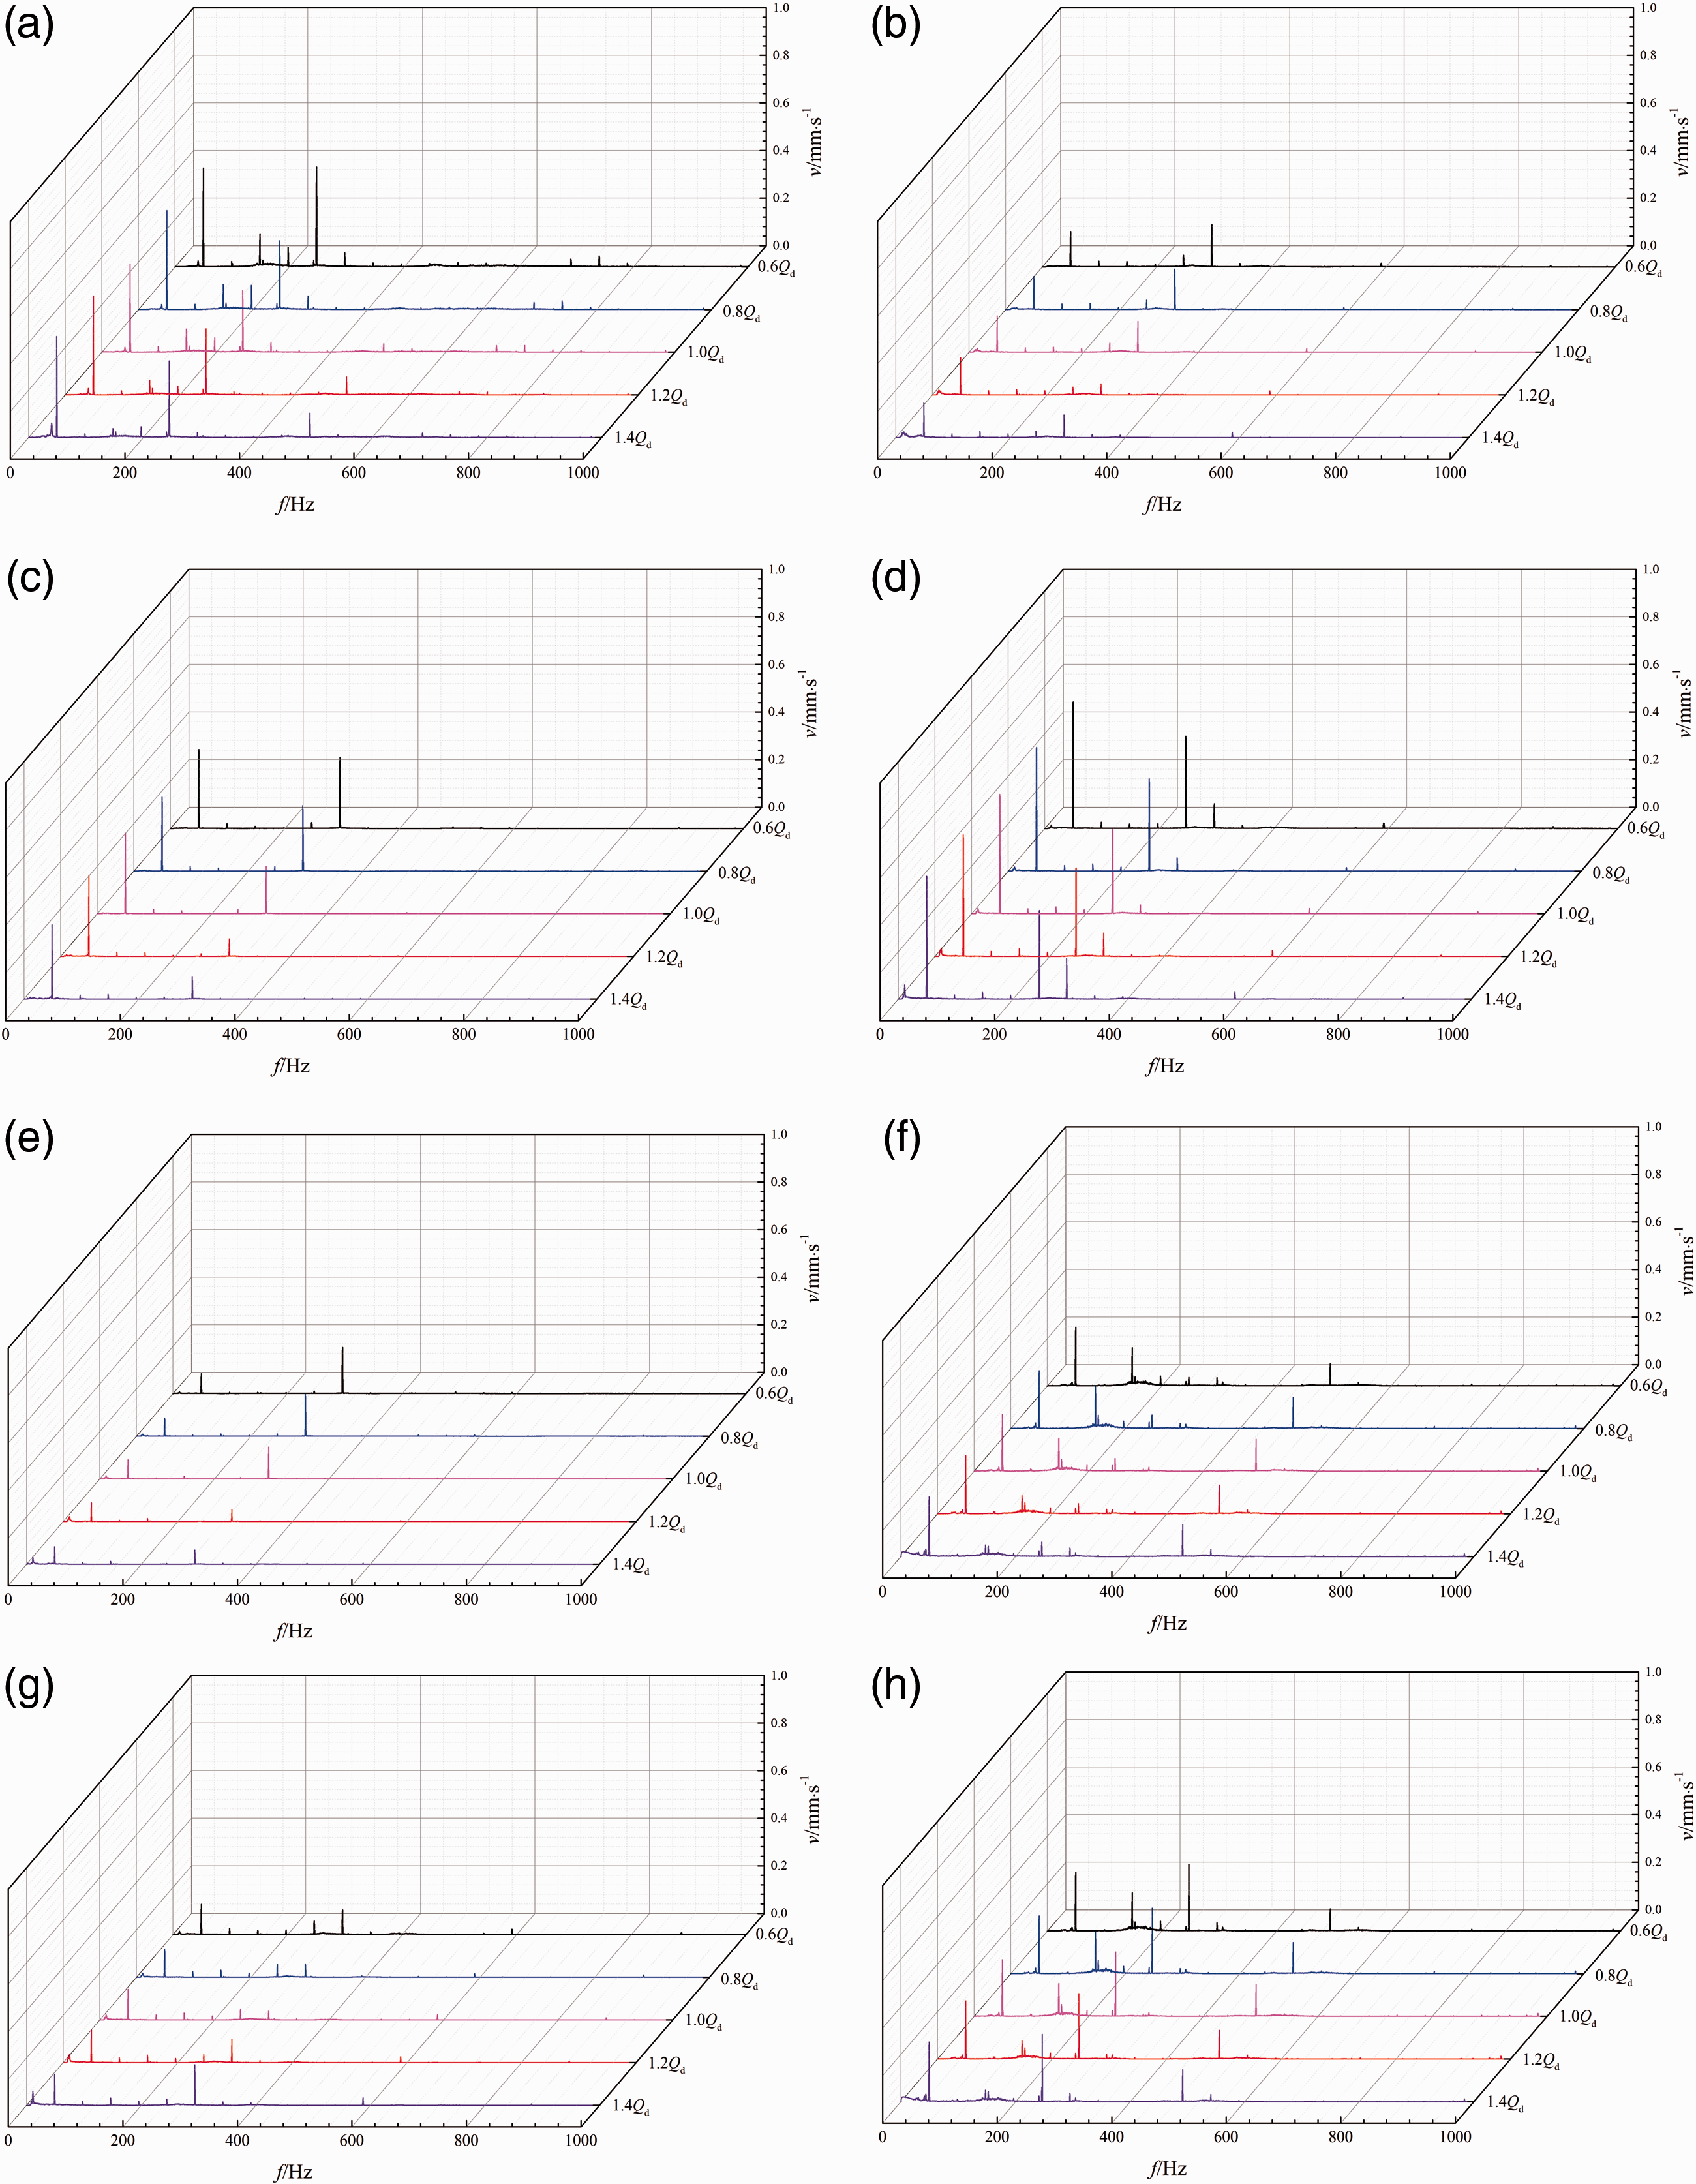
Figure 6 shows the vibration spectrums at M1–M4 with/without FRIS. It can be seen from Figure 6 that in the frequency band of 0–1000 Hz, the main frequency is APF and the secondary peak appears near the BPF. The characteristic frequency is APF, BPF and its high-order harmonic. Under different flow rate, as the flow rate increases, the vibration velocity level at the base monitoring points of the pump without FRIS firstly decreases and then increases. In addition, the vibration level under off-design flow rate is large, and the vibration level reaches the minimum under 1.0Qd. This is because that under off-design flow rate, the fluid flow in the pump is unsteady, and the flow factor with large energy dissipation is dominant in the process of vibration transmission. On the other hand, the amplitude of the vibration velocity at the secondary frequency is different due to the different relative positions of the monitoring points. After installing FRIS, the vibration peak values of APF and BPF are significantly reduced. The maximum vibration velocity at the main frequency is reduced from 0.24 mm/s to 0.04 mm/s, and the vibration energy is reduced by 83.3%, which also indicates that FRIS has a significant influence on the reducing the vibration velocity level. Besides, under different flow rate, the vibration velocity level at the base monitoring points decreases with the increase of the flow rate. The vibration velocity level on the BPF in the vibration spectrums at M3 and M4 is larger than that of the other monitoring points. This is because that M3 and M4 are closer to the outlet pipe, and the fluid near the pump outlet contains the most abundant flow. Unsteady operation conditions cause the fluid to flow unsteadily. Periodic changes between the channels of the volute tongue and impeller outlet lead to the results that fluid produces static and dynamic interference. Therefore, the vibration and pressure fluctuation level is the most intense under BPF.
Vibration spectrums at M1–M4. (a) M1 without FRIS. (b) M1 with FRIS. (c) M2 without FRIS. (d) M2 with FRIS. (e) M3 without FRIS. (f) M3 with FRIS. (g) M4 without FRIS. (h) M4 with FRIS. FRIS: floating raft isolation system.
Vibration characteristics at M5–M8
Table 3 shows the vibration intensities at the connecting plate monitoring points M5–M8 with/without FRIS. It can be seen from Table 3 that after installing FRIS, the maximum vibration intensity at M5–M8 under the 0.8Qd, 1.0Qd and 1.2Qd is reduced from 0.64 mm/s to 0.62 mm/s. In addition, the maximum intensity at M5–M8 is reduced by 3.1%, which indicates that FRIS has less influence on reducing the maximum vibration intensity at the connecting plate points.
Vibration intensities at M5–M8.
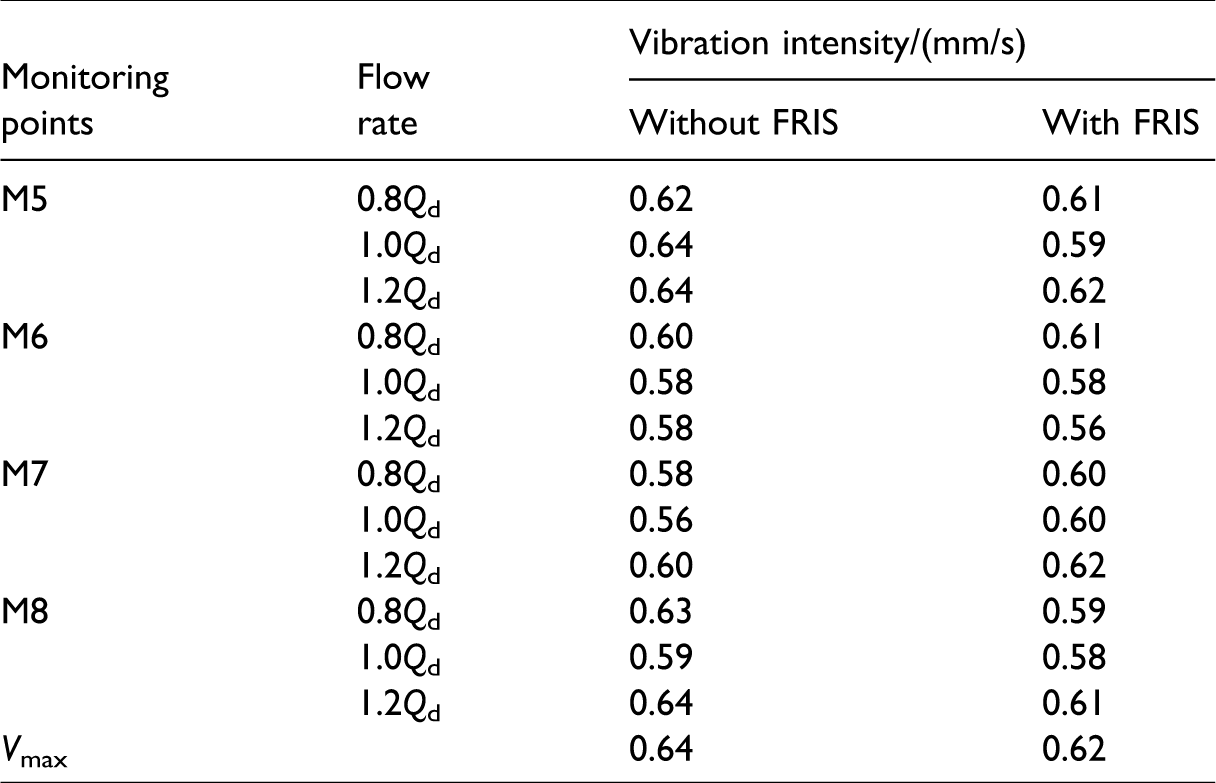
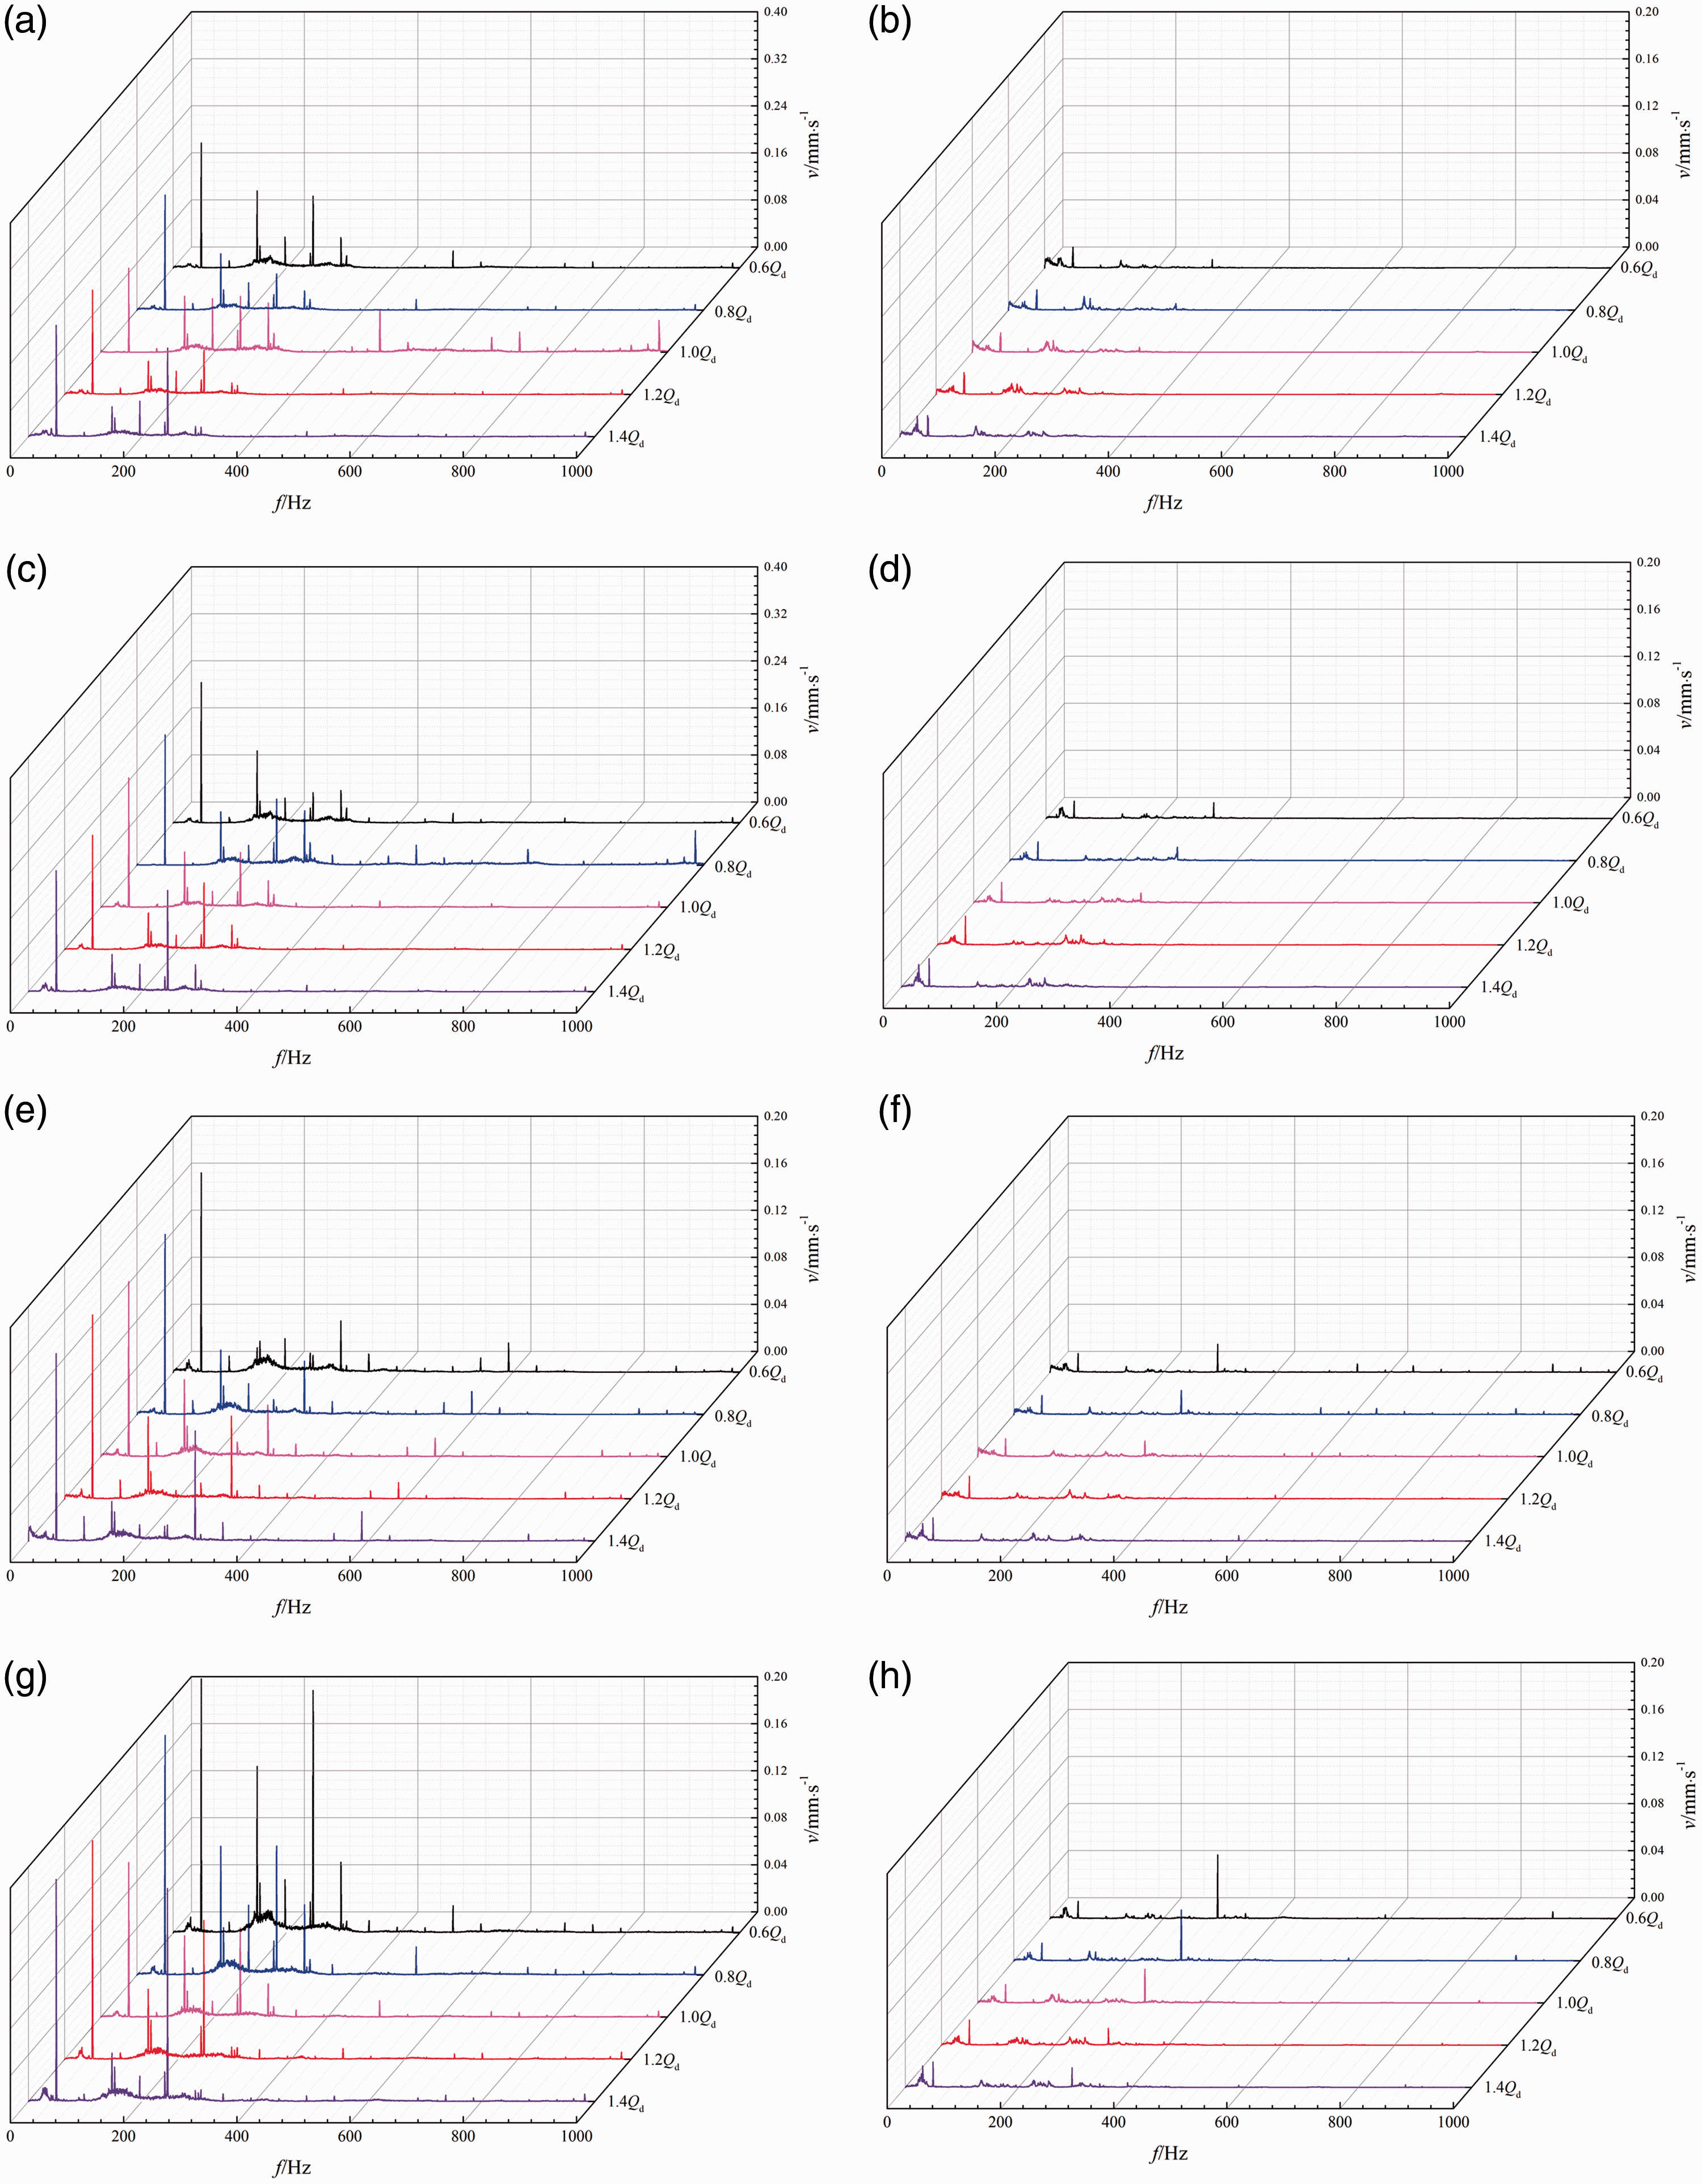
Figure 7 shows the vibration spectrums at M5–M8 with/without FRIS. It can be seen from Figure 7 that as a whole, the vibration spectrum changes at the connecting monitoring points with/without FRIS are similar. In the frequency band of 0–1000 Hz, the main frequency is also APF, and the secondary peak appears near the BPF. Under different flow rate, the vibration velocity level has no significant change with the flow rate increases of the pump. The extreme value of the vibration velocity at the BPF is much smaller than the peak value at the APF. Because the connecting plate is located between the pump and the motor, which is far away from the impeller and volute of the pump in the vertical direction, and the vibration energy produced by the monitoring points is largely caused by the vibration of the rotation of the pump and the motor. Therefore, the APF is the most obvious in the frequency domain distribution.
Vibration spectrums at M5–M8. (a) M5 without FRIS (b) M5 with FRIS. (c) M6 without FRIS (d) M6 with FRIS. (e) M7 without FRIS. (f) M7 with FRIS. (g) M8 without FRIS. (h) M8 with FRIS. FRIS: floating raft isolation system.
Vibration characteristics at M9–M12
Table 4 shows the vibration intensities at M9–M12 with/without FRIS. It can be seen from Table 4 that after installing FRIS, the maximum vibration intensity at M9 under 0.8Qd, 1.0Qd and 1.2Qd is reduced from 0.50 mm/s to 0.16 mm/s, which shows that FRIS has a positive effect on the vibration energy attenuation of inlet flange position. The maximum vibration intensity at M10 is increased from 0.25 mm/s to 0.49 mm/s, the maximum vibration intensity at M11 is increased from 0.18 mm/s to 0.23 mm/s, and the maximum vibration intensity at M12 is increased from 0.15 mm/s to 27 mm/s. It shows that FRIS increases the vibration intensity at the pump bracket and outlet flange.
Vibration intensities at M9–M12.
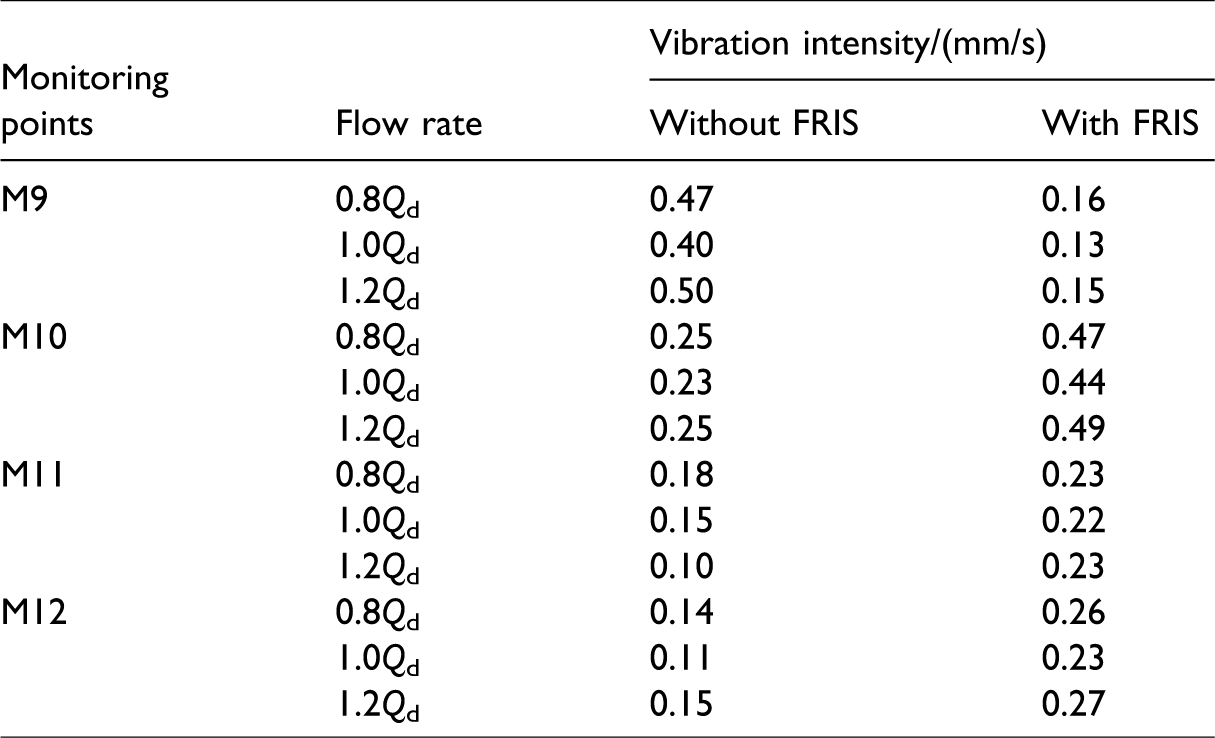
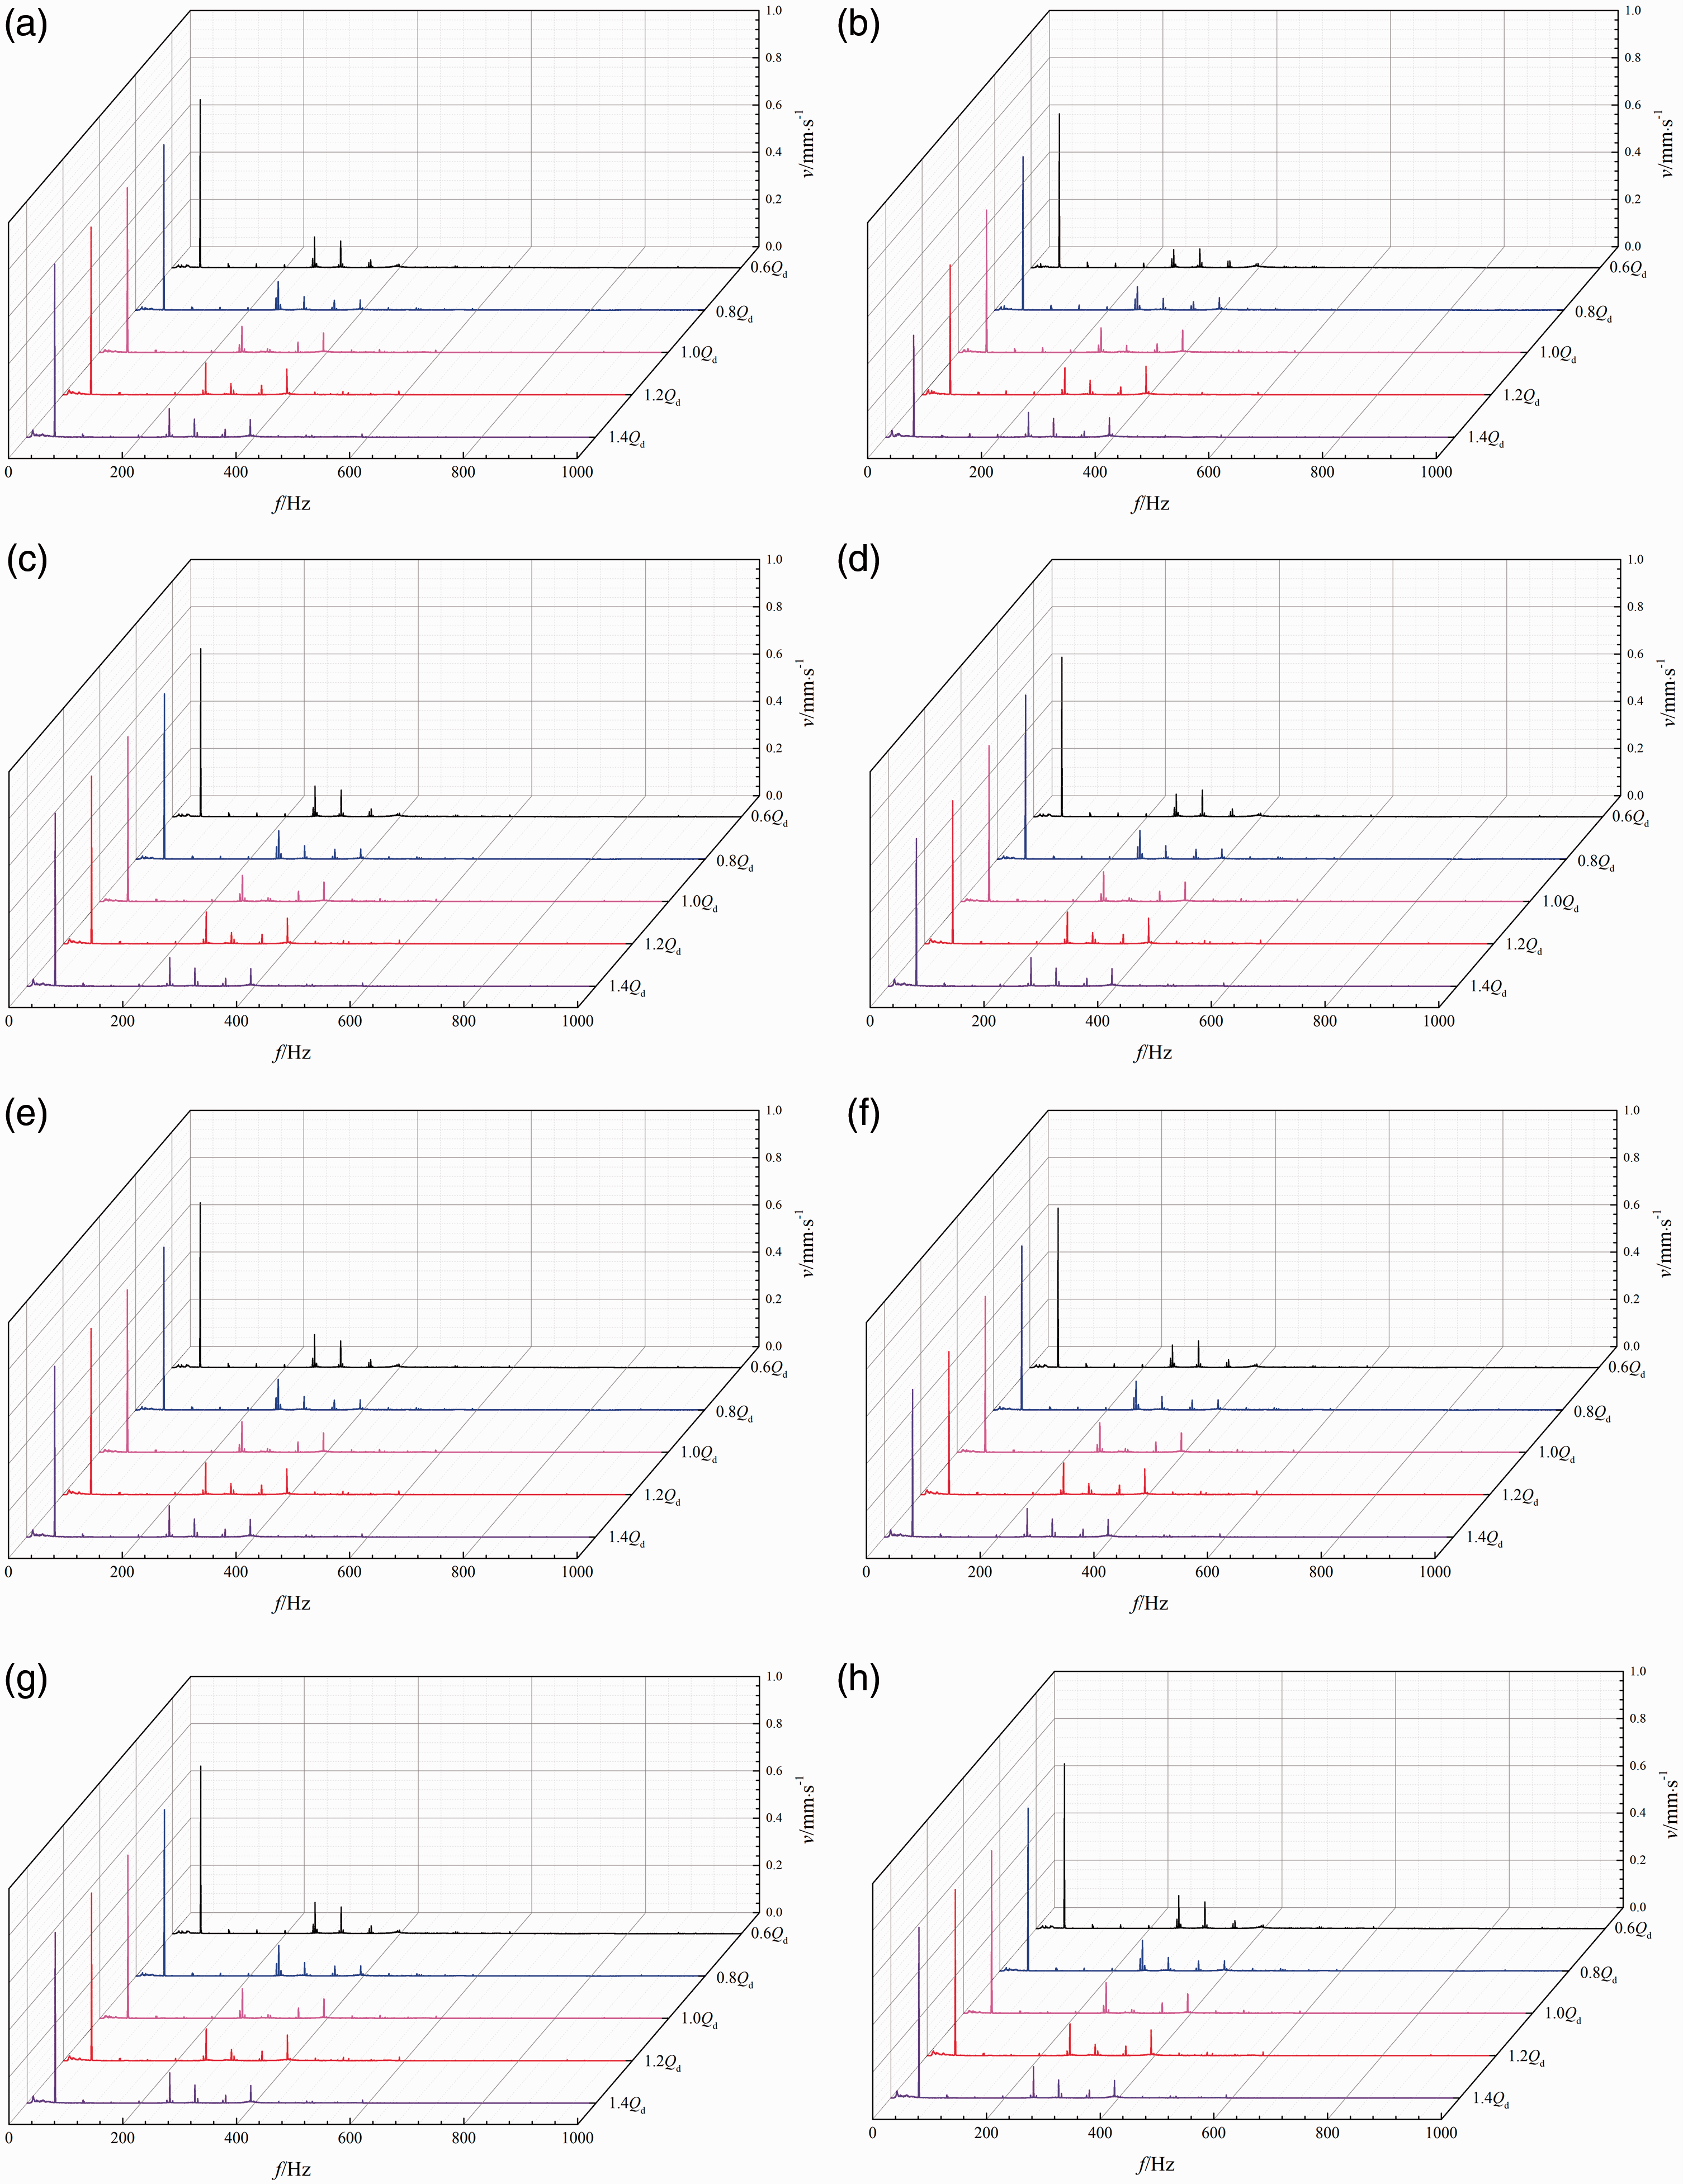
Figure 8 shows the vibration spectrums comparison at M9–M12 with/without FRIS. It can be seen from Figure 8 that in the frequency band of 0–1000 Hz, the main frequency is also APF, and the secondary peak appears near the BPF. As the flow rate increases, the vibration velocity level at M9 without FRIS firstly decreases and then increases. After installing FRIS, the peak value of vibration velocity at M9 decreases from 0.40 mm/s to 0.19 mm/s, which decreased by 52.5%. The main energy reduction is concentrated on the vibration energy of APF and BPF. Under different flow rate, the vibration velocity level at M10 without FRIS decreases as the flow rate increases. However, after installing FRIS, the vibration velocity level at M10 has no significant change with the flow rate increases of the pump. The peak value of vibration velocity at M10 increases from 0.25 mm/s to 0.43 mm/s. This is because that the pump body is far away from the ground and FRIS, which makes the vibration energy unable to effectively transmit through the structure. Therefore, the peak value of vibration velocity increases. The vibration velocity level without FRIS decreases with the flow rate increases of the pump. However, after installing FRIS, the vibration velocity level trend at M11 is just the opposite, and the value of vibration velocity increases slightly. As the flow rate increases, the vibration velocity level at M12 firstly decreases and then increases. After installing FRIS, the vibration velocity level at M12 has no significant change with increases of the flow rate. The peak value of vibration velocity at M12 increases from 0.15 mm/s to 0.23 mm/s. This is because that as the flow rate increases, the force acting on the wall surface causes the vibration of the overall structure to increase, which leads to an increase in the vibration level. In this part, the proportion of structural vibration is larger than the flow-induced vibration caused by the hydraulic factor.
Vibration spectrums at M9–M12. (a) M9 without FRIS. (b) M9 with FRIS. (c) M10 without FRIS. (d) M10 with FRIS. (e) M11 without FRIS. (f) M11 with FRIS. (g) M12 without FRIS. (h) M12 with FRIS. FRIS: floating raft isolation system.
Conclusions
The vibration characteristics of a marine centrifugal pump with/without FRIS was experimentally measured and analyzed. Some conclusions are as follows.
Experimental results of energy performance of the marine centrifugal pump show that maximum efficiency of the pump is under 1.2Qd, and the efficiency of the pump is 75.8%. Under 1.0Qd, the head of the pump is 35.7 m, and the efficiency of the pump is 74.6%. The characteristic frequencies in the vibration spectrums of the pump with/without FRIS are ABF, BPF and its high-order harmonic frequency. After installing FRIS, the maximum vibration intensity of the pump at M1–M4 under 0.8Qd, 1.0Qd and 1.2Qd is reduced by 88.0%. The vibration intensity at inlet flange is slighter than that at pump base and larger than that at pump bracket. The vibration intensity at outlet flange is slighter than that at the pump bracket and larger than that at pump body, and the vibration intensity at connecting plate is the lowest. After installing FRIS, the maximum vibration velocity of the APF at M1–M4 under 0.6Qd, 0.8Qd, 1.0Qd, 1.2Qd and 1.4Qd is reduced by 83.3%. As the flow rate increases, the vibration velocity level of the pump at M1–M4 and M9 decreases, the vibration velocity level of the pump at M5–M8, M10 and M12 has no significant change, and the vibration velocity level changes of the pump at M11 firstly decreases and then increases.
Footnotes
Acknowledgements
The authors thank Mr Zhang Zixu in the National Research Center of Pumps and Pumping System Engineering and Technology of Jiangsu University who helped carry out experiments.
Declaration of conflicting interests
The author(s) declared no potential conflicts of interest with respect to the research, authorship, and/or publication of this article.
Funding
The author(s) disclosed receipt of the following financial support for the research, authorship, and/or publication of this article: This work was supported by National Key Research and Development Program of China (Grant No. 2016YFB0200901), the National Natural Science Foundation of China (Grant No. 51779108), Priority Academic Program Development of Jiangsu Higher Education Institutions (PAPD) and Six Talent Peaks Project in Jiangsu Province of China (Grant No. 2018-GDZB-154).