
Abstract
Over the few decades, there has been an exponential growth in the application of inflated torus system in the field of space deployable antenna design, solar propulsion, and aerodynamic deceleration system. However, such a system is inherently susceptible to mechanical vibration and hence requires precise modal analysis to produce stable inflatable structures. This paper summarizes all the necessary steps to be followed for dynamic analysis of inflatable structures. With this objective, a butyl rubber-based inflated torus system with dynamic material properties has been considered in this work. On performing mechanical tests of the rubber sample, properties like Prony series parameters, complex modulus, and damping values were obtained. Using laser Doppler vibrometry, the modal behavior of a butyl rubber-based air-inflated torus with free–free boundary condition was studied. The results achieved from experimental modal analysis and simulation involving fluid–structure interaction were found to be in close proximity. It is envisaged that the test template integrated with numerical validation can lay the foundation for designing complex inflatable torus structures.
Keywords
Introduction
The use of rubber dates back 1600 BC when pre-Columbian people of ancient Mesoamerica used it for playing ballgames owning to its large stretch ratio and high resilience. Also, ancient civilizations like Maya and Aztec dynasties used rubber for making containers and waterproof textiles. Harvesting of rubber is carried out in the form of latex extracted from many plant species such as Hevea brasiliensis, dandelion, Congo rubber, etc. The first scientific paper on rubber explaining its properties was published in 1755 by François Fresneau (1703–1770), a French botanist and scientist. 1 The onset of the industrial revolution and particularly the use of motor vehicles created high demand for rubber. Thus, in 1909, at Bayer laboratory, Germany, the first synthetic rubber isoprene was successfully polymerized, and since then, there has been a revolutionary development in the application of rubber. Some common hydrocarbon elastomers include natural rubber, styrene–butadiene rubber, butyl rubber, and ethylene propylene diene monomer. Figure 1 displays various hydrocarbon elastomers and relative comparison of their mechanical and chemical properties.
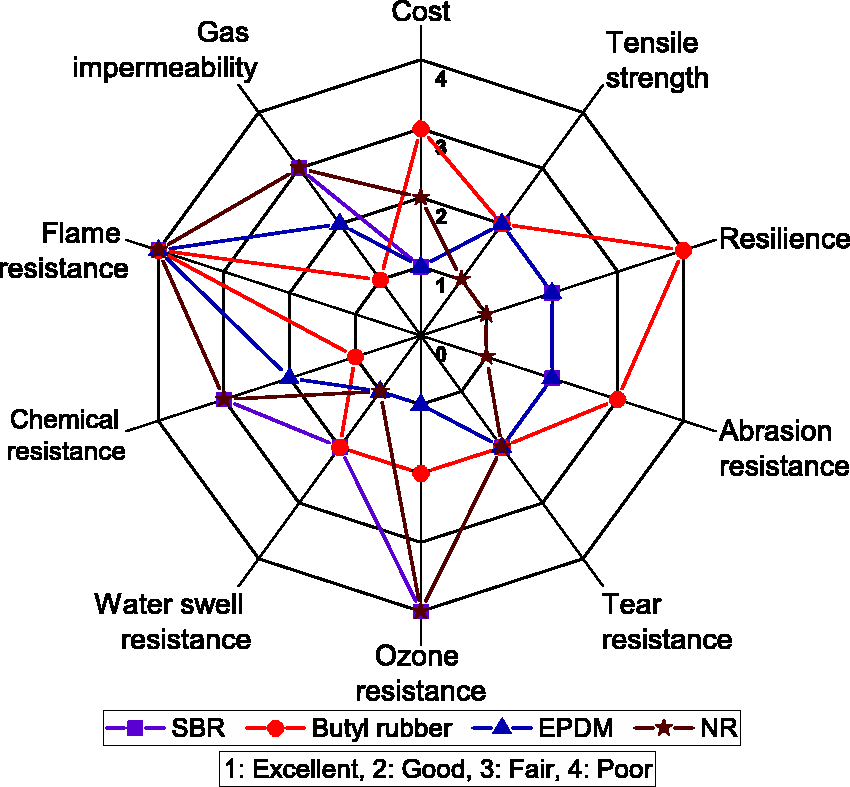
Comparison of relative properties of main hydrocarbon elastomers.
Concerning the characterization of viscoelastic properties of such elastomers, various kinds of experimental and simulation studies are being carried out around the globe.2,3 Some of the methods include determining a series of damped complex sinusoids named as Prony series parameters 4 by either using creep/stress relaxation data or by performing dynamic mechanical analysis (DMA) test. 5 Interestingly, researchers 6 point out the fact that for rubber-based products, material property is to be analyzed in conjunction with the structural application so that the mechanical design may inculcate excellent material properties.
In the current study, butyl rubber has been considered (also called as isobutylene–isoprene rubber), which is a synthetic rubber produced by cationic addition polymerization of about 98% of isobutylene with about 2% of isoprene as shown in Figure 2. The incorporation of isoprene enables the formation of double bonds allowing vulcanization and hence imparting more durability. It is highly valued for chemical inertness, aging stability, air retention, ozone resistance, and vibration dampening. Butyl rubber finds application in a variety of inflatable structures such as inflatable tubes, tubeless tires, and construction sealants.
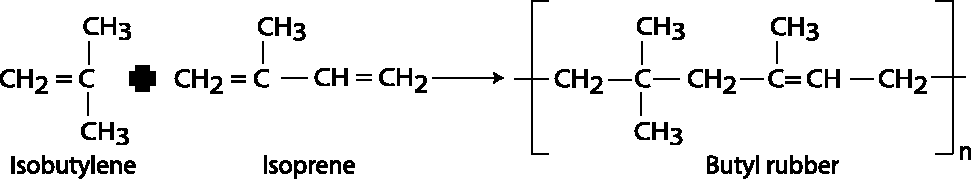
The process of butyl rubber polymerization.
Inflatables are in-grained robust due to their ability to absorb load over a large surface area. They can quickly adapt themselves to various curved surfaces without the requirement of ample constraints. The dynamics of inflatables assists in removing any surface distortion acting against a constant restoring inflation pressure. In addition to this, the smooth surface permits to diminish the thermal gradients effectively. Hence, inflatable structures are associated with properties like feather-weight, high strength-to-mass ratio, minimal stow volume, and immense packing efficiency added with low deployment cost. 7
In the field of inflatables, a toroidal configuration plays a crucial role. The toroidal shape is a critical element in providing structural support to various upcoming inflatable space structures such as large deployable communication antennas, solar thermal propulsion, and solar sails.8,9 Another approaching application of inflatable torus will be hypersonic inflatable aerodynamic decelerator 10 which is a kind of giant cone of assembled torus tubes to increase the load carrying capacity of spacecraft. The enhancement occurs due to the presence of internal pressure and double curvature which provides coupling between bending and stretching action enabling large load carrying capability. Thus, they have the potential to deliver the large payloads required for human-scale Mars missions. 11 Another variation is a multi-torus which is a pressurizable structure consisting of intersecting axisymmetric membrane elements equipped with reinforcements at the intersections to ensure structural integrity. The multi-torus finds its applications in blended-wing bodies, inflatable space habitats, and possibly as a cryogenic pressure tank for liquefied gases.12,13 However, inflatable space structures are more sensitive to vibration problems due to inherent low structural stiffness and material damping. It leads to degradation in the accuracy and precision of operation. Thus, it is required to actively constrain the action in space structures exerted by miniature actuators. Hence, the vibration modes of the structure should be accurately predicted to achieve better control. Therefore, free and forced vibration response of inflated torus is necessary to probe into the dynamic response. 14
The theoretical studies related to torus structures using linear membrane theory 15 started way back in 1940. Many investigators16–18 followed this work to achieve relatively accurate analysis using non-linear membrane theory. The natural frequencies and modes of vibrations of a pressure pre-stressed toroidal membrane were investigated numerically. It was demonstrated that prestress effects due to internal pressure affect only lower frequencies. 19 Another work on obtaining the closed-form solution for the natural frequencies and mode shapes of a prestressed toroidal as a first approximation of the free vibration response of a tire was explored. 20
Touching on practical applications of the inflatable torus, an inflatable antenna experiment by National Aeronautics and Space Administration was launched on May 19, 1966. The mylar-made antenna was properly inflated and re-entered earth’s atmosphere three days later. This experiment motivated the researchers and industries for the development of lightweight inflatable structures for space applications. The ground-based experimental studies on torus structure were carried out by many researchers using different combination of actuators and sensors such as electromagnetic shaker and PVDF patch, 21 impact hammer and accelerometer, 22 loudspeaker and laser sensor, 23 electromagnetic shaker and macro-fiber composite patch, 24 etc., respectively. Later on, the free vibration analysis of torus using Galerkin method was performed to demonstrate the importance of geometric non-linearity and the direct action of pressure force on the torus, by comparing the results from different approximate shell theories. 25 In addition to this, the integration of smart materials into the dynamics and control of inflatable space structures was also demonstrated. 26 A literature review by the author 27 described many analytical as well as experimental studies related to the dynamic response of an inflated torus. Simulation studies were executed to investigate the nonlinear vibrations of an inflated toroidal membrane by finite element method 28 in ANSYS with fluid–structure interaction and assuming material to be elastic. 29
Studies were performed to explore the finite inflation of a (Mooney–Rivlin) hyperelastic toroidal membrane of initially circular cross-section under internal pressure. 30 The analysis included the effect of material parameters on inflation pressure and the equilibrium configuration of the membrane. Also, a Ritz-based discretization scheme using an iterative Lagrangian perturbation was proposed for solving the inflation problem of a toroidal membrane. 31 Researchers32,33 have investigated the response of two flat annular hyperelastic membranes stacked and bonded at boundaries acted by a radial line load at the inner equator of the torus. The Mooney–Rivlin and Gent hyperelastic material models were used under two different inflation conditions namely constant pressure and constant volume of gas. The authors 34 explored the mechanics of an inflatable reflector model consisting of a toroidal outer rim and a set of bonded circular membranes which were initially pre-stretched and then inflated under uniform internal pressure. The inflation problem was solved to determine the inflated shapes and the possible occurrence of wrinkling instability of the reflector. It was observed that the lower inflation pressure of the reflector resulted in a better parabolic approximation of the reflecting surface. The recent studies 35 concentrated on symmetry breaking during inflation of a flat toroidal membrane using a perturbative approach. It was concluded that at low inflation pressure, the symmetric shape was stable, but above critical inflation level, a supercritical pitchfork bifurcation leads to the spontaneous breaking of axisymmetry of the torus.
The present work probes into the modal analysis of an air inflatable butyl rubber torus tube. The methodology involved in the study includes mechanical testing of butyl rubber sample followed by modal testing of a torus structure and simulation of the same. The current paper is organized as follows. It begins with a discussion about various mechanical tests conducted on rubber sample such as tensile test, stress-relaxation test, and DMA test to extract relevant information about the material response (both elastic and viscoelastic) to the applied load. A description succeeds this about the experimental configuration of the modal test performed on an air-inflated torus. Then, results obtained from the preliminary test are compared with the finite element simulations followed by discussion. Finally, the conclusions are inferred. The sequence of steps used in the current study along with their significance are summarized in Figure 3.
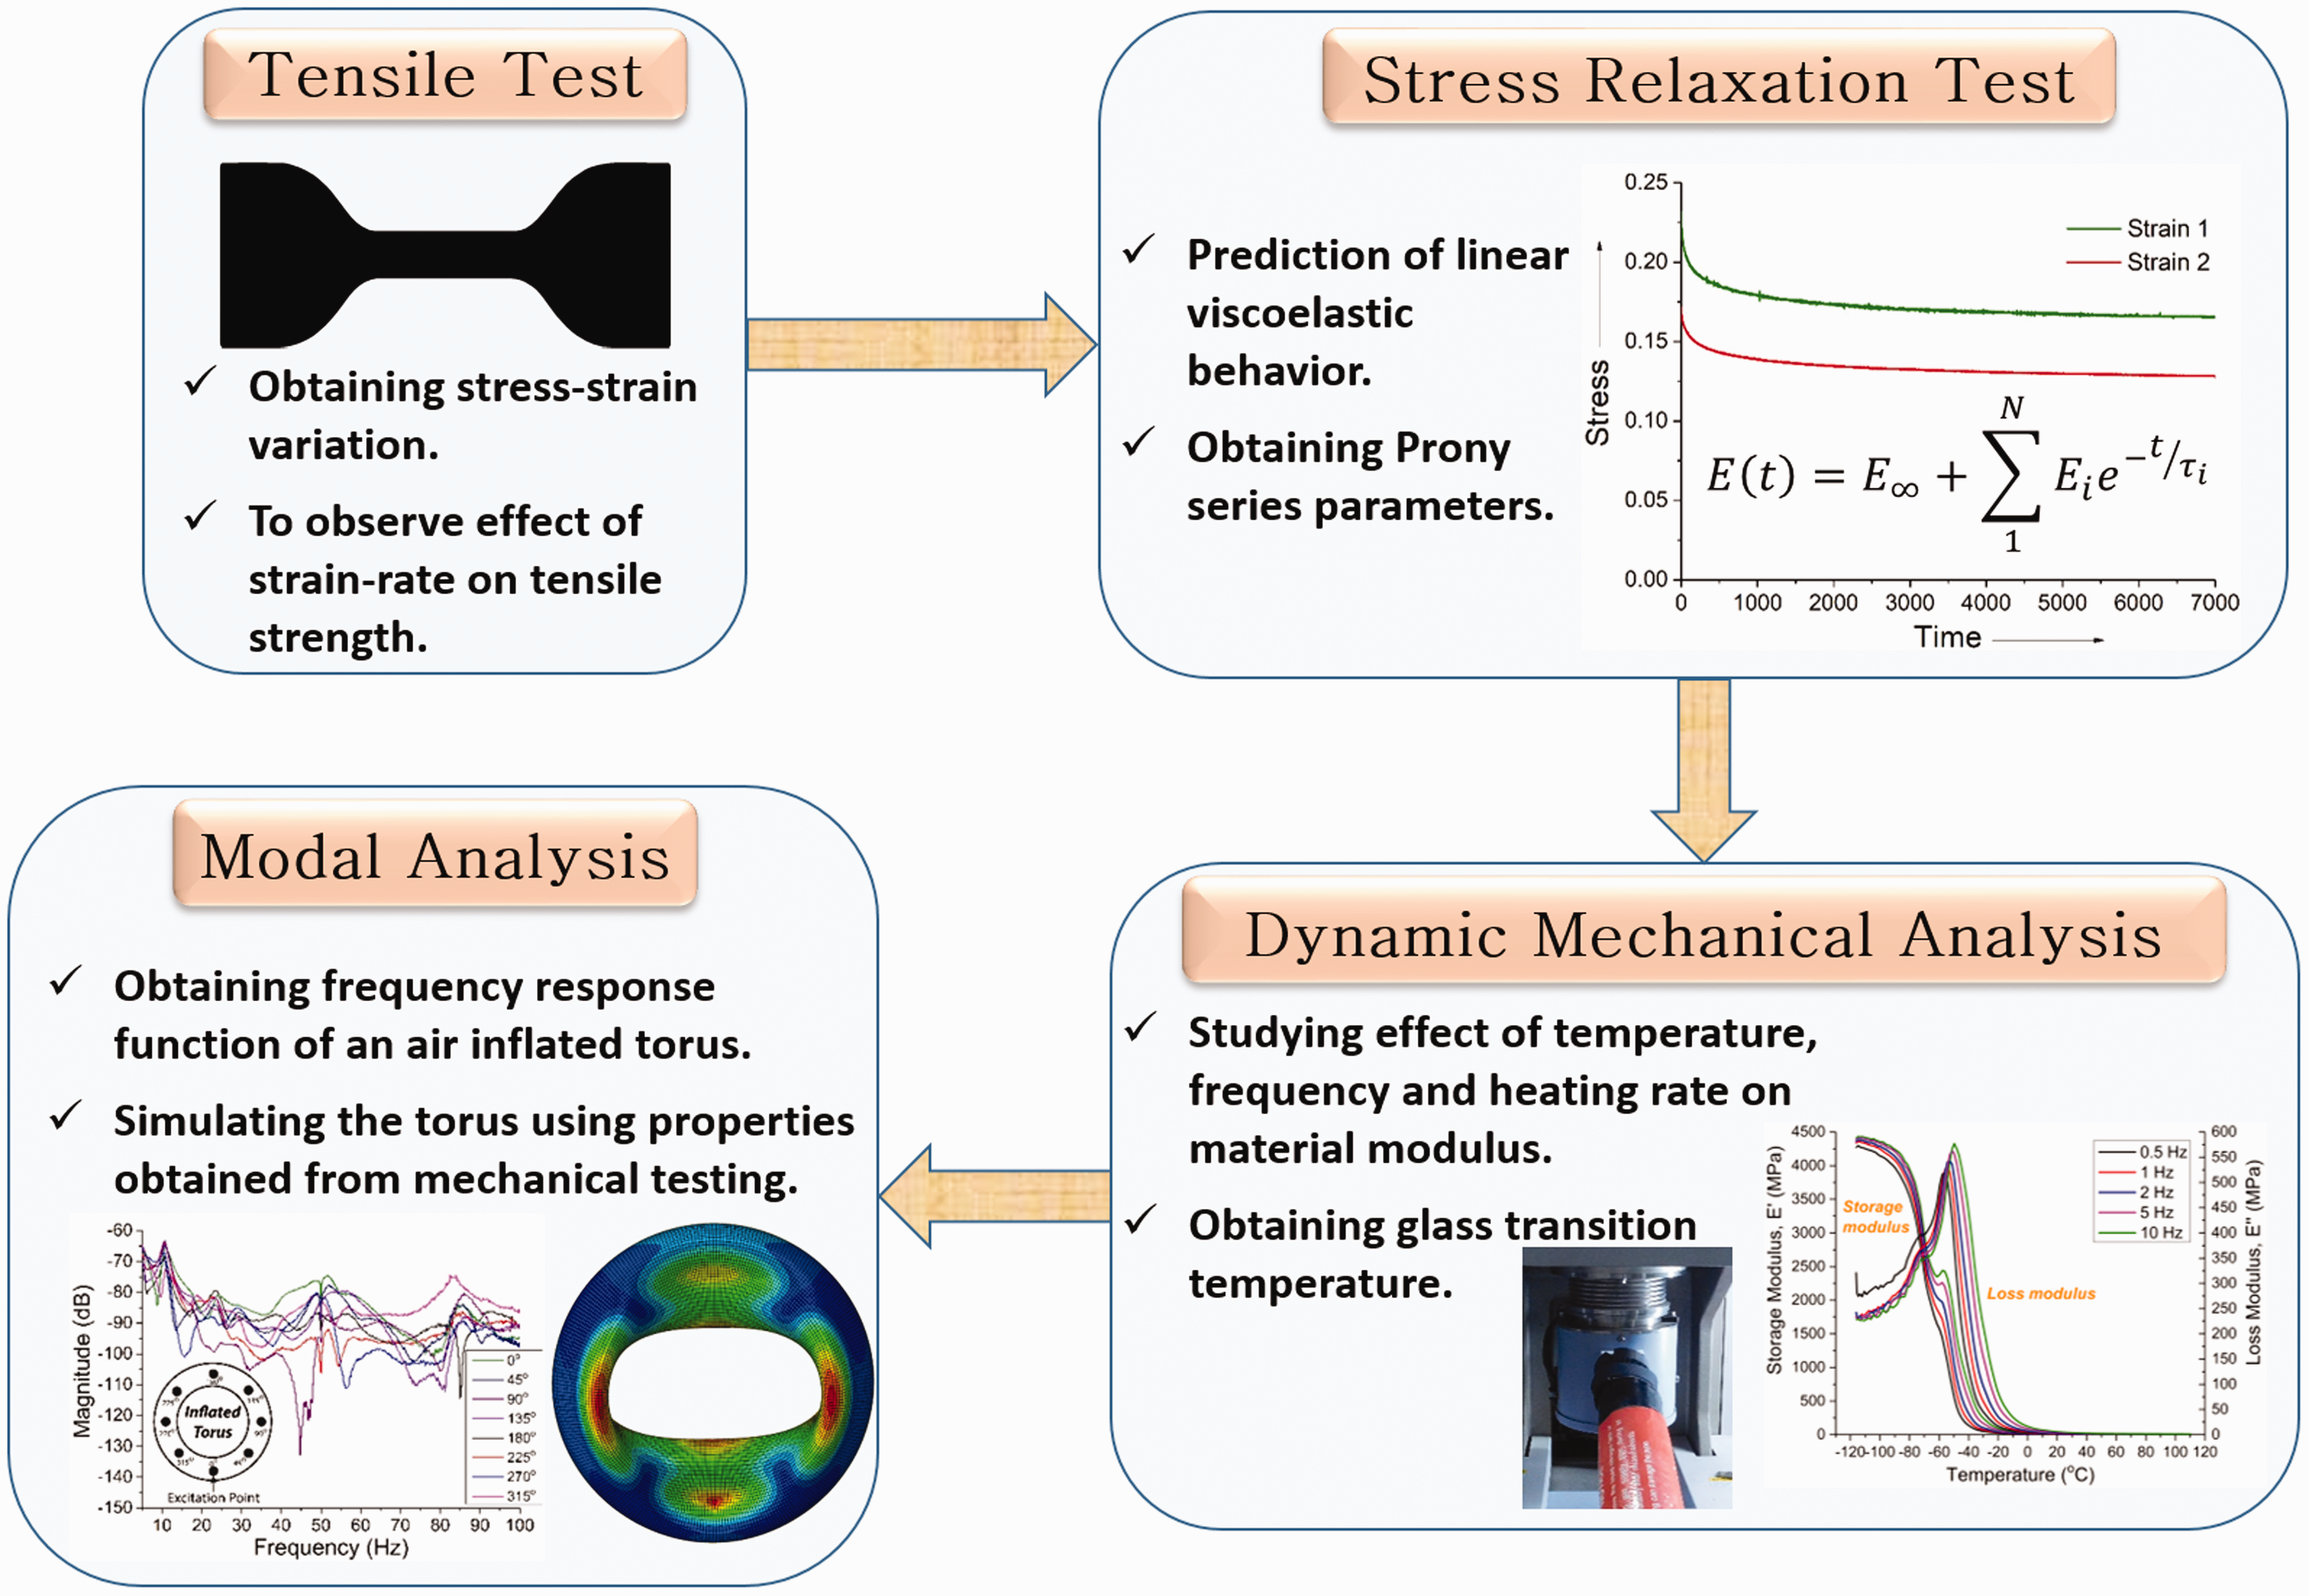
Summary of steps involved in the study along with the significance of each step.
Mechanical testing
The butyl rubber specimen was subjected to various mechanical tests to obtain relevant data about material behavior as explained in the following sub-sections.
Tensile test
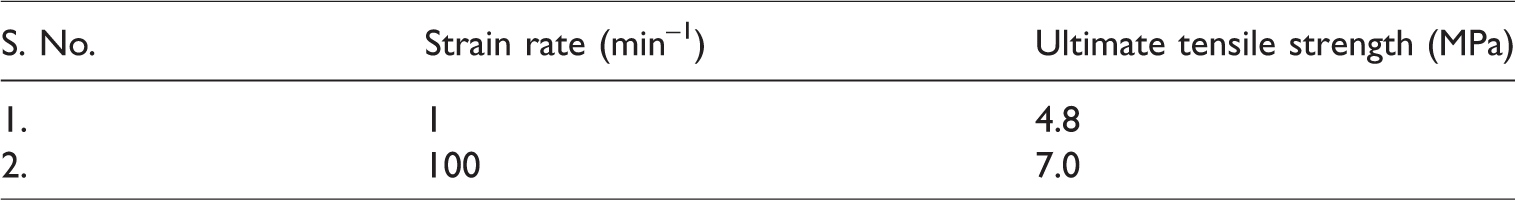
The tensile test was conducted at room temperature on Tinius Olsen universal testing machine at two strain rates namely: 1 and 100 min–1 as per ASTM D412. This test was performed to study the effect of strain rate on the tensile strength and to observe the stress–strain behavior. The total length of the test specimen was 115 mm, width 25 mm, and of thickness 2.25 mm as shown in Figure 4. The test was repeated five times each with a fresh sample for both strain rates. It was observed that tensile strength heightened with an increase in the strain rate, as shown in Figure 5. This occurred because a lower strain rate favors the viscous or energy-damping aspects of material behavior, while a relatively high strain rate occurring over a short period tends to support the elastic properties of the material. Thus, a higher strain rate and lower temperature have the same effect, while higher temperature and lower strain rate displayed the reverse effect. The mean tensile strength data has been tabulated in Table 1 with a standard deviation of 0.23 and 0.32 corresponding to the strain rate of 1 and 100 min–1, respectively. The obtained data lies in the range for butyl rubbers. 36
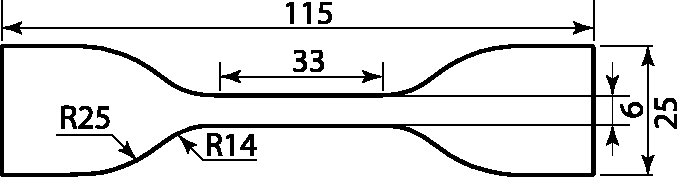
Tensile test specimen (all dimensions in mm).
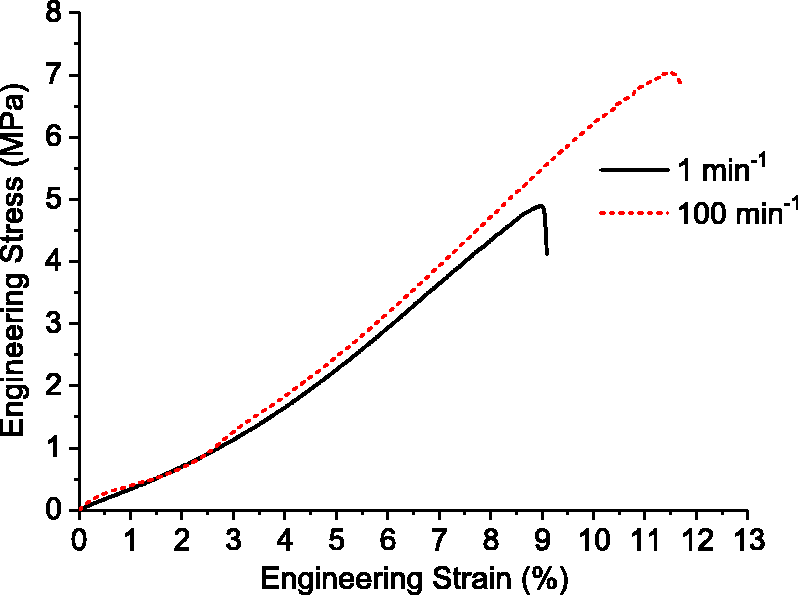
Engineering stress-strain curve for butyl rubber specimen at different strain rates.
Variation of tensile strength with increase in strain rate.
Stress-relaxation test
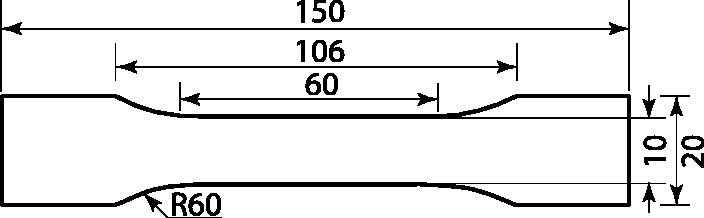
The stress-relaxation behavior of the butyl rubber specimen at room temperature was studied at a pre-strain of 20 and 50% by recording the gradual fall in stress value for a prolonged period of exposure. The slope of the curve defines the stress-relaxation rate at any point. The total length of the test specimen was 150 mm, width 20 mm, and of thickness 2.25 mm as shown in Figure 6. The test was performed five times each with an untainted sample at both pre-strains as per ASTM E328.
Stress relaxation test specimen (all dimensions in mm).
Figure 7(a) shows the relaxation curves obtained by considering the mean value of stress decay. Next, the elastic relaxation modulus was calculated by dividing the time-varying stress with a constant pre-strain as shown in Figure 7(b).
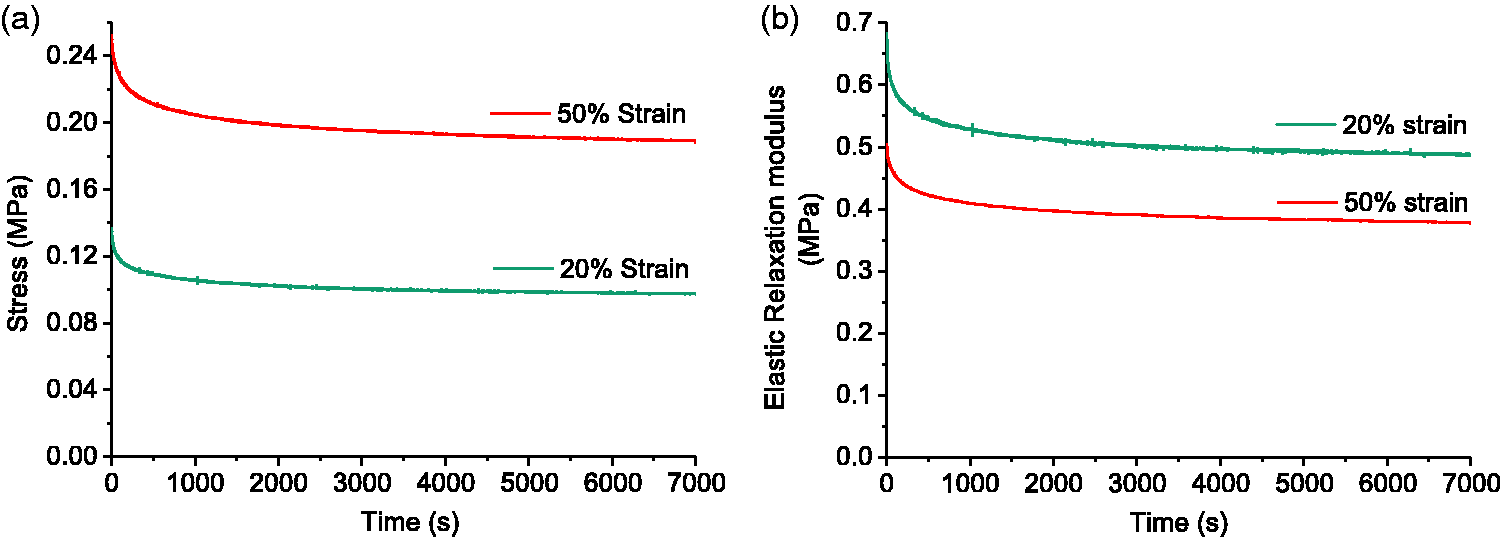
Stress relaxation test results at pre-strain values of 20 and 50%. (a) Variation of stress with time at different pre-strain values; (b) variation of elastic relaxation modulus with time at different pre-strain values.
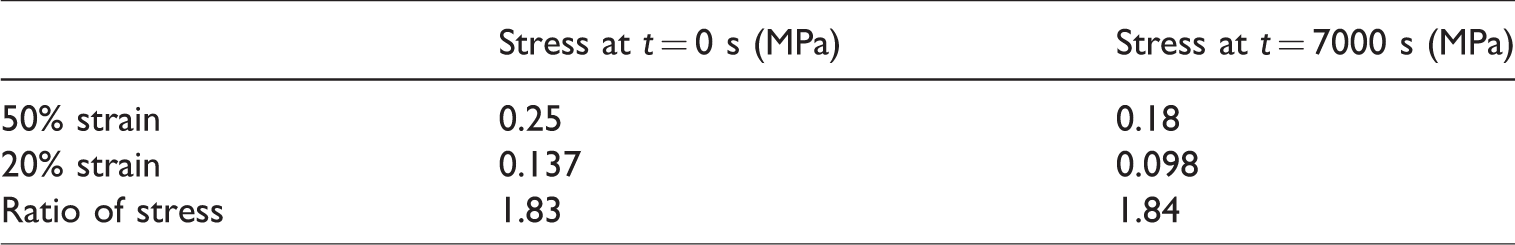
Table 2 shows that the ratio of stress corresponding to two pre-strain values at t = 0 and t = 7000 s lies in close proximity confirming the linear viscoelastic behavior under relatively low-stress conditions.
Stress relaxation curve data confirming linear viscoelastic behavior.
Generalised Maxwell model (Prony series)
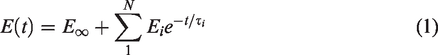
The inclusion of viscoelasticity requires the integration of a time effect into the model. The most critical time effect is the relaxation phenomenon in which reduction in material stiffness occurs during the loading period and is displayed nearly by all polymers. The most popular mathematical form of this behavior can be modelled by Prony series given by equation (1) as
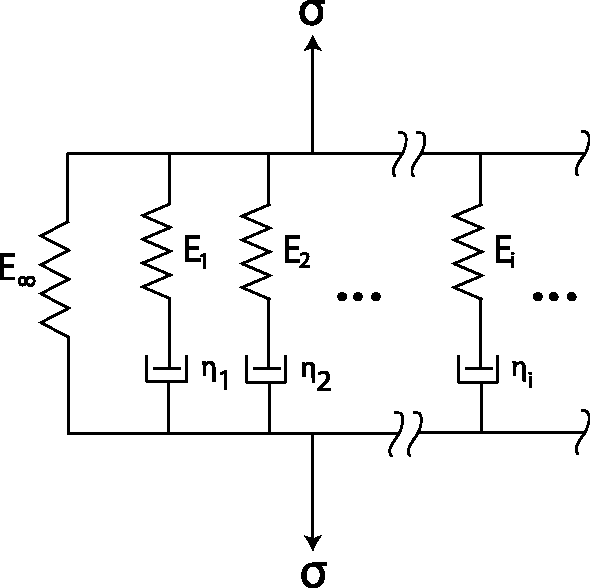
Configuration of generalized Maxwell rheological model.
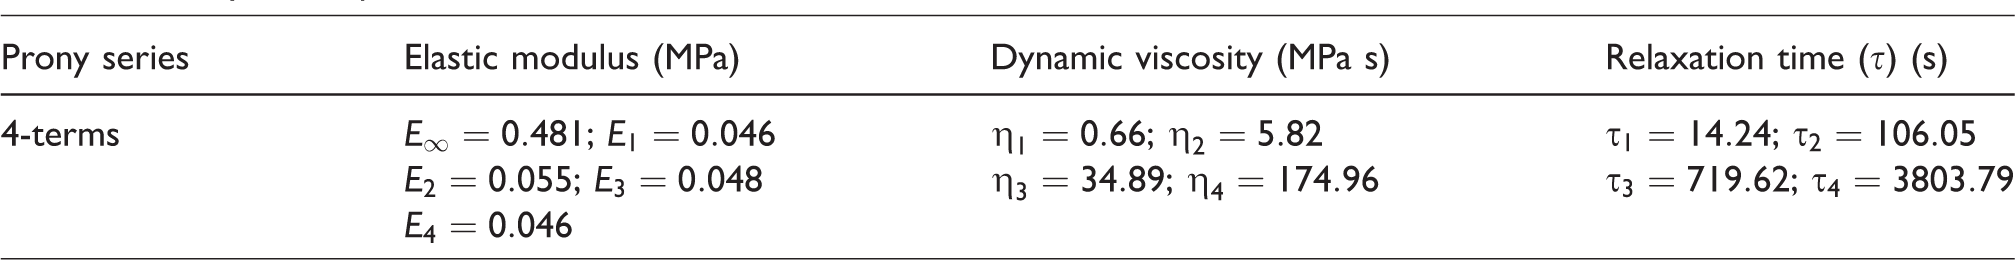
It can be observed from Figure 9(a) that after N = 3, the plot begins to converge such that the error between experimental and predicted curves gradually diminished (Figure 9(b)). The relevant parameters obtained after error minimization corresponding to the 4-term Prony series are tabulated in Table 3.
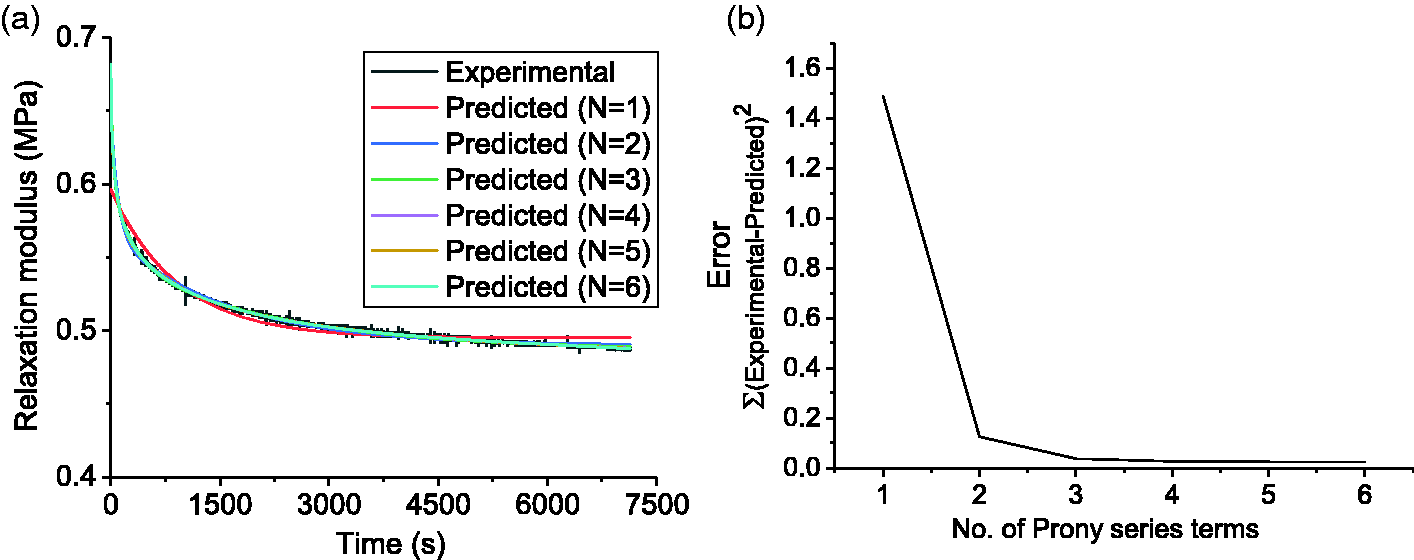
Experimental and predicted relaxation modulus curves followed by error minimization plot for Prony series terms. (a) Comparison of experimental and predicted relaxation modulus curves obtained from stress relaxation test (20% strain) for generalized Maxwell model; (b) error convergence plot for Prony series terms.
Prony series parameters obtained after error minimization.
Dynamic mechanical analysis test
In this test, an oscillating force is applied to the sample. and response to the same is studied. From the material response to the input force, a complex modulus (E*) is calculated which consists of two parts namely a real part (storage modulus,
This can be represented as
Experimental configuration of DMA test
To study the viscoelastic behavior of the butyl rubber, DMA (PerkinElmer, Pyris Diamond DMA (e7)) instrument was employed as shown in Figure 10. The sample dimension was 40 mm × 10 mm × 2.25 mm. The test was performed in tension mode at frequencies of 0.5, 1, 2, 5, and 10 Hz and at a strain amplitude of 5 mm under a nitrogen atmosphere (flow rate of 200 ml/min) and temperature range of –110 to 100°C. A dynamic displacement of 5 mm was applied to the sample. The test was performed four times, each with fresh samples, and the mean data was obtained. The test was conducted abiding the ASTM D4065.
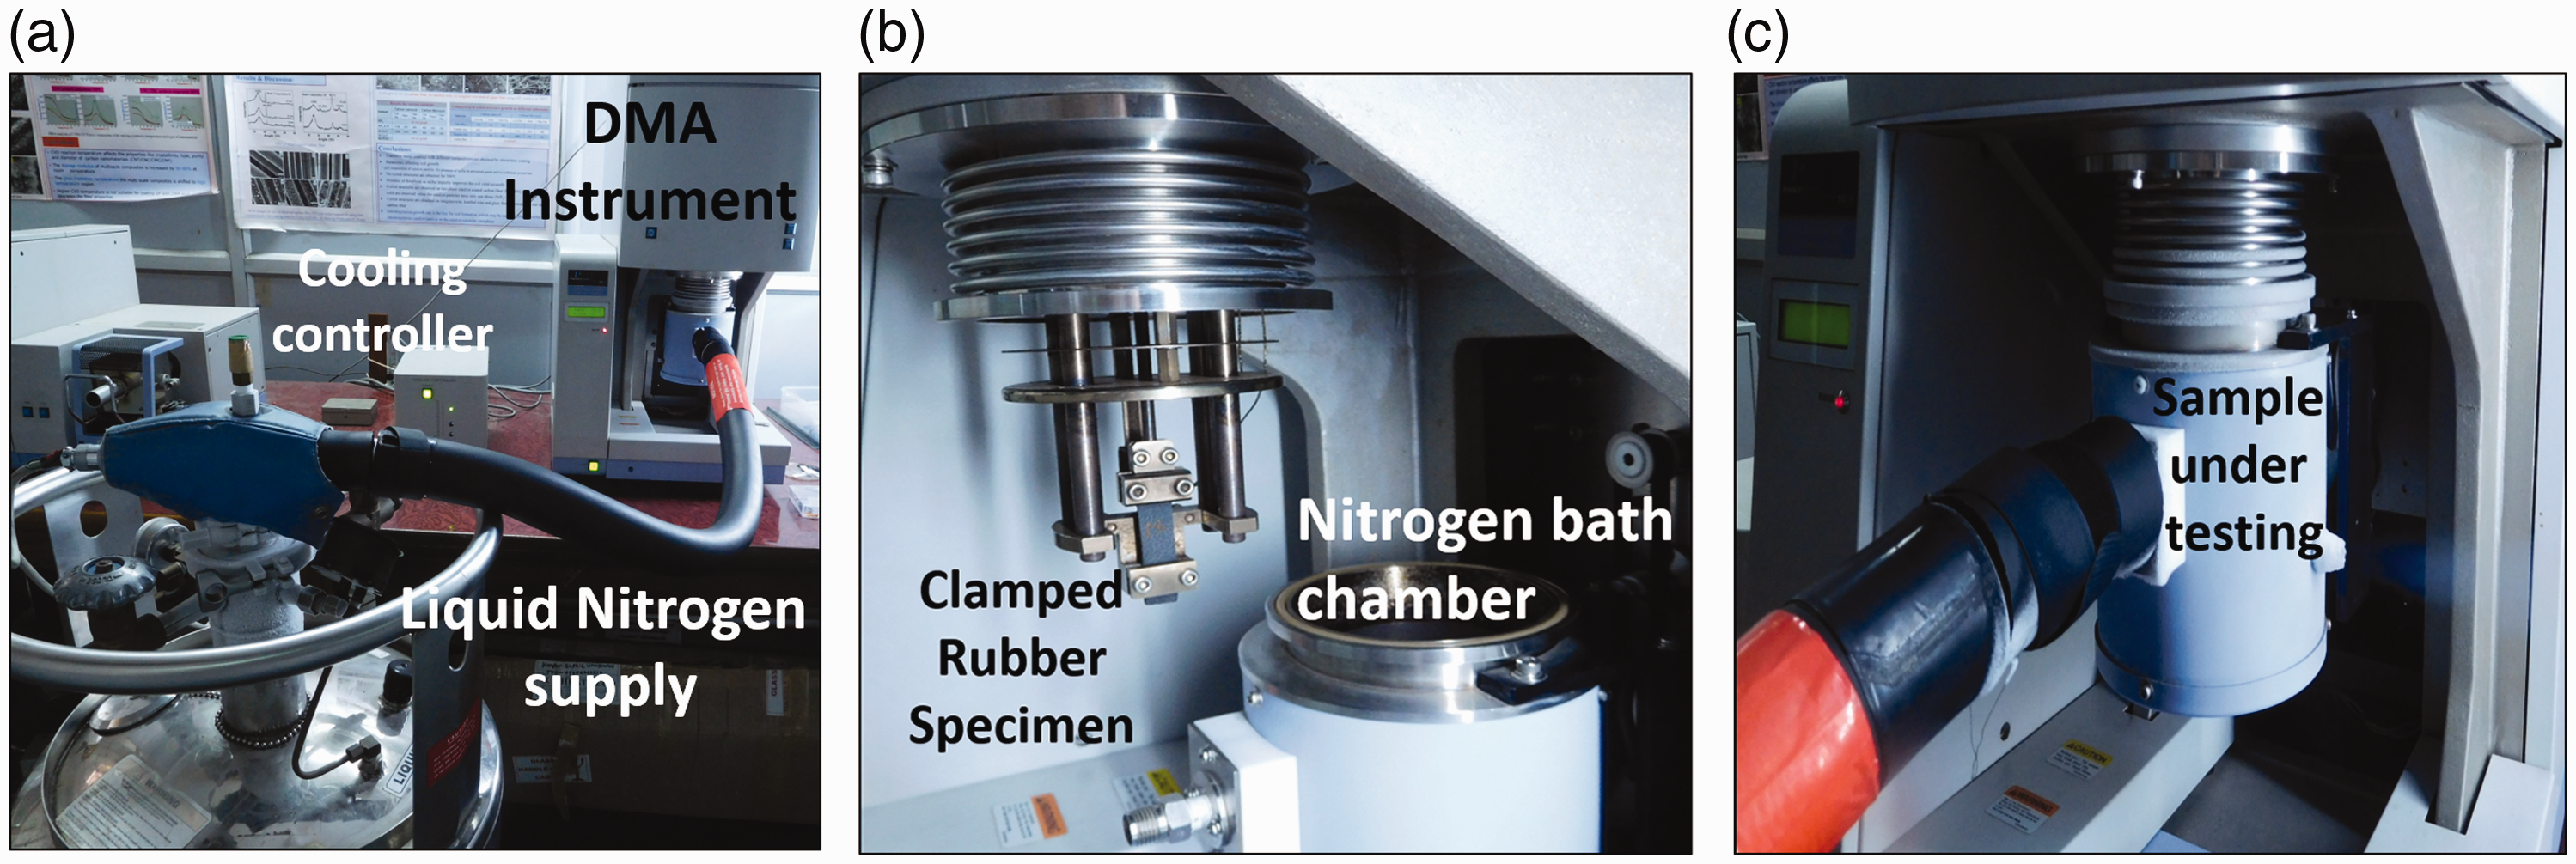
Dynamic mechanical analysis test set-up. (a) DMA instrument along with accessories; (b) clamped rubber specimen before placing inside nitrogen bath chamber and (c) specimen under testing in a controlled atmosphere.
Dynamic mechanical analysis test results
Figure 11 shows that on heating, a sudden decrease in storage modulus was observed as a result of physical softening. As the temperature continued to rise, molecular friction gets reduced, and less energy was dissipated leading to declining loss modulus. This decrease in loss modulus resulted in a peak in loss modulus (glass transition temperature, Tg) due to the agitation of molecular segmental motions. The glass transition temperature is unique because it represents a transition in molecular response revealing a change in the properties of the sample. Beyond Tg, the material undergoes a transition from glassy to leathery to further rubbery phase.
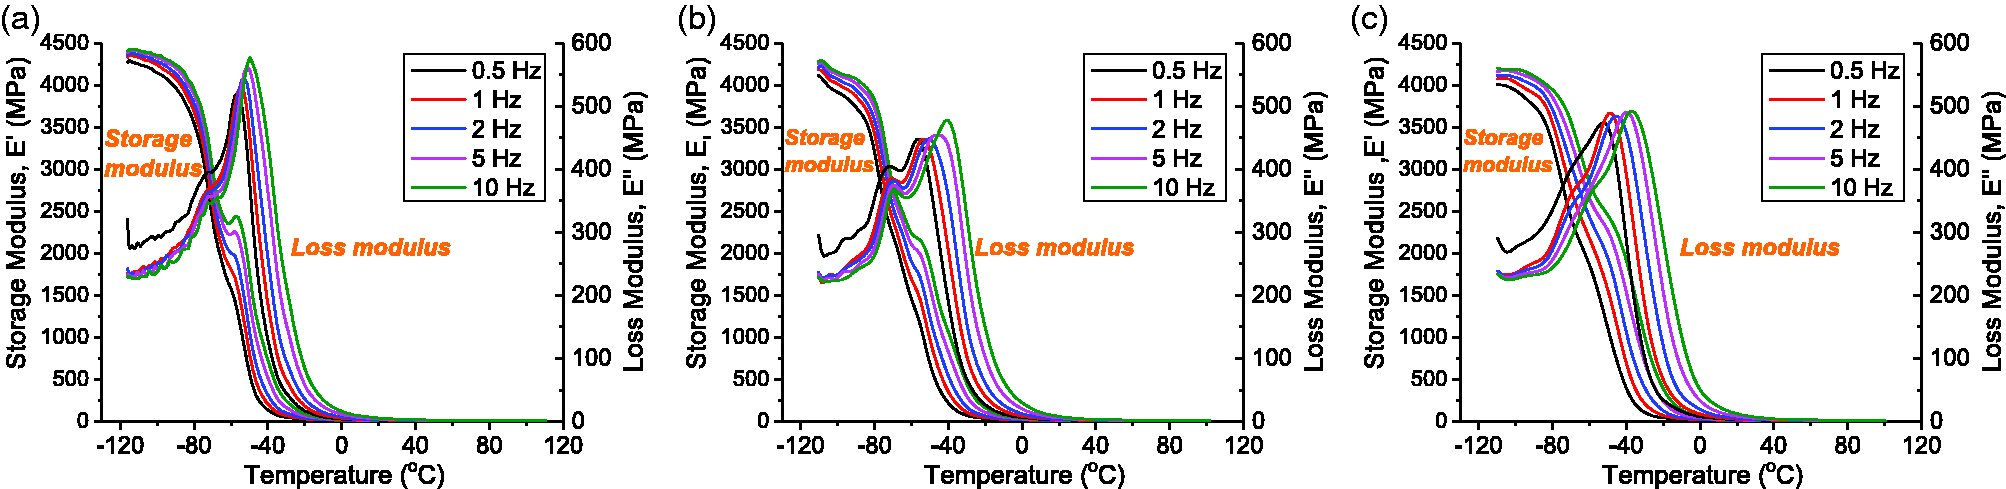
Variation of storage and loss modulus with change in temperature at different frequencies. (a) Heating rate: 2°C/min; (b) heating rate: 5°C/min; (c) heating rate: 10°C/min.
It is known that high frequencies are analogous to short times while low frequencies to long times. Since the glass transition is a kinetic transition, it is strongly influenced by the frequency of testing. This means that the molecular relaxation occurs due to cooperative segmental motion, and its rate depends on temperature. Thus, an increase in test frequency causes the molecular relaxations to occur at higher temperatures, and, as a result, the Tg increased along with increasing frequency as shown in Figure 12. Hence, at high frequency, molecular mobility was decreased, the material attained brittleness, and the glass transition shifted to a higher temperature.
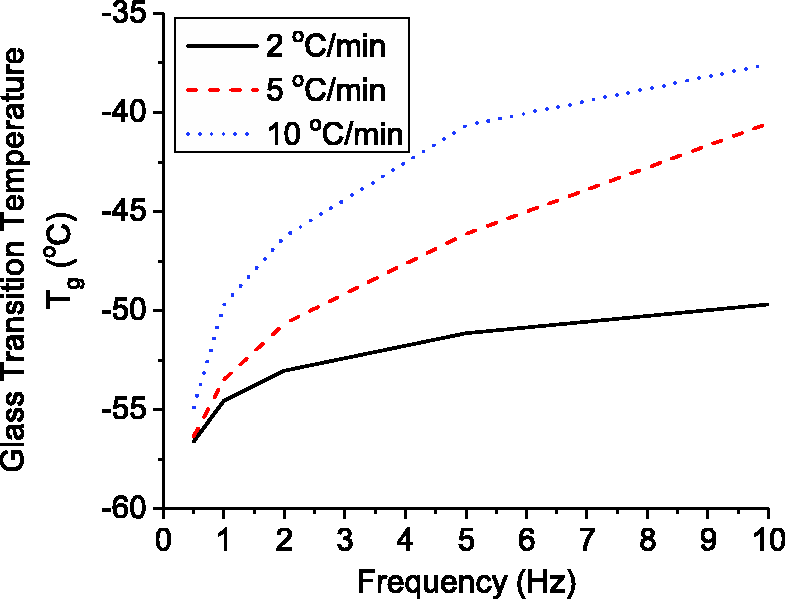
Glass transition temperature variation with frequency at different heating rate.
Figure 13 shows a frequency scan displaying the change in rubber behavior as frequency varies at room temperature. Low frequencies allowed the material to relax and respond resulting in viscosity domination. On the other hand, high frequencies did not allow sufficient time to relax hence, elastic behavior dominated.
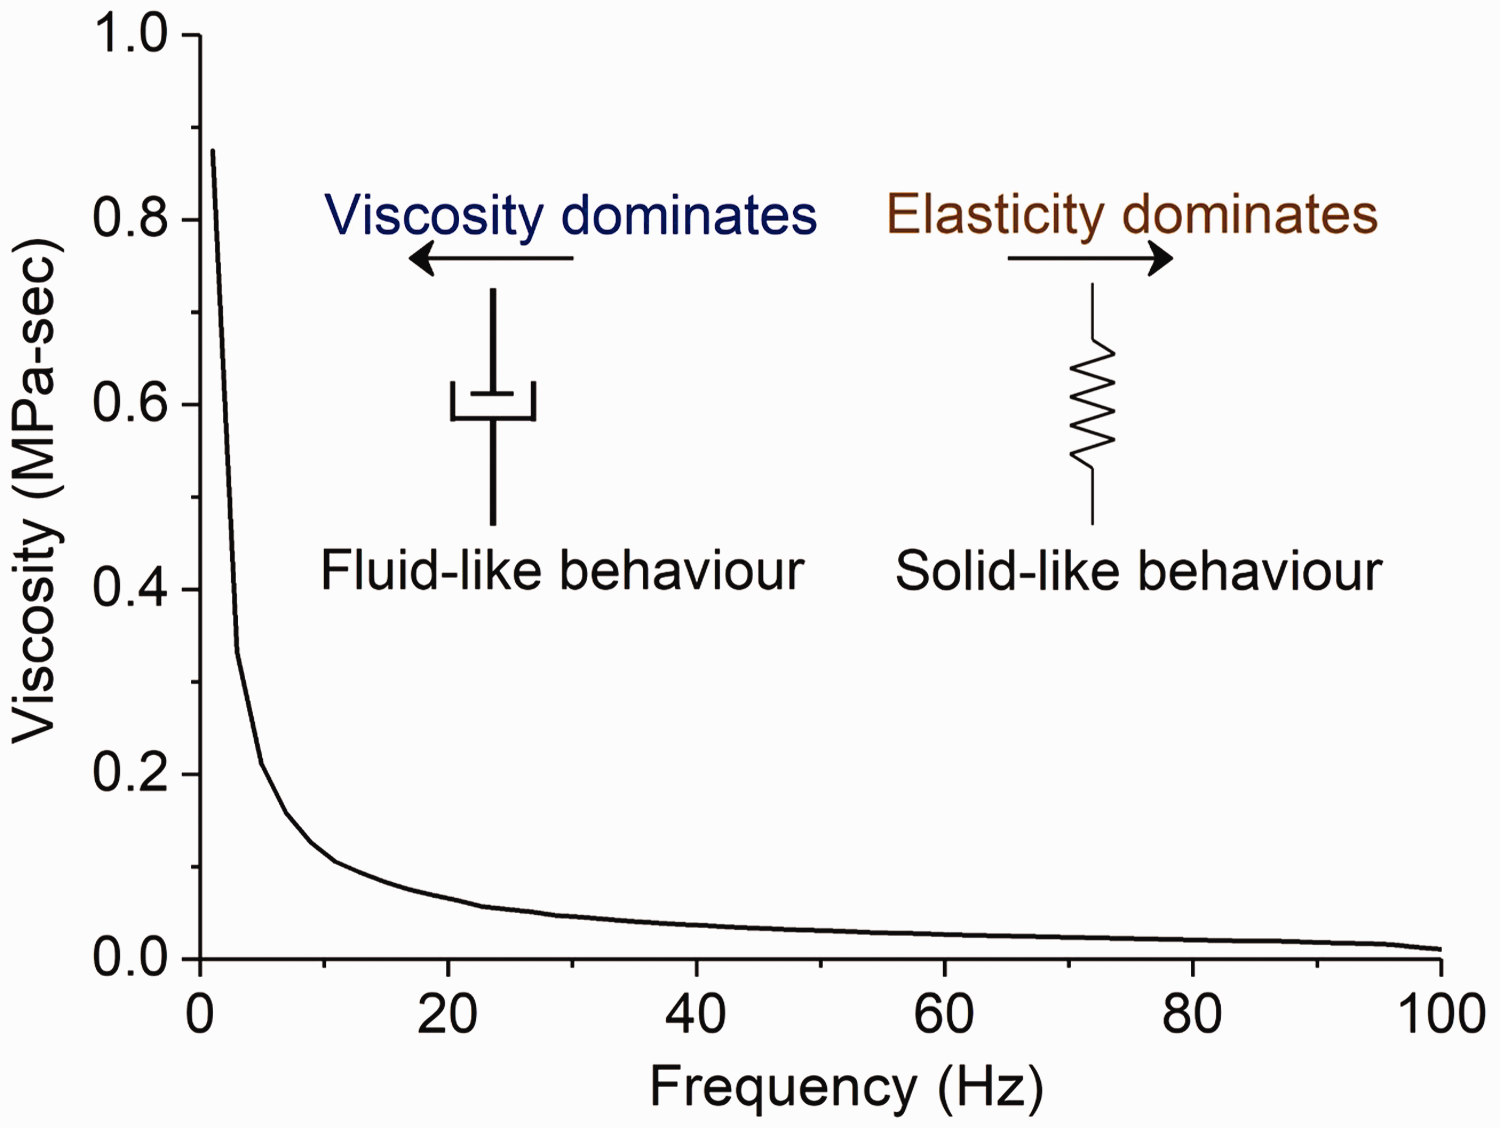
Viscoelastic behavior of butyl rubber sample over a range of frequencies at room temperature.
Experimental configuration for modal test on an inflated torus
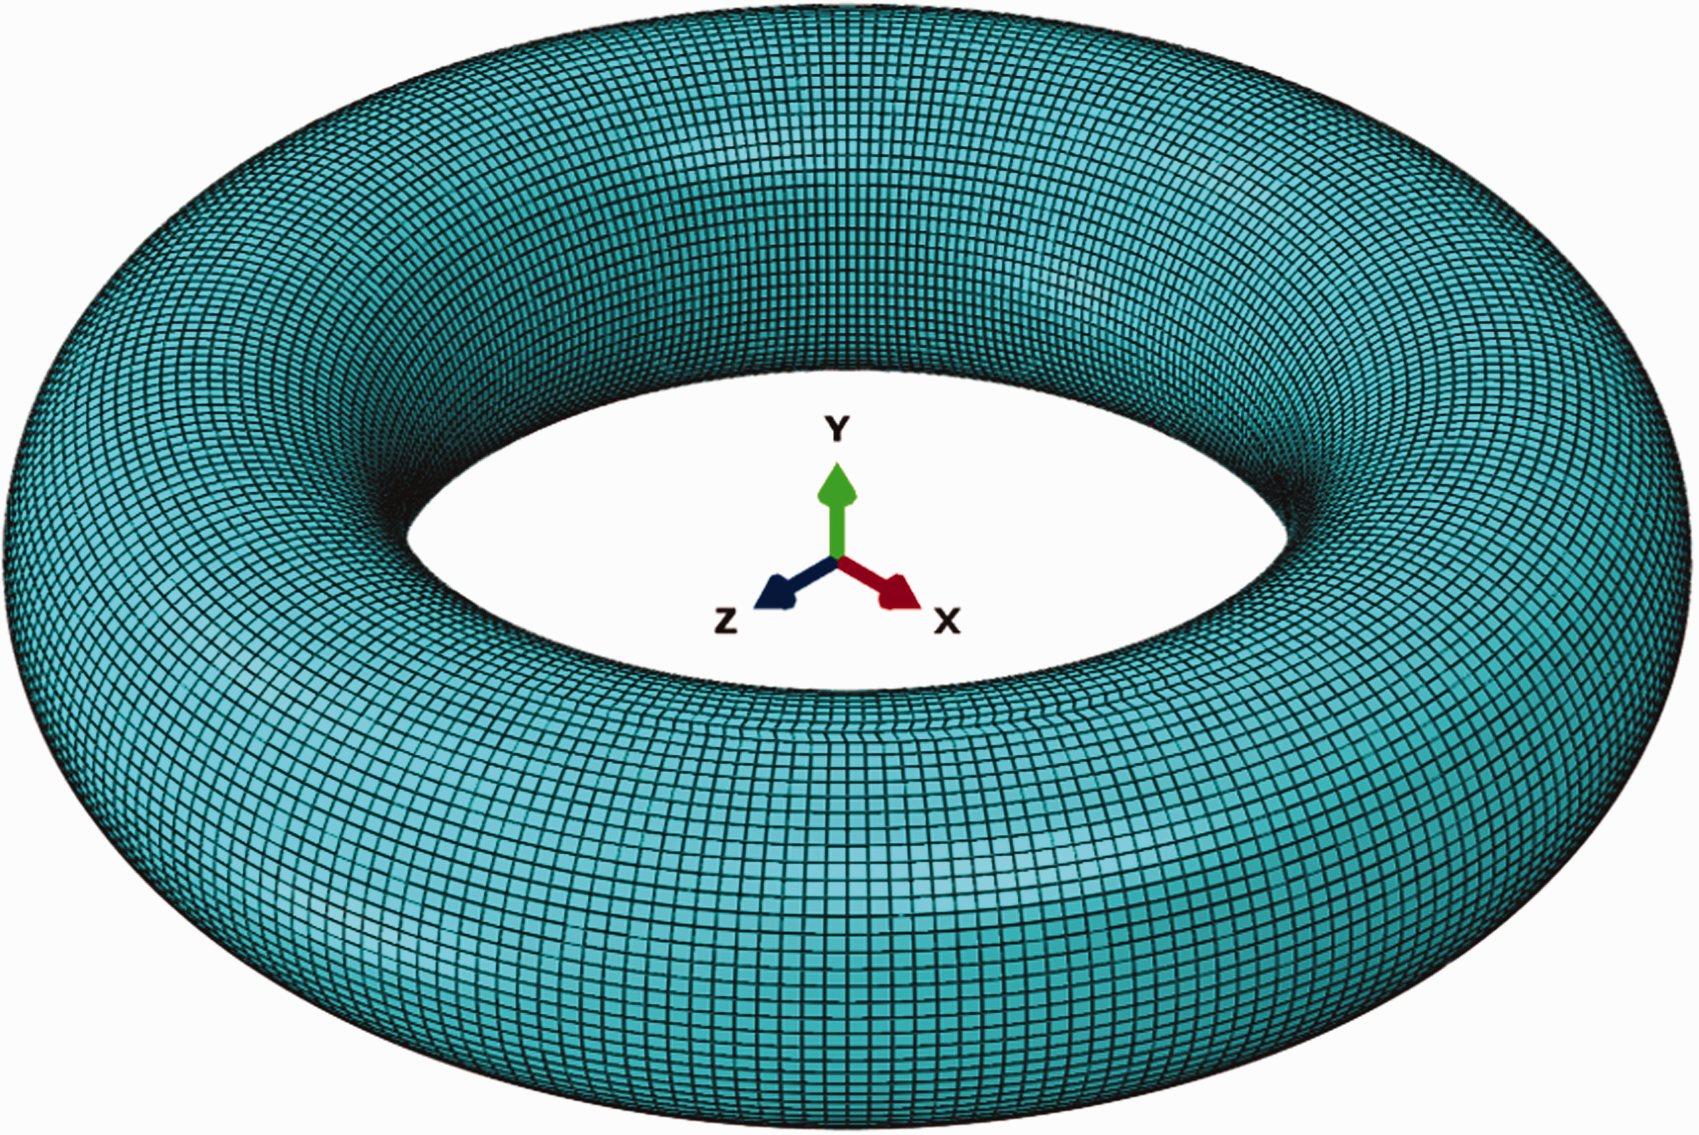
The test structure under investigation was a butyl rubber-based torus under internal air pressure of 9 KPa with a tube diameter (d = 260 mm), mean ring diameter (D = 840 mm), thickness 2.25 mm, and an aspect ratio of 0.31 as shown in Figure 14(a). The torus was suspended by a light elastic string to avoid the influence of rigid body modes on the frequency range of interest (5–100 Hz) and to experimentally simulate the free–free boundary condition as depicted from Figure 14(b). The total weight of the torus was 4 kg and having an area density of 1.86 kg/m2.
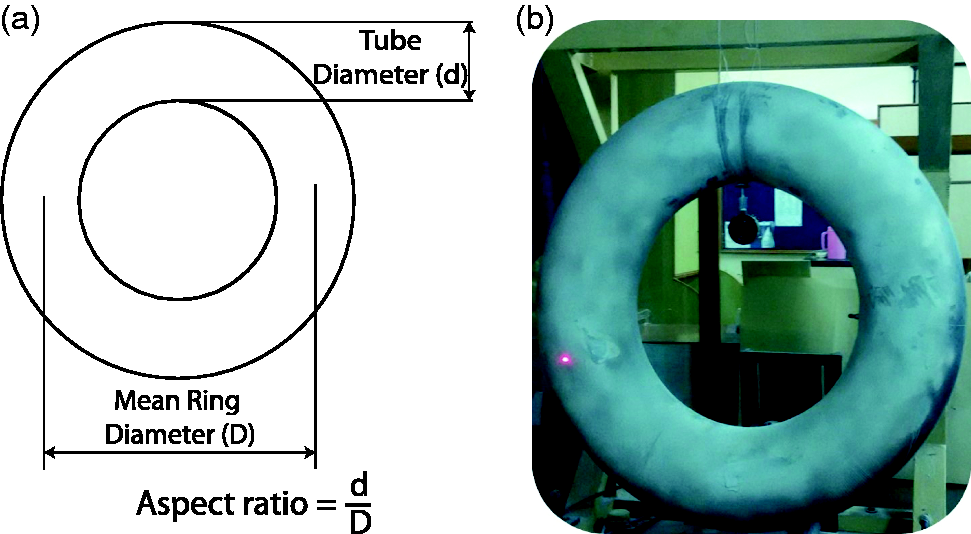
Configuration of an air-inflatable torus. (a) Schematic of torus defining the aspect ratio; (b) inflatable torus suspended by an elastic string to simulate free-free boundary condition.
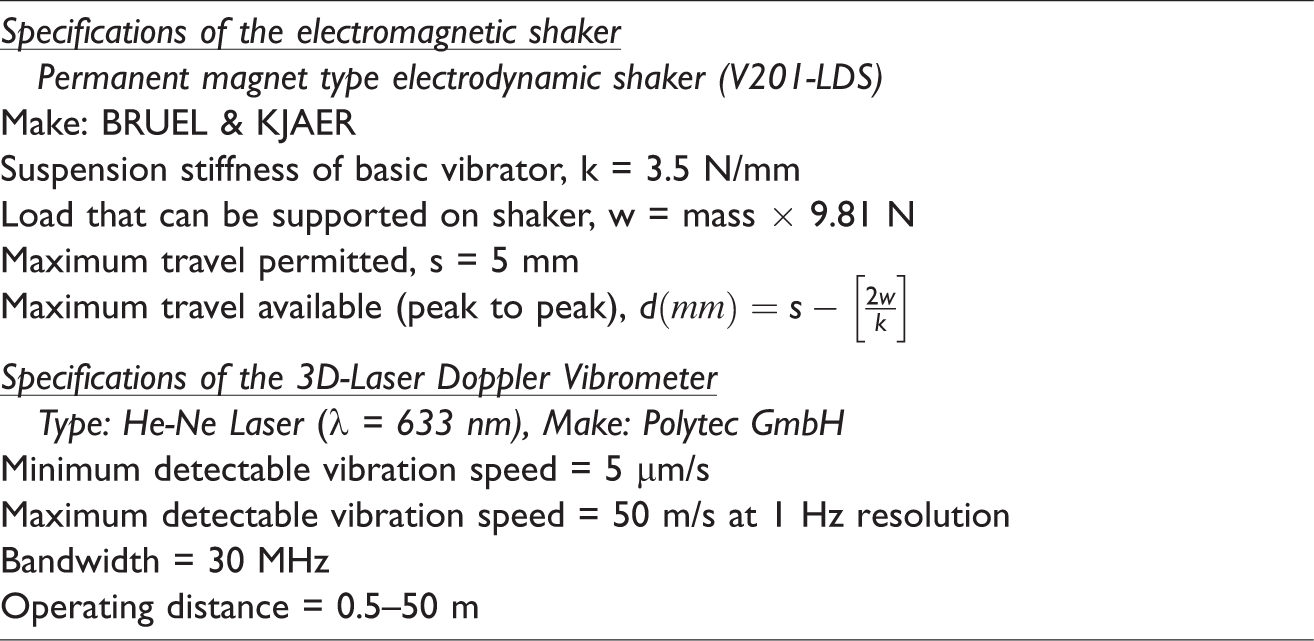
The test set up for experimental modal analysis of an inflated torus is schematically illustrated in Figure 15. The pseudorandom signal was selected to excite the test structure due to its characteristics such as high signal-to-noise ratio, minimal leakage, short test measurement time, and controlled frequency content. The excitation signal generated by a function generator (PCI-6111) was amplified using a power amplifier (Model: PA25E-CE, Make: BRUEL & KJAER). The pre-amplified signal then fed into the permanent magnet type shaker (LDS-V201) to actuate the torus (Table 4). A single shaft of metal was attached on the shaker with a force transducer (Model: 11, Make: Honeywell) at shaft tip to have a unidirectional point excitation such that the interference between the shaker and the torus gets minimized. The force transducer was glued to the torus to ensure the proper transmission of the input signal to the test structure. The dynamic response was measured using a 3D-laser Doppler vibrometer (Model: PSV-400, Make: Polytec) based on the principle of Doppler effect. It quickly records the frequency shift of light scattered back from a moving surface causing the generation of an analog voltage signal proportional to the vibration velocity (see ‘Specifications of the 3D-laser Doppler vibrometer’ section in Table 4). A thin layer of a developer (PMC Flawcheck, PD-31B) was spattered over the torus surface to reflect the incident laser beam from the assigned response points as shown in Figure 16. The interferometer signal was decoded in the controller using the velocity decoder. 38 Finally, the data was digitally recorded in the workstation for post-processing. A set of 10 repeated measurements were made under similar conditions and were averaged to estimate frequency response functions (FRFs).
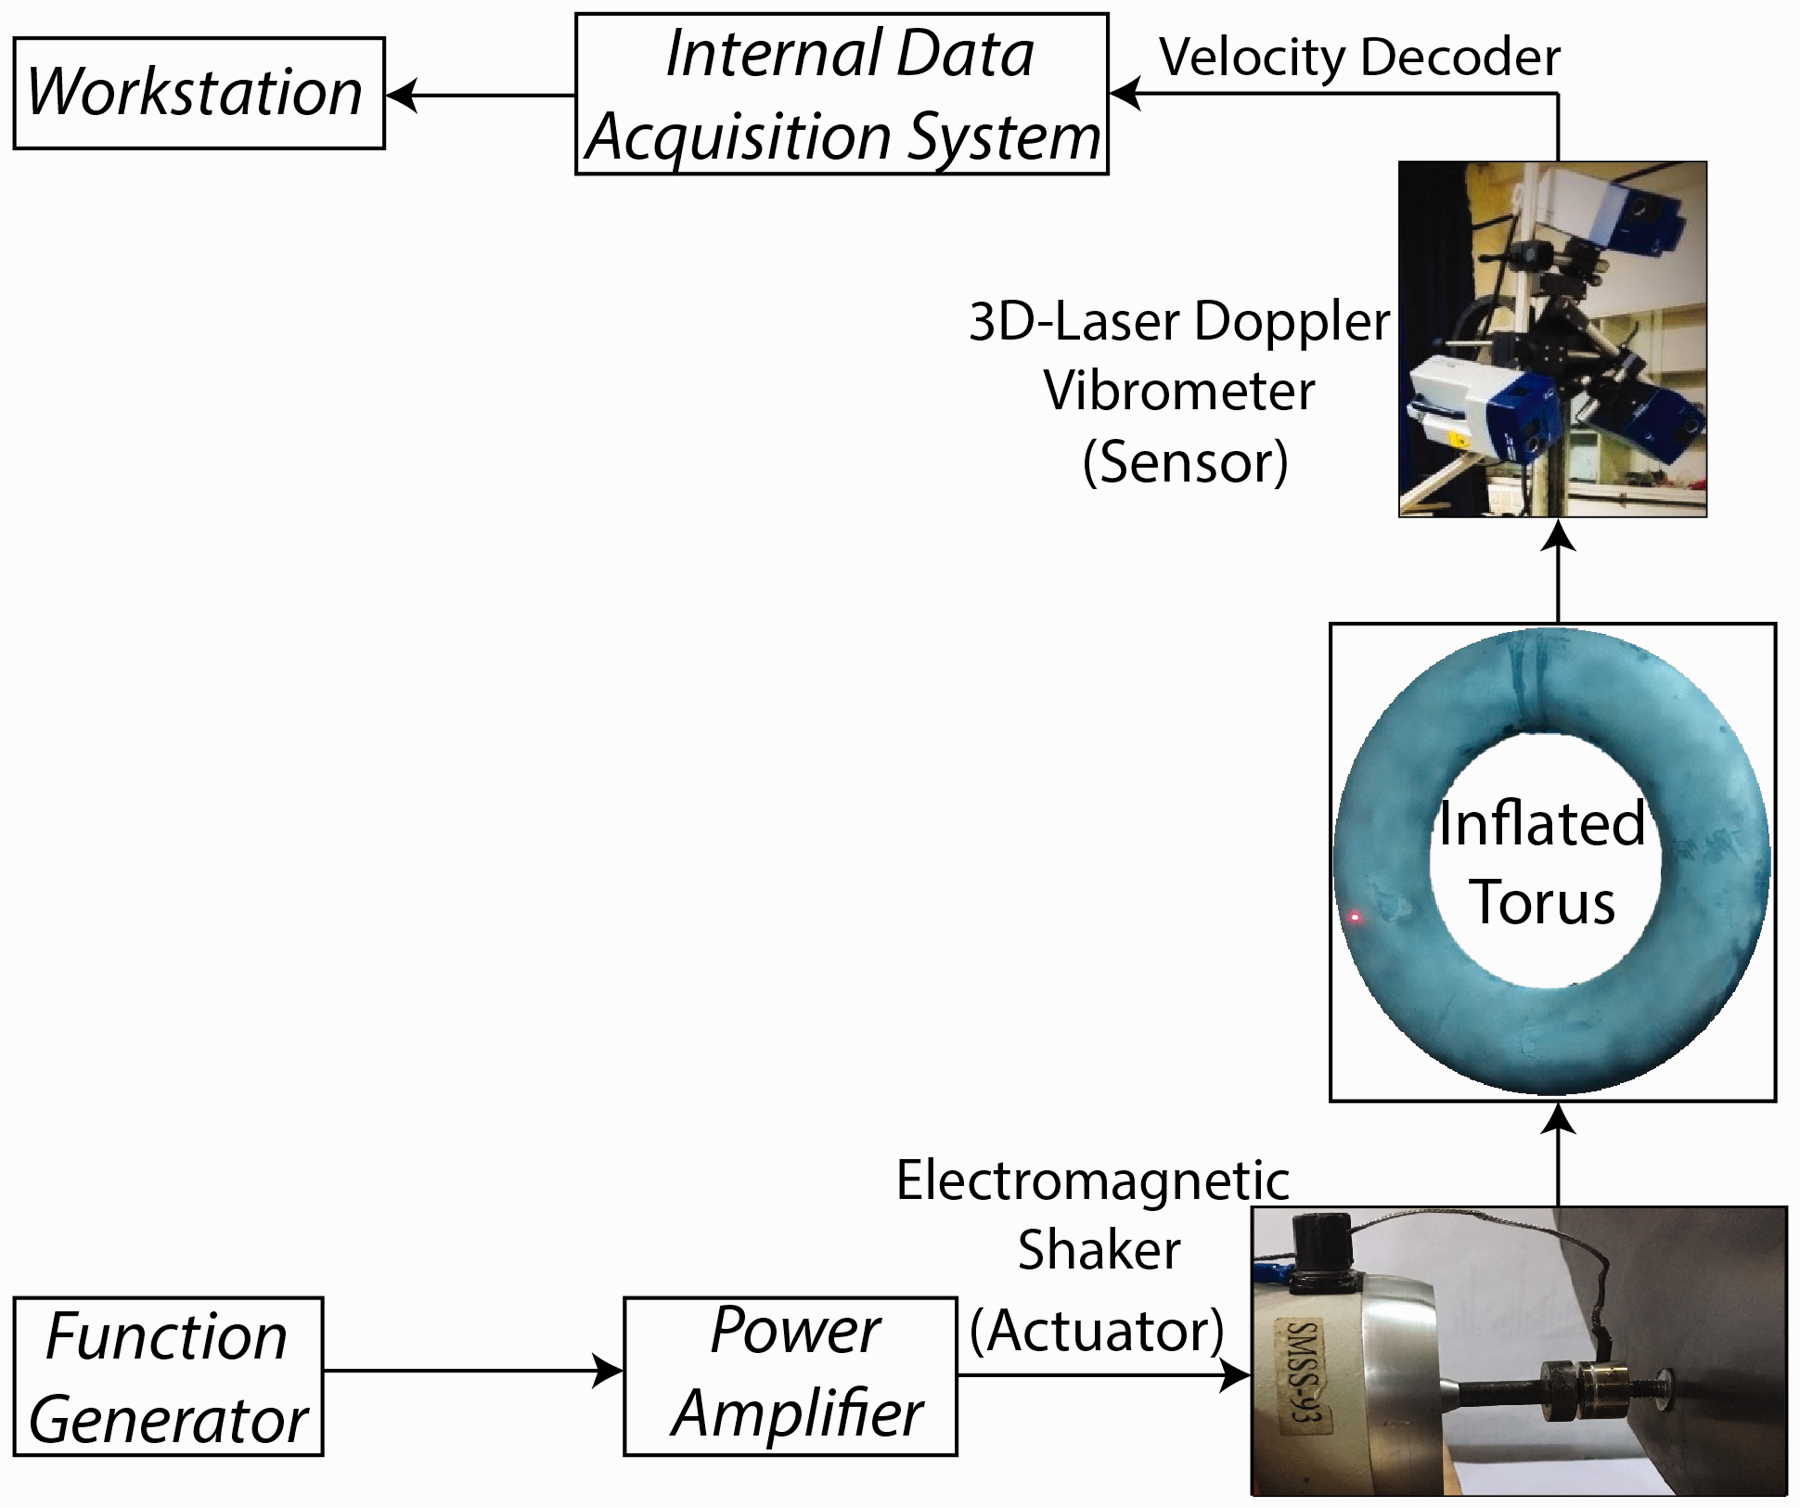
Block diagram of experimental setup along with actuation and sensing system.
Response points on the torus surface.
Specifications of the actuator and sensor.
Results and discussion
After acquiring data from the experimental modal test, a polynomial function in rational fraction form was fitted to the FRF data in a least-squared error sense using STAR7 modal analysis software. Subsequently, the eigenvalues and eigenvectors of the system in the range 5–100 Hz were obtained. Figure 17 shows a limited set of FRF’s with excitation point marked as 0° and the response measured in the form of displacement at various locations over the surface of torus namely 0°, 45°, 90°, 135°, 180°, 225°, 270°, and 315° from the excitation point.
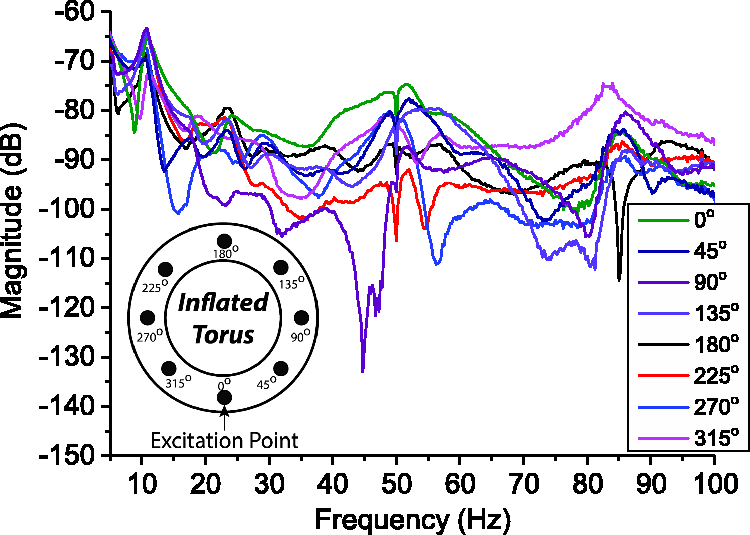
FRF plot obtained from the receptance (m/N) for a set of response points.
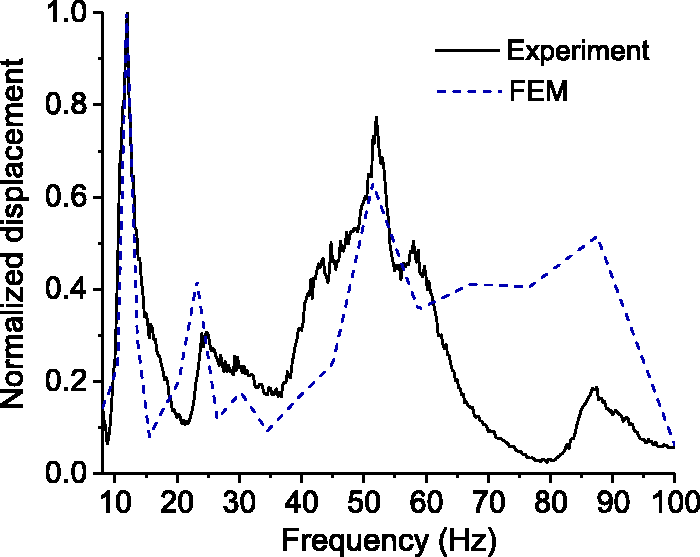
The coherence function was plotted corresponding to different radial points on the torus to indicate that the test results were legitimate. The coherence between two signals (x(t) and y(t)) is a real-valued function defined as
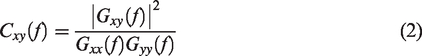
Coherence being a dimensionless function has a magnitude ranging from zero to one. Its value of zero indicates that the input and output signals do not correlate whereas the value near to 1 indicates the linear correlation between input and output measurement. Figure 18 displays a coherence of 1 except a drop at 50 Hz due to the same frequency of alternating current supply. Thus, it confirmed that the system was linear, and measurements were not contaminated by noise.
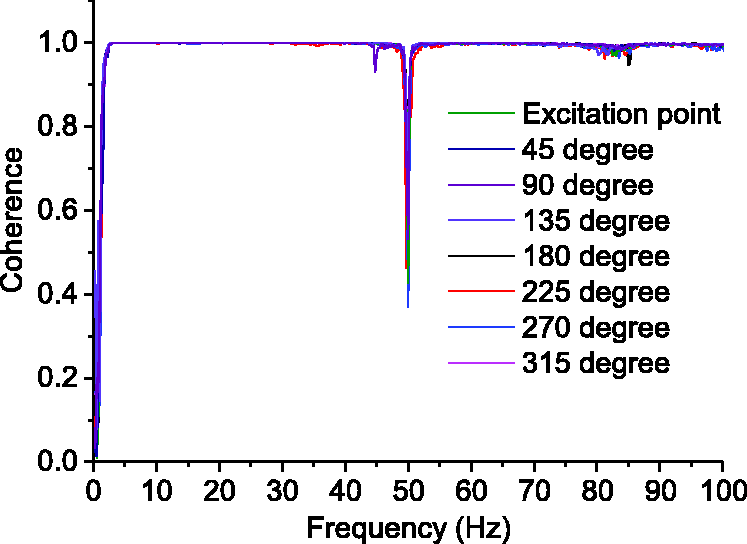
Coherence plot for various response points on the torus surface as mentioned in Figure 17.
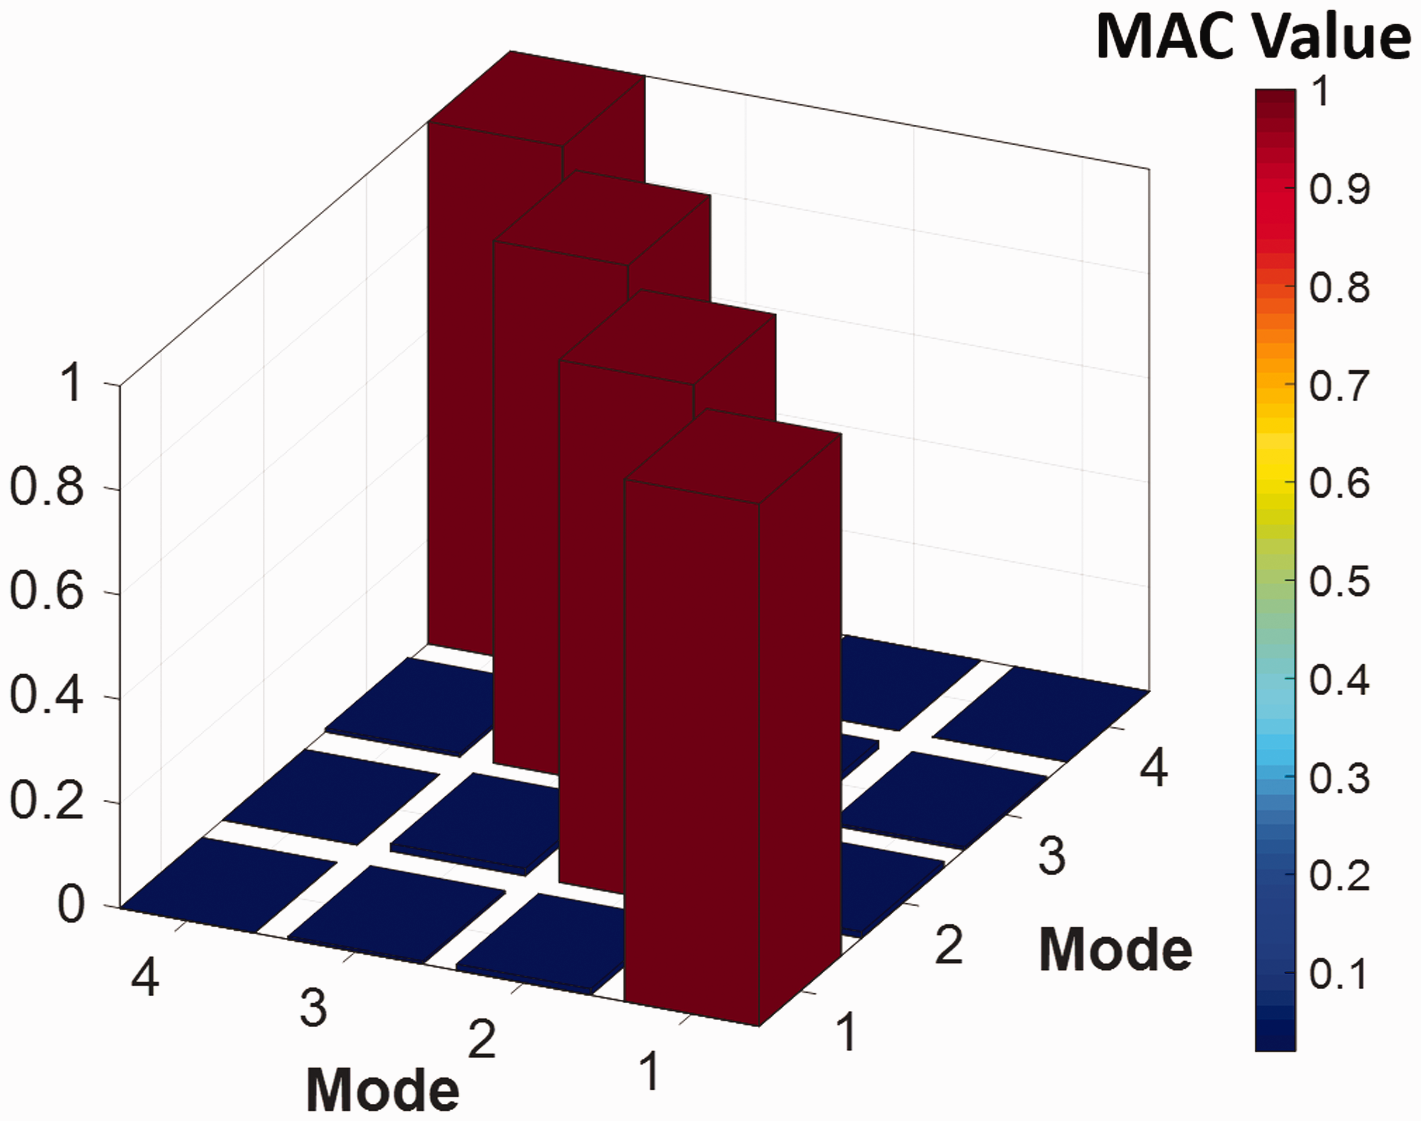
Further, modal assurance criterion analysis (MAC) was used to assess the similarity of mode shapes quantitatively. It is a statistical indicator bounded between 0 and 1. If the mode shapes are identical, the MAC will have a value of 1, indicating a high level of compliance and will be close to zero, if mode shapes are different. Thus, an ideal set of response measurement is one in which all the off-diagonal terms are zero. Such a MAC matrix indicates low cross-correlation between the mode shapes, and hence each mode shape will be sufficiently different from others.39,40
The MAC was calculated as the normalized scalar product of the two sets of vectors 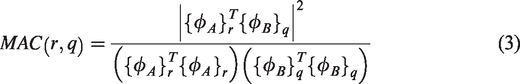
Thus, by extracting the eigenvectors corresponding to each mode shape, the MAC matrix was constructed, and a 3D-bar was plotted as shown in Figure 19. The low values of off-diagonal elements and diagonal unity elements indicate that distinct resonating modes were obtained. The corresponding mode shapes obtained from the experiment are shown in Figure 23.
Modal assurance criterion plot obtained from the experimental results.
Next, using the finite-element (FE) software Abaqus-SIMULIA™, a steady-state dynamic analysis with free boundary condition was performed on an air-inflated torus incorporating fluid–structure interaction. Also, the material properties obtained from the mechanical tests carried out on the butyl rubber sample were integrated into the model. The viscoelasticity was assimilated in terms of Prony series (equation (1)) corresponding to N = 4 (Table 3) by making the parameters dimensionless after dividing Ei by E(t = 0). The geometric and material properties employed in the model are summarized in Table 5. The FE model (Figure 20) was meshed using sweep technique and composed of total 21,384 elements of S4R shell type having the quad-dominated shape.
Meshed torus with shell element S4R of quad-dominated shape using sweep technique.
Geometric and material properties.
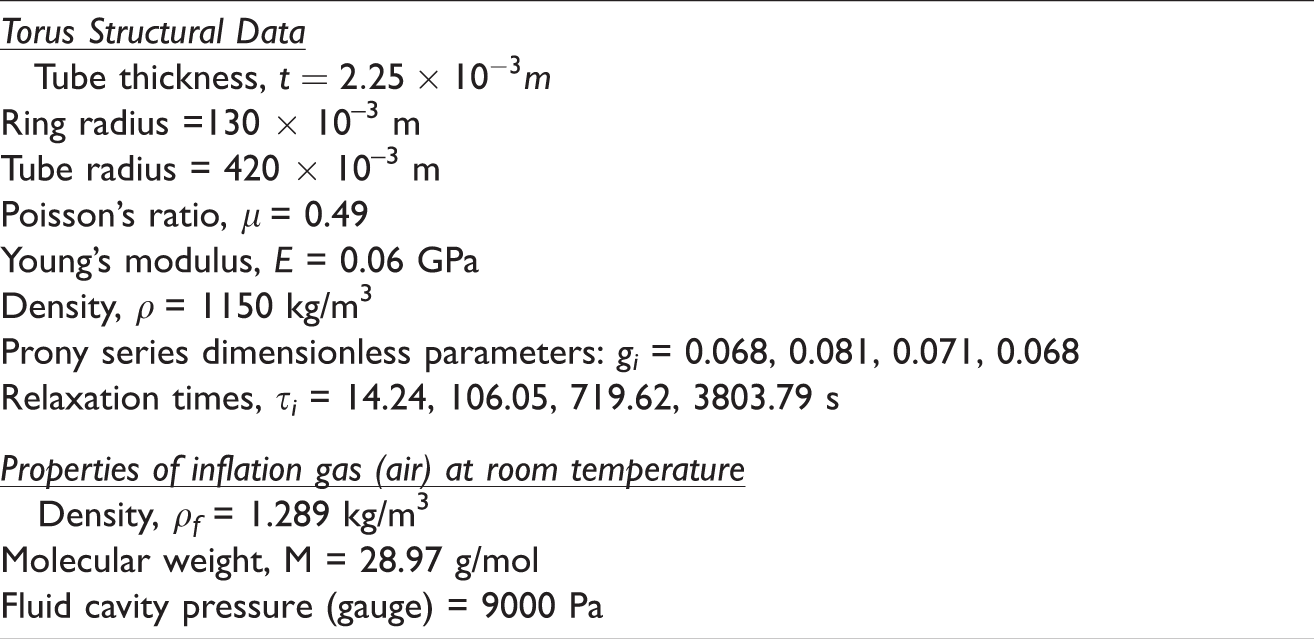
The steady-state dynamic analysis resulted in modes in the range of 5–100 Hz due to the forced excitation. However, some spurious (non-physical) modes in the simulation were noticed that were the result of an excessively flexible system under consideration. Henceforth, the MAC analysis was performed by extracting the eigenvectors and post-processing the data using an open source code 41 by customizing same to the requirement. After comparison, distinct eigenvectors corresponding to the resonating modes were obtained, and the result of MAC analysis was plotted as shown in Figure 22. Figure 21 shows a comparison of normalized displacement of a point corresponding to force excitation for both experiment and numerical simulation.
Normalized displacement plot of a location corresponding to 0° in Figure 17.
Modal assurance criterion plot obtained from the finite element simulation results.
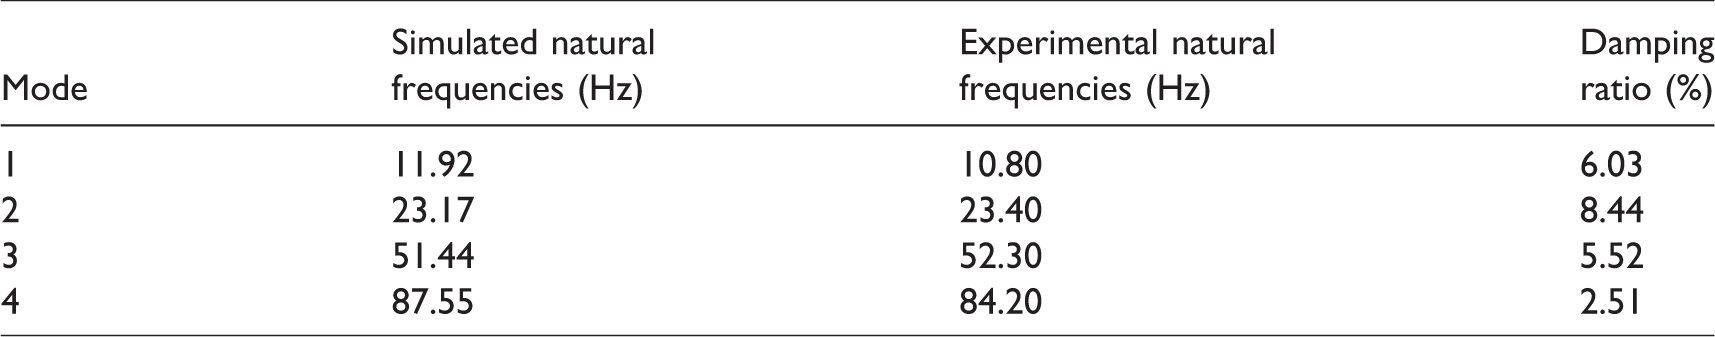
Various mode shapes corresponding to resonating frequencies were obtained as shown in Figure 23, and the results are tabulated in Table 6 to compare it with the experimental results. The obtained resonant frequencies were found to be in proximity to the experimental results. The discrepancy between the apparent smoothness of experimental and simulated mode shapes is attributed to the relatively wide gap among the sensor points during the experimental modal test analysis due to which precise contour shape was not obtained as in FEM analysis. The damping loss factor was calculated using the half-power bandwidth method from the FRF. It can be ascertained that with an increase in modal frequency, the damping loss factor falls as depicted in Figure 13. This again confirmed that for this system, the low-frequency behavior was dominated by viscosity while high-frequency behavior by elasticity.
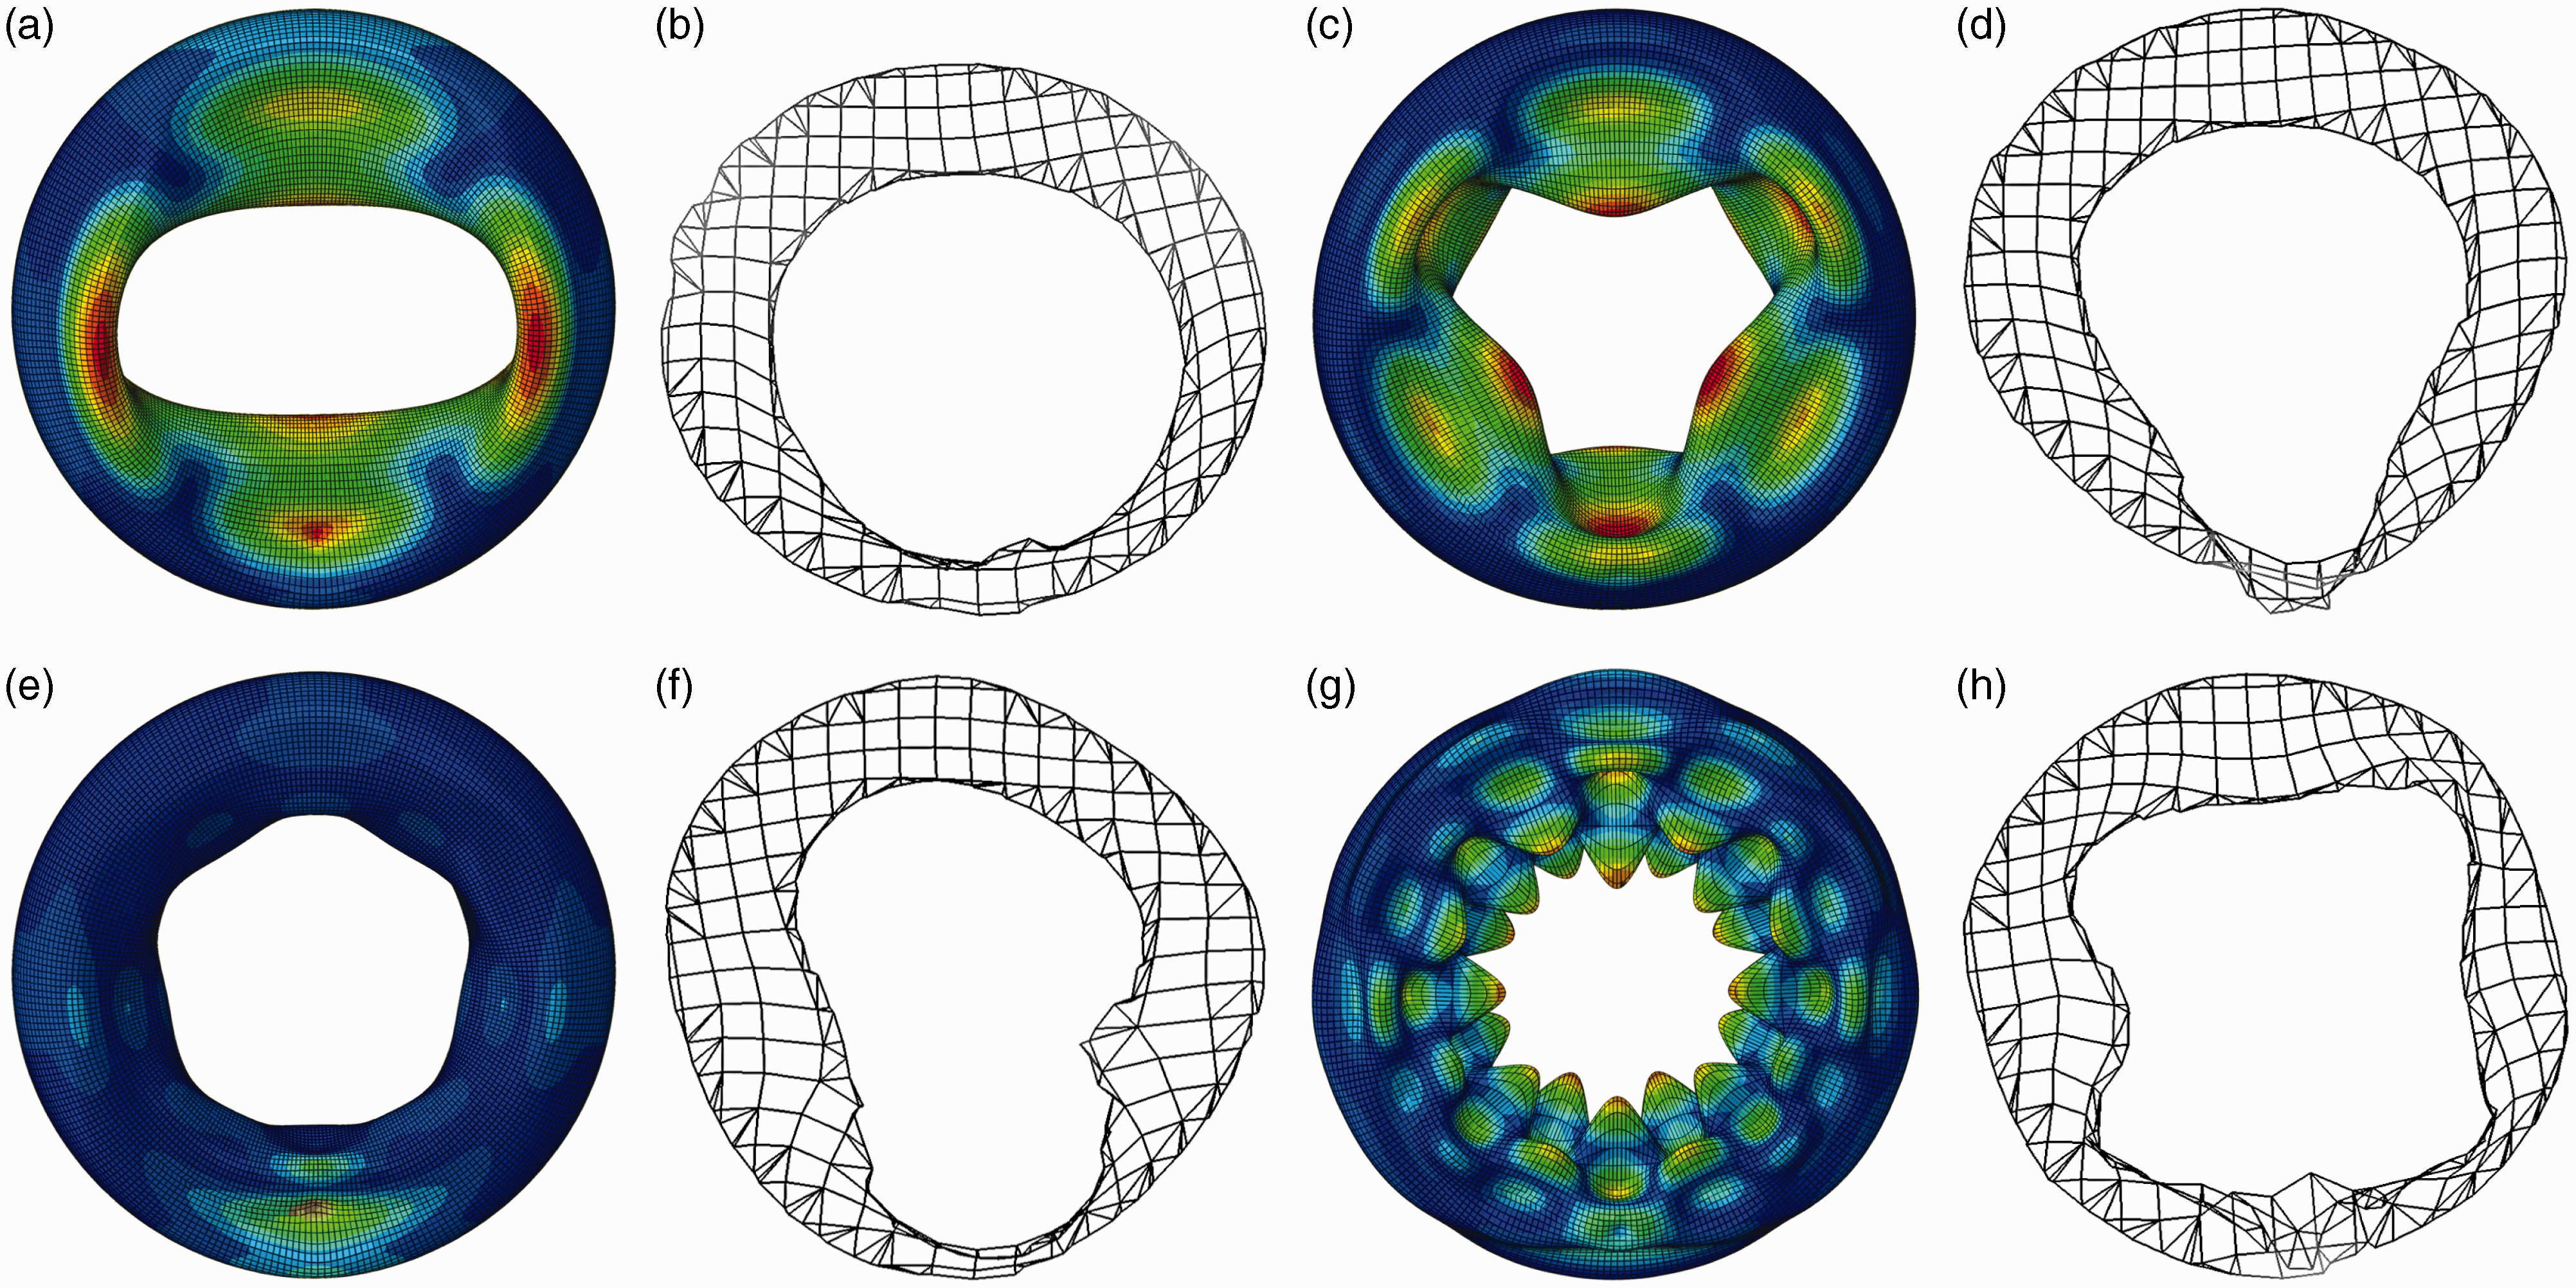
Comparison of simulated and experimental mode shapes corresponding to the forced excitation. (a) Simulated mode 1 (11.92 Hz); (b) experimental mode 1 (10.80 Hz); (c) simulated mode 2 (23.17 Hz); (d) experimental mode 2 (23.40 Hz); (e) simulated mode 3 (51.53 Hz); (f) experimental mode 3 (52.30 Hz); (g) simulated mode 4 (87.55 Hz); (h) experimental mode 4 (84.20 Hz).
Simulated and experimental resonant frequencies.
Conclusion
In this work, all the necessary steps to be followed for analyzing inflatables are summarized. The tensile and stress relaxation tests were performed on the butyl rubber sample to obtain the Prony series coefficients for fitting the generalized Maxwell model. Since viscoelastic behavior is also influenced by frequency and temperature, the dynamic mechanical analysis test was carried out over a range of temperature and frequency. The glass transition temperature based on the peak on loss modulus curve was obtained, and its variation with heating rate and frequency was studied. Subsequently, the modal test on elastically suspended inflatable torus was performed using electromagnetic shaker as actuator and laser as a sensor. Finally, the modal behavior of an inflated torus structure was studied incorporating the fluid–structure interaction with free boundary condition using finite element. The obtained mode shapes corresponding to resonant frequencies were parallel with the experimental results. A modal assurance criterion for authenticating the correctness of mode shapes was determined. The results portrayed that low-frequency behavior was viscosity-dominated while elasticity dominates the high-frequency response. The analysis provided valuable insight related to the design of an inflated torus structure by incorporating both mechanical testing and simulation. The proposed experimental methodology can be used as a guideline to perform the modal analysis of many flexible membrane structures. Future communications on the torus-antenna system may involve varying factors like environmental conditions by including thermal gradient and selecting space qualified material for the torus. Also, the dynamic response of such torus structures and the controllability and observability of the same system will be explored.
Footnotes
Acknowledgements
The authors acknowledge Mr Gyanendra Tripathi, IIT Kanpur for assistance in carrying out experiments and Ms Manya Singh from the University of Texas at Arlington, USA for her support during proof-reading of the manuscript. We are grateful to the anonymous reviewers for their useful and constructive comments.
Declaration of conflicting interests
The author(s) declared no potential conflicts of interest with respect to the research, authorship, and/or publication of this article.
Funding
The author(s) disclosed receipt of the following financial support for the research, authorship, and/or publication of this article: This work was supported by the ISRO-Space Technology Cell Sponsored project (ME/IITK/2014086).