
Abstract
Suicide is a critical public health issue worldwide, influenced by environmental factors such as economic stress and limited social support, as well as individual risk factors. Patients with chronic health conditions may face heightened vulnerability due to overlapping psychological and medical challenges. This research explores the application of Machine Learning (ML) techniques to identify suicide risk among such patients, utilizing data from the National Health and Nutrition Examination Survey (NHANES). The study incorporated demographic, clinical, and psycho-social variables, including depression, substance use, hypertension, and diabetes, to develop predictive models. Several ML algorithms were trained and evaluated using standard performance metrics to assess predictive accuracy. Among the models, Gradient Boosting Machine (GBM) achieved the strongest performance, with a receiver operating characteristic area under the curve (ROC-AUC) of 0.9479. Random Forest also performed exceptionally, with a ROC-AUC of 0.9301, while four additional models showed competitive results. These algorithms effectively captured complex nonlinear relationships and interactions between multiple risk factors, demonstrating their suitability for multivariable health data. The findings underscore the potential of integrating ML into Electronic Medical Records (EMRs) as decision-support tools to identify high-risk patients. Early detection enables timely interventions, which may significantly improve mental health outcomes and reduce suicide risk.
Introduction
Suicide is estimated to account for 800,000 deaths annually, thus ranking among the most significant causes of death in the world, as observed by the WHO. 1 Suicidal deaths threaten the stability and socio-psychological climate of societies. 2 However, current research highlights the lack of assessment of risk indicators and identification of preventive measures. 3 Some of the known predictors of suicidal risks are mental disorders, 4 past attempts, early traumatic experiences with adverse life events, 5 periods of vulnerability, suicidal ideation due to substance misuse, 6 limited finances, and loss of employment. 7 In addition, mental illness related to chronic diseases such as cancer, CVDs, and diabetes is a crucial clinical factor in suicide risks.8–12
To address the concerns of these risks, an emerging trend of predicting suicide attempts through data mining of electronic medical records (EMR) has been widely used, which has increased patient outcomes significantly.13,14 This data from EMR can be processed through machine learning (ML) techniques to evaluate and predict patient conditions and possible suicide tendencies. By applying these techniques, predictions can be made from a considerably more complex set of data than would be feasible for a clinician to deal with. 10
Suicide risk prediction is a critical challenge in clinical settings, with ML models showing promise in improving the early identification of individuals at risk. Nock et al. (2022) investigated the effectiveness of ML in predicting suicide attempts within one and 6 months following an emergency department visit. Their study, which analyzed 1818 patients, demonstrated that ML models applied to a brief patient self-report scale significantly improved prediction accuracy when supplemented with electronic health records (EHR) and clinician assessments. The results identify the possibility of bringing patient-reported information and EHRs together to improve suicide risk assessment so that clinicians can better identify high-risk patients. 13
Using ML models to build suicide prediction frameworks, Tsui et al. (2021) utilized a big-data-driven method with NLP and ML to forecast first-time suicide attempts. Their work examined EHR data of 45,238 patients, indicating greatly enhanced model performance (0.932 AUC). The study highlights the value of utilizing unstructured clinical notes in combination with structured EHR data to improve suicide risk prediction. 15 In the same way, Walsh et al. (2018) investigated ML-based adolescent suicide prediction using a retrospective longitudinal cohort study. Their computational models demonstrated strong predictive performance without requiring face-to-face screening, achieving an AUC of 0.97 for imminent suicide attempts. Notably, the study found that ML models outperformed traditional logistic regression models and benefited from recalibration, suggesting that ML approaches can provide scalable solutions for adolescent suicide risk assessment. 16
In the context of veteran populations, Ben-Ari and Hammond (2015) applied ML techniques to analyze clinical records from 250,000 U.S. veterans to predict suicide attempts over 10 years. Their study demonstrated a false positive rate of 0.5%, being highly specific, significantly improving upon traditional clinical screening methods that often yield high false favorable rates. The research highlights the potential of large-scale clinical databases and text mining in refining suicide risk models. However, the study also revealed a high false negative rate of 73%, indicating that while ML enhances specificity, further refinement is needed to balance sensitivity and specificity in predictive models. 17
Several works have focused on the accuracy of the EMR-based models for the prediction of suicide risk. However, a study has pointed out that more dynamic models need to be developed, which can be updated with new data to enhance useful predictions and help inpatient treatment based on the patient’s characteristics.14,18
The aim of this research is to predict the possibility of suicide attempts among patients with chronic diseases using data derived from the EMR. The study utilized data from National Health and Nutrition Examination Survey (NHANES), which provides a comprehensive assessment of the health and nutritional status of the U.S. population. The aim of the study is to develop a prediction model using socio-demographic, lifestyle and clinical characteristic to benchmark ML algorithms for suicide risk prediction among people at a higher risk for suicide ideation based on interconnected variables.
Traditional statistical approaches such as logistic regression have been widely used in suicide risk assessment given their interpretability and simplicity. However, these approaches often assume linear relationships and limited interactions between predictors, which make the complex suicidal nature of risk difficult to understand. For example suicide risk may occur due to a number of factors including socio-economic stress, health conditions, or substance intake, which also greatly varies with age (Danuta Wasserman, Miriam Iosue, Anika Wuestefeld, 2020). These conditional relationships are usually not captured with traditional regression models. On the other hand, ML techniques are designed to model these complex, non-linear interactions without requiring strong parametric assumptions. ML methods also have the ability to capture hidden feature interactions and improve predictive accuracy making it highly suitable for clinical scenarios where early risk detection is a priority. To address this concern, this study used an ML methodology.
Methodology
The overall methodology to conduct this research was as presented in Figure 1: Study design for predicting suicide risk using machine learning.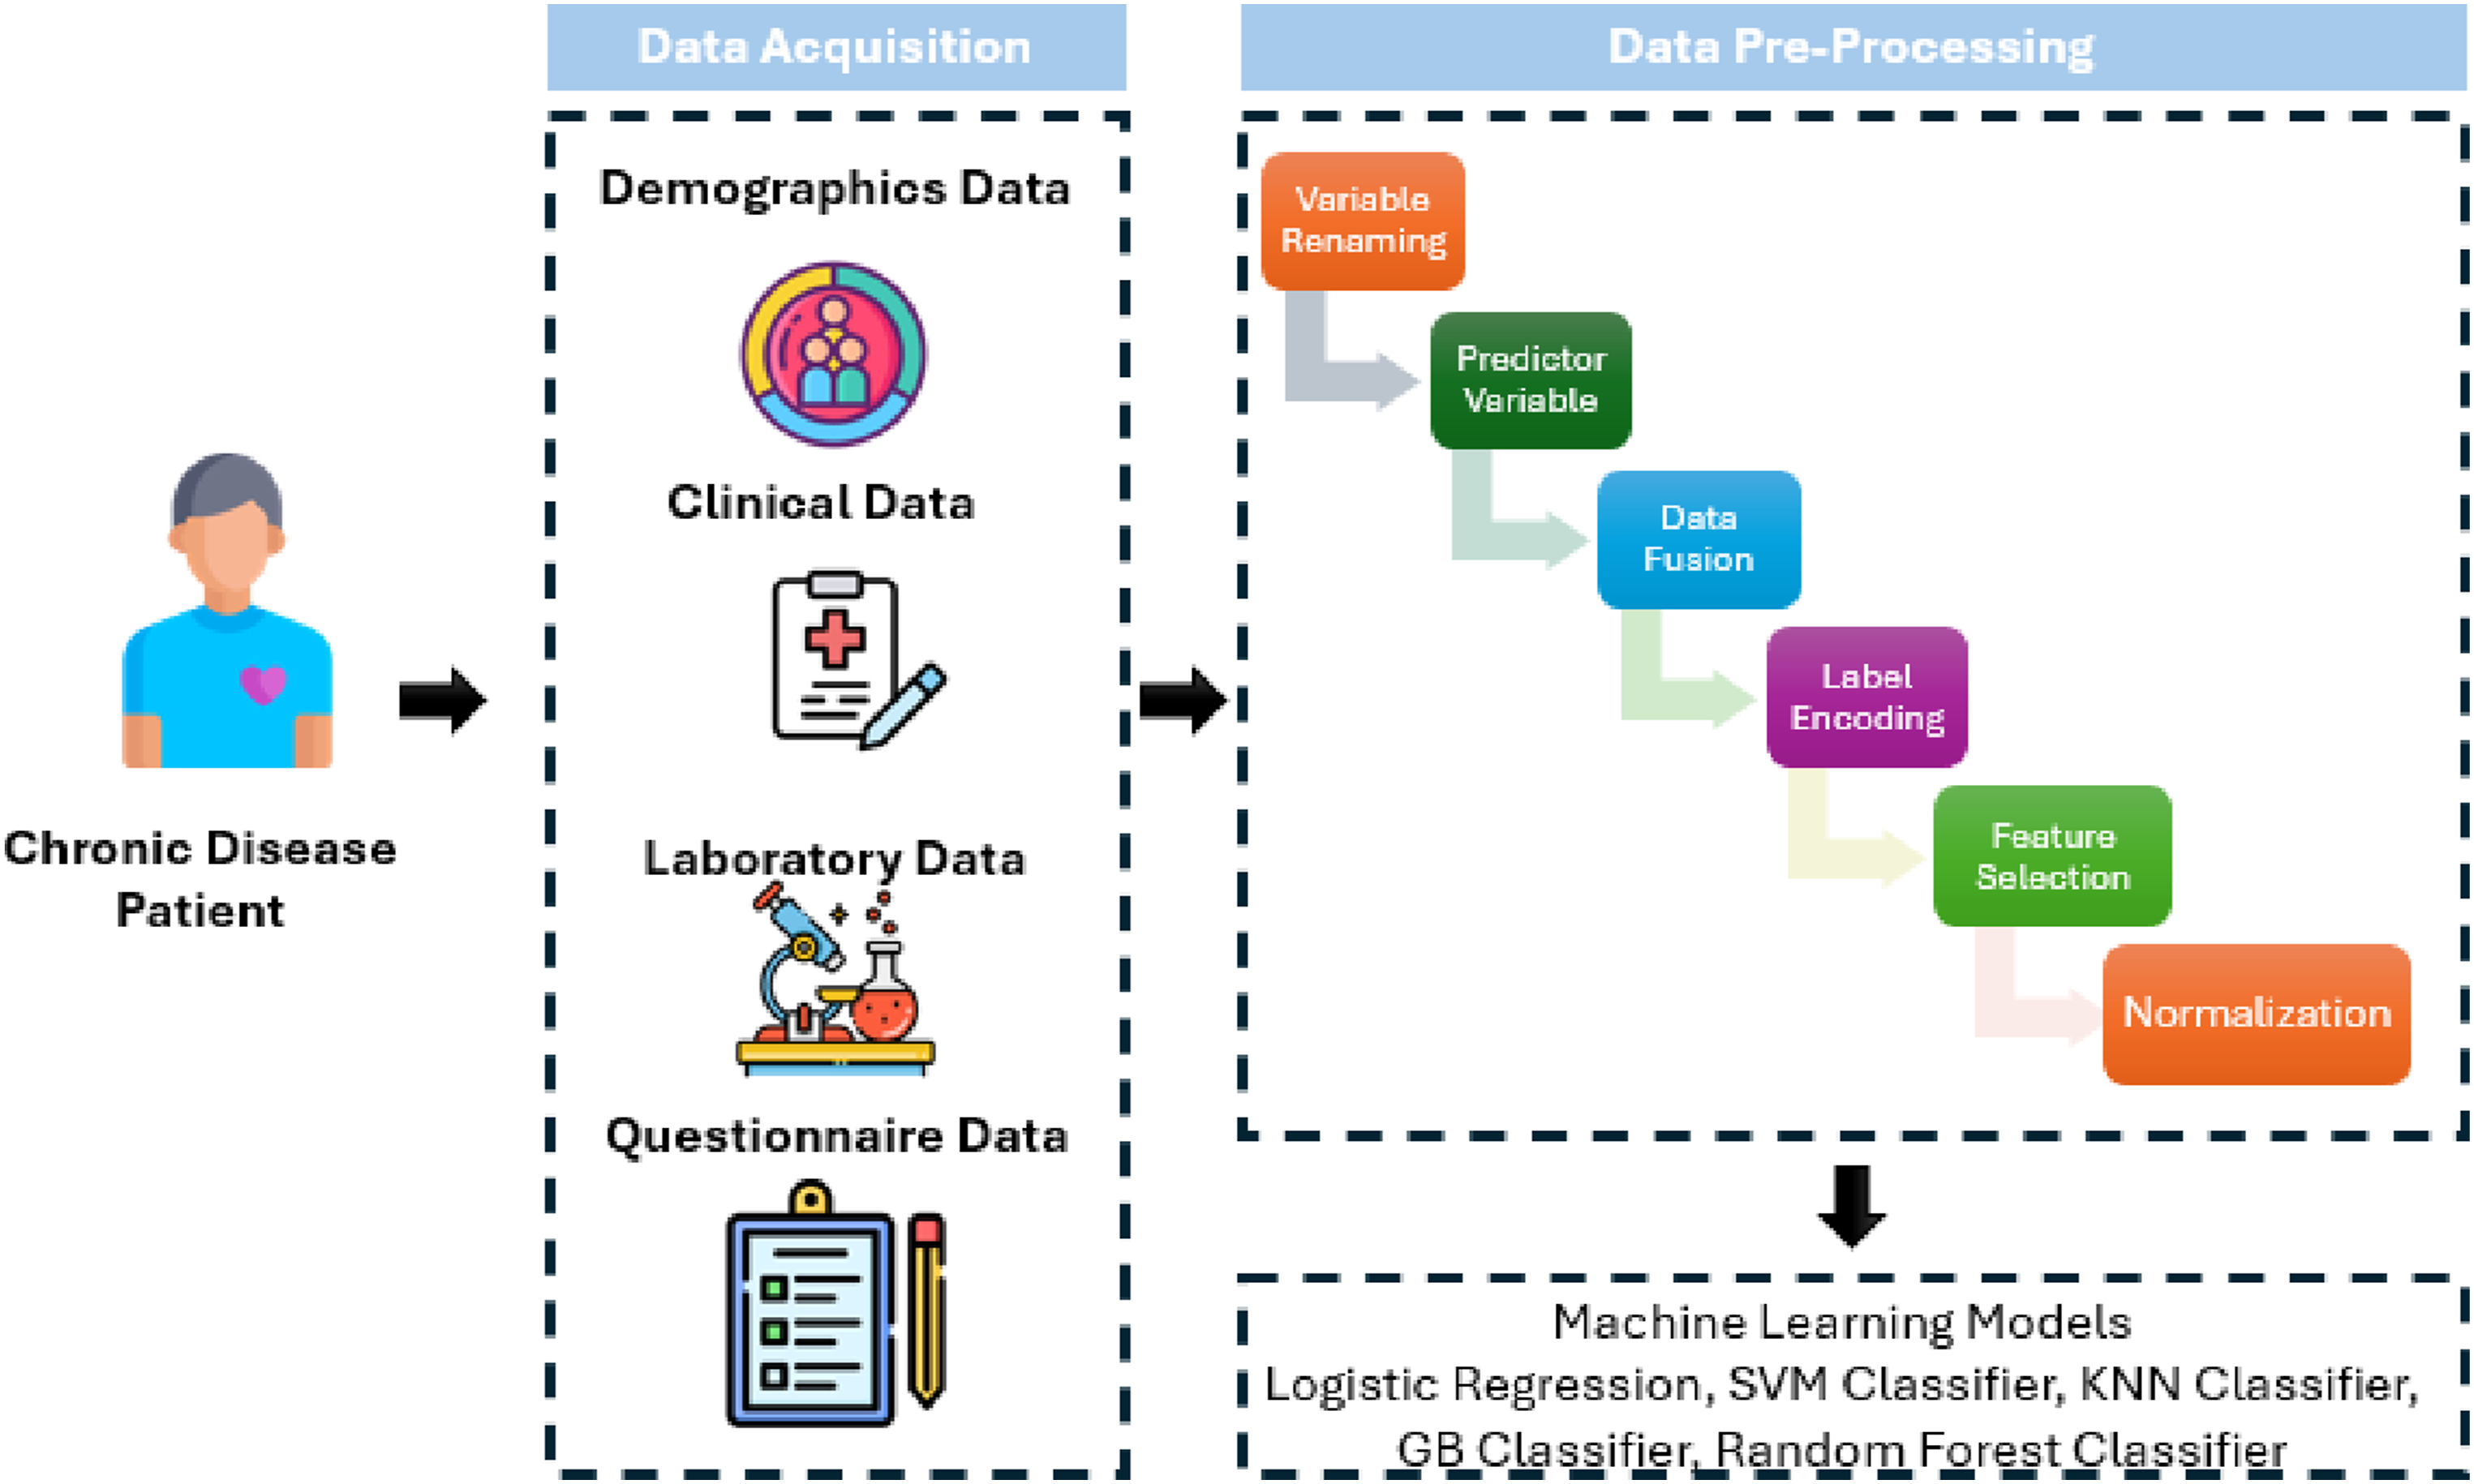
Dataset acquisition
For this study, we used data extracted from the NHANES surveys. We merged demographic, examination, laboratory, and questionnaire data to get final samples. Participants with missing data on key predictors (depression, screening, chronic disease status, etc.) were excluded from the study samples. Within this cohort, 1924 individuals (≈81%) were categorized as high suicide-risk according to our composite risk factor definition (≥5 risk factors), while 461 individuals (≈19%) were categorized as low-risk. This imbalance reflects the operationalization of suicide risk in this study and suggests the analytic dataset does not directly represent the general U.S. population distribution of suicide risk. Demographically, the sample had 42% reporting unemployment or not currently working samples.
NHANES evaluates the nutritional status and general health of adults and children in the US. 19 It gathers a wide range of data, such as socioeconomic, nutritional, health, and demographic data. For this study, NHANES data consisting of face-to-face interviews, physical examinations, and laboratory tests were used to give a portrayal of the targeted population, the US civilian non-institutionalized population. The data source was chosen due to one of the most comprehensive, nationally representative health datasets available in the United States. NHANES is not only a nutrition survey, but also integrates detailed attributes such as demographics, socioeconomic status, health risks, and health problems which were important to achieve the objectives of this study. The chosen dimensions directly align with known suicide risk factors, such as low income, unemployment, substance use, chronic illnesses, and depression. This study did not use NHANES dietary intake measurements, rather it focused on the non-nutritional variables important to analyze suicidal risks.
The data assembled was Demographics Data (DEMO_L); containing details like age, sex, income, education, military experience, etc. For Examination Data, BMI, blood pressure, and liver stiffness were obtained, and for Laboratory Data, blood lead and cadmium levels, glucose, and complete blood counts. Questionnaire Data talked about other ailments that are usually common and the screening for depression and different lifestyles, such as people smoking or drinking alcohol. The dataset description is given in Figure 2. Demographic, socioeconomic, and health characteristics of the study population and their count.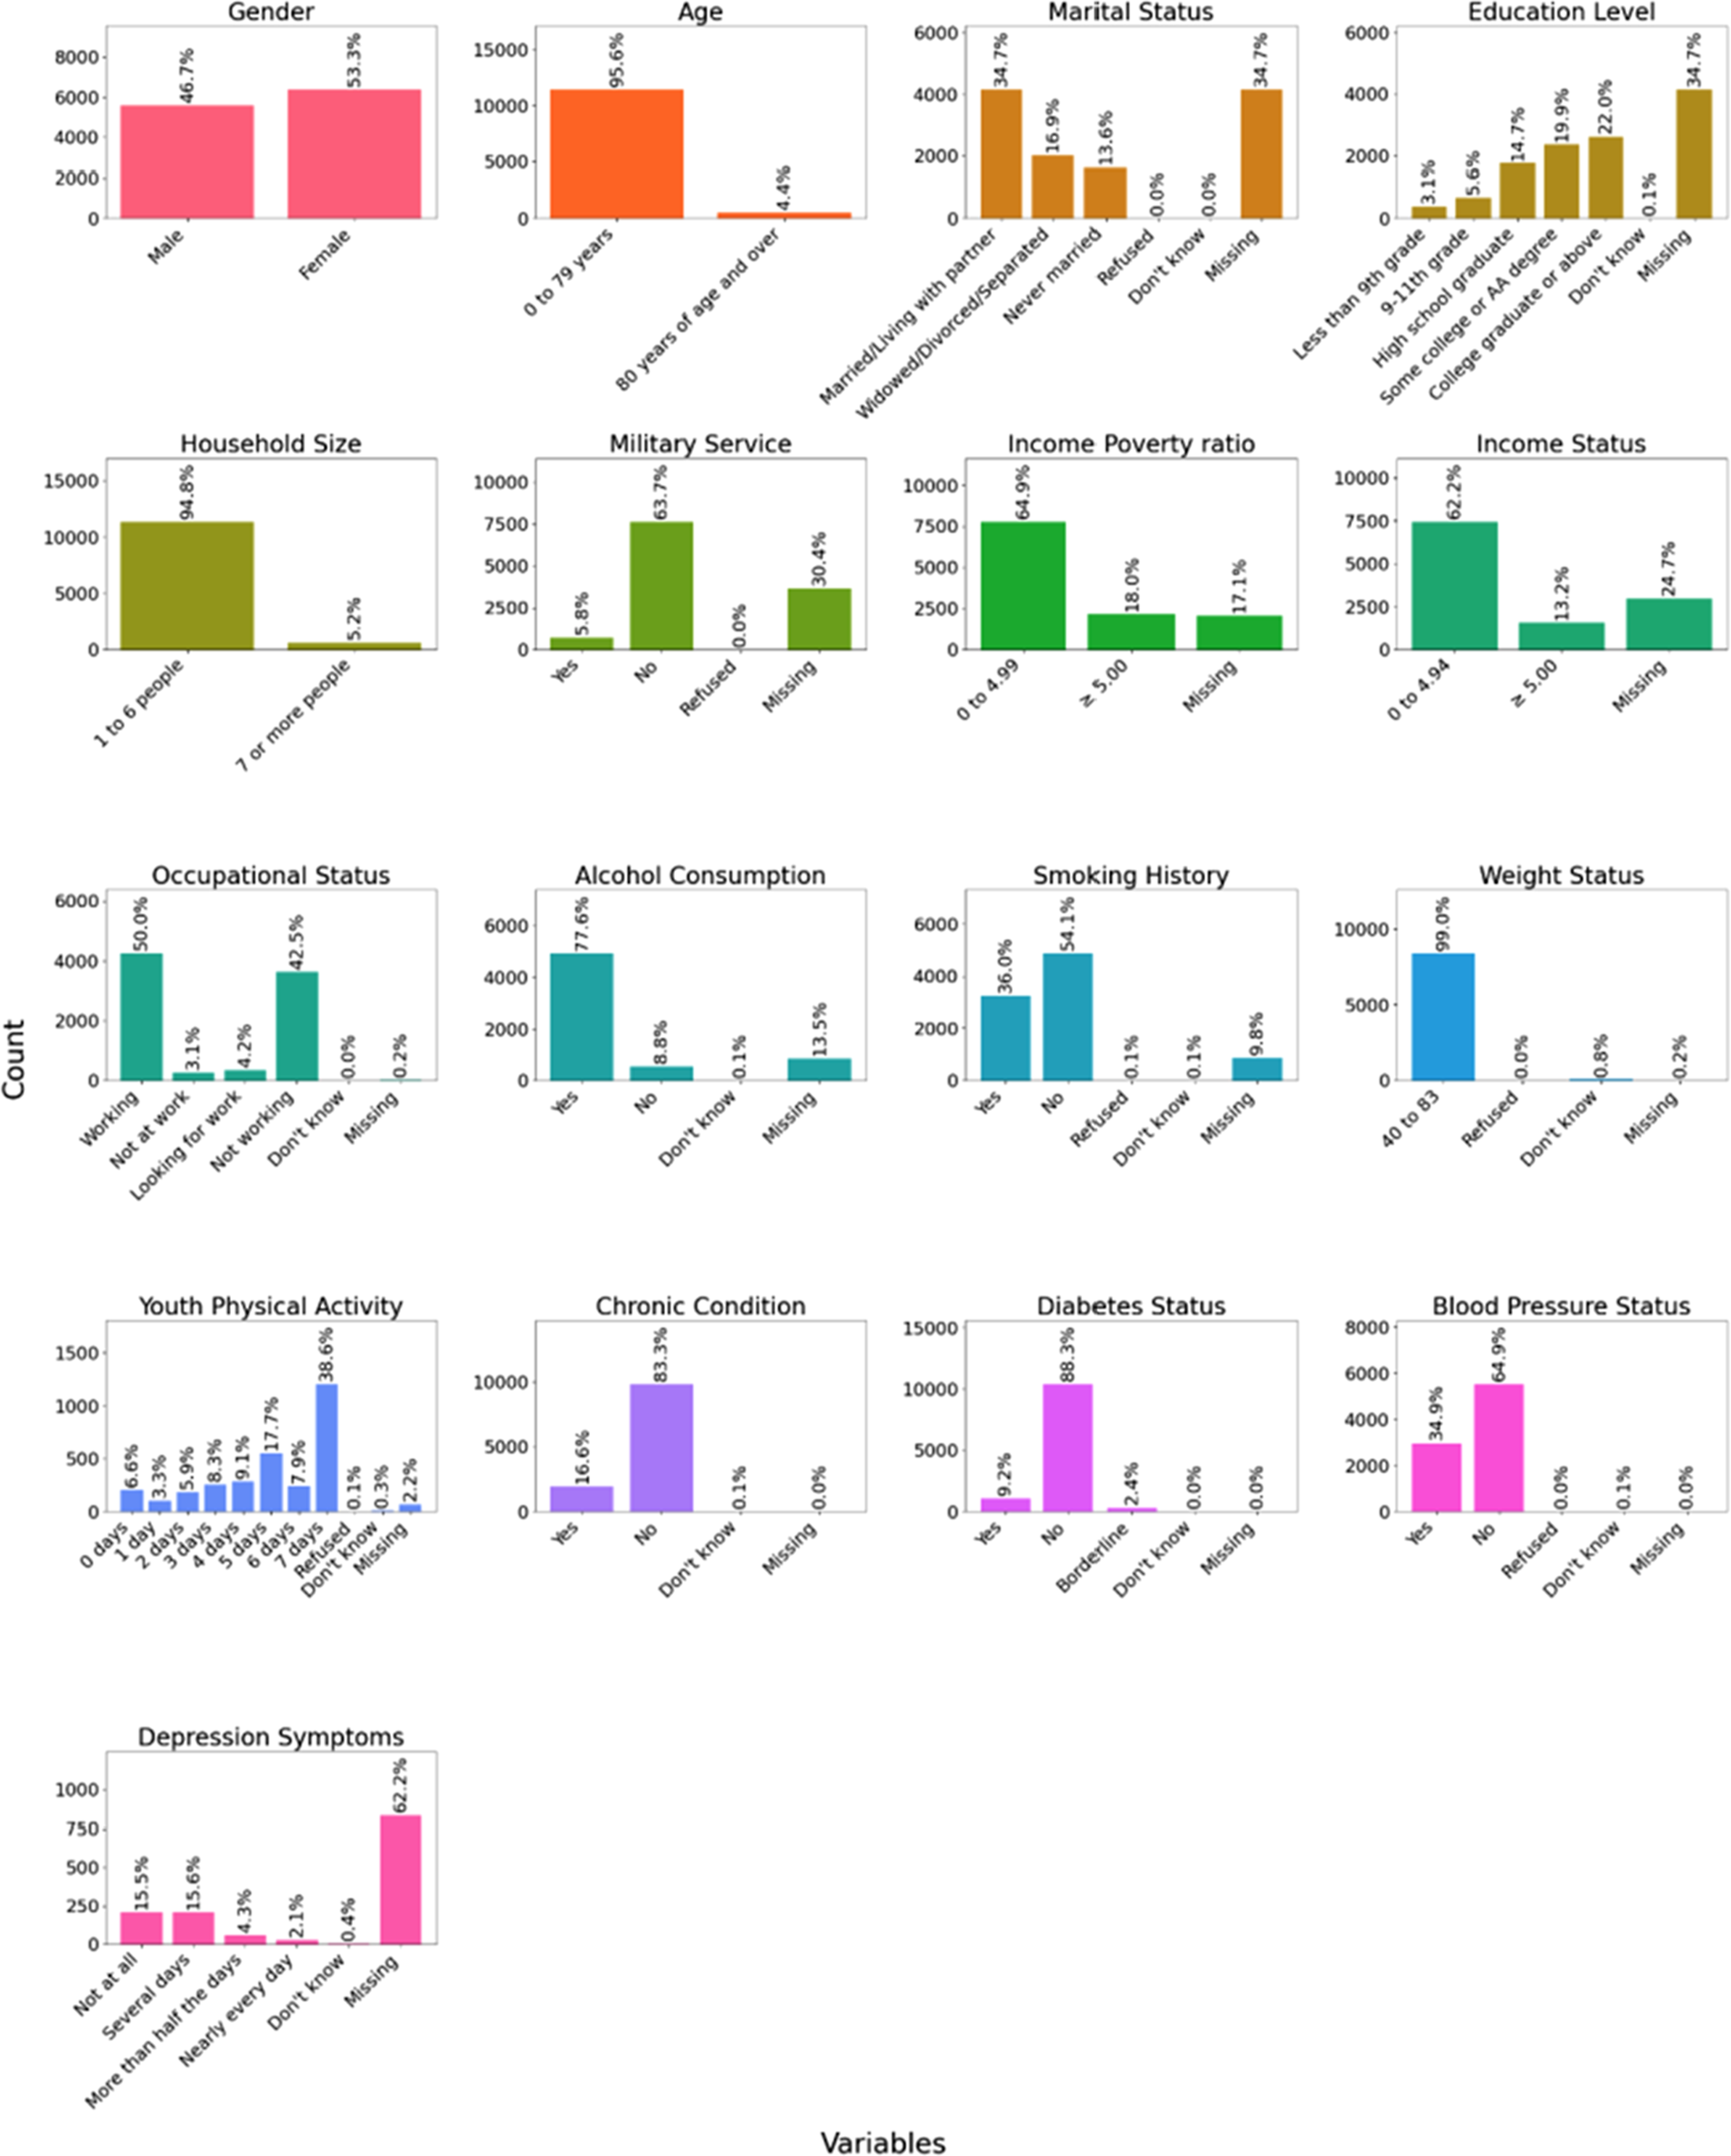
Data pre-processing
The following pre-processing steps were taken to apply the ML models:
Variables renaming
The variables in demographics data, laboratory data, and questionnaire were renamed for convenience.
Creation of predictor variable
The predictor variable ‘Suicide Risk’ was created. The variables were selected depending on the existing literature on potential predictors of suicide behavior.20–22 A computational method was utilized to estimate suicide risk based on several demographic, socioeconomic, and health-related factors. Major risk factors taken into account were the occurrence of chronic conditions, low income (income-poverty ratio <1.5), social isolation (being unmarried), substance use (alcohol use or history of smoking), low education (less than high school), age vulnerability (<25 or >65 years), male sex, history of military service, physical inactivity, diagnosis of diabetes, hypertension, being overweight, large household size, unemployment, financial instability, poor general and dental health, and lifestyle behaviors like smoking and alcohol use. Each of the factors was evaluated against predetermined thresholds, and a binary label was assigned. The number of positive risk factors were then calculated, and subjects with five or more risk factors were labeled high risk, and those with less than five were labeled low risk. Hence, a new variable was created, ‘Suicide_Risk,’ as a predictive measure for suicide ideation risk.
Missing data addressing
Missing datasets were addressed using a complete-case analysis approach. Participants having missing key variables such as depression, chronic conditions and socioeconomic indicators were excluded from the samples meant to be used as model inputs. While the dataset size reduced after this step, model training without biasness was ensured. For example, depression symptom data (PHQ-9) were missing for approximately 62% of participants in the NHANES dataset, which substantially contributed to case exclusions.
Numerical encoding
Numerical or Label encoding is typically used to convert categorical data into numerical data. The dataset had both categorical and numerical features. The features were encoded using Label Encoder. However, the binary features were encoded using one hot encoding.
Feature selection
Feature selection is used to find the optimal set of features out of all the variables in the original dataset. This is essential for the optimization of ML models because only relevant data is fed into them. We used Recursive Feature Elimination (RFE) Technique to select the optimal set of features. It is a feature selection method that recursively eliminates the least significant features and keeps the most significant ones to enhance model performance. The algorithm begins with all the features at hand, scores them according to their importance in the model, and recursively deletes the least significant ones until the number of desired features is left. In the current implementation, RFE was implemented using a Random Forest with 100 trees to choose the 20 most significant features. Then, the RFE model was trained and the data was transformed, retaining only the most important features, which were demographic variables (e.g., Gender, Age, Income-Poverty Ratio), anthropometric measurements (e.g., Weight, Height, Waist Circumference), biochemical markers (e.g., Blood Lead Level, Blood Cadmium Level, Insulin Level, Vitamin D Level), and clinical variables (e.g., Chronic Condition, Smoking History, Platelets). The main benefit of RFE is that it eliminates redundant or less informative features, minimizing overfitting and increasing interpretability.
Variable description
Description of selected features used for suicide risk determination.

These variables were used as input parameters for ML models which determined whether a sample falls into the category of ‘High Suicide Risk’ or ‘Low Suicide Risk’.
Normalization
Normalization is used to re-scale all the data points on a common scale. Min-max scaler was used to normalize features and limit values in the [0, 1] range.
Data splitting
The dataset was split into 80% train, 10% test, and 10% validation sets.
Outcomes
In this study, the primary outcome was a binary indicator of suicide risk. Because the data source did not include direct measurements of suicide attempts, such claims were not made. Instead, it contained self-reported psychological and health variables which were considered high suicide risk wherever patients had four or five risk factors. Outcomes also highly depended upon subject age and should therefore be understood as a risk index for suicidal ideation which even though does not provide actual events, it still presents a proxy classification reflecting elevated vulnerability to suicidal thoughts and tendencies, consistent with previous suicide risk stratification studies.
Moreover, the output variable was defined as a binary classification task presenting high suicide risk versus low suicide risk. Participants showing five or more risk factors were labeled as “high risk,” while those with fewer than five were labeled “low risk.” ML models were therefore applied as classifiers inputting multivariate demographic, psychological, and variables to get this binary outcome. The models do not directly classify patients into clinical subtypes of suicidality, but rather predict membership in the constructed risk categories.
Machine Learning (ML) algorithms
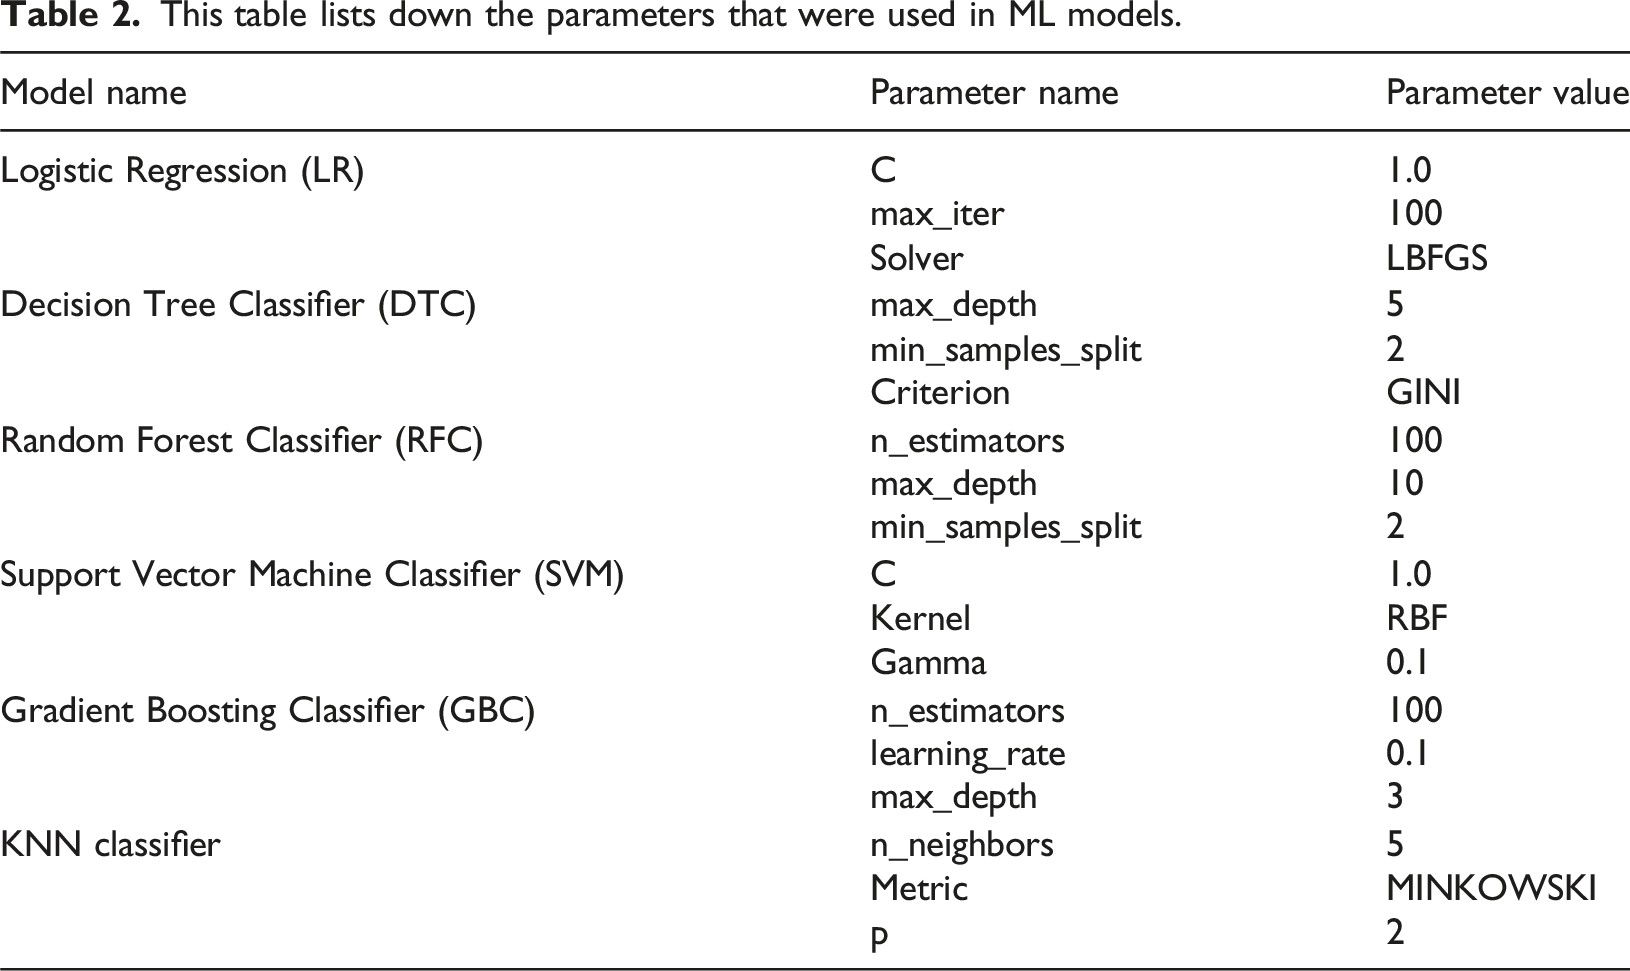
This table lists down the parameters that were used in ML models.
LR
LR is an ML model usually applied to binary classification tasks, which makes it suitable for suicide risk prediction. It predicts the probability of an outcome by passing a linear combination of input features through a logistic (sigmoid) function. The model is interpretable, efficient in computation, and offers insight into feature importance via its learned coefficients. Its effectiveness on complex, nonlinear datasets is limited due to its assumption of a linear relationship between variables and log chances of the result. 23
DTC
DT is a rule-based classifier that recursively partitions the dataset into subsets based on feature thresholds to build a tree-like classifier. Every node is a decision based on one feature, and the classification is made at the final leaf nodes. Decision trees are interpretable and capable of learning nonlinear relationships but are prone to overfitting, particularly for small datasets, unless pruned or regularized. 24
RFC
RFC is a type of ensemble learning in which multiple decision trees are created, and their predictions are combined to obtain more accurate results and avoid overfitting. Each tree is trained on a random portion of the data, while feature randomness is used in Random Forest, which improves generalization and resistance to noisy data. Random Forest works very effectively with interactive features that are complex but are computationally intensive and less interpretable compared to a single decision tree. 25
SVM
SVM Classifier is a strong model that determines the best hyperplane to classify various classes by maximizing the margin between them. It is beneficial for high-dimensional data and can deal with nonlinear relationships through kernel functions. SVM is insensitive to outliers and performs well with small data. Still, it may be computationally expensive, particularly for extensive data, and needs to be carefully tuned for hyperparameters like the type of kernel and regularization parameter.26,27
KNN classifier
KNN serves as a classification algorithm that operates through simple non-parametric methods. KNN uses a specified value of K to identify the K nearest points to an input while applying a distance metric such as Euclidean distance. It then determines the primary class distribution of this neighbor set to predict an input class. KNN processes large datasets inefficiently because it needs to store the complete training data along with real-time distance calculations; however, it performs well for well-separated classes throughout small datasets. 28
GBC
Gradient Boosted Trees creates sequential decision trees from weak learners to develop an ensemble model that minimizes errors based on a selected loss function. Gradient descent optimization through this algorithm generates perfect results when dealing with complex datasets possessing intricate decision boundaries. GBC produces effective predictions and avoids overfitting problems when properly adjusted with learning rate values and the number of trees and depth settings. 29
Model evaluation
The performance of the models was evaluated with the help of several criteria, out of which is accuracy – the percentage of the correct predictions, is calculated as:
Precision captures how accurate the model is at pinpointing which of the cases belongs to a specific class, calculated as:
At the same time, recall describes the capacity of the model to detect cases that are true positives, calculated as:
The F1 Score identifies the best compromise between precision and recall and is particularly well-suited to imbalanced data sets, calculated as: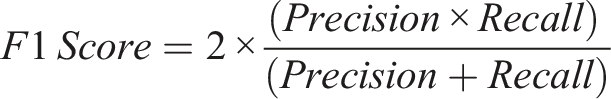
Moreover, the assessment of the Area Under the Receiver Operating Characteristic Curve (AUC-ROC) was computed as:
Pseudocode of developed machine learning framework.

Results
With the objective of building a robust suicide risk prediction model, the research utilized six ML models. Each model’s performance was assessed using primary classification metrics like sensitivity, specificity, accuracy, F1-score, and area under the curve (AUC) for both Receiver Operating Characteristic (ROC). Models displayed different levels of performance by remaining accurate at detecting risky individuals while avoiding incorrect assessments of patients at no risk. The predictive models combine demographic characteristics with socioeconomic indicators life, lifestyle variables, and clinical data to create a data-based method for evaluating suicide risk within this susceptible group.
From the data, the top 20 features that were selected for classification as given before in Table 1:
Patients showing risk factors of more than five of these variables were classified as suicide risks. The results of this categorical distribution are presented in a 3-Dimensional (3D) format in Figure 3 where t-SNE for dimensionality reduction shows extensive overlapping of two groups (high risk and low risk) with no distinct separation into clusters. However, it is highly evident from the graph that suicide risk samples cannot be separated using simple geometric clustering. Even in 3D latent space, ML is required to detect the subtle patterns. Note that the results of this graph are based on the raw data before splitting it into training and testing datasets. This indicates that individuals labeled as high and low risk share similar demographic, socioeconomic, and clinical characteristics in raw feature space. Each point in the graph represents one participant where blue points indicate low risk individuals and orange points indicate high risk individuals. The substantial overlap causes complexity of the suicide risk that can better be resolved using ML models which can capture non-linear interaction and subtle multivariate patterns that cannot be properly seen in two-dimensional visualizations. t-SNE 3D visualization of selected raw NHANES dataset participants exhibiting nature of suicide risk.
Figure 4 provides an assessment of a LR model that predicts suicide risk. This confusion matrix demonstrates 159 correct identifications of patients with no suicide risk as true positives (TP) alongside 302 incorrect high-risk classifications for individuals with no such risk: False Positive (FP). It also indicates 51 failed identifications of at-risk patients – False Negative (FN) – and 1873 false high-risk predictions: True Negative (TN). The model reaches 85% accuracy while showing 97% recall due to its strong capability in detecting suicide risk, yet its low 34.5% specificity causes many non-risk individuals to be misclassified. The measurement of precision stands at 86% while the F1-score reaches 0.91, which shows balanced precision alongside recall. The model demonstrates a strong tendency to detect suicide risk, yet it produces many incorrect classifications of individuals who are not at risk. Bearable results emerge from applying logistic regression because it gets high-risk cases right but leads to many false positives for non-risk patients. The confusion matrix for logistic regression model.
The confusion matrix in Figure 5 provides an evaluation of a DTC model used for suicide risk prediction. The model achieves correct classification for 290. TN instances of individuals who show no suicide risk while properly identifying 1728 TN ranks of at-risk individuals. The model produces 171 cases of false positives because it classifies persons without suicide risk as high risk besides detecting 196 missed instances that should have been identified as high risk. The model demonstrates 85% accuracy throughout its process while achieving a 0.90 score of recall of suicide risk cases yet fails to detect several instances. The decision tree model achieves a better specificity of 62.9% than logistic regression, which helps minimize incorrect positive predictions and demonstrates remarkable precision of 91%. The F1-score of 0.90 demonstrates a good precision-recall balance despite a slightly higher false-negative rate, which puts at-risk case detection sensitivity at risk. According to the decision tree model, it demonstrated heightened specificity than logistic regression, thus making it more effective at separating risk groups from non-risk groups. The confusion matrix for decision tree model.
The confusion matrix in Figure 6 determines how well a RFC model identifies subjects at risk of suicide. The model detected 272 TNs by correctly classifying individuals who did not pose suicide risk but also correctly identified 1860 true negatives among at-risk individuals. A total of 189 FP cases show that the model incorrectly identified people at high risk, but 64 FNs show that the system failed to identify suicide risk prediction in patients. The model demonstrates 89% accuracy together with 97% recall to effectively detect suicide risk while having 59% specificity, representing a moderate level of false positive results. Positive prediction reliability in the model reaches 90.8% precision and the F1-score balance stands at 0.94 between precision and recall. RFC stands above LR and DTC because it decreases detection errors while maintaining a good suicide risk identification performance, making it highly suitable for detecting at-risk patients. The RFC model showcased excellent predictive ability because it successfully identified vulnerable patients while decreasing cases of misdiagnosis. The confusion matrix for random forest model.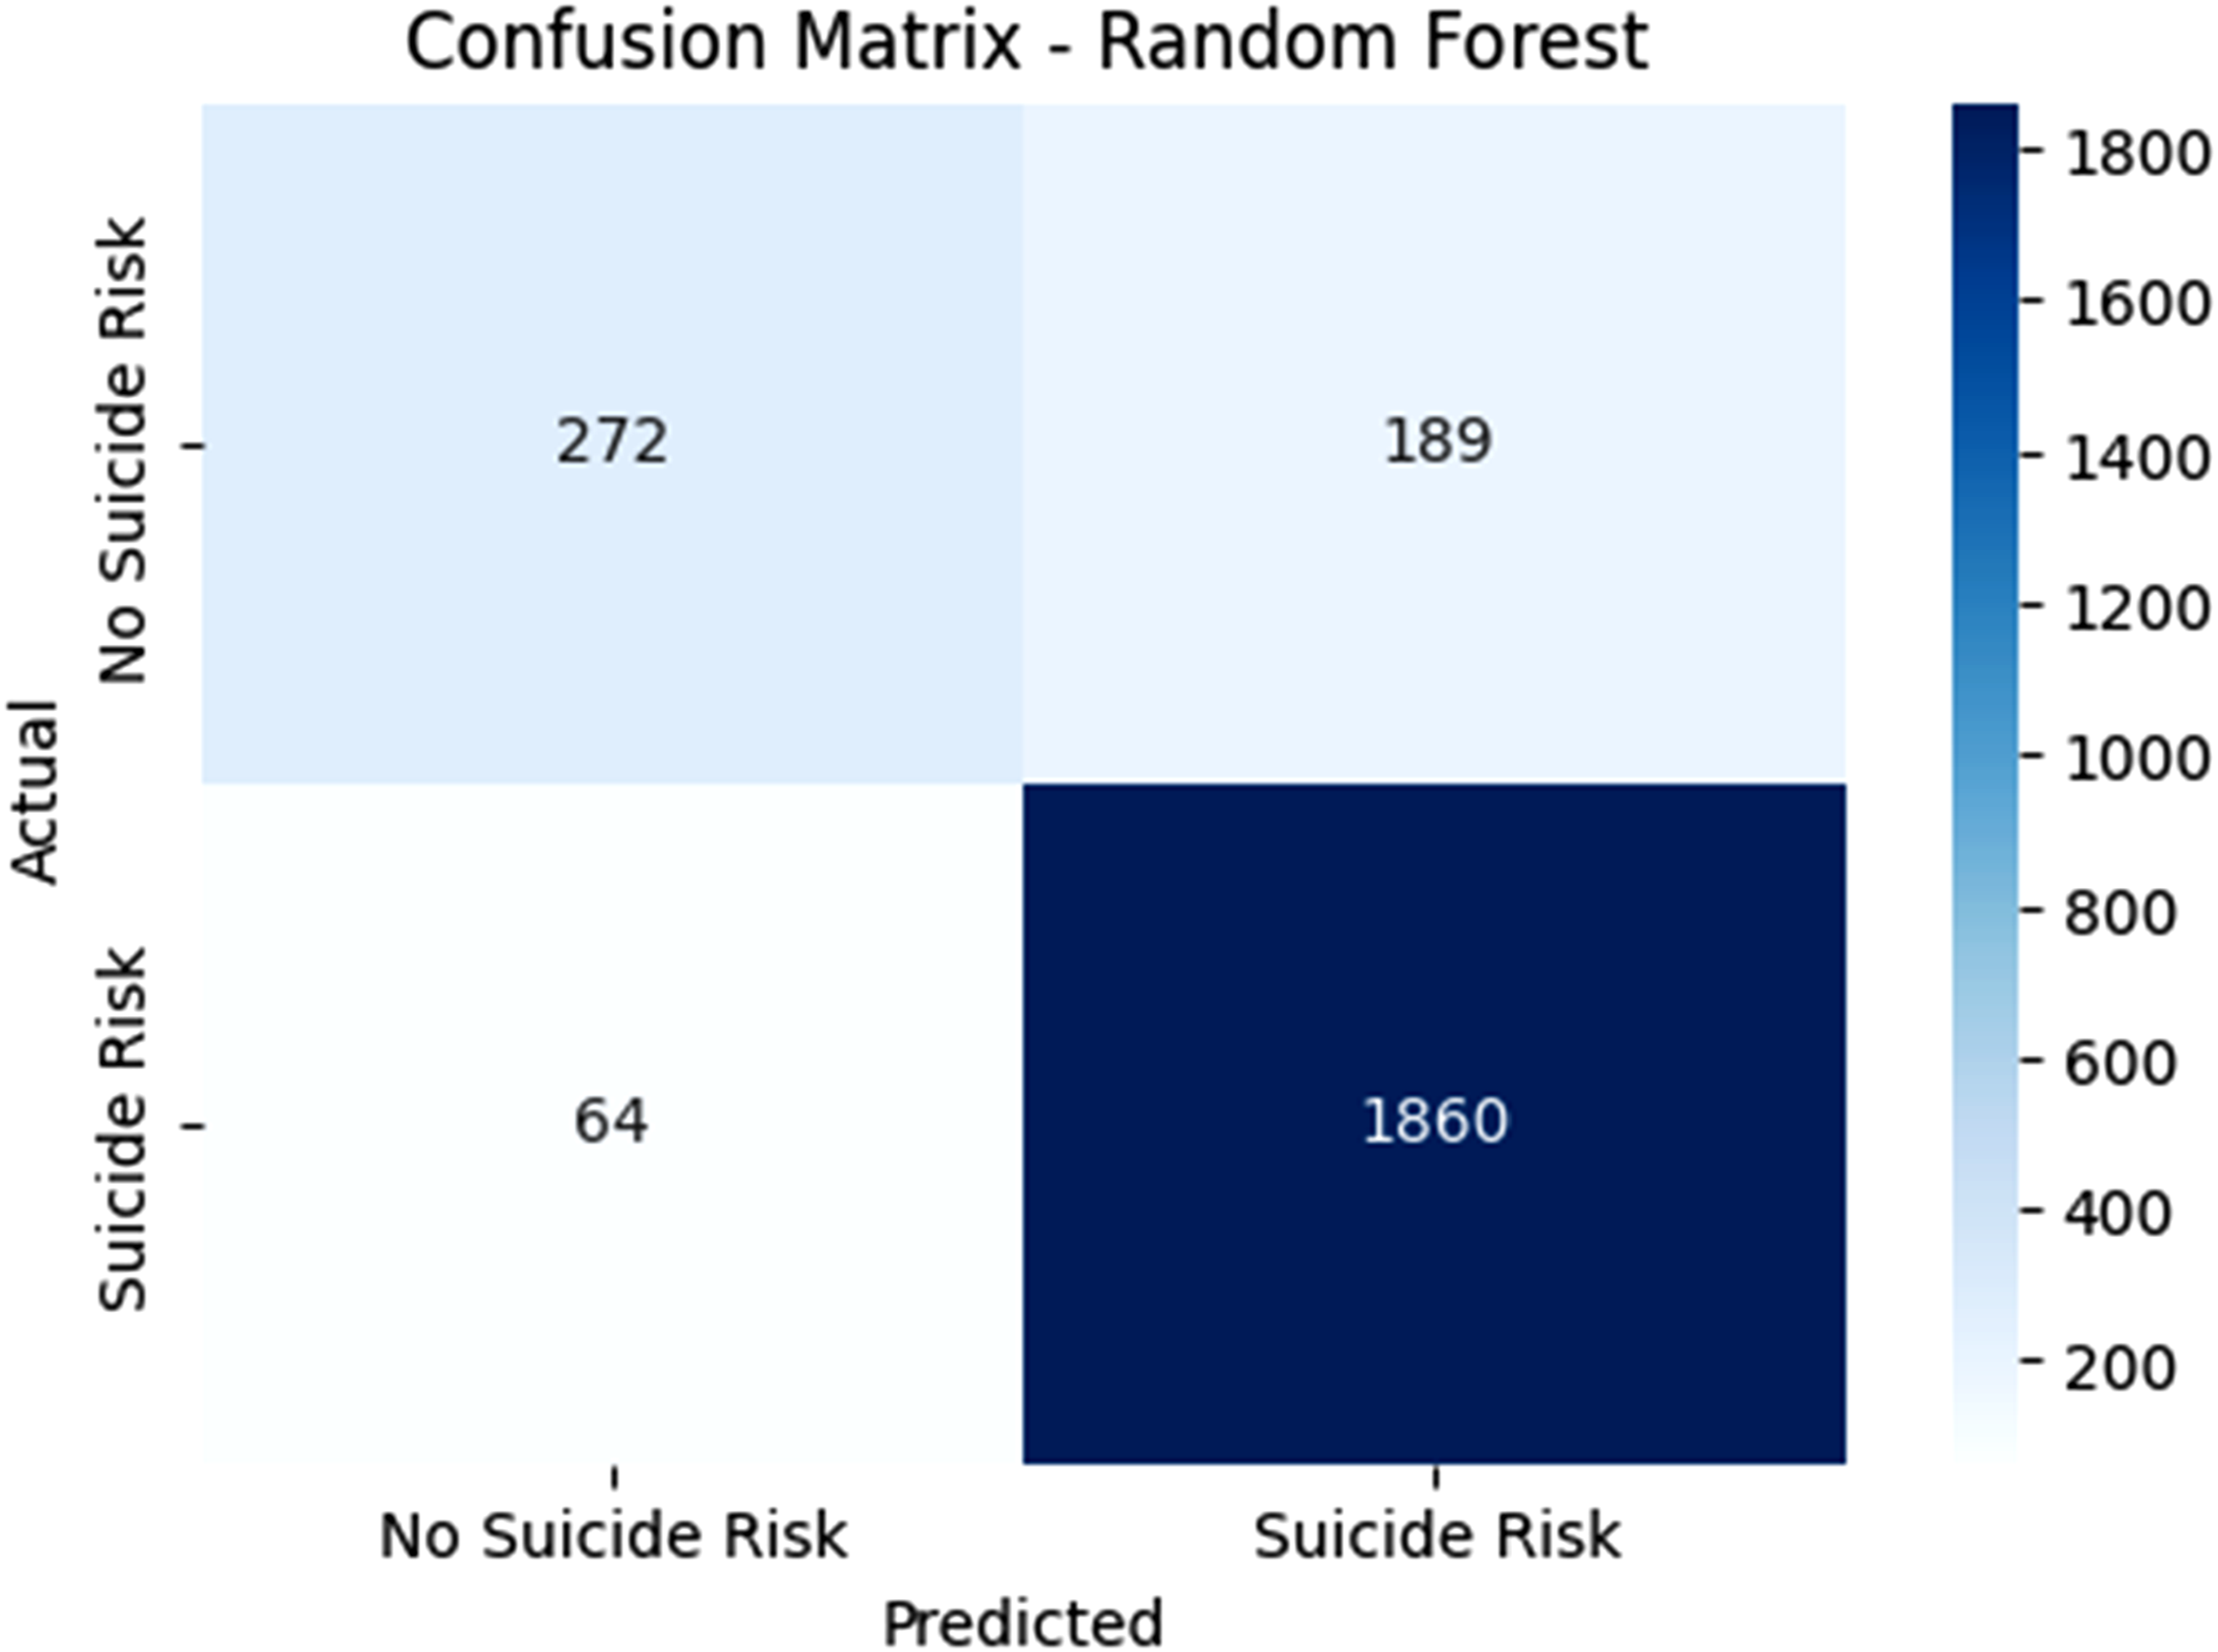
The SVM classifier demonstrates 183 correct TP identifications when it properly recognizes people who do have suicide risk, along with 1881 accurate TN identifications of patient populations who are not at suicide risk in Figure 7. The model misdiagnosed 278 individuals with high risk while failing to recognize 43 persons who were at high risk. The model demonstrates 87% accuracy together with 98% recall, which validates the detection of most suicide risk cases, yet its specificity rate of 39.7% exhibits a significant number of FP results. The 87% precision indicates effective model reliability for positive predictions, but considerable errors occur in non-risk misclassifications. The high F1-score at 0.92 shows an effective precision-to-recall equilibrium. The RFC and SVM models demonstrate different precision and specificity values, while the latter excels at decreasing FNs since it achieves high recall rates. The SVM model displays outstanding ability in suicide risk detection, which enables the proper identification of patients requiring assistance. The confusion matrix for support Vector Machine (SVM).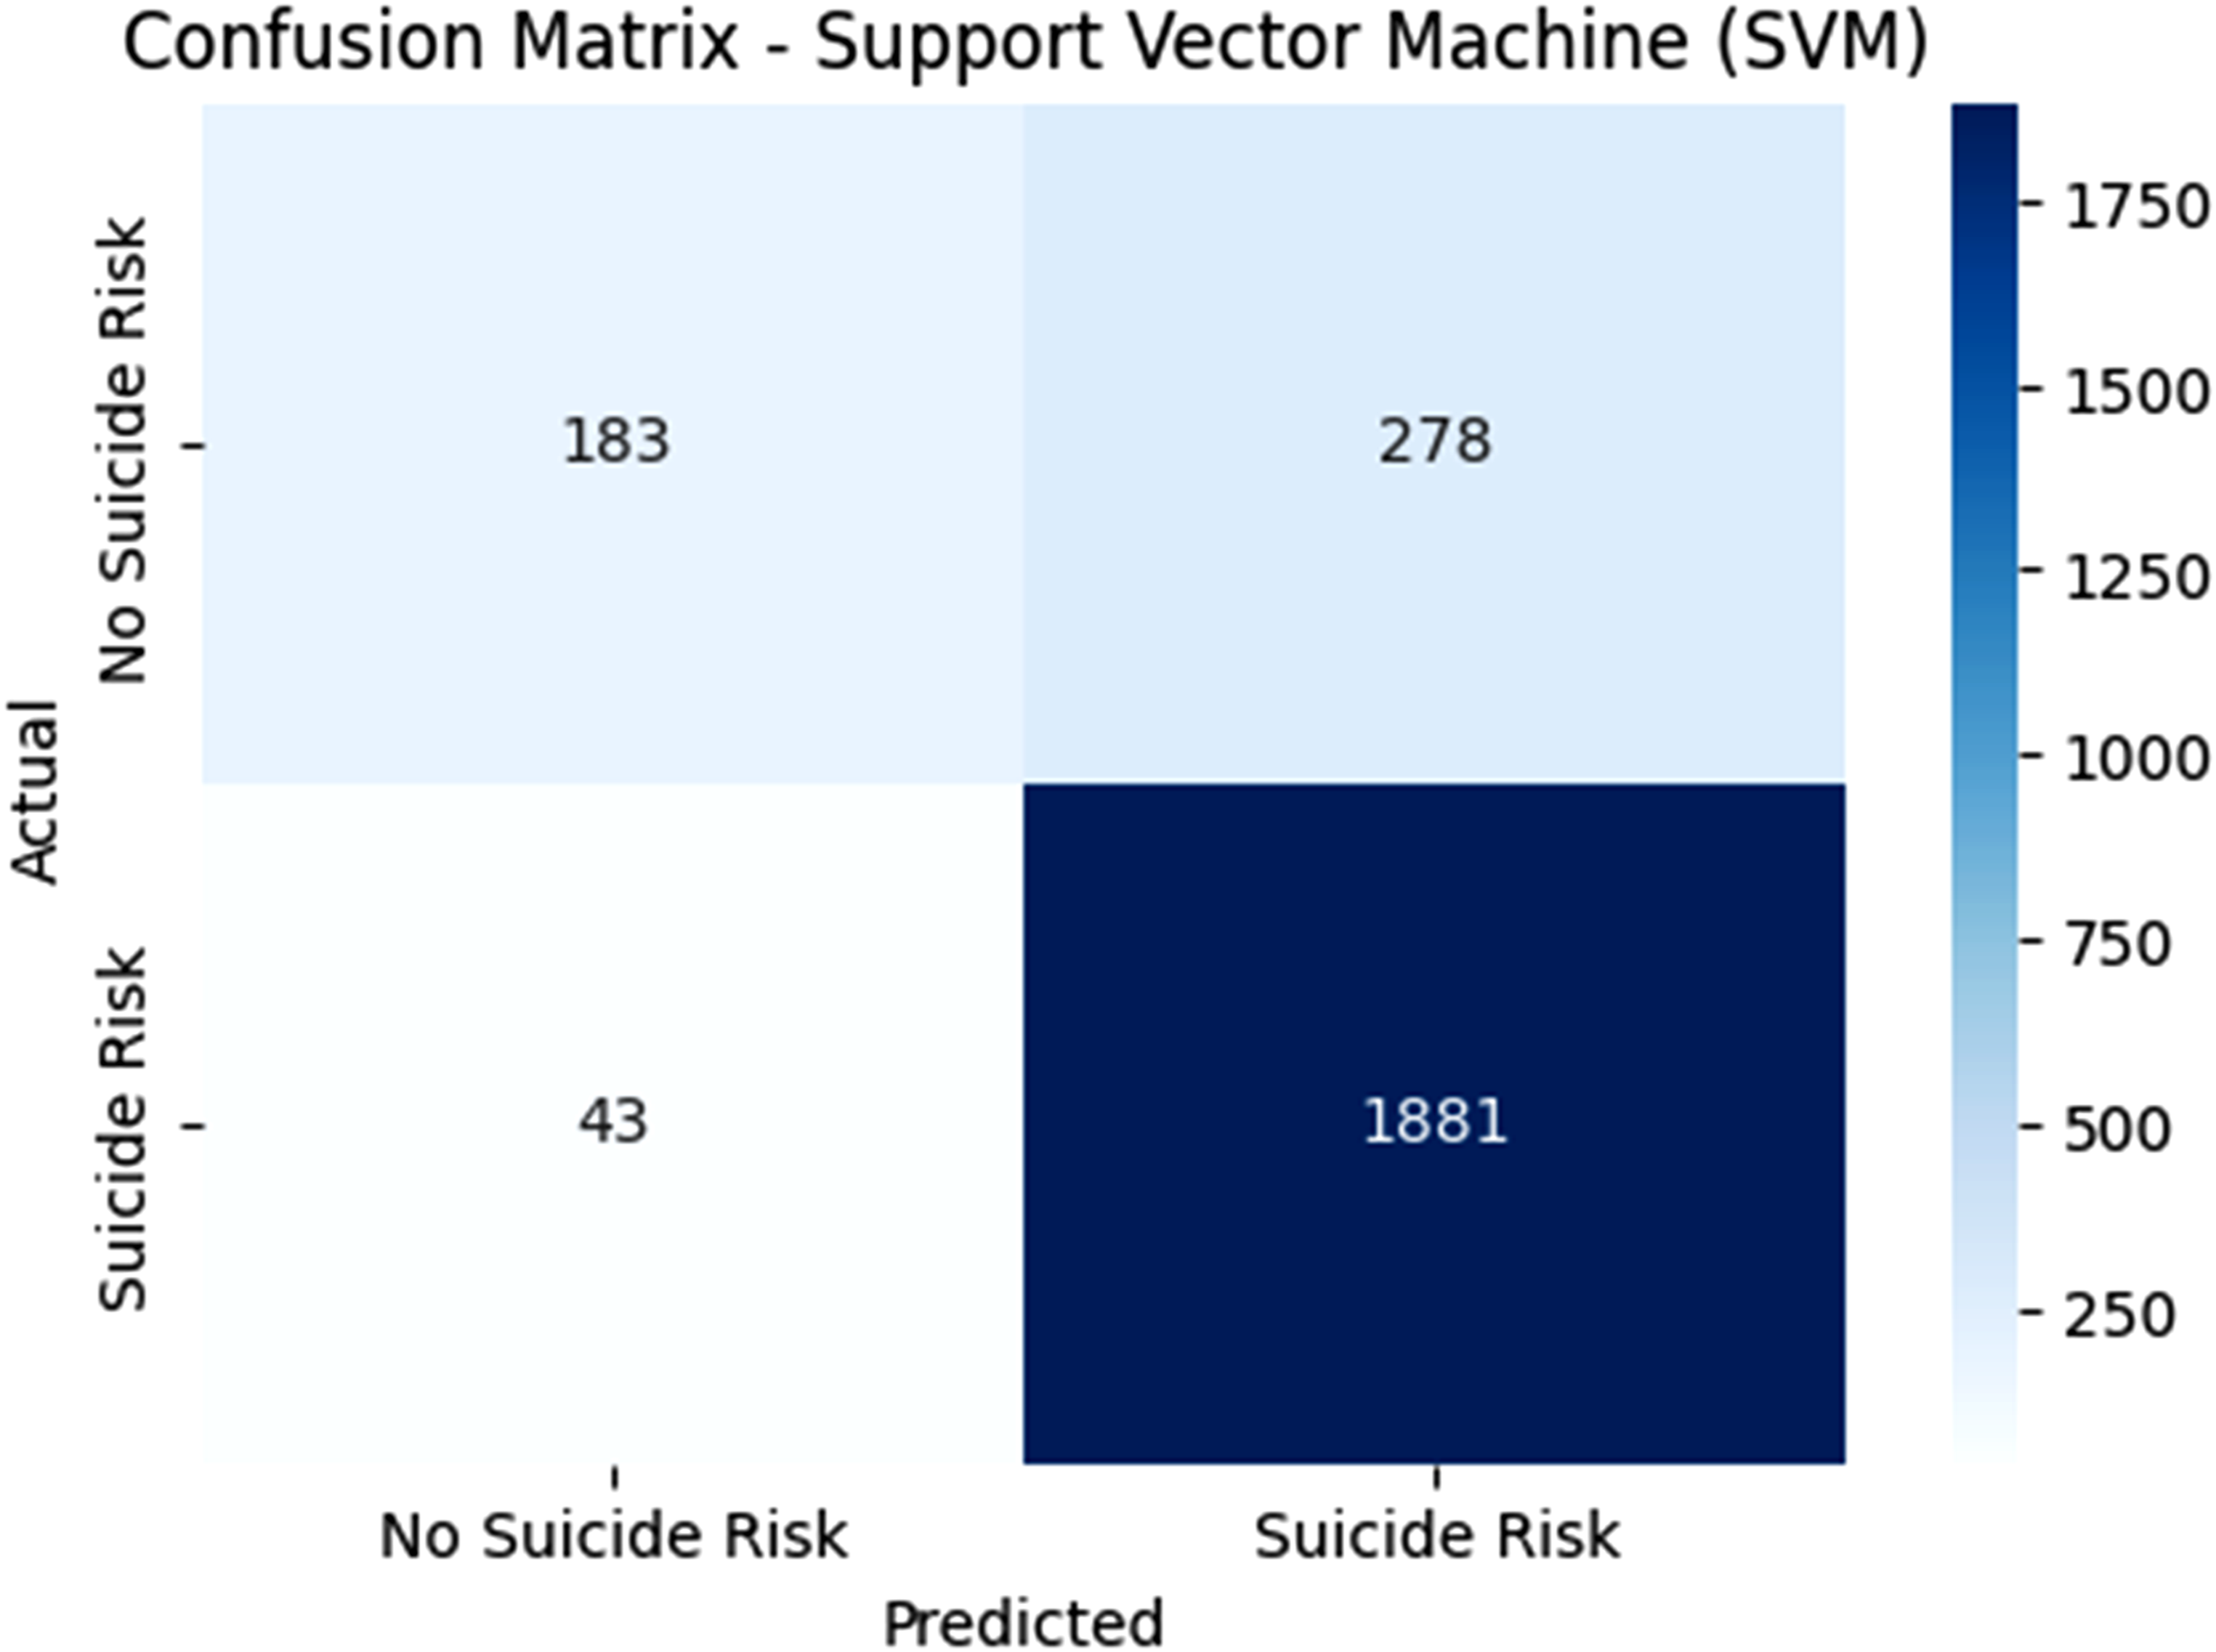
The confusion matrix given in Figure 8 demonstrates how well a KNN algorithm functions to forecast suicide risk. Out of all model classifications, the TP group amounts to 147 medical assessments, while the TN group represents 1840 successful at-risk patient identifications. Many individuals received incorrect high-risk predictions based on 314 FPs, whereas 84 at-risk cases went undetected as FNs. This suicide risk prediction model delivers 83% accuracy together with a 98% recall representation of suicide risk cases and 31.9% specificity, which represents various FPs. The model demonstrates limited reliability during positive prediction yet demonstrates high incorrect identification rates for non-risk population members. The F1-score stands at 0.92, which shows effective precision-recall equilibrium. The KNN model provides a lower specificity, and a slightly elevated false negative rate compared to RFC and SVM models, which decreases its capability for true-false positive distinction. Within the KNN predictive model, high-risk patient detection proved robust, yet the analysis of non-risk instances produced inadequate results. Though KNN operates inadequately as a singular prediction model, its usage results could be merged with other approaches to improve overall forecasting accuracy. The confusion matrix for KNN classifier model.
The GBC confusion matrix in Figure 9 indicates the model correctly detected 283 non-risk patients along with 1863 suicide-risk patients yet incorrectly identified 178 non-risk individuals as at-risk and failed to identify 61 at-risk patients. The model exhibits 90% accuracy 96.8% recall, and 91.3% precision for identifying suicide risk cases, although its specificity comes at 61.4%, leading to false classifications of non-risk individuals. Among various prediction models, GBC demonstrates excellent trade-offs between suicide risk classification accuracy and prevented missed cases, providing reliable solutions in this scenario. Together with its strong performance, the GBC delivered accurate results in both risk assessments and reduced errors. The confusion matrix for gradient boosting classifier.
The summary of the performance metrics of all machine learning models used.
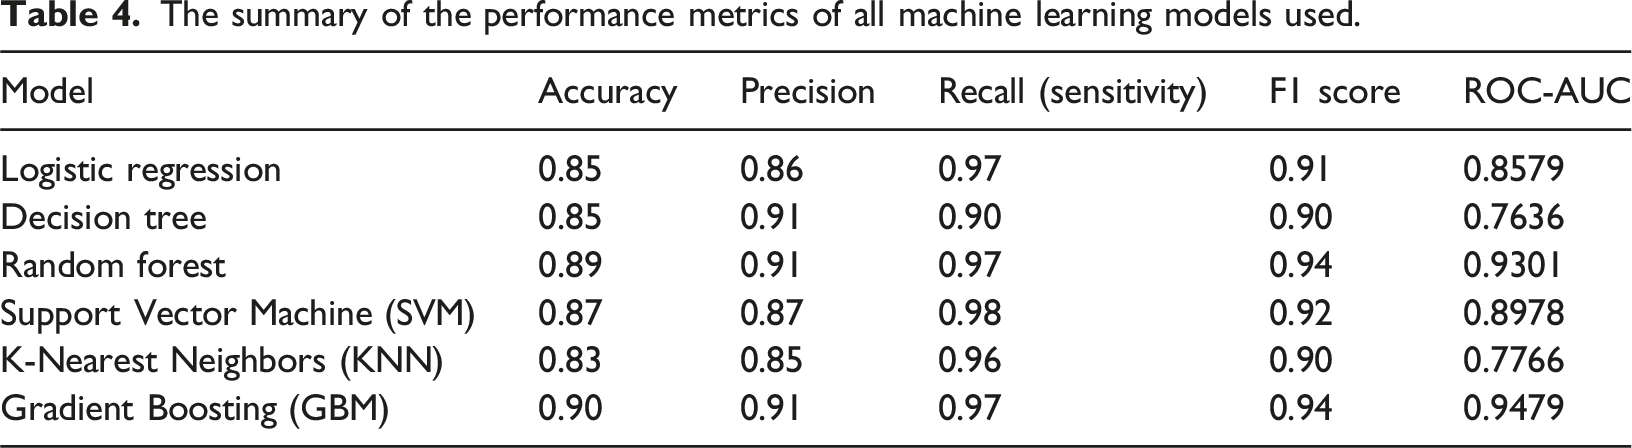
The Receiver Operating Characteristics (ROC) curve presented in Figure 10 is consistent with the summary metrics in Table 4. The GBM model exhibited the strongest curve, closely followed by Random Forest achieving high AUC values of 0.94 and 0.93, respectively. These models demonstrate superior ability to balance sensitivity and specificity across classification thresholds. Logistic Regression (AUC = 0.858) and SVM (AUC = 0.898) displayed moderate performance, with curves showing clear but less pronounced separation from the diagonal. The K-Nearest Neighbors (AUC = 0.777) and Decision Tree (AUC = 0.764) produced weaker curves closer to the chance line, reflecting more frequent misclassifications. Overall, these ROC results confirm that ensemble methods provide the most reliable discrimination of suicide risk in this dataset, emphasizing their advantage over linear or instance-based classifiers. ROC curves for all models demonstrating AUC values.
Discussion
This study employs data from a cross-sectional analysis, the NHANES to examine the feasibility of developing ML models to predict patients with chronic diseases at high risk of suicide. Unlike previous studies that primarily focused on a limited range of variables, the present study employs an integrative strategy by focusing on a wide range of demographic, clinical, and psychosocial variables. The broader picture facilitates the identification of key risk determinants and improving risk assessment methods.
The findings confirm the power of current ML models, particularly GBC and RFC, to predict individuals with high suicide risk. Of all the models examined, GBC worked best with a receiver operating characteristic curve (ROC-AUC) of 0.9479. RFC also demonstrated excellent predictive ability with a ROC-AUC of 0.9301. These models could capture nonlinear associations and intricate interactions between risk factors very well and thus were very suitable for the analysis of high-dimensional data.
The DTC model, though slightly lower in accuracy compared to RFC and GBC, had robust predictive capability with an ROC-AUC of 0.7636. Though not the most accurate, its interpretability gives it significant value in the clinical environment, where transparent decision-making is critical.
Several predictors involved marital status, earnings, alcohol consumption, smoking, and age. Notably, alcohol consumption was common among 77.6% of the population in question, and 36% were current smokers – both easily modifiable risks to which public health interventions could be addressed. Underlying medical illnesses like hypertension (34.9%) and diabetes (9.2%) were also notably linked with an elevated risk of suicide.
In a 2022 meta-analysis and systematic review, the accuracy of ML models for predicting suicidal attempts, deaths, and ideation was estimated. The meta-analysis concluded that such models demonstrated pooled AUC accuracy of 0.86, which indicates good predictive strength. This speaks highly of ML ability to offer a better capacity to detect suicide risk than other statistics. 30 In a study using regularized logistic regression for suicide prediction across three datasets, the average AUROC was 0.879 on the dataset. 31
A systematic review indicated that the top-performing ML algorithms, such as RFC and SVM, had average AUROCs above 0.8 in predicting suicidal ideation and behavior. The same study identified that boosting algorithms, like GBM, also had average AUROCs above 0.8, reflecting excellent predictive performance. 32 The results agree with previous studies establishing the effectiveness of ML-based models for predicting suicide, which outperform traditional statistical methods such as logistic regression. For instance, previous studies using Least Absolute Shrinkage and Selection Operator (LASSO) regression obtained an AUC of approximately 0.85 for 90-days suicide attempt prediction. 14 The better performance of GBC and RFC in the present study indicates their possible usefulness for large-scale, heterogeneous datasets with multiple predictor variables. 33
A key limitation of this study is missing data handling. Case exclusions were made where patients did not show key variables such as depression screening, substance usage, sleep disorders, or overall decline in medical health. Although this reduced the sample size, the final data was ensured to be biased. Moreover, not all of the available features present for suicide risk monitoring were utilized for the study, whereas top 20 were selected for categorical distribution of high and low suicide risks. Future studies may concentrate on using other important variables that also play a role in determining suicide risk in a patient.
Furthermore, the models developed in this study should be viewed as a proof of concept rather than a ready-to deploy clinical decision tool. This method can be used to flag patients presenting with suicide risk symptoms such as chronic illness, psychological distress, etc. However, clinical translation requires not only predictive performance but also interpretability. In conclusion, this study can be used to early on detect and diagnose suicide risk patients which need further medical guidance for treatment and mental stability. The novelty of the research lies in the fact that non nutritional variable were considered to diagnose suicide risk patients using a model approach. Multiple models were compared from which GBM performed the best to monitor the patients early on.
Also, this study extends previous research in suicidal risk assessment by adding psychosocial variables like depression, employment status, and history of military service to the predictive model. These are known to be major suicide risk drivers, and their addition to ML models provides a more holistic and sophisticated method of patient risk stratification.
Conclusion
The findings of this research also underscore the need of cutting-edge AI, such as ML approaches, to detect suicidal tendencies in individuals with long-term illnesses. RFC and DTC have proposed AI-based approaches to benchmark ML algorithms for suicide risk prediction in high-risk individuals with high accuracy when using a dataset from EMRs. These models provide a more proficient and evidence-based way of working that aligns the healthcare provider’s actions with those of the patient, leading to a more efficient way of working that optimizes patient care and output. The demographic, clinical, and lifestyle data examined in the present study clearly indicate that a few variables must be considered to avoid suicide. Thus, the complementary involvement of physical health parameters, psychosocial stressors, and behavioral data offers a more comprehensive perspective of the patient risk profile.
Footnotes
Funding
The author received no financial support for the research, authorship, and/or publication of this article.
Declaration of conflicting interests
The author declared no potential conflicts of interest with respect to the research, authorship, and/or publication of this article.