
Abstract
Background
In China, adherence to screening colonoscopy among eligible individuals remains suboptimal, primarily due to cost concerns and potential adverse effects. A machine learning model utilizing complete blood count (CBC) data could help prioritize colonoscopy referrals and improve screening participation.
Method
This multicenter study included participants who underwent CBC testing within three months before colonoscopy. CBC data were classified into three types (A, B, and C) based on hematology analyzer capabilities, with Type C excluded from analysis. Using Types A and B, we developed a stacking machine learning model incorporating 24 CBC features and 5 combined CBC components to predict colorectal cancer (CRC). Model performance was evaluated using the area under the curve (AUC), specificity, and sensitivity.
Results
The study included 1795 CRC cases and 26,380 cancer-free individuals with CBC data. On external validation, the model achieved 80.3% specificity and 65.2% sensitivity. Notably, it demonstrated 41% sensitivity for Stage I CRC and 57.6% sensitivity for Stages I–III combined.
Conclusions
CBC testing, combined with electronic medical record data, is a low-cost and widely accessible tool. Our robust CRC risk prediction model can serve as a preliminary screening method, aiding in colonoscopy referral decisions and improving CRC screening efficiency.
Keywords
Introduction
Colorectal cancer (CRC) represents a significant public health challenge in China, ranking as the second most prevalent cancer and fourth leading cause of cancer-related mortality. 1 While colonoscopy screening every 5–10 years for individuals ≥45 years old can significantly reduce CRC incidence and mortality, 2 China's compliance rates remain below 50% due to socioeconomic disparities and limited healthcare access.3–5 This screening gap underscores the urgent need for cost-effective, non-invasive alternatives. Although emerging technologies like stool DNA tests and cfDNA assays show promise,6,7 their high cost prohibits widespread adoption. Thus, the development of innovative, cost-effective, and user-friendly screening options is essential to promote greater participation in colonoscopy.
The complete blood count (CBC), known as the routine blood test in China, represents one of the most widely performed clinical laboratory tests nationwide, with an estimated 600 million tests conducted annually. Nearly all adults undergo CBC testing at least yearly for general health assessments, making it an ideal candidate for population-wide colorectal cancer (CRC) screening. Emerging evidence demonstrates the diagnostic and prognostic value of CBC-derived parameters in CRC, including established indices like red blood cell distribution width (RDW), hemoglobin concentration, and platelet count. Furthermore, composite inflammatory markers derived from CBC, particularly the neutrophil-to-lymphocyte ratio (NLR) and platelet-to-lymphocyte ratio (PLR), have demonstrated significant prognostic value in oncology.8–11 However, the potential diagnostic value of additional CBC-derived composite markers remains underexplored, and the synergistic diagnostic performance achievable through comprehensive integration of multiple CBC features with composite markers has not been systematically evaluated. These limitations highlight the need for more sophisticated analytical approaches to fully exploit the diagnostic potential embedded within routine CBC parameters.
Machine learning (ML) has emerged as a powerful approach for data mining and pattern recognition in biomedical research. However, the generalization capability of data-driven models is frequently compromised by multiple confounding factors. Technical variations, including differences in testing instruments, batch effects, and inter-institutional protocols, along with biological heterogeneity stemming from demographic factors such as ethnicity, gender, and age, 12 collectively limit the clinical utility of CBC data for CRC screening applications. These inherent challenges have significantly constrained the effective implementation of CBC-based machine learning models in diagnostic workflows and clinical practice to date. These factors limit the CBC data formally utilized for CRC screening, aiding in diagnosis, and other clinical practices thus far.
In this study, we developed a robust colorectal cancer (CRC) risk stratification model by leveraging electronic medical record (EMR) data from complete blood count (CBC) tests. Our approach employs an stacked ensemble methodology13,14 that integrates multiple random forest base learners, thereby enhancing generalization capability across distinct clinical settings. The rest of this paper is organized as follows: section Methods detail the multi-center dataset and stacked model architecture; Section Results present performance comparisons with existing methods; Section Discussion discusses clinical implications and limitations; Final section concludes with future directions.
Method
Subjects
Figure 1 shows the workflow of this study. Participants were collected from eight hospitals mainly in south and east China (Table S1) from 2015 to 2021. Individuals diagnosed as CRC or adenomatous polyps with a diameter ≥0.5 cm through colonoscopy and pathology in China multicenter were included. CBC and demographic datasets were collected from EMR. Individual inclusion criteria: (1) Individuals underwent colonoscopy; (2) Age ≥25 years; (3) Had a CBC records before colonoscopy within 0–6 months; (4) Colonoscopy revealed lesions with polyp diameter ≥0.5 cm; (5) Histological diagnosis confirmed primary colorectal cancer or adenomatous polyps. Individual exclusion criteria: (1) Individuals underwent emergency colonoscopy; (2) History of blood transfusion within 3 weeks prior to the blood routine test; (3) Failed colonoscopy procedure; (4) Pregnant women; (5) Blood routine test conducted more than 3 days after colonoscopy.

Flow chart of the study design.
Data preparation
Based on the classification capability of the hematology analyzer, CBC data were categorized into three types: A, B, and C, with C type being excluded. Category A: Identified by the presence of nucleated red blood cell count and 26 parameters reported. Category B: Identified by the absence of nucleated red blood cell count but with white blood cells divided into five categories: neutrophils, eosinophils, basophils, monocytes, and lymphocytes, comprising 23 parameters. Category C: Characterized by the categorization of white blood cells into granulocytes, lymphocytes, and monocytes, with 19–21 parameters, often used in smaller clinic.
We used category A data with 713 CRC cases and 4106 cancer free individuals as the training set for the model, category B data with 206 CRC cases and 10,091 cancer free individuals as the tuning set, and category A and B data from different centers as independent external validation sets (Figure 1). Input data included sex, age, 24 CBC items and 5 combined CBC components: neutrophil count/lymphocyte count (NLR), monocyte count/lymphocyte count (MLR), platelet count/lymphocyte count (PLR), neutrophil count × platelet count/lymphocyte count (NPLR), and monocyte count × platelet count/lymphocyte count (MPLR). Missing values were imputed using autoimpute.imputations, MiceImputer in python.
Model development
In this study, the positive CRC samples size is much smaller than the negative samples. We employed under sampling of negative samples to reduce the impact of imbalanced data that may lead to a biased model. 15 Random forest sub-models with different CRC diagnostic sensitivities and specificities were trained and we prioritized high specificity sub-models for CRC diagnosis. The ratio of positive to negative samples during the training of each sub-model is determined by the performance of the model on different category CBC data, genders, and individuals over 50 years old, with the endpoint criteria of specificity ≥80% and sensitivity ≥50%. Five-fold cross-validation was leveraged to optimize the parameters and evaluate each random forest sub-model. Finally, all random forest sub-models are stacked to establish a CRC risk prediction model that combines an anemia feature hematocrit. See Supplementary information for the detailed framework of the stacking model.
We also established random forest model (RF), logistic regression model (Logist), decision tree (DT), gradient boosting decision tree (GBDT), and support vector machine model (SVM) with a 1:1 ratio of positive to negative samples for comparison with the performance of the Stacking model developed in this study. Evaluation metrics included specificity, sensitivity, AUC, and accuracy.
Statistical analysis
Data analyses were conducted using Python version 3.6.8 and R version 4.1.3. Continuous variables with skewed distributions were presented as median with interquartile range and compared using the Mann–Whitney U test or Kruskal–Wallis H test. Categorical variables were presented as numbers with percentages and compared using the Chi-square test or Fisher's exact test. The AUCs were used to evaluate the predictive power, and the optimal cutoff value was established by maximizing the Youden index (sensitivity + specificity - 1). A two-tailed P value < 0.05 was considered statistically significant.
Results
CBC profiles differ substantially between category A and B
A total of 1795 CRC cases and 26,380 cancer free individuals were included. The training set consisted of 713 CRC cases and 4106 cancer-free individuals, and 206 CRC cases and 10,091 cancer-free individuals with category B data were assigned as tuning set. External validation set comprised 2977 category A data samples and 10,082 category B data samples (Figure 1, Table 1). Comparison between CRC and cancer-free groups in the training set showed that all 31 features showed significant statistical differences (P < 0.05). However, in the tuning set, there were no differences between CRC and cancer-free groups in white blood cell count, eosinophil count and percentage, mean corpuscular volume, and platelet mean volume. Additionally, all features of the cancer-free group in the training set (category A) showed significant statistical differences compared to the cancer-free group in the tuning set (category B, P < 0.05).
Characteristics of the training, tuning and validation datasets.

* Significant statistical differences (P < 0.05) for 31 features between CRC and cancer-free groups in the training.
# Significant statistical differences (P < 0.05) for all CBC components of the cancer-free group between the training set (category A) and tuning set (category B, P < 0.05).
Combined components improved the accuracy of single CBC indicator in distinguishing CRC
By conducting ROC analysis on the 29 CBC components in the training set, category A validation set, and category B dataset, respectively, the indicators of iron-deficiency anemia, HGB, and HCT ranked in the top five for CRC detection accuracy (AUC) in all three datasets (Figure 2(a) to (c)). The inflammation indicator LYMPH% and combined components also demonstrated strong abilities to identify CRC (Figure 2(a) to (c)). The five CBC components in Figure 2(a) and (b) had AUC values greater than 0.7 for identifying CRC, but the accuracy significantly decreased in the category B dataset (Figure 2(c), Table S2). Furthermore, the five combined components improved the accuracy of single inflammation indicator in distinguishing CRC (Table S2).

Accuracy of CBC components on colorectal cancer detection in the training set (a), category A validation set (b), and category B dataset (c).
Stacked random forests improve CRC risk prediction, detecting over half of early-stage cases—outperforming single Ml models
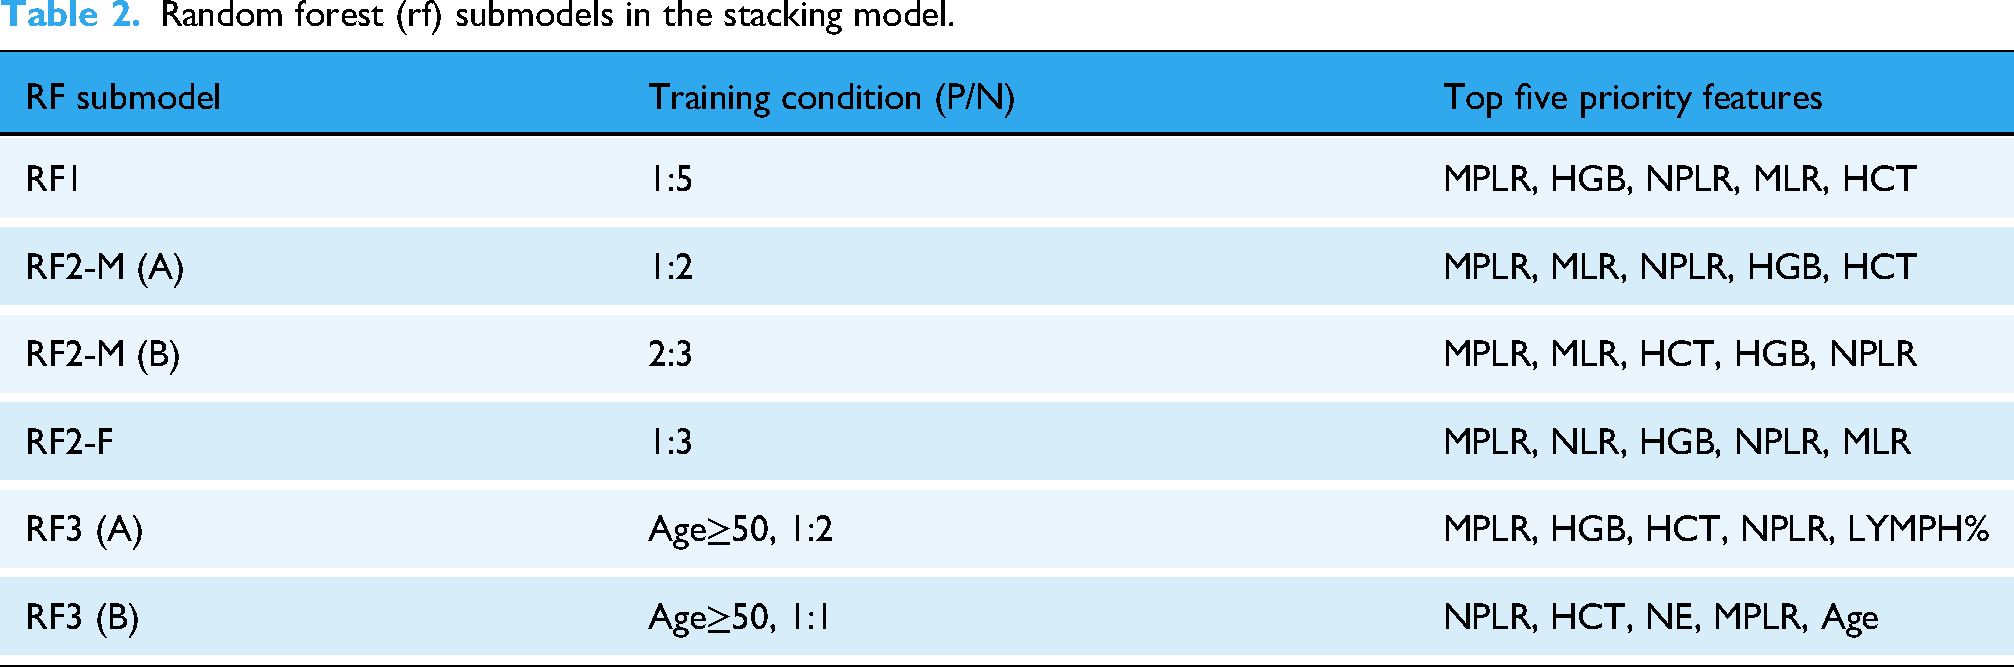
In this study, we ultimately generated six RF sub-models to construct stacking models for predicting CRC risk levels using CBC data (Table 2). The stacking model for category A data consisted of RF1, RF2-M (A), RF2-F, and RF3 (A), while the stacking model for Category B data comprised RF1, RF2-M (B), RF2-F, and RF3 (B). The most important features in all RF sub-models included the indicators of iron-deficiency anemia, HGB, or HCT, along with combined features MPLR and NPLR, with MPLR having the highest contribution in most of RF sub-models (Table 2).
Random forest (rf) submodels in the stacking model.
The outputs of the CRC risk prediction model are categorized as “-”, “±”, “+”, “++”, and “+++”, representing different levels of CRC risk. “-” indicates no apparent abnormalities, “±” and “+” indicate low and moderately low CRC risk levels, suggesting varying degrees of iron-deficiency anemia, while “++” and “+++” indicate high CRC risk levels, suggesting immune abnormalities and/or iron-deficiency anemia. This studies a CRC risk level equal to or higher than “+” is considered positive. The CRC risk prediction model was applied to predict the CRC risk levels of participants aged 30 and above in each dataset. The results showed that our CRC prediction stacking model achieved a specificity of 80.3% and a sensitivity of 65.2% on external validation set. The stacking model had an AUC of 0.76, specificity of 86.3%, and sensitivity of 66.4% in the external validation set of category A. In the tuning set of category B, the AUC was 0.69, with a specificity of 83.8% and sensitivity of 54.4%. In the external validation set of category B, the AUC was 0.71, with a specificity of 78.9% and sensitivity of 62.3%. Sensitivity for CRC stage I was 41% and 57.6% from stage I to III. The stacking model showed better generalization capability than the five ML models (Table 3).
Accuracy of CRC risk prediction stacking model and other five machine learning model in tuning and validation datasets.

Abbreviation: RF, random forest; DT, decision tree; Logist: logistic regression; GBT, gradient boosting trees; SVM, support vector machine; Acc, accuracy; Spe, specificity; Sen, sensitivity. AUC, area under the curve.
Discussion
Our CRC risk prediction model achieved an AUC of 0.71–0.76 in external validation, demonstrating 54.4–66.4% sensitivity overall and 41% sensitivity for Stage I CRC (Table 3). The overall sensitivity of 57.6% for stages I–III compares favorably with commercial fecal immunochemical tests (64.6% sensitivity), 7 suggesting CBC-based testing could effectively identify over half of early-stage CRC cases without additional interventions.
The selection of stable features and our risk-stratified modeling approach represent key points in our study. Unlike traditional CBC-based models focusing primarily on iron-deficiency anemia markers (e.g., HGB, HCT), we incorporated five inflammatory response indices (NLR, MLR, PLR, NPLR, MPLR) derived from lymphocyte counts – which ranked among the top 5 most predictive individual features across all datasets (Figure 2). This dual focus aligns with current understanding of CRC pathophysiology, where both anemia 16 and inflammation 17 play significant roles. While previous studies have reported diagnostic value in various CBC components,16,18–23 we observed notable inconsistencies in feature performance between our category A and B datasets, particularly for WBC count and MCV. These variations, potentially attributable to regional or technical differences, underscore the challenges in developing generalizable CBC-based detection models.
Our stacked modeling approach specifically addresses technical variations between hematology analyzers (Table 1), which significantly impacted both individual feature performance (Table S2) and model predictions (Figure 2). We constructed multiple random forest sub-models with varying specificity by adjusting the positive:negative subsampling ratio for CRC risk stratification. Although the highest-specificity model exhibited the lowest sensitivity, it achieved the lowest false-positive rate, and subjects predicted as positive by this model carried the highest CRC risk. The specificity threshold was progressively reduced, with the lowest-tier sub-model set at 80% to meet clinical requirements. Additionally, we incorporated HCT—a marker of iron-deficiency anemia and high CRC risk—as a gatekeeper for the entire model. Even if a subject tested negative across all sub-models, the system would recommend colonoscopy if HCT levels suggested iron-deficiency anemia.
Compared to ColonFlag 21 – the only other multi-national validated CBC model – our approach offers several distinctions. While ColonFlag relies heavily on age and anemia indicators, our model integrates inflammatory markers and shows superior performance in datasets where age demonstrates lower predictive value. Our CRC detection model represents a comprehensive assessment of immune abnormalities, hypercoagulability, and anemia characteristics within the body. Like ColonFlag,22–26 our model could potentially identify CRC cases missed by FOBT and improve screening participation through EHR integration. Despite a 20% false positive rate (Table 3) in our model, there will be cases in the 20% individuals with potential disease like iron-deficiency anemia or immune abnormalities warning by our CRC risk prediction model.
Study limitations
It is important to note that the retrospective design necessitates prospective validation against FOBT to assess real-world impact on screening rates. While addressing technical variations, regional/ethnic heterogeneity in our China-only dataset requires further evaluation.
Conclusions
Our study demonstrates that comprehensive CBC analysis can provide an accessible, low-cost approach for CRC risk stratification, detecting 65% of cases including early-stage disease. While insufficient as a standalone diagnostic, this approach could significantly improve screening participation by: 1. Serving as a non-invasive first-line screening tool; 2. Identifying high-risk individuals for colonoscopy referral; 3. Maintaining generalizability across different laboratory systems. Future work should focus on prospective validation in diverse populations and integration with existing screening programs.
Supplemental Material
sj-docx-1-dhj-10.1177_20552076251362072 - Supplemental material for Stacked random forest model for colorectal cancer detection using complete blood counts
Supplemental material, sj-docx-1-dhj-10.1177_20552076251362072 for Stacked random forest model for colorectal cancer detection using complete blood counts by Junfeng Luo, Weiwei Tan, Shaobo Chen, Yijing Chen, Ya Fu, Xiaojuan Jing, Lingling Kang, Qingyun Li, Zhenjian Ma, Tingji Sun, Peng Xiao, Shigui Xue, Xiaozhi Wang and Houde Zhang in DIGITAL HEALTH
Footnotes
Acknowledgements
We thank all study participants and their families and the investigators and members of the following hospital: Nanshan Hospital, Shenzhen Guangming District People's Hospital, The People's Hospital of Longhua, Shenzhen Bao'an People's Hospital, Sichuan Suining Central Hospital, The University of Hong Kong-Shenzhen Hospital, Shantou Central Hospital, and Shanghai Shuguang Hospital.
Ethical approval
The study was conducted according to the guidelines of the Declaration of Helsinki and approved by the Institutional Review Board of the Nanshan Hospital (KY-2021-006-01, 26 April 2021). Informed consent is not applicable for this retrospective study.
Contributiorship
Conceptualization, H.Z. and J.L.; methodology, H.Z., J.L. and X.W.; validation, X.W. and J.L.; formal analysis, J.L.; data curation, J.L., W.T., S.C., Y.C., Y.F., X.J., L.K., Q.L., Z.M., T.S., P.X. and S.X.; writing—original draft preparation, H.Z, and J.L.. All authors have read and agreed to the published version of the manuscript.
Funding
This work was Supported by Municipal Financial Subsidy of Nanshan District Medical Key Discipline Construction.
Declaration of conflicting of interests
The authors declare no conflicts of interest.
Data availability statement
The data presented in this study are available on request from the corresponding author due to legal restrictions.
Supplemental Material
Supplemental material for this article is available online.
References
Supplementary Material
Please find the following supplemental material available below.
For Open Access articles published under a Creative Commons License, all supplemental material carries the same license as the article it is associated with.
For non-Open Access articles published, all supplemental material carries a non-exclusive license, and permission requests for re-use of supplemental material or any part of supplemental material shall be sent directly to the copyright owner as specified in the copyright notice associated with the article.