
Abstract
Objectives
To simultaneously estimate how the risk of incident dementia nonlinearly varies with the administration period and cumulative dose of benzodiazepines, the duration of disorders with an indication for benzodiazepines, and other potential confounders, with the goal of settling the controversy over the role of benzodiazepines in the development of dementia.
Methods
The classical hazard model was extended using the techniques of multiple-kernel learning. Regularised maximum-likelihood estimation, including determination of hyperparameter values with 10-fold cross-validation, bootstrap goodness-of-fit test, and bootstrap estimation of confidence intervals, was applied to cohorts retrospectively extracted from electronic medical records of our university hospitals between 1 November 2004 and 31 July 2020. The analysis was mainly focused on 8160 patients aged 40 or older with new onset of insomnia, affective disorders, or anxiety disorders, who were followed up for
Results
Besides previously reported risk associations, we detected significant nonlinear risk variations over 2–4 years attributable to the duration of insomnia and anxiety disorders, and to the administration period of short-acting benzodiazepines. After nonlinear adjustment for potential confounders, we observed no significant risk associations with long-term use of benzodiazepines.
Conclusions
The pattern of the detected nonlinear risk variations suggested reverse causation and confounding. Their putative bias effects over 2–4 years suggested similar biases in previously reported results. These results, together with the lack of significant risk associations with long-term use of benzodiazepines, suggested the need to reconsider previous results and methods for future analysis.
Introduction
Dementia is a currently incurable disorder that leads to a large socioeconomic burden, and thus, the importance of primary prevention of dementia by reducing its risk has been recognised. Among risk factors for dementia, long-term use of benzodiazepines (BZDs) has drawn attention as a modifiable factor in recent years. Numerous studies have assessed the risk of dementia onset associated with the BZD use with increasingly elaborated study designs. In addition to the enrollment of larger numbers of patients to study cohorts, variables for finer risk assessment, such as cumulative doses of short-acting and long-acting BZDs, have been included in the analyses. Nevertheless, there is still inconsistency among the results of recent studies, and the causal role of BZDs in the development of dementia has remained controversial. While more than a half of previous observational studies up to 20201–14 from different countries and two meta-analyses15,16 indicated a positive association between long-term BZD use and dementia risk, a recent meta-analysis and three recent large studies reported lack of statistical significance of the association.13,14,17,18 Furthermore, the interpretation of previous results is particularly difficult because of potential bias due to reverse causation (protopathic bias) between dementia onset and prodromal symptoms with an indication for BZD use, such as insomnia. One of the recent large studies examined this bias by stratifying the studied population, and reported no significant risk. 18
A technical limitation of these studies is their reliance on linear statistical analysis. In a linear statistical analysis, typically the logarithm of the hazard rate of dementia onset or odds ratio between treatment groups is assumed to depend on binary options such as current use of BZDs, or to grow linearly in proportion to the values of continuous variables such as cumulative dose of BZDs. Drug effects are, however, usually nonlinear, as represented by a typical drug’s dose–response curve which saturates in the high-dose range. Bias effects that should be adjusted are also nonlinear, as represented by the increased risk of disease onset shortly, rather than long after the onset of its prodromal symptoms. Recent studies11,19 partially resolved this issue by introducing a spline function that described nonlinear dependence of the hazard rate on the cumulative dose of BZDs, namely, a ‘nonlinear risk function’, and showing a positive risk associated with only low cumulative doses, which they discussed as protopathic bias. Although this approach potentially allows us to probe the nature of risks and biases associated with BZDs with greatly improved precision, it still suffers limitation. In the analysis of nonlinear effects of BZDs, one naturally asks fundamental questions, such as, whether dementia onset is best explained by a nonlinear function of the cumulative dose of BZDs, or is better explained by a nonlinear function of a confounding factor or a source of protopathic bias, such as the duration of the disorders for which BZDs may be prescribed. Or one may ask how the risk of dementia onset is nonlinearly associated with BZD use, if nonlinear protopathic biases are adjusted. To answer such a question, one needs to use multiple nonlinear risk functions in the statistical analysis. The use of multiple nonlinear risk functions, however, makes the problem harder, because it incurs larger statistical errors and raises another issue concerning the choice of the variables for which nonlinear dependency is considered. Previous approaches were severely limited in this regard.
In the present study, we addressed the above issue, using a framework developed for machine learning. In machine learning, the use of multiple nonlinear functions in statistical analysis and selection of a small number of relevant functions among many candidates have been studied intensively. ‘Multiple kernel learning’
As we used only nonlinear risk functions for cumulative doses of BZDs and related drugs, we obtained a result similar to the previous result. 11 Further analysis with more candidate nonlinear functions, however, revealed more prominent, temporally varying risk over a rather long time associated with the administration period of short-acting BZDs and the durations of insomnia and anxiety disorders, while we detected no significant risk associated with long-term use of BZDs in the same analysis. These results suggested that analyses of dementia risk associated with BZD use performed in previous studies were likely to have been affected by confounding and reverse causation originating from the use of short-acting BZDs and prodromal symptoms, and that the causal role of long-term use of BZDs in the development of dementia is questionable.
Methods
Study design, data source and enrollment of patients
The present study was a population-based retrospective cohort study performed at the Department of Pharmacology and the Clinical Trial Research Centre of the School of Medicine, Nihon University between 1 February 2022 and 31 August 2022. Retrospective cohorts were constructed from Nihon University School of Medicine’s Clinical Data Warehouse (NUSM’s CDW), a centralised, anonymised database that records demographic information, diagnoses, prescribed medications and laboratory data of patients who attended three hospitals affiliated with Nihon University between 1 November 2004 and 31 July 2020. Patients of our university hospitals were typically, but not always, local patients who were referred by a local clinician. Unlike patients of large hospitals in many other countries, a substantial proportion of these patients continued to be regularly and holistically cared for over a long period of time. We have observed previously reported clinical effects of drugs as well as unattended effects in over 10 previous analyses with this database (for reference, see the most recent ones30–32), and we therefore expected generalisable knowledge to be drawn from it.
As shown in Figure 1A, we extracted a study cohort from the electronic medical records of patients aged 40 years or older who had been regularly cared for over more than 2 years in our university hospitals, with intervals between prescriptions of less than 120 days. For each patient, the index date was defined as the later of the 180th day after the first visit and the 40th birthday. Patients who already had a record of diagnosed dementia (ICD10 code F00-03, G30, G31.0 and G31.8), a record of prescription of anti-dementia drugs, or a record of disorders that severely affect cognitive function (see Appendix 1), before the index date, were excluded. Then, the remaining patients were included in the study at the index date, and followed up until the patient stopped attending our hospitals regularly or was diagnosed with dementia. The date of diagnosis of dementia was determined from the record of diagnosis of dementia, with or without recorded prescription of anti-dementia drugs. If the dates of the diagnosis and prescription were different, the earlier of them was used.

Study cohorts, design of statistical model for analysis and flowchart of inference. (A) Flowchart of the extraction of study cohorts from NUSM’s CDW, a centralised database for anonymised electronic medical records of hospitals affiliated with Nihon University. In addition to basic demographic information of patients, information about drug prescriptions, laboratory test results and diagnoses of disorders were stored in the database. (B) Design of statistical model used for analysis. As illustrated in the panel, the logarithm of the hazard rate of dementia onset was modelled as the sum of linear and nonlinear risk functions of explanatory variables that represented, for instance, doses and administration periods of groups of drugs, values of laboratory test results and presence and durations of groups of disorders. The forms of the risk functions were statistically estimated, using the framework of multiple-kernel learning. (C) Flowchart of concrete procedures for statistical inference. AFD: affective disorder; AXD: anxiety disorder; CV: cross-validation; ML: maximum-likelihood; CI: confidence interval; NUSM's CDW: Nihon University School of Medicine's Clinical Data Warehouse.
For this cohort of patients, however, precise information about their exposure to BZDs was unavailable, because BZDs might have already been prescribed before the first visit. Thus, as we illustrated in Figure 1A, we further focused on a subcohort of patients who were newly diagnosed with a disorder for which BZDs are often prescribed, namely, insomnia (ICD10 code G47), affective disorders (ICD10 code F30–39) or anxiety disorders (ICD10 code F40–49). For this subcohort, we redefined the index date as the earlier of the date of the first diagnosis of these disorders and the date of the first chronic prescription of BZDs, Z-drugs or other hypnotics for over 14 days. Here, we included affective disorders, even though affective disorders are not a direct indication for BZD use, because these disorders are known to be a complication of dementia, and BZDs are often prescribed for associated anxiety symptoms. Since BZDs are unlikely to be used chronically for other disorders, we reasonably assumed that the patients in the subcohort had never used BZDs before the first visit, and hence, that precise information about their exposure to BZDs was available. It should be noted that we excluded patients with epilepsy, who might have used BZDs long term, at the time of the index date.
For both the cohort and subcohort defined above, the risk of dementia of Alzheimer type was assessed separately from that of dementia of any type. In the former case, the diagnosis of dementia of Alzheimer type was identified from the record of diagnosis with ICD10 code F00 or G30, and from the absence of diagnosis of dementia of any other type and Parkinson disease in any part of the patient record. In the analysis of dementia of Alzheimer type, the onset of Parkinson disease or dementia that did not satisfy the above diagnostic criteria was treated as censoring.
Design of statistical models for analysis
For the assessment of dementia risk, we used four statistical models. While these models determined the risk of dementia onset based on different sets of explanatory variables, they shared the same basic design. As illustrated in Figure 1B, explanatory variables for each model represented, for instance, doses and durations of prescribed medications, current and past results of laboratory tests, and presence and durations of disorders, and their values were obtained from the database for each time point of the observation period. Then, the model determined the logarithm of the hazard rate, namely, the instantaneous occurrence rate of dementia onset, for each patient and time point, as the sum of linear and nonlinear functions of one or two of these explanatory variables termed ‘risk functions’, whose functional forms were to be statistically estimated. Each of these estimated risk functions was associated with a function called ‘kernel’ that acted as building blocks for the estimated risk function. In the present study, the kernels were chosen to be either a linear function or a Gaussian function. Although we refer readers interested in the technical details of the kernel method to the literature, 33 we note that a linear kernel leads to only a linear risk function, and that a Gaussian kernel leads to a nonlinear risk function of arbitrary functional form with a certain degree of smoothness. Thus, analysis based on our multiple-kernel model with only linear kernels reduced to a conventional linear analysis, while incorporating Gaussian kernels into this linear setting naturally extended the analysis to a nonlinear one. A precise, mathematical description of the above model settings is provided in Appendix 3.
Based on the above basic design, we defined four statistical models for analysis with increasing numbers of explanatory variables and risk functions. The smallest model, which we called ‘linear model’, was designed to be the counterpart for those employed in classical epidemiological studies. This model included 37 explanatory variables, which were either variables for demographic information, manually selected variables indicating the presence or absence of previously known risk factors, a variable indicating the serum level of low-density lipoprotein (LDL) cholesterol or variables indicating current doses or ever (or non-) use of BZDs, Z-drugs and other hypnotics. The demographic information included age, age at entry, sex, date and body-mass index. The previously known risk factors included past history of cerebrovascular disease, ischaemic heart disease, Parkinson disease, hypertension, dyslipidaemia, epilepsy, affective disorders, anxiety disorders, diabetes mellitus and insomnia, and current use of muscarinic cholinergic antagonists with two different burden levels, anti-hypertensive agents, statins, anti-diabetic drugs, anti-platelet drugs, anti-coagulant drugs, anti-depressants and anti-Parkinson-disease drugs. As we defined variables for BZDs, we grouped BZDs into four categories whose member drugs had more or less distinct biological half-lives from those of the other categories [Table 1]. Hereafter, we called these BZDs, very-short-acting, short-acting, intermediate-acting and long-acting BZDs, respectively. Although we used more categories than the three categories used in previous studies, we did not expect this finer categorisation to seriously affect the detection power of the statistical analysis. Because most patients had used short-acting or long-acting BZDs [Table 1], the detection of significant risks associated with these two categories of drugs was a statistical problem of comparable scale to the one dealt with in previous studies, while we expected risks associated with the other two categories to be harder to detect. From this point of view, since the number of patients who had used hypnotics other than BZDs and Z-drugs was also smaller, we expected less significant results for this category as well.
Defined daily doses (DDs) and biological half-lives of active metabolites of BZDs and other hypnotics authorised by the Pharmaceutical and Medical Devices Agency of Japan (summary).

For comparison with other studies, DDs authorised by the anatomical therapeutic chemical (ATC) classification of drugs 36 are also shown, if available. In the two right columns, the numbers of patients in the cohort and subcohort who used the drugs are summarised.
As well as the explanatory variables and risk functions included in the linear model, the ‘MKL1’ model included nonlinear risk functions of cumulative doses of BZDs, Z-drugs and other hypnotics, being expected to serve as the counterpart for the model in the previous study. 11 To investigate the possibility that other variables related to BZD use better account for dementia onset, we included in the ‘MKL2’ model, nonlinear functions of administration periods and current doses of BZDs, Z-drugs and other hypnotics, nonlinear functions of the durations of insomnia, affective disorders and anxiety disorders, and a nonlinear function of the administration period of anti-depressant. The largest model, ‘MKL3’ model, included as many variables and nonlinear risk functions available from the database as possible.
For all of the four models, each explanatory variable was clipped to the narrowest range of values in which values of the variable except for the largest and smallest 1% potential outliers fell. Then, we standardised these clipped explanatory variables to have mean of zero and unit variance, and used them in further analysis. Further details of the explanatory variables and risk functions (kernels) included in each model are provided in Appendices 2, 4 and 5 and Table 4.
Kernels used for the linear and MKL1–3 models.
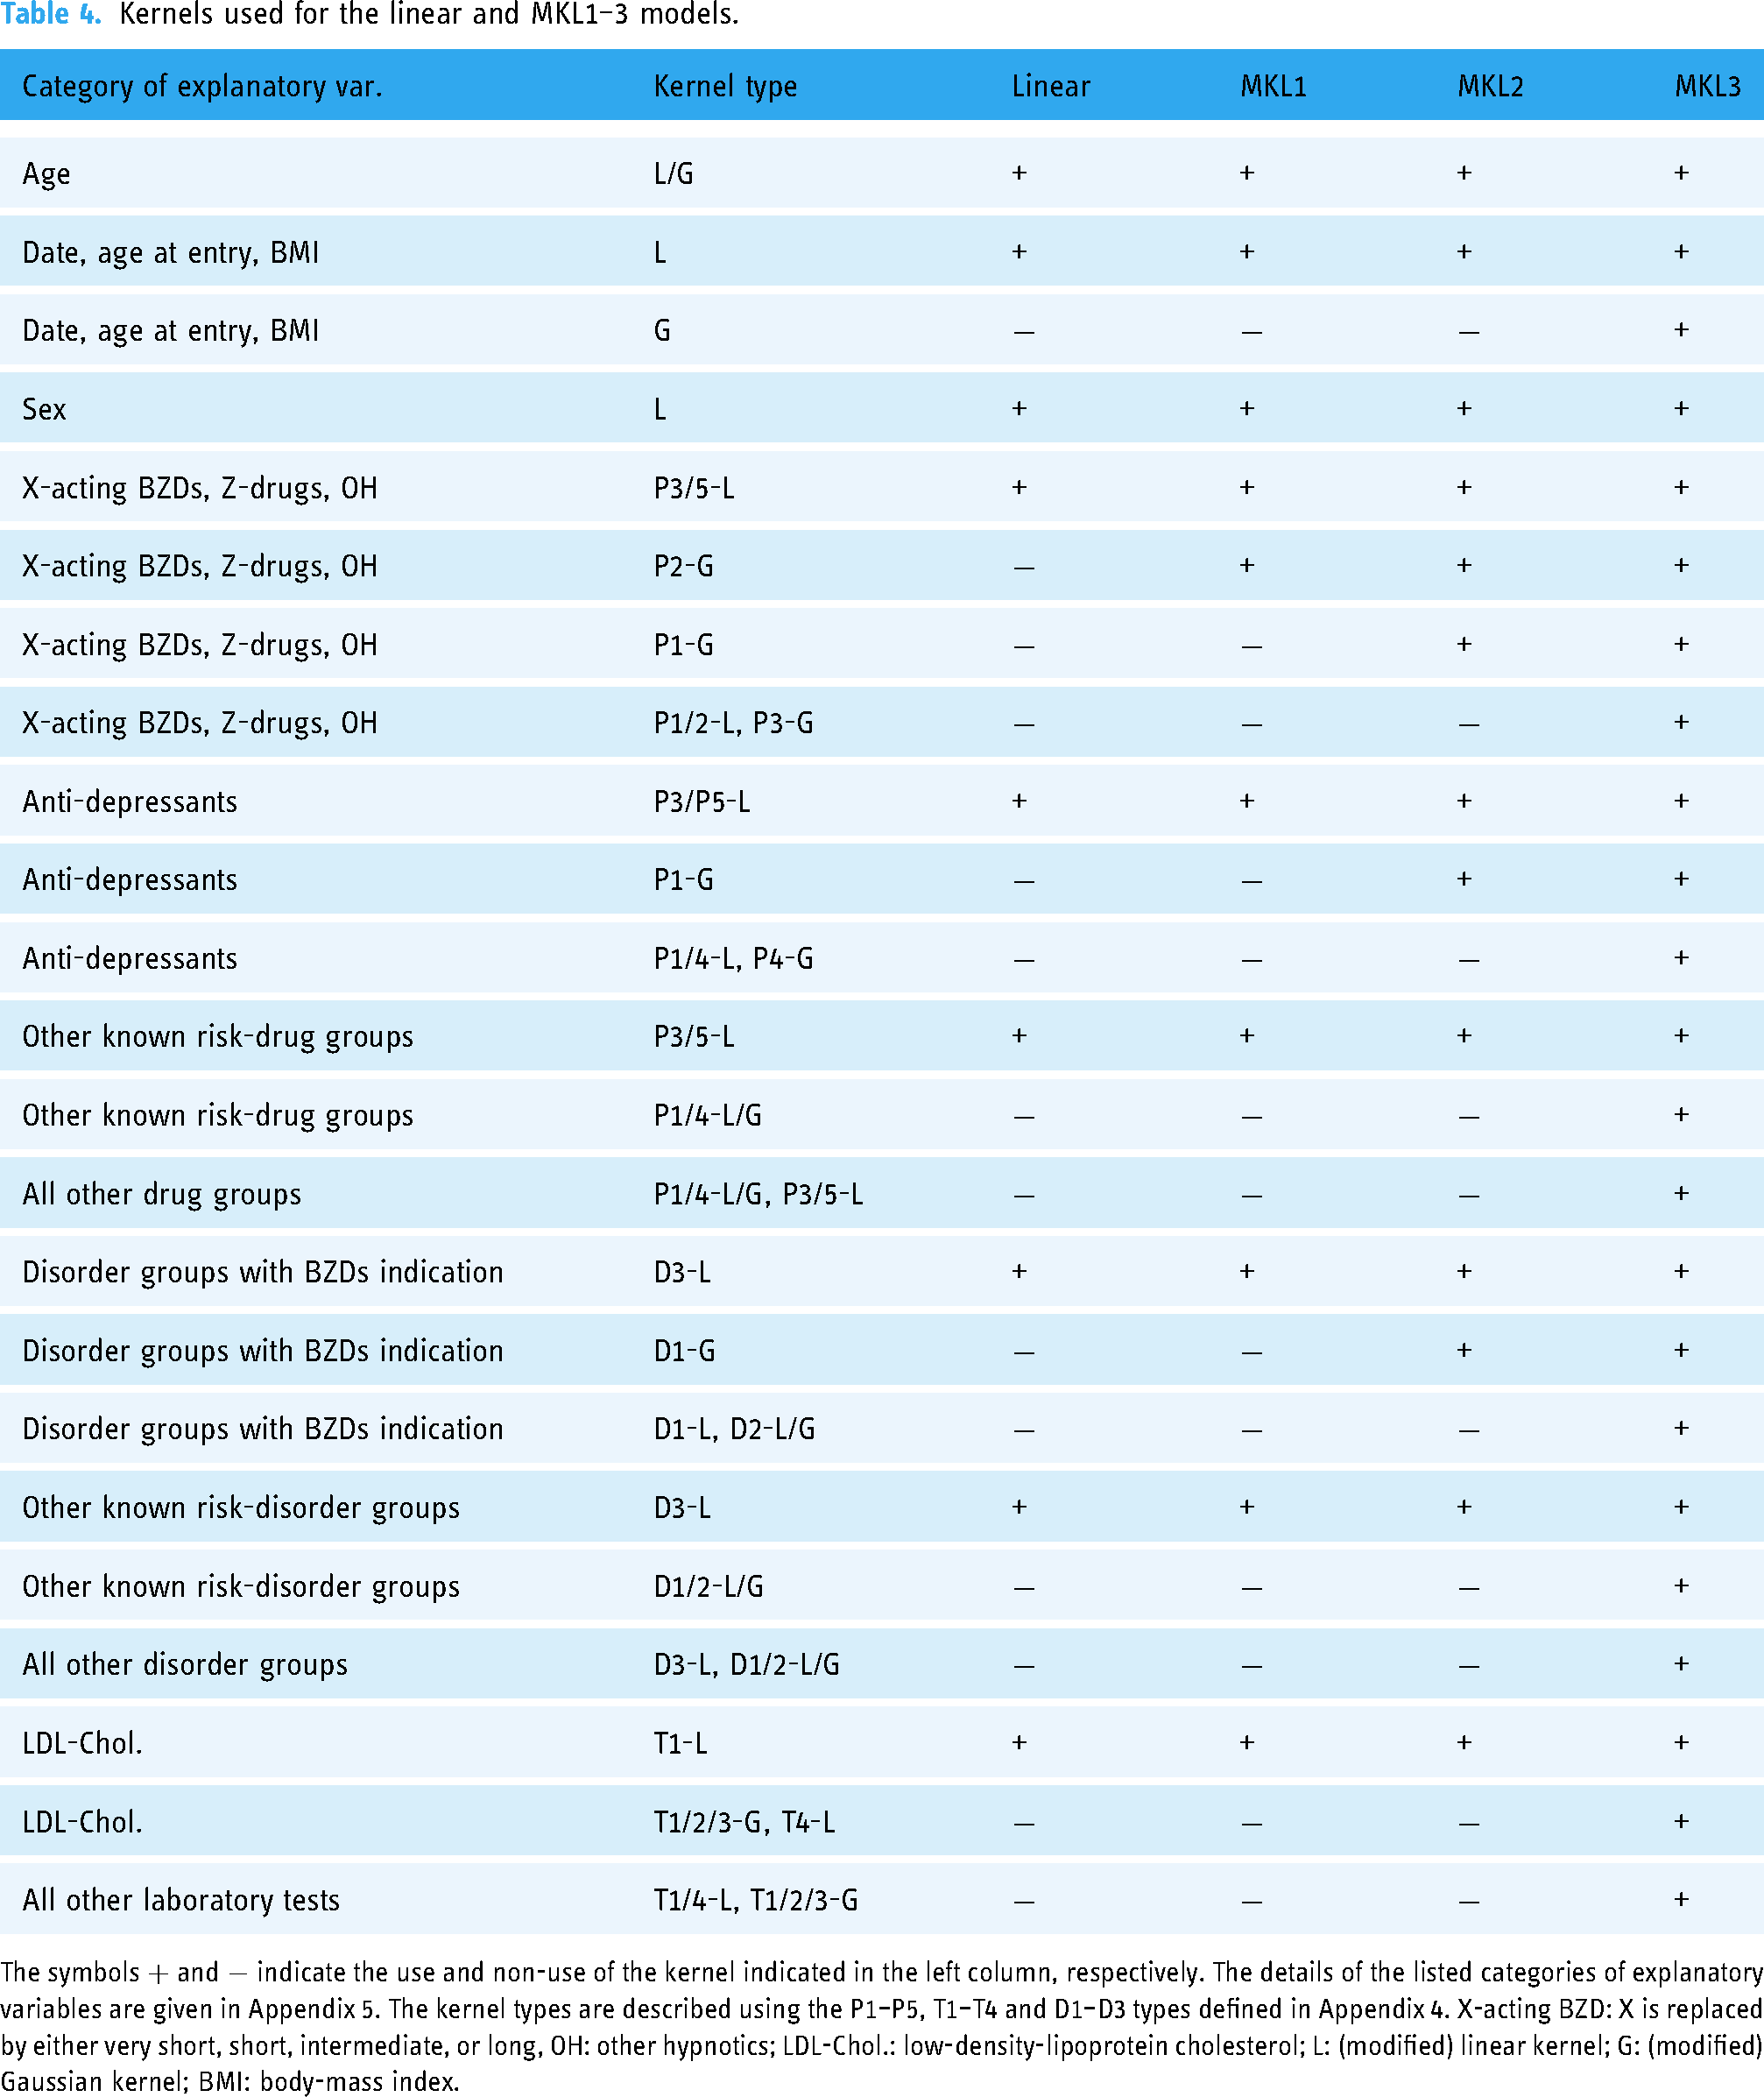
The symbols
Statistical analysis
To estimate the risk functions of the statistical models described above, we used the regularised maximum-likelihood approach. In this approach, we computed risk functions that maximised the sum of the log-likelihood of dementia onset in the dataset and a regulariser, the latter of which controlled the complexity of the risk functions. MKL was originally formulated as a model with constraints equivalent to a 1-norm regulariser 34 that allowed only a small number of candidate risk functions to take non-zero values, while forcing others to be zero. This sparsifying regulariser was appropriate for our purpose, because our purpose was to discern a small number of the most relevant explanatory variables that nonlinearly account for dementia onset. Previous statistical theories21–24 guaranteed that MKL with a 1-norm regulariser is likely to recover such a set of explanatory variables with a dataset of sufficient size, which is known as support consistency. Although estimation consistency, namely, the convergence of risk functions to the optimal ones in the infinite-sample-size limit, was shown for both 1-norm and 2-norm regularisers, estimation with a 1-norm regulariser was shown to control statistical errors more effectively than estimation with a 2-norm regulariser in a problem with a small sample size and a large number of explanatory variables and kernels. 24 In the present study, a few tens to a few hundreds of kernels were used for analysis of a dataset containing only 184 dementia patients and 85 Alzheimer-type dementia patients, and thus, estimation with a 1-norm regulariser was expected to be more suitable. However, because the number of kernels above which the 1-norm regulariser outperformed the 2-norm regulariser was not known in advance, we adopted both the 1-norm and 2-norm regularisers and compared their results. Although previous theories showed more favourable statistical properties for mixtures of 1-norm and 2-norm regularisers and adaptive 1-norm or nonconvex regularisers than for simple 1-norm and 2-norm regularisers in certain settings, the use of these regularisers markedly increases the computational cost for estimation and tuning of hyperparameters. Thus, we restricted our analysis to only cases with a simple 1-norm or 2-norm regulariser.
Although the maximum-likelihood approach has been recognised as a straightforward approach in medical statistics, 35 most previous epidemiological studies used classical or generalised Cox models that estimate risks by maximising a partial likelihood. The advantage of employing a Cox model lies in its properties that an arbitrary nonlinear function of time can be implicitly used as a baseline hazard, and that focusing on relative risks of patients only at the times of event occurrence reduces computational complexity. The present study, however, contrasted with previous epidemiological studies in that precise values of explanatory variables for each time point throughout the observation period could be found in our database. This precise temporal information is not utilised by Cox models. Furthermore, as MKL allowed us to estimate multiple nonlinear functions, the implicit use of a single nonlinear baseline hazard in the Cox models did not merit the loss of temporal information. For these reasons, we employed the more straightforward maximum-likelihood approach.
The concrete procedures in the regularised maximum-likelihood approach are summarised in the flowchart in Figure 1C and described in detail in the following sections. We repeatedly followed these procedures for each of the combinations of the statistical model, the type of target dementia and the choice of cohort.
Determination of values of hyperparameters based on 10-fold cross-validation
Our models had three hyperparameters whose values needed to be determined empirically. Two of these hyperparameters represented the strengths of the regularisers for risk functions constructed with linear and Gaussian kernels, respectively. The other hyperparameter represented the bandwidth of the Gaussian kernels for standardised explanatory variables, which controlled smoothness of the constructed risk functions. For determination of the values of the hyperparameters and further evaluation, we followed the standard 10-fold cross-validation (CV) procedure. Patients were randomly partitioned into fold 0–9. For each
Bootstrap test for test scores of two models and determination of best model
We determined the best model by systematically comparing the test scores described above. For comparison of the test scores of two models, we performed a bootstrap goodness-of-fit test. In this test, we repeatedly calculated the test scores of a tested model (larger model with a higher test score) and a null model (smaller model with a lower test score) for bootstrap datasets generated from the hazard rate estimated with the null model. Concretely, we probabilistically generated fictitious dementia onsets for all patients based on the hazard rate estimated with the null model, and prepared 10 bootstrap datasets. With each of these bootstrap datasets, we repeatedly performed 10-fold CV, using the same assignment of patients to the 10 folds as that used for the tuning of the hyperparameters. Then, comparing the distribution of the difference of the bootstrap test scores of the two models, we calculated p-value of the difference of the test scores for the original dataset. Since repeated CV is computationally demanding, we calculated the p-value, approximating the distribution of the differences of the bootstrap test scores with a Gaussian distribution. This Gaussian approximation was justified by a Shapiro-Wilk test.
The above goodness-of-fit tests have not been performed conventionally in the application of machine learning to medical data. However, such an evaluation of statistical errors in test scores is needed, in order to discuss the results of machine learning in comparison with those of conventional epidemiological studies. In machine learning studies, statistical tests are often performed to compare two sets of 10 likelihood scores for 10 test folds between the two compared models. This approach is sometimes convenient, but is not theoretically grounded. It was expected to have low power of detection of significance for our dataset and hence to be unsuitable, because the sizes of the partitioned test sets were too small as there were only 184 dementia patients in the analysed dataset, and the variance of the observation period and the number of dementia onsets among these test sets was relatively large. In conventional epidemiological studies, goodness-of-fit of two models is compared, using the likelihood ratio test or its bootstrap version. Our procedure described above is a straightforward extension of the bootstrap likelihood ratio test to regularised maximum-likelihood estimation with 10-fold CV, and is therefore suitable for our purpose.
Determination of confidence intervals of risk functions with bootstrap datasets
To evaluate the statistical error in the estimation of risk functions, we repeatedly performed the estimation using the values of the hyperparameters determined in the 10-fold CV, and with 500 bootstrap datasets generated by randomly resampling the same number of patients as in the original dataset. From the 500 estimates for each risk function, we calculated its 95% confidence intervals at different values of the argument variable.
Data and code availability
Most of the results obtained in the present study were summarised in Supplemental Figures 1 to 8. We have also attached the program codes used for the present study and a document describing how to use them. These will also be registered to the online code repository, Github, upon acceptance by the journal.
The original data used in the present study are not publicly available due to privacy and security concerns, especially because the detailed history of prescribed medication, laboratory tests and diagnoses in the input dataset for our program codes for analysis potentially allows identification of patients, even though patient identifiers were anonymised. Researchers who wish to perform further analysis on our dataset should contact the corresponding author. If the requested investigation abides by pertinent guidelines in terms of privacy, security and scientific merit, and is approved by the ethics committee of our university, access to the dataset will be provided.
Results
Characterisation of the cohorts
The characteristics of the extracted cohorts are summarised in Table 2. The size of the entire cohort was moderately large and around one third of the sizes of the previous largest study populations,14,18 and the size of the subcohort that focused on putative new users of BZDs was roughly the same as that of the previous study that performed nonlinear analysis of dementia risk of BZD use, 11 although the previous study did not focus on new users. The proportions of patients with comorbidities with known risks were comparable to those in previous studies, regardless of the difference that our study population was taken from medical records of university hospitals. These previously reported risk factors were found more frequently among patients who developed dementia during the observation period. The length of observation in our study was moderately long compared to previous studies, and, as a notable feature of our dataset, detailed history of prescriptions, diagnoses, and laboratory tests throughout the observation periods of the patients was available. We therefore expected more temporally precise information about dementia risk to be drawn from the data, within the limits determined by the length of observation.
Characteristics of the populations in the cohort and subcohort are summarised in the table.
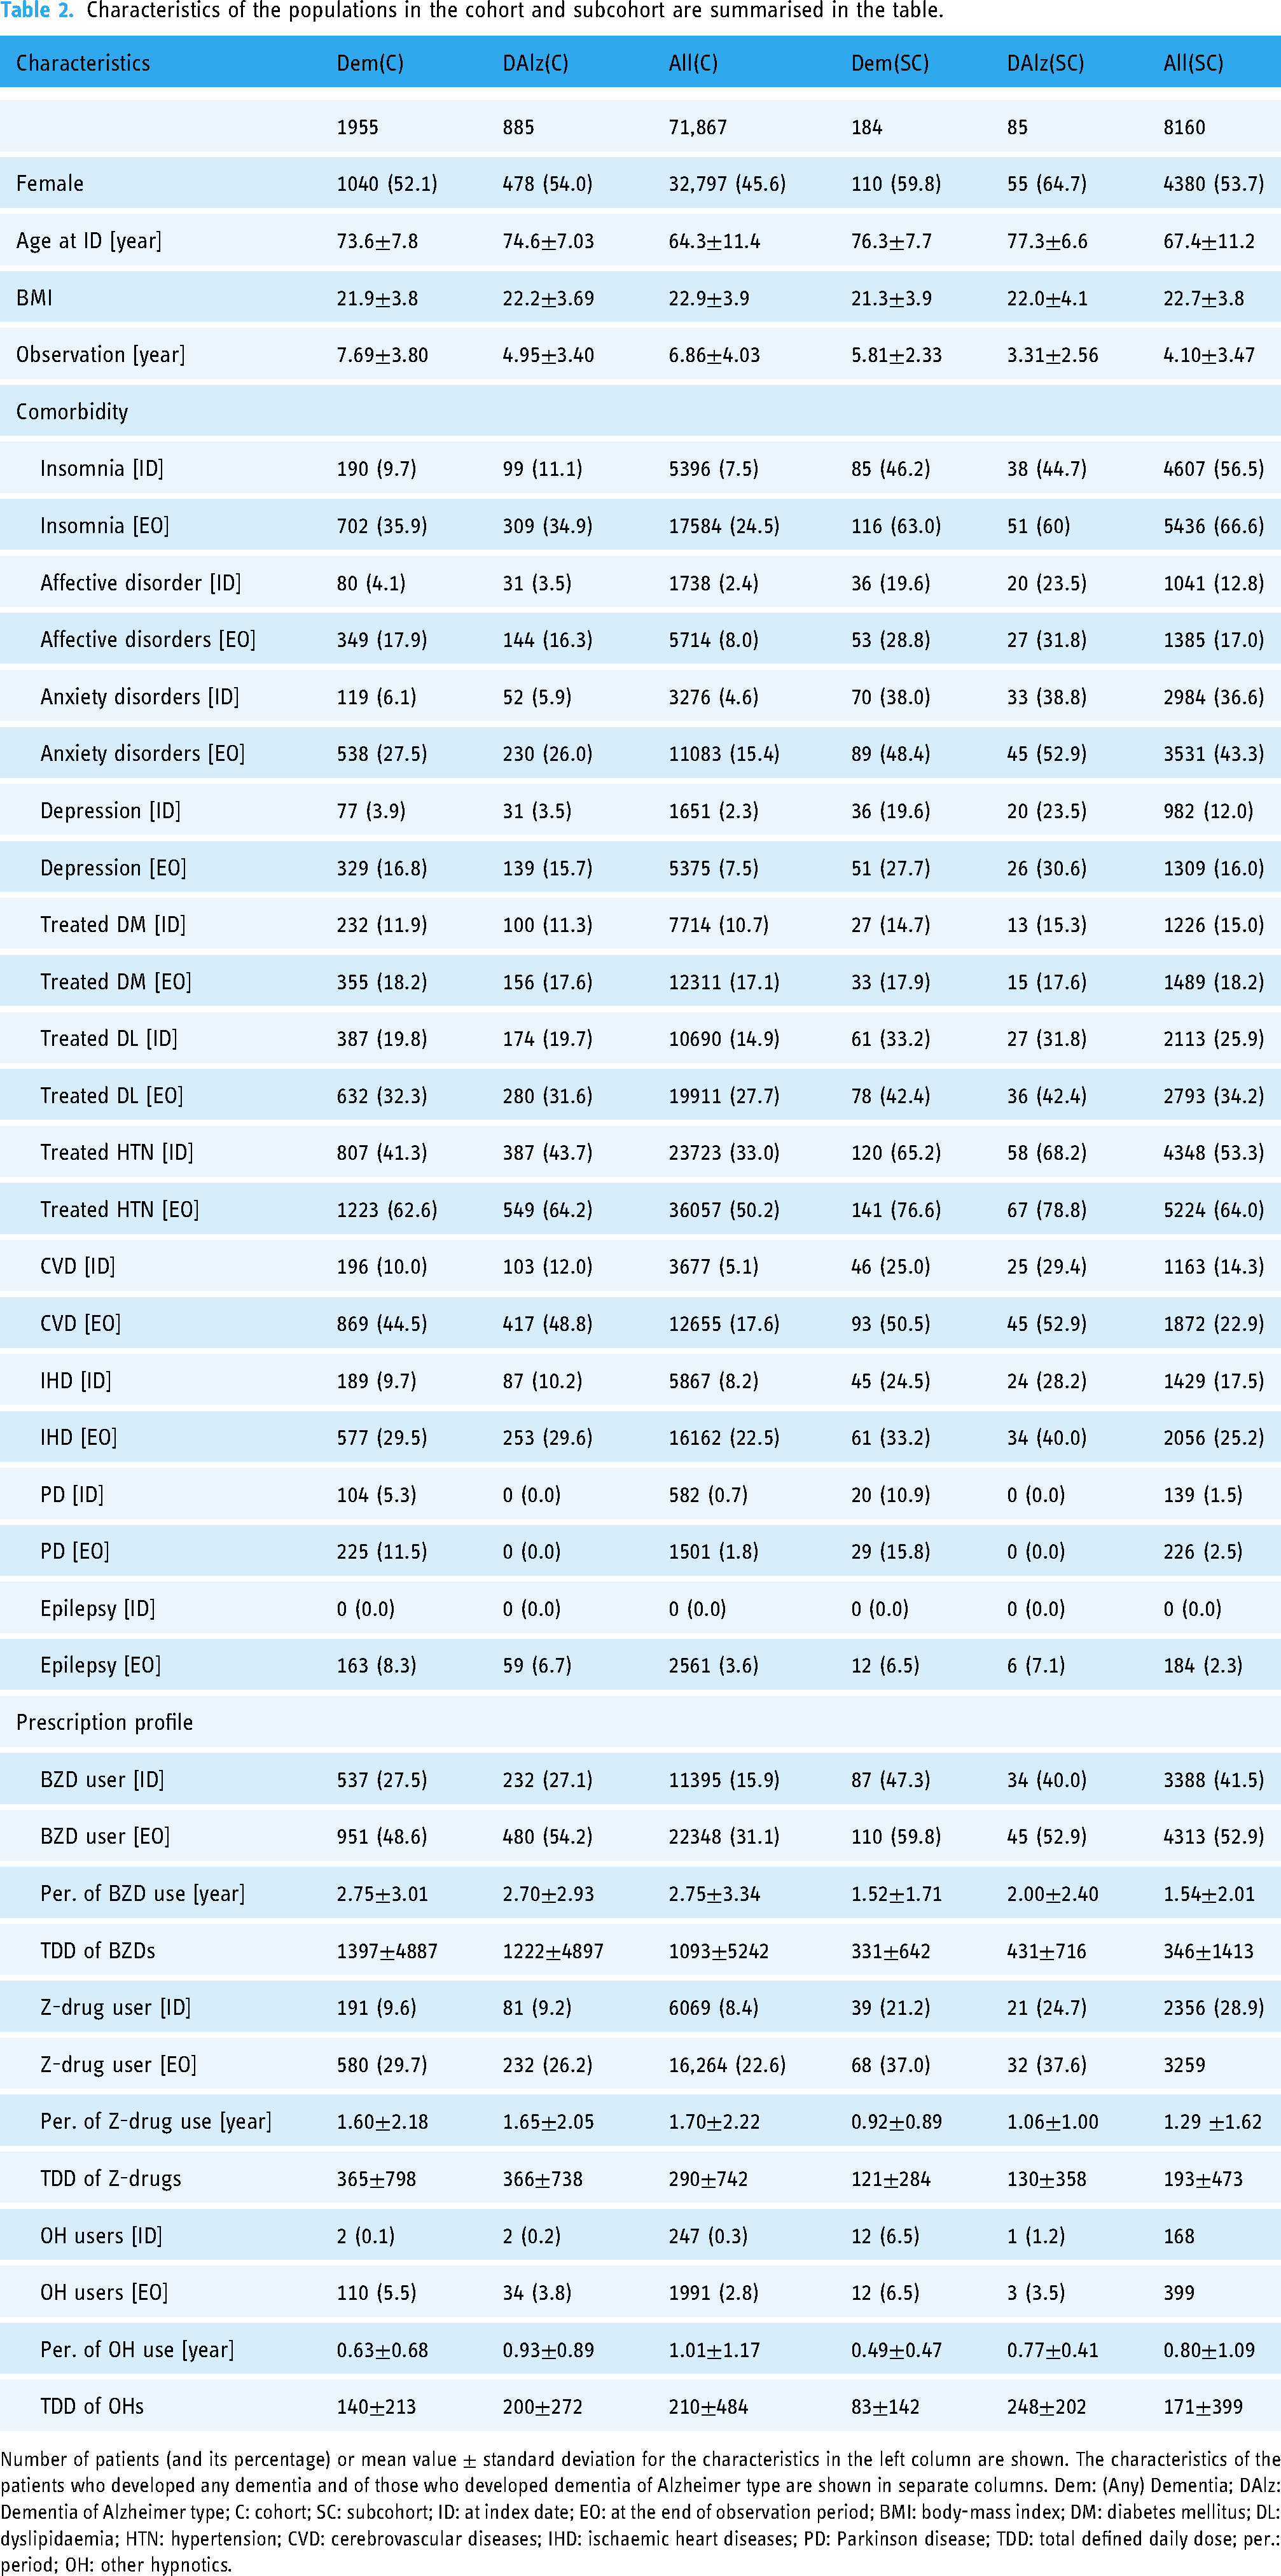
Number of patients (and its percentage) or mean value
Goodness-of-fit of models
The goodness-of-fit of the models is shown in Figure 2. From the results for the entire cohort [Figure 2 A and C], we confirmed that the linear model fitted the data significantly better than did a simple ‘base model’ that predicted dementia onset based only on the date, age, age at entry, body-mass index and sex. The predictive performance of the linear model under two different types of regularisers showed almost no difference. From the results for the subcohort [Figure 2 B and D], we found that, regardless of the type of regulariser and target dementia, MKL2 significantly outperformed the linear and MKL1 models, while the performance of MKL1 was consistently poorer than that of the linear model. Concerning MKL3, we found that its predictive performance under 1-norm regularisation was much better than those of the other models in the risk estimation for any dementia onset, while it was poorer for the onset of dementia of Alzheimer type. Comparing the two types of regularisation, we found that 2-norm regularisation generally brought out better performance from the linear, MKL1 and MKL2 models than did 1-norm regularisation in the risk estimation for any dementia onset, while performances with the two regularisers showed the opposite for the onset of dementia of Alzheimer type. As expected from statistical theories,21–24 we observed that the performance of the MKL3 model with a large number of risk functions was much poorer under 2-norm regularisation than under 1-norm regularisation.
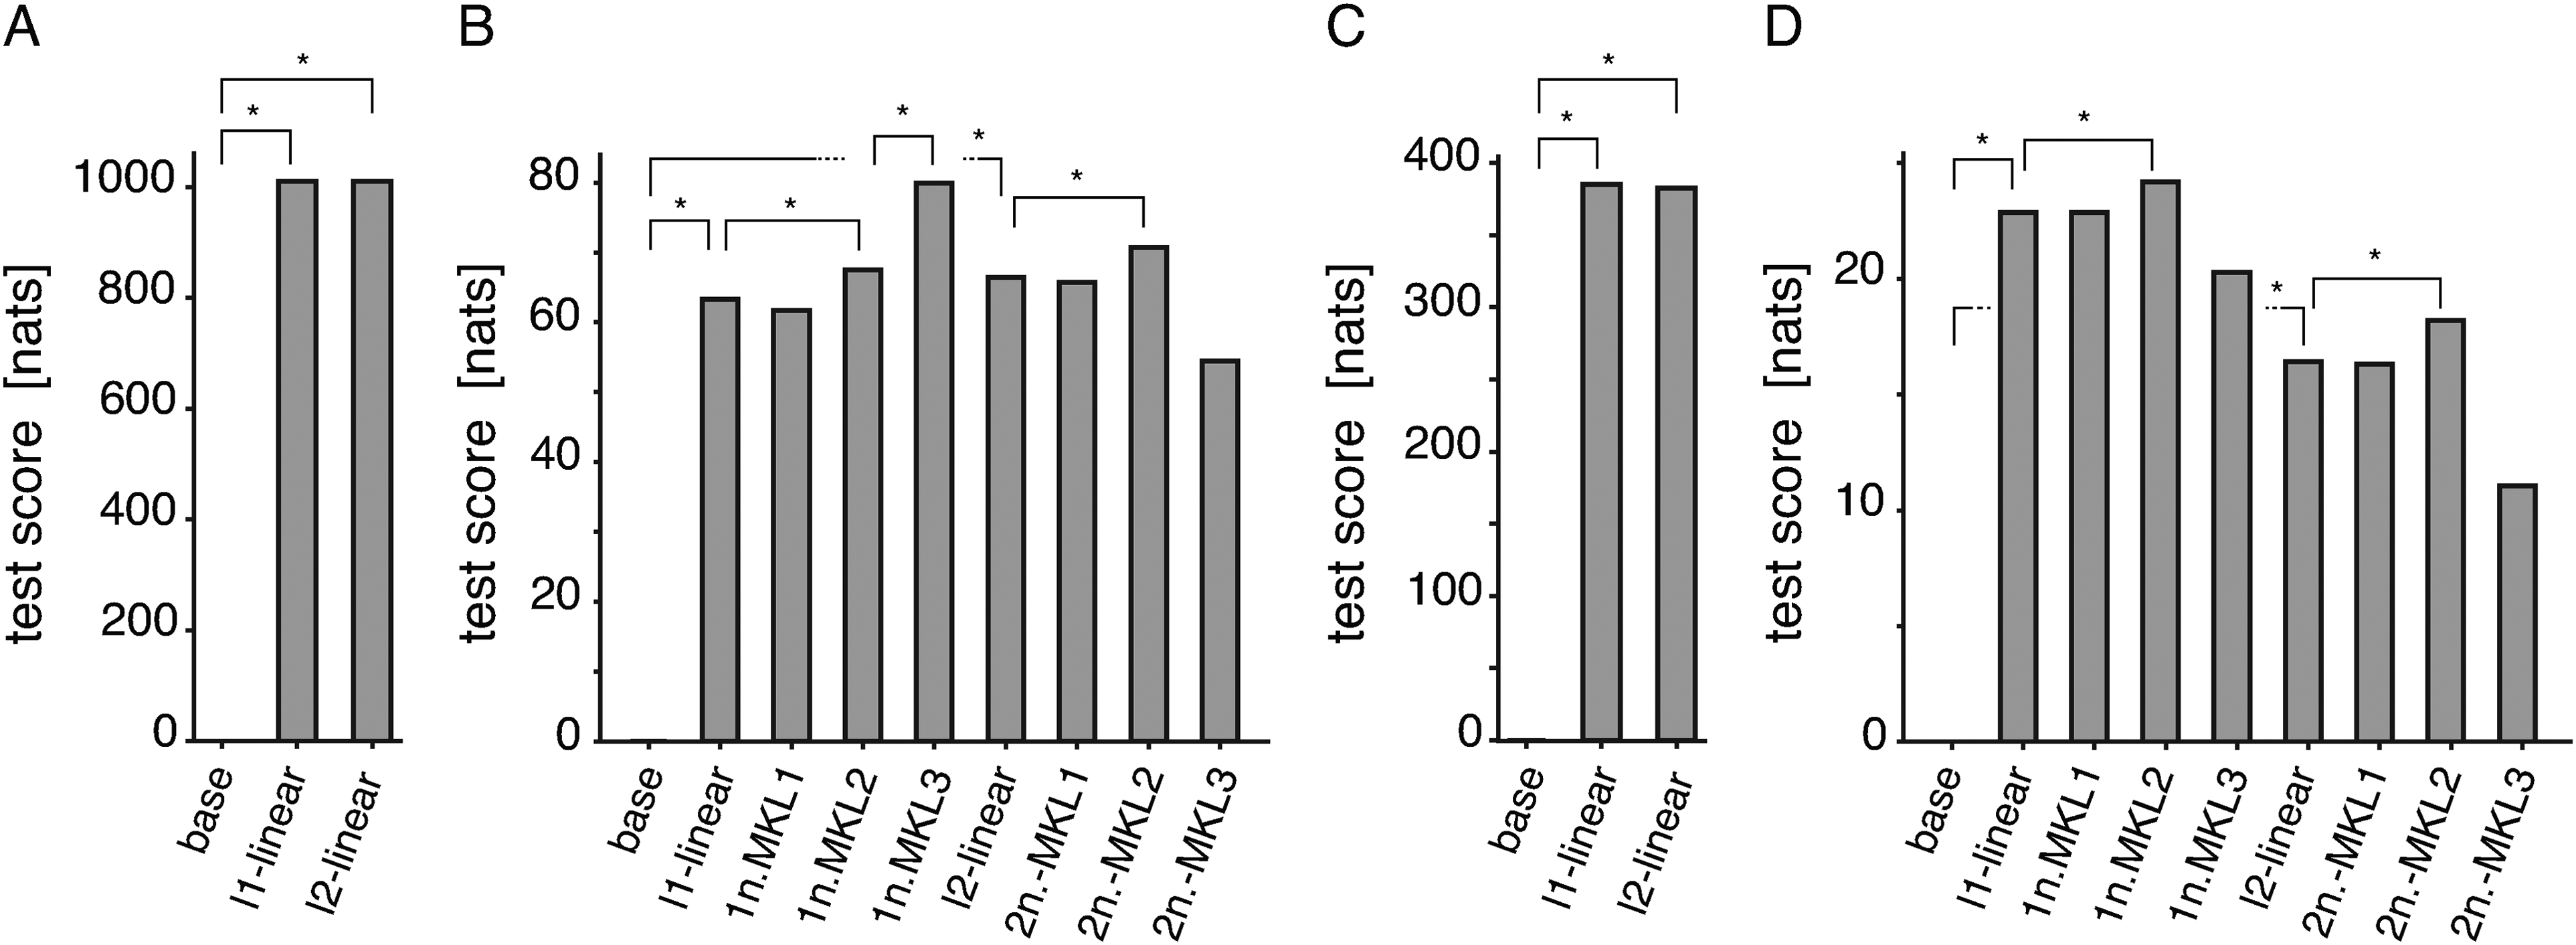
Test scores of the linear and MKL1–3 models under 1-norm and 2-norm regularisations. The sum of the log-likelihoods of test sets across 10 folds as a measure of goodness-of-fit was calculated for both the entire cohort (panels A and C) and subcohort (panels B and D), and for both the onset of any dementia (panels A and B) and the onset of dementia of Alzheimer type (panels C and D).
Hazard ratios of use of BZDs, Z-drugs and other hypnotics estimated with linear model
For comparison with previous studies, we examined the hazard ratios of the current doses and ever use of BZDs with different half-lives, Z-drugs, and other hypnotics, and the hazard ratios of other previously known risk factors estimated with the linear model. From the estimated hazard ratios and their confidence intervals, we found that most of the previously known risk factors other than BZDs were associated with significant positive risks [Supplemental Figure 2]. In contrast, the observed patterns of risks associated with hypnotics shown in Figure 3 were neither consistent with previous results nor immediately interpretable (see Supplemental Figure 1 for results with 1-norm regularisation). In this result, we did not observe statistically significant, positive risks associated with use of BZDs, except for a positive risk of onset of any dementia associated with ever use of short-acting BZDs in the analysis of the subcohort [Figure 3B]. While the confidence intervals of the hazard ratios estimated with the entire cohort tended to be narrower than those estimated with the subcohort, we found that negative risk associated with Z-drugs and positive risk associated with short-acting BZDs were significant only in the analysis of the subcohort. Since the entire cohort was almost ten times larger than the subcohort, and since statistically significant risks are hence generally harder to detect for the subcohort, these results were extraordinary. The risks associated with these hypnotics were therefore suggested to be amplified by the design of the subcohort containing many new users of hypnotics.

Hazard ratios and 95% confidence intervals for current doses and ever use of hypnotics estimated with linear model. The hazard ratios for the onset of any dementia (panels A and B) and for the onset of dementia of Alzheimer type (panels C and D), estimated with the linear model under
Nonlinear risks associated with cumulative doses and administration periods of BZDs and durations of baseline disorders
Next, for comparison with the previously reported nonlinear risks of BZDs, we examined the nonlinear risk functions for the cumulative doses of BZDs estimated with the MKL1 model. Although the estimated risk functions shown in Figure 4A were only for short-acting BZDs and were drawn over a wider range of cumulative doses, 0–1000 defined daily dose (DD), than for the previous results which were for all BZDs and Z-drugs over 0–400 DD, the two showed good agreement over the shared range, both taking positive values for 0–180 DD and negative values for larger doses. We note that the negative peak of the risk function for the onset of any dementia in Figure 4A was statistically significant, while that of the previous result was not. Apart from the above similarity, the estimated risk functions for BZDs with other ranges of half-lives did not show significant risk-dose relationships [Supplemental Figure 4]. These results suggested that the previously reported risk nonlinearly correlated with the cumulative dose of all BZDs and Z-drugs was mainly due to shorter-acting hypnotics.

Nonlinear risk functions estimated with MKL1–MKL3 models. Insets in panels indicate the type of target dementia (any dementia or dementia of Alzheimer type) and the type of regularisation used in the analysis. For the results with 1-norm regularisation, the percentage of estimating non-zero risk functions in the bootstrap procedure is also shown with its subdecimal value rounded. The labels of the horizontal axes indicate the explanatory variables for which the risk functions are shown in the panels. (A) Risk functions for onset of any dementia estimated with MKL1 model. (B) Risk functions for onset of any dementia estimated with MKL2 model. (C) Risk functions for onset of dementia of Alzheimer type estimated with MKL2 model. (D) Risk functions for onset of any dementia estimated with MKL3 model. 1/2n.: 1/2-norm regularisation; DD: defined daily dose.
Here, it should be mentioned that we occasionally found a discrepancy between the results of 1-norm and 2-norm regularisations, apart from the clear results described above. In such cases, we typically observed small, but significant, risk variations under 2-norm regularisation, and zero risk variations with a high frequency under 1-norm regularisation. Although there is no way to judge with certainty which observation is more reliable, the following difference in the properties of 1-norm and 2-norm regularisations should be noted: if a confounder with no influence on the outcome is strongly correlated with a risk factor, and if there is no hidden risk factor correlated with both, use of a 1-norm regulariser is likely to result in estimation of a zero risk for the confounder, while use of a 2-norm regulariser possibly results in estimation of a significant risk due to the colinear effect. Based on this consideration, we conservatively dismissed small significance under 2-norm regularisation that had not been confirmed under 1-norm regularisation.
With confirmation of the previous result, we moved on to examination of the risk functions estimated with the MKL2 model, in order to answer the question we raised in the introduction of this article, identifying which of the current and cumulative doses and administration periods of BZDs and the durations of baseline disorders is most relevant to the onset of dementia. The goodness-of-fit of the linear, MKL1 and MKL2 models under 1-norm and 2-norm regularisations in Figure 2 B and D indicated that the risk functions included only in MKL2 contributed more to the prediction of dementia onset than those for cumulative doses of BZDs. Among those risk functions, the risk functions for the administration period of short-acting BZDs and the duration of insomnia and anxiety disorders [Figure 4B] were estimated to be associated with significant temporal variations in the risk of onset of any dementia. Particularly, the estimated risk functions for the administration period of short-acting BZDs and the duration of anxiety disorders showed prominent, diphasic temporal variations with positive and negative peaks. Less prominently, the estimated risk function for the duration of insomnia showed a significant negative peak around the 40th month. Notably, the estimated risk functions for the cumulative dose of short-acting BZDs showed profiles similar to those obtained with the MKL1 model, but with reduced significance indicated by wider confidence intervals estimated under 2-norm regularisation and, more remarkably, by a lower percentage of estimating non-zero risk functions under 1-norm regularisation (from 99% to 28%). These results suggested the possibility that the previously reported risk associated with the cumulative dose of BZDs was partly due to the effects caused by confounding between the cumulative dose and the administration period. Also, notably, we did not observe a significant positive risk linearly associated with the current dose of short-acting BZDs in the results with the MKL2 model, as we observed with the linear model [Supplemental Figure 3]. This suggested that some part of the positive risk observed with the linear model is explained by the time-varying risks we described above (as shown by comparison of Figure 3B and Supplemental Figure 1B with Supplemental Figure 3A and C). On the other hand, the positive risk associated with affective disorders and negative risks associated with the current doses of very-short-acting BZDs and Z-drugs persisted in the results with the MKL2 model [Supplemental Figures 3 and 7], the former of which did not appear to be largely adjusted by the simultaneous estimation of the nonsignificant risk variation associated with the administration period of anti-depressants [Supplemental Figure 8]. In contrast to all these results, we detected no significant increase in risk associated with long-term BZD use from the risk functions of administration periods and cumulative doses of BZDs [Supplemental Figures 5 and 6].
The results of analysis for the onset of dementia of Alzheimer type showed qualitatively similar results to those for the onset of any dementia, but with reduced statistical significance. This was partly expected from the small number of patients with both BZD use and disease onset. Nevertheless, the risk functions estimated with the MKL2 model showed diphasic temporal profiles similar to those for the onset of any dementia, as seen in the risk functions for short-acting BZDs [Figure 4C], while the diphasic risk variation seemed overlayed with another temporal risk variation that increases over time. Concerning this overlayed risk variation, it might be worth mentioning that, although we again did not observe a significant increase in risk associated with long-term use of BZDs, the risk functions for the administration periods of short-acting and long-acting BZDs, together with the risks of these drugs linearly estimated in the same analysis, indicated a slight, but nonsignificant increase in risk over time [Figure 4C, Supplemental Figures 3B and D, 5 and 6].
MKL with hundreds of explanatory variables
As we explained above, the results of the analysis with the MKL2 model revealed a few factors that accounted for onset of dementia better than the cumulative doses of BZDs. Then, we naturally considered whether we could find an even more informative set of explanatory variables from the hundreds of candidates available in our database. We investigated this point by performing analysis with the MKL3 model. As shown in Figure 2, we found that the MKL3 model accounted for the onset of any dementia much better than did the MKL2 model, while this was not the case for the onset of dementia of Alzheimer type. We, however, found that the estimated risk function for the administration period of short-acting BZDs and the duration of anxiety disorders in Figure 4D showed the same, almost significant, diphasic risk variations as those estimated with the MKL2 model, confirming the robustness of the result. Most of the other nonzero risks detected with the MKL3 model under 1-norm regularisation were either variables related to risk factors investigated with the MKL2 model, to less frequent causes of cognitive impairment that were not investigated with the MKL2 model, or to systemic conditions of patients, as summarised in Table 3. The lack of improved prediction by the MKL3 model for onset of dementia of Alzheimer type was understandable from these results, since patients with secondary cognitive impairment related to many of the detected factors were presumably not diagnosed with dementia of Alzheimer type. Concerning the negative risks associated with current doses of very-short-acting BZDs and Z-drugs estimated with the linear and MKL2 models, we could not speculate on the sources of these risks from the results with the MKL3 model, because the optimal regularisation hyperparameter value for linear kernels was such a large value that most linear risks were estimated to be zero. This suggested that 1-norm regularisation sacrificed the estimation of less contributing, but significant risk factors in predicting dementia onset, as we had expected as its behaviour with data of relatively small size.
Nonzero risk functions detected with MKL3 model.

Risk functions estimated to be nonzero with higher frequencies in the repeated estimation with bootstrap datasets and the MKL3 model under 1-norm regularisation are listed in descending order of the percentage of nonzero estimation. Linear and Gaussian kernels were not distinguished in these statistics.
Discussion
In the present study, we estimated the risks of dementia onset in retrospective cohorts extracted from the electronic medical records of our university hospitals, using a hazard model extended using the techniques of multiple kernel learning. Our statistical model coincided with the conventionally used linear hazard model, as we used only linear kernels, while it described hazard models with multiple nonlinear risk functions varying with different explanatory variables, as we used Gaussian kernels. Among 71,680 regularly cared for patients in the cohort, we focused detailed analyses on a subcohort of 8160 patients who had newly developed insomnia, affective disorders or anxiety disorders during the observation period.
Interpretation of results
Our results clearly showed that the administration period of short-acting-BZDs and the duration of anxiety disorders, among other variables related to BZD use and potential sources of bias, diphasically affected the risk of dementia onset in the medium-term of 2–4 years. Less prominently, it was also shown that insomnia was associated with a negative risk around the 40th month from its onset, and that affective disorders were associated with an increased risk regardless of their duration. These findings contrasted with the absence of any significant risk associated with long-term use of BZDs. As we considered the complicated overlap among users of different types of BZDs and patients suffering different baseline disorders, such a clear dissection of their effects was striking. The most valid interpretation of the diphasic risk variations would be that the short-acting BZDs acted as a loading test that detected subclinical dementia patients, and that anxiety disorders of some patients appeared as a prodromal symptom of dementia. This interpretation accounted for the negative phase of the diphasic risk variation, indicating that patients who did not develop dementia during the first positive phase were more likely to be free from subclinical dementia. The risk associated with the duration of insomnia could not be interpreted straightforwardly. It is conceivable, however, that the increased risk in the early phase after the onset of insomnia was overridden by the earlier increase in risk due to use of short-acting BZDs. This hypothesis was supported by the periods of the risk variations associated with insomnia and short-acting BZDs, together with the fact that onset of insomnia and initiation of short-acting BZDs were often simultaneous. Since insomnia is known to complicate dementia in its early phase, we reasonably suspect the presence of diphasic risk variation similar to that associated with anxiety disorders. Whether affective disorders are prodromal symptoms or risk factors for dementia is controversial. 37 Although our results did not allow us to infer the mechanisms behind the risk associations with affective disorders, the lack of detection of temporal risk variations is consistent with both hypotheses, if the prodromal onset of an affective disorder occurs on a fairly long time scale before the onset of dementia.
Protopathic bias in previous studies expected from our results
A clear message from our results is that a large, positive or negative, protopathic bias can be introduced by variables related to short-acting BZDs, insomnia or anxiety disorders, if only linear effects of these variables are considered, as most previous studies did. This could be seen within our results that the current dose of short-acting BZDs was linearly associated with a significant positive risk in the analysis of the subcohort with the linear model, but not in the analysis of the entire cohort, and that this positive risk disappeared after nonlinear adjustment with the MKL2 model. Previous studies with many new initiators of BZDs would have also suffered this bias, but other studies would not have been free from this bias either. A retrospective study from Taiwan 6 investigated new onset of dementia within three years from the onset of insomnia and prescription of mainly short-acting BZDs. A bias is expected from the temporally varying risks associated with short-acting BZDs and insomnia that we observed. Of note, this bias can be positive, because the cumulative effects over the 3 years, but not the risk at the 36th month, should have been reflected in the previous result. The PAQUID study 7 was likely to be affected by the effects of both insomnia and anxiety disorders, because of its new-initiator design and lack of records of anxiety disorders. Since a recent Danish study 14 enrolled patients with newly developed affective disorders, their cohort was expected to contain many new BZD initiators. For such a study population, our results indicated that their design of a cohort study and nested case-control study with a two-year latency period was susceptible to the protopathic biases we observed. The potential protopathic bias was not pointed out for all of the previous studies. A case-control study based on the RAMQ database 8 reported a positive risk with a study design that would have reduced the bias effect by having an interval of 5 years between exposure assessment and dementia onset. The Caerphilly prospective study, 5 which compared the effects of exposure within 12 years of the outcome with exposure between 13 and 22 years prior to the outcome, would not be susceptible to the bias we observed. For these studies, we just note that we cannot exclude the possibility that the duration of affective disorders is associated with diphasic risk variation on a longer time scale, which could not be assessed in the present study because of our short observation period, and bias due to this temporal risk variation was introduced into their results.
The issue of protopathic bias was extensively investigated in a previous study 18 with the classical stratification approach. The results of this study and the current study cannot be directly compared, because the former analysed the association of BZD use more than 5 years and up to 20 years prior to dementia onset. From a technical point of view, however, our analysis contrasted with the repeated analysis with different stratifications and covariate measurements in the previous study, which made interpretation of the results complicated. In the previous study, simultaneous stratification with respect to all potential sources of bias was impossible, and thus, precise evaluation of their effects was not possible. In contrast, the approach we took here allowed us to directly estimate the effect of each source of bias.
Strengths and limitations
The strength of our study is the availability of temporally precise information about the administration of BZDs and other drugs, baseline disorders and laboratory tests throughout a moderately long observation period, accompanied by computationally efficient analytical tools based on multiple kernel learning and a regularised maximum-likelihood approach that fully takes advantage of this temporal information. As we compare our results with the previous result 11 obtained from a cohort of similar size, the strength of our study can be seen in the estimated, multiple nonlinear risk functions with narrower confidence intervals. The strength of our dataset and methodology, however, does not lie only in quantitative improvement. In fact, the diphasic protopathic biases and their likely influence on the interpretation of the previous results we discussed above demonstrate the need for such a method to disentangle multiple nonlinear risks. The approach to stratify the cohort employed in the previous study 18 was not as effective as ours, because of the combinatorial issue with several confounders and sources of protopathic bias.
As an epidemiological study, however, our study suffered several limitations in addition to the retrospective study design. First, there was no guarantee that the complete clinical information of the patients was stored in the database. Although many patients are holistically and regularly cared for in our university hospitals, some patients in our cohort would have been cared for by other medical institutions as well, and the medical records of such institutions were not accessible in the present study. In addition to this, our analysis inevitably suffered incompleteness of laboratory test results, because laboratory tests are performed only for patients who need them. Second, dementia recorded in our system was not necessarily diagnosed by a specialist in neurology or psychiatry. Scores of a cognitive scale were not available, unlike some of the previous studies. Third, the present dataset allowed us to take only a 180-day run-in period, which means that bias due to medical history before the first visits might be larger in comparison with previous studies with longer run-in periods. Finally, it is fair to mention that the positive risks associated with hypnotics other than BZDs and Z-drugs, and the negative risks associated with very-short-acting BZDs and Z-drugs persisted even after the introduction of nonlinear risk functions for use of hypnotics and baseline disorders in the MKL2 model, and were hard to interpret. These previously unreported risks might suggest bias inherent in our study cohorts. However, we also point out the possibility that regularised maximum-likelihood estimation detected such a risk and bias more sensitively than did unregularised estimation in previous studies. We reasonably expect modern statistical techniques with an improved signal-to-noise ratio to inevitably detect more risks that cannot be immediately interpreted. To improve this point, we need to analyse different study populations with the same method, distinguishing universal effects from population-specific effects. With all these limitations in mind, we believe that the implication of the clear results obtained with our dataset is still worth consideration in designing future studies and making clinical decisions based on currently available literature.
From the point of view of machine learning, one may consider the application of other popular machine learning algorithms, such as algorithms based on neural networks or decision trees, that potentially predict the onset of events with higher precision. This line of study should be encouraged, but will still face technical and conceptual challenges. The first challenge is to resolve the issue that the results of estimation with ensembles of decision trees and neural networks are still hard to interpret. Although there have been attempts to develop a method with interpretable results, 38 further technical development is warranted before standard epidemiological practice is established. The second challenge is to overcome the computational intractability of these methods. Although a single estimation with these methods can be performed within a reasonable computation time, performing hundreds to thousands of repeated estimations with bootstrap datasets is still prohibitive, especially for a large amount of data, such as the 431,698 person-month data for our subcohort. We believe that such a bootstrap-based evaluation of statistical errors in goodness-of-fit scores and individual risk functions is needed, if we respect the standard of rigour maintained in conventional epidemiology. In this regard, noting that recent applications of neural networks and decision trees to medical data inevitably avoided such intensive statistical evaluation, 39 we point out the gap between the practice in recent machine-learning-based studies and conventional epidemiological practice. The third challenge is to acquire generalisable knowledge from a dataset with a small effective sample size. Only 184 patients in our subcohort developed dementia. Neural networks and decision tree ensembles are generally applied to datasets with a much larger effective sample size, and their predictive performance is believed to be poor if the sample size is small. 40 For these reasons, we did not attempt to perform analysis with popular algorithms based on neural networks and decision trees in the present study, restricting our development to the fast, large-scale, yet rigorous, statistical evaluation provided by the framework of multiple kernel learning. Previous epidemiological analyses based on multiple kernel learning25–29 were focused on prediction of outcomes, and did not achieve this development.
Conclusions
In our analysis, the risk of dementia onset showed strong nonlinear associations with the durations of insomnia and anxiety disorders and the administration period of short-acting BZDs. Based on the pattern of risk variations, these associations were suggested to be due to protopathic biases and confounding. These putative confounding effects were observed over 2–4 years after the initiation of the drugs and the onset of the disorders, which suggested biases in many previously reported results. Under adjustment for these confounding factors, no significant risk association with long-term use of benzodiazepines was observed. Based on these results, we concluded that the role of BZDs in the development of dementia is questionable. The retrospective and observational nature of the present study, together with the strong limitations discussed above, prevent us reaching a firm conclusion on any clinical implications from our results. Thus, we propose reconsideration of previous results and a similar analysis of datasets in future and past studies. Even though observational studies cannot ultimately conclude a causal role of drugs, adjustment of the nonlinear bias effects we observed might resolve the inconsistency among the results of previous studies. In this future perspective, Bayesian MKL based on Gaussian processes 41 might be even more suitable. Although there are a few technical challenges in carrying out estimation with Bayesian MKL, prodromal symptoms and subclinical dementia can be explicitly modelled by using latent variables in this Bayesian framework.
Supplemental Material
sj-bz2-1-dhj-10.1177_20552076231178577 - Supplemental material for Benzodiazepine-related dementia risks and protopathic biases revealed by multiple-kernel learning with electronic medical records
Supplemental material, sj-bz2-1-dhj-10.1177_20552076231178577 for Benzodiazepine-related dementia risks and protopathic biases revealed by multiple-kernel learning with electronic medical records by Takashi Hayakawa, Takuya Nagashima, Hayato Akimoto, Kimino Minagawa, Yasuo Takahashi and Satoshi Asai in DIGITAL HEALTH
Supplemental Material
sj-pdf-2-dhj-10.1177_20552076231178577 - Supplemental material for Benzodiazepine-related dementia risks and protopathic biases revealed by multiple-kernel learning with electronic medical records
Supplemental material, sj-pdf-2-dhj-10.1177_20552076231178577 for Benzodiazepine-related dementia risks and protopathic biases revealed by multiple-kernel learning with electronic medical records by Takashi Hayakawa, Takuya Nagashima, Hayato Akimoto, Kimino Minagawa, Yasuo Takahashi and Satoshi Asai in DIGITAL HEALTH
Supplemental Material
sj-pdf-3-dhj-10.1177_20552076231178577 - Supplemental material for Benzodiazepine-related dementia risks and protopathic biases revealed by multiple-kernel learning with electronic medical records
Supplemental material, sj-pdf-3-dhj-10.1177_20552076231178577 for Benzodiazepine-related dementia risks and protopathic biases revealed by multiple-kernel learning with electronic medical records by Takashi Hayakawa, Takuya Nagashima, Hayato Akimoto, Kimino Minagawa, Yasuo Takahashi and Satoshi Asai in DIGITAL HEALTH
Footnotes
Acknowledgements
We would like to thank 4DIN Ltd. (Tokyo, Japan) and Phenogen Medical Corporation (Tokyo, Japan) for financial support. Both companies had no conflicts of interest and played no part in research design, analysis, data collection, interpretation of data, or review of the manuscript, and no honoraria or payments were made for authorship.
Contributorship
TH conceptualised the study, determined the methods to use, and wrote program codes that implement them. Then, TH and TN extracted data for analysis from the database, and all authors performed data analysis. All authors were involved in the discussion and interpretation of the results. TH wrote the first draught of the manuscript. All authors reviewed and edited the manuscript and approved the final version of the manuscript.
Declaration of conflicting interests
The author(s) declared no potential conflicts of interest with respect to the research, authorship, and/or publication of this article.
Ethical approval
The experimental protocol was approved by the Ethical Committee of Nihon University School of Medicine (approval number: P30-2-3), and the study was conducted in compliance with the Ethical Guidelines for Medical and Health Research Involving Human Subjects of the Ministry of Education, Culture, Sports, Science, and Technology and the Ministry of Health, Labour, and Welfare of Japan. Written informed consent for participation was not required for this study in accordance with the national legislation. According to the guidelines, a retrospective observational study using only preexisting, anonymised information, not biological samples, cannot and does not need to obtain informed consent.
Funding
The author(s) received no financial support for the research, authorship and/or publication of this article: This research was supported by the Ministry of Education, Culture, Sports, Sciences and Technology (MEXT) of Japanese government and the Japan Agency for Medical Research and Development (AMED) under grant numbers JP18km0605001 and JP223fa627011.
Guarantor
TH
Supplemental material
Supplemental material for this article is available online.
Appendix 1: Disorders for exclusion in enrollment
Patients who had records of the following disorders before the index date were excluded from the cohort: insomnia not under interest (G47.1, G47.3, G47.4 and G47.8), central tuberculosis (A17), congenital syphilis (A50), central viral diseases (A81–89, B00.4, B01.0, B01.1, B02.0, B02.1, B05.0 and B05.1), hepatic coma (B15.0, B16.0, B16.2 and B19.0), HIV infection (B20–24), central tumour (C69–72, C79-80, D33 and D43), addictive drugs (F11–18), schizoid disorders (F20–29), brain damage (F06 and F07), mental retardation (F70–89), central nervous system inflammation (G00–09), central nervous system degeneration (G10–14), Parkinsonism after encephalitis (G21.3), central demyelinating diseases (G35–37), epilepsy (G40-41), cerebral palsy (G80), central disorders (G91–99), subarachnoid haemorrhage (I60 and I69.0), congenital diseases (Q00–99) and dementia (F00–03 and G30–32).
Appendix 2: Design of explanatory variables
In the present study, the logarithm of the hazard rate of dementia onset was modelled to be the sum of linear and nonlinear functions of explanatory variables that summarise the history of diagnosis, prescription and laboratory-test values up to the time point under consideration. In the following subsections, we describe the overall design of these explanatory variables, in detail. The design of kernel functions of these variables that construct risk functions is given in Appendix 4. The concrete set of the explanatory variables and kernels included in each model is given in Table 4.
Appendix 3: Mathematical description of statistical models and regularised maximum-likelihood estimation
Appendix 4: Design of kernels
For the multiple-kernel model of the hazard function, we used linear and Gaussian kernel functions. For
In practice, we used a slightly extended version of the above kernels, because some patients had no history of prescribed medication, test results, or diagnosis represented by the variables in a kernel. To address this issue, we simply defined
In the following, we described how we concretely defined kernels on the explanatory variables defined in Appendix 2. Using these definitions, the list of the kernels used in each model is shown in Table 4.
Appendix 5: Drug groups,disorder groups and laboratory test items represented by explanatory variables
References
Supplementary Material
Please find the following supplemental material available below.
For Open Access articles published under a Creative Commons License, all supplemental material carries the same license as the article it is associated with.
For non-Open Access articles published, all supplemental material carries a non-exclusive license, and permission requests for re-use of supplemental material or any part of supplemental material shall be sent directly to the copyright owner as specified in the copyright notice associated with the article.