
Abstract
Background
In 1961, a universal health insurance system was adopted in Japan, and since then, national healthcare spending has continued to rise. 1 The same is true for long-term care (LTC) expenses. Japan’s cumulative LTC costs in 2023 were 11 trillion and 500 billion yen, up from 320 billion yen in the previous year (a growth rate of 2.9%). The LTC insurance (LTCI) system was launched in 2000, and the total value of LTC costs has continued to grow since. 2 Lifestyle diseases have been a major driver of increased medical spending in recent years. Medical costs, especially for cardiovascular diseases and diabetes, have been rising partly because of increasing longevity. Lifestyle diseases account for approximately 30%–40% of Japan’s national healthcare expenses. Of Japan’s national healthcare costs of around 42 trillion yen in 2020, approximately 12–15 trillion yen were spent on lifestyle diseases.3–5 Patients with type 2 diabetes often require extensive medical, dental, and LTC services, particularly when comorbidities accumulate later in life.
Predicting future medical costs is essential for extending healthy life expectancy, curbing healthcare spending, adjusting insurance premiums, and improving social security systems. In Japan, Inoue et al. 6 estimated significant cost reductions by promoting generics, and Sase et al. 7 used Bayesian networks to identify patients with high-cost type 2 diabetes. Globally, diabetes poses a major burden, with 537 million cases in 2021 projected to rise to 783 million cases by 2045, primarily in Asia, the Middle East, and Africa. Related healthcare costs are expected to increase from $966 billion in 2021 to $1.5 trillion by 2045. 8 David et al. 9 estimated lifestyle disease-related losses to be $3.5 trillion in Japan between 2010 and 2030. Studies have also shown that socioeconomic factors such as income and education influence medical spending. 10
Recent machine learning (ML)-based studies can be broadly categorized into three groups: (1) those using insurance claims data to identify high-cost patients,11–13 (2) those comparing algorithmic performance across models,12,14 and (3) those leveraging electronic medical records or biometric data to predict cost patterns.15,16 Alexandre et al. 17 compared model performance using national health data in France, while Kurosaki et al. 18 suggested the utility of Japan’s National Database data to address regional disparities.
Long-term cost projections have also been addressed. Getzen 19 predicted a 5% annual increase by 2034. Other studies examined the impact of dental care on medical and LTC costs,20–22 exploring how factors such as multimorbidity, past expenditures, and self-rated health status affect future costs.23–25 Mori et al. 26 linked chronic disease complexity in those older than 75 to higher combined medical and LTC expenses. However, no studies have jointly analyzed future changes in medical, dental, and LTC costs at the individual level.
Identifying the key factors associated with rising healthcare costs is essential for developing effective preventive strategies and improving resource allocation under the LTCI system. Although many studies have aimed to predict future healthcare costs, few have explored the specific past-year health indicators and expenditure patterns that are most strongly related to subsequent changes in medical, dental, and LTC costs. Despite the existing literature on healthcare cost prediction, few studies have investigated the combined effects of prior-year medical, dental, and LTC costs on future expenditures in Japan’s LTCI population, highlighting a substantial research gap. Therefore, this study examined the relationship between prior-year health indicators and subsequent changes in medical, dental, and LTC costs among older adults with type 2 diabetes under Japan’s LTCI system. Instead of focusing on cost prediction, our objective was to identify the key factors associated with cost increases using ML models as an exploratory tool for variable importance analysis.
Methods
Data items of medical and LTC claims.

Information on the datasets of type 2 diabetes patients (including dental and LTC costs).


ID linkage between the databases
We used data from individuals who had been diagnosed with type 2 diabetes at medical institutions. The diagnoses were made by physicians based on standard clinical criteria, including fasting blood glucose levels; oral glucose tolerance test results; and the presence of associated conditions such as obesity, hypertension, and dyslipidemia. However, we did not include detailed health status information such as diabetes severity or specific comorbidities in our analysis as this would require linkage to additional clinical datasets that were not available in the current data structure. Regarding data preprocessing, we addressed missing values and extreme outliers (e.g., unusually high or low medical expenditures) by excluding these records from the analysis.
A model that predicts various costs from 2017 to 2018.

A model that predicts individual costs from 2018 to 2019.

Three types of ML models were used: random forest (RF), boosting trees (BT), and neural network (NN). We selected RF, BT, and NN as representative ML models because of their proven ability to capture nonlinear relationships and variable interactions, which are common in healthcare cost data. Similar model types have been successfully applied in previous studies of medical expenditure prediction. We selected RF for its robustness and interpretability through variable importance measures, BT for its high predictive accuracy and computational efficiency, and NN for its ability to model complex nonlinear relationships. These models have demonstrated strong performance in medical cost prediction research.12–14 In addition, we conducted a preliminary analysis using linear regression to provide a baseline comparison. However, its performance was significantly lower than that of the nonlinear models; therefore, it was excluded from the final model comparison. For model evaluation, R 2 and RMSE were chosen following standard practices in regression-based healthcare cost modeling.13,16 R 2 measures the proportion of variance explained by the model, whereas RMSE provides a direct assessment of the average prediction error. Both methods are widely used in healthcare expenditure prediction studies,11,17 allowing for intuitive comparisons across models.
RF’s parameters.

BT’s parameters.

NN’s parameters.

Results
Comparison of accuracy of the 2018 and 2019 prediction model.

For the 2019 prediction models, BT outperformed the 74-or-younger model, whereas RF demonstrated superior predictive performance in the 75-or-older model for medical costs. For estimating LTC costs, the NN excelled in the 74-or-younger model, whereas the RF excelled in the 75-or-older model. For predictions of dental care costs, NN excelled in the 74-or-younger model, and RF excelled in the 75-or-older model.
Degree of importance of variables related to predictions of medical costs of the ML model that was adopted, and their primary effects.

Degree of importance of variables related to predictions of LTC costs of the ML model that was adopted, and their primary effects.

Degree of importance of variables related to predictions of dental care costs based on the ML model that was adopted, and their primary effects.


Comparison of the degree of importance of variables for the 74-or-younger model (medical costs)

Comparison of the degree of importance of variables for the 75-or-older model (medical costs)

Comparison of the degree of importance of variables for the 74-or-younger model (LTC costs)
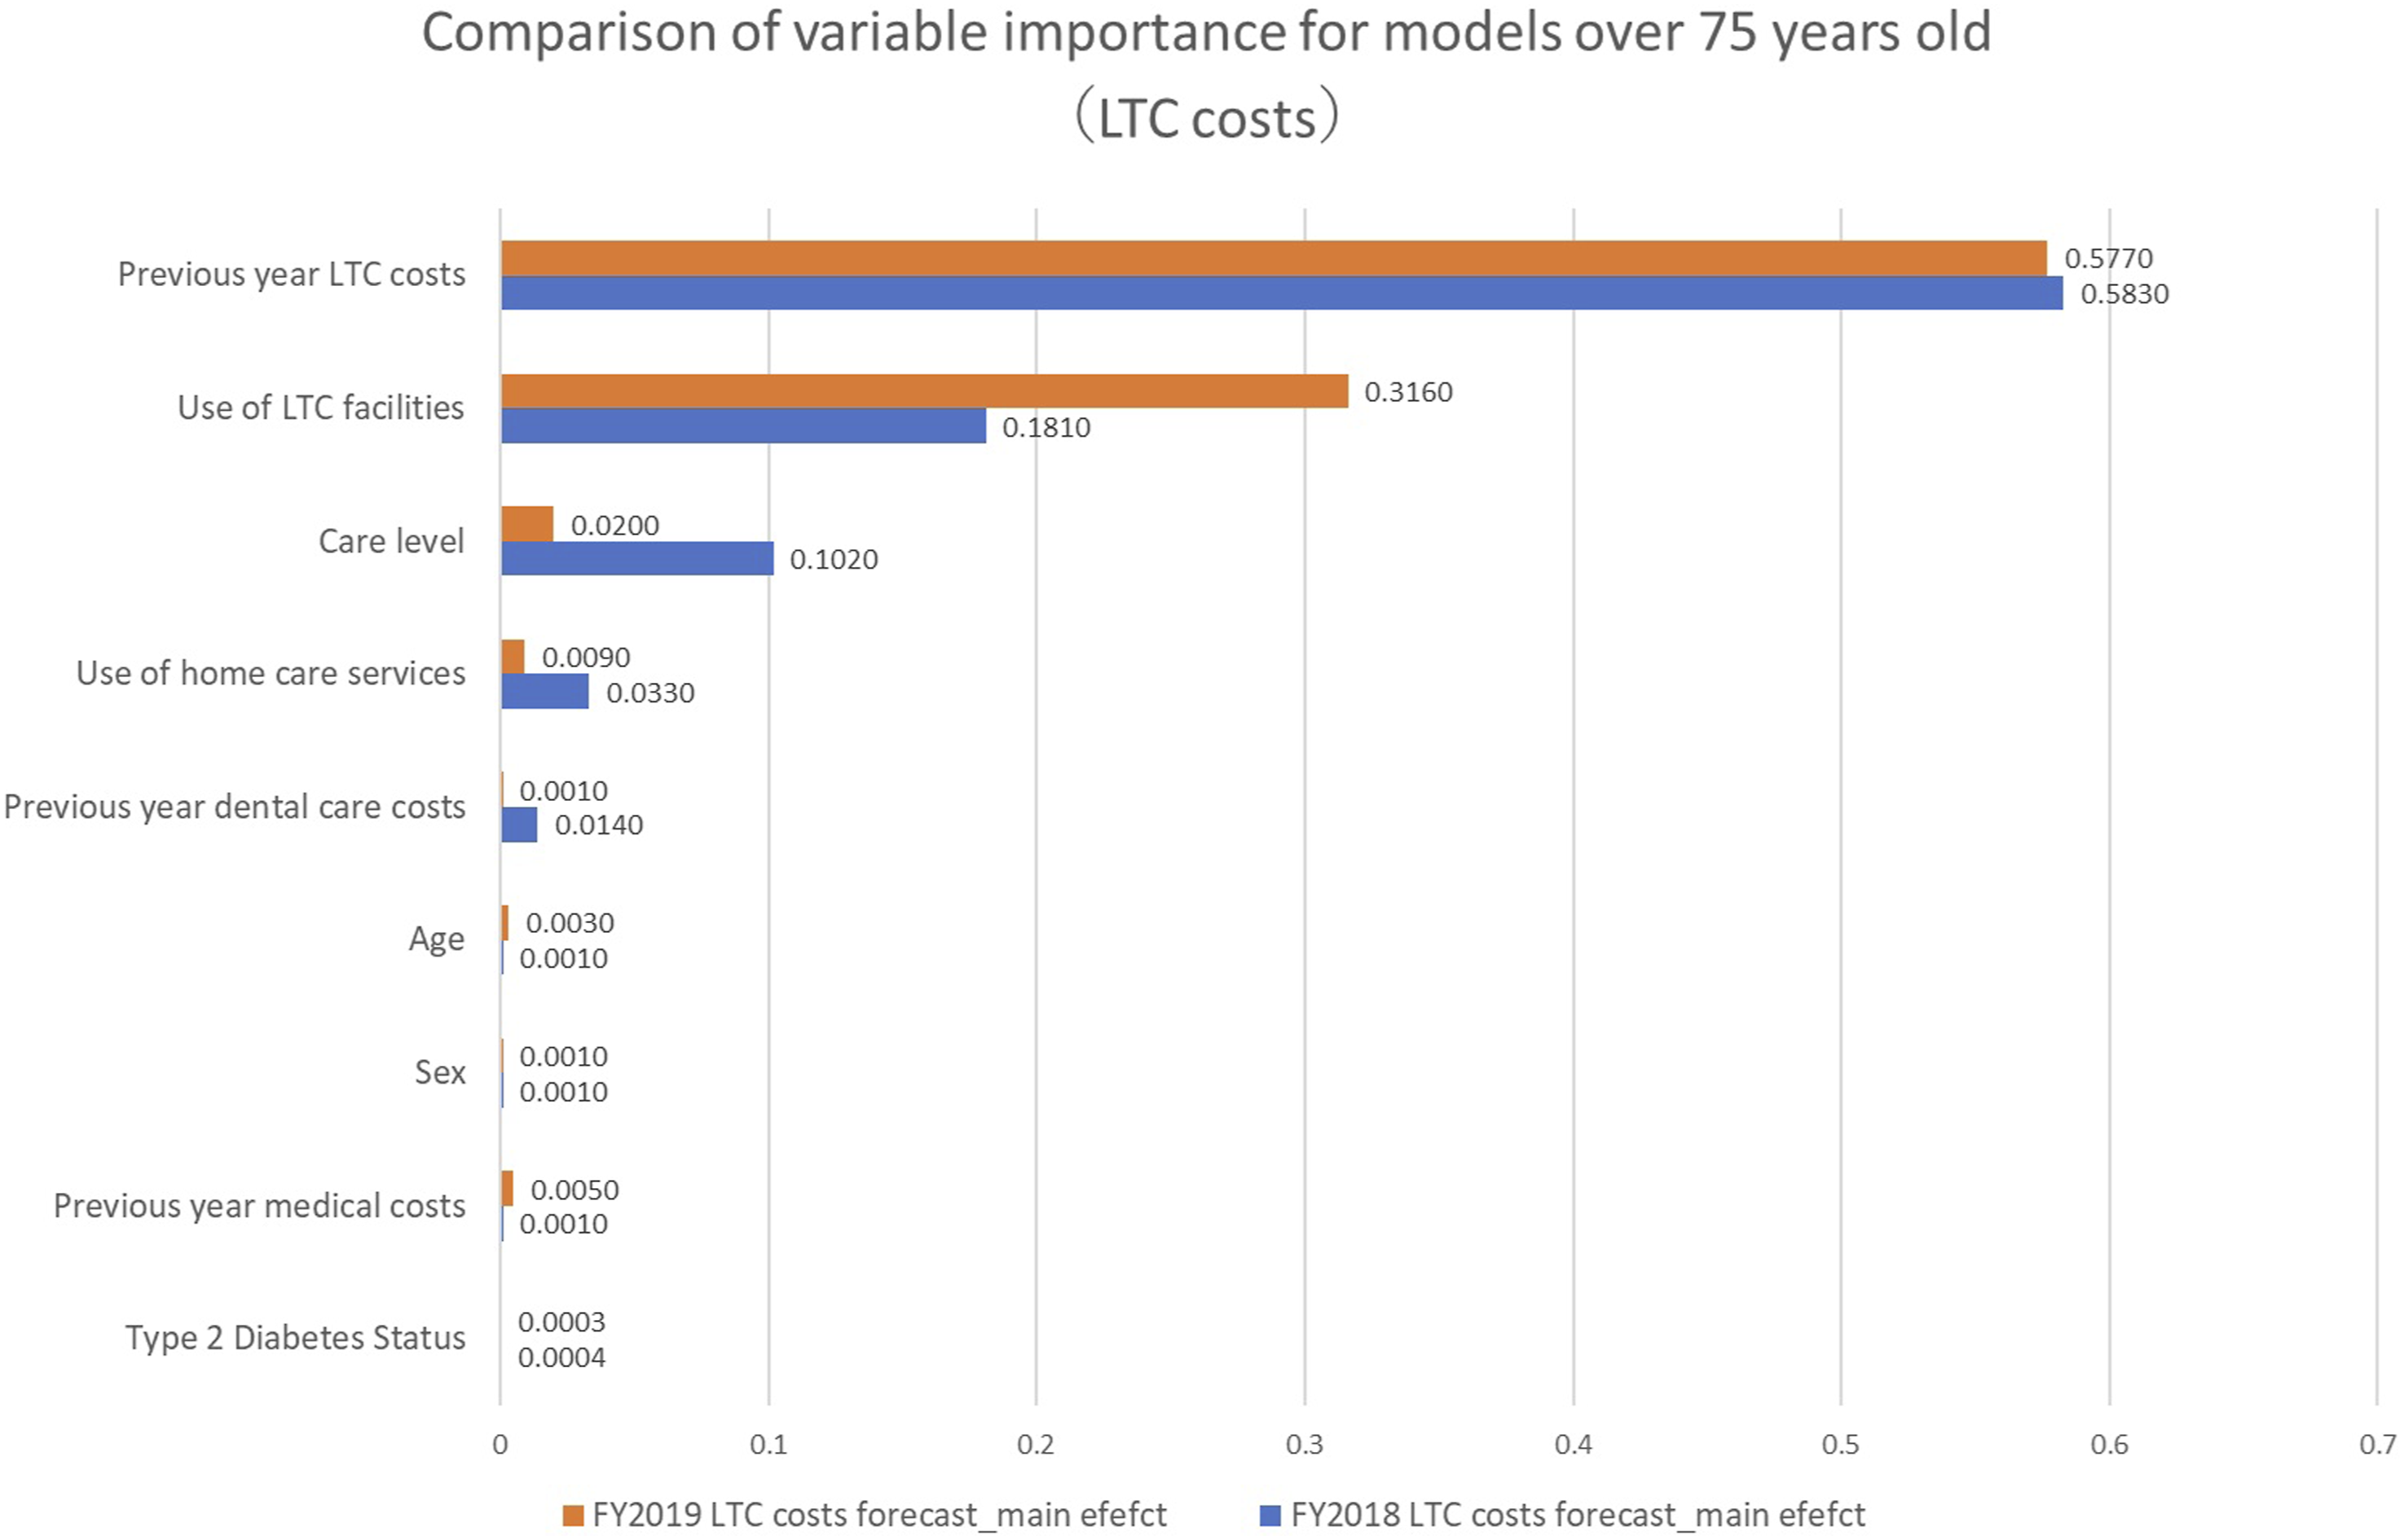
Comparison of the degree of importance of variables for the 75-or-older model (LTC costs)

Comparison of the degree of importance of variables for the 74-or-younger model (dental care costs)

Comparison of the degree of importance of variablesfor the 75-or-older model (dental care costs)
The results of various prediction models 1 year later and their characteristics.
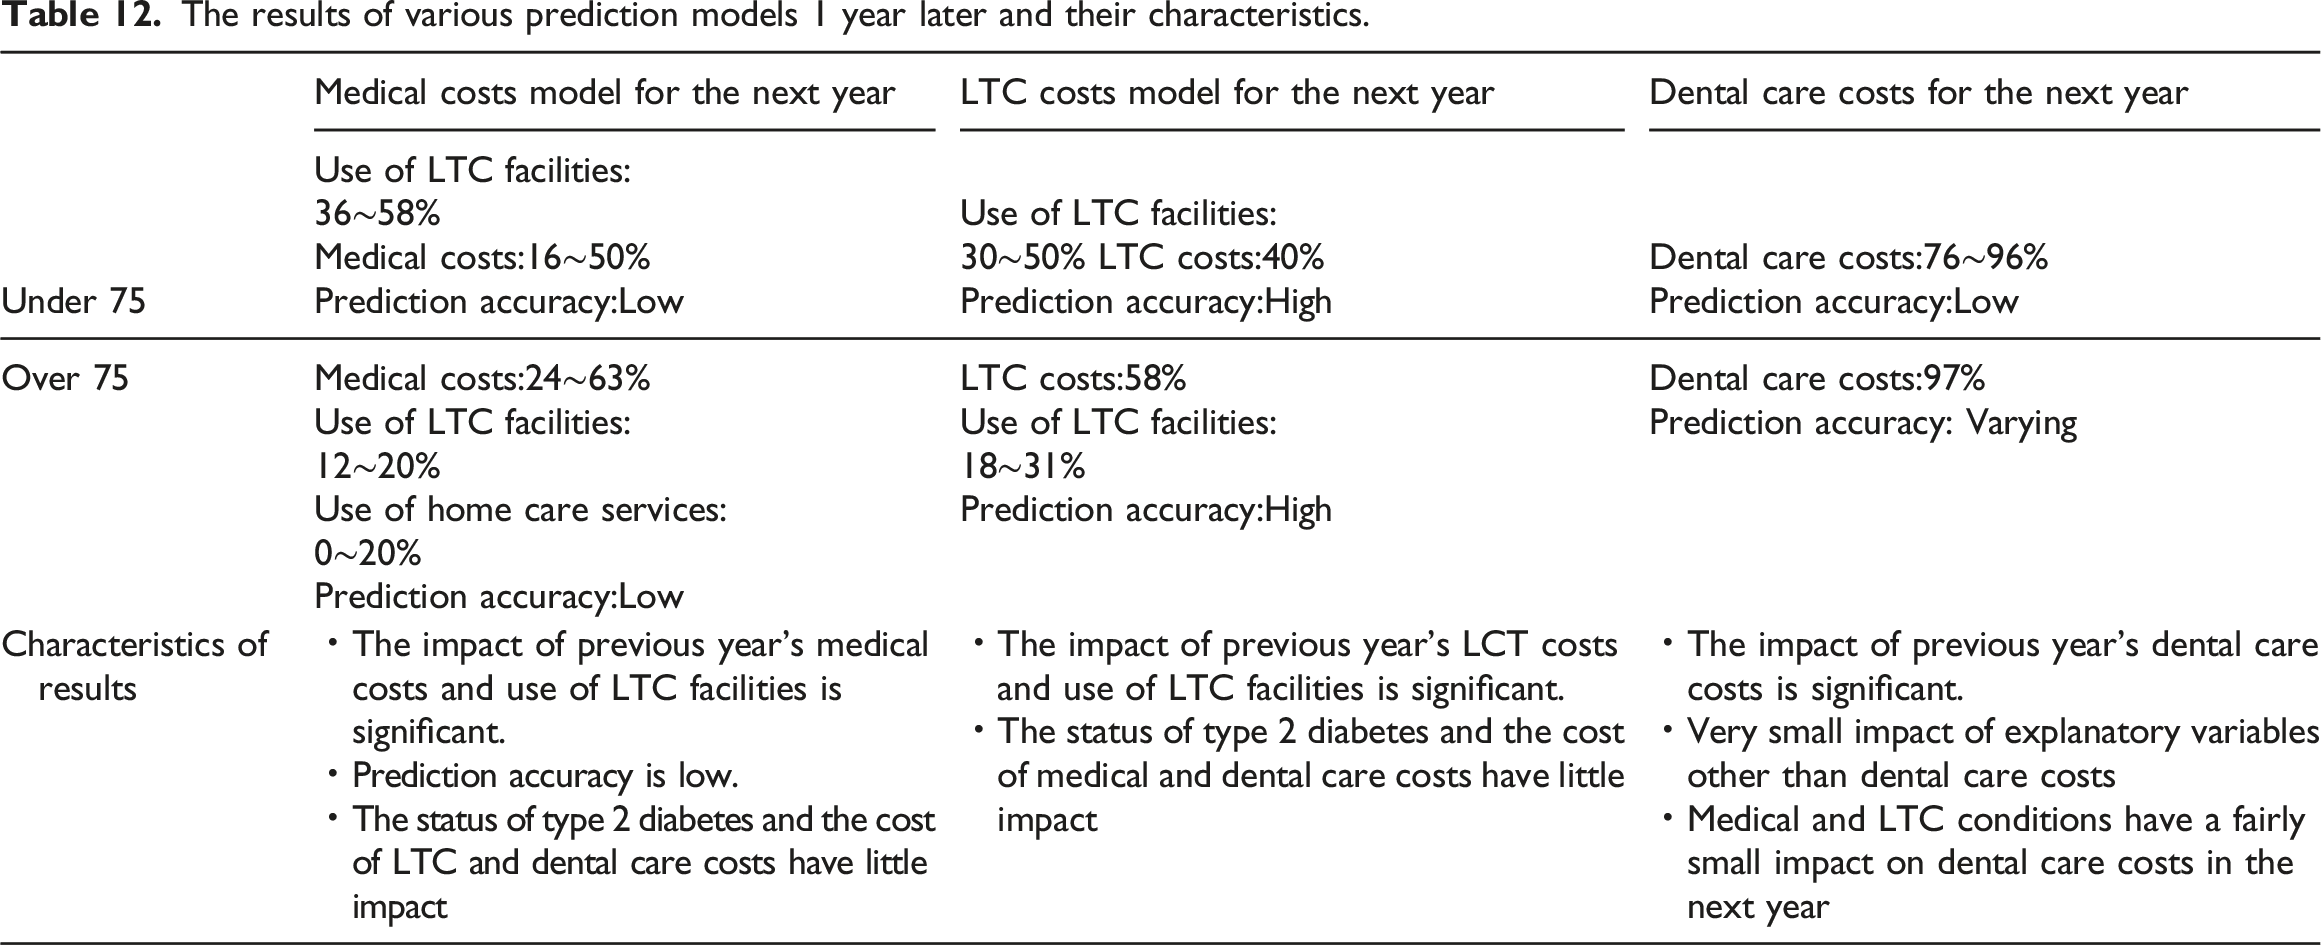
Figure 8 presents a relational diagram illustrating the degree of influence of year X’s medical, LTC, dental, and other costs on the expenses for year X + 1. Degree of influence on the medical, LTC, and dental care costs one year later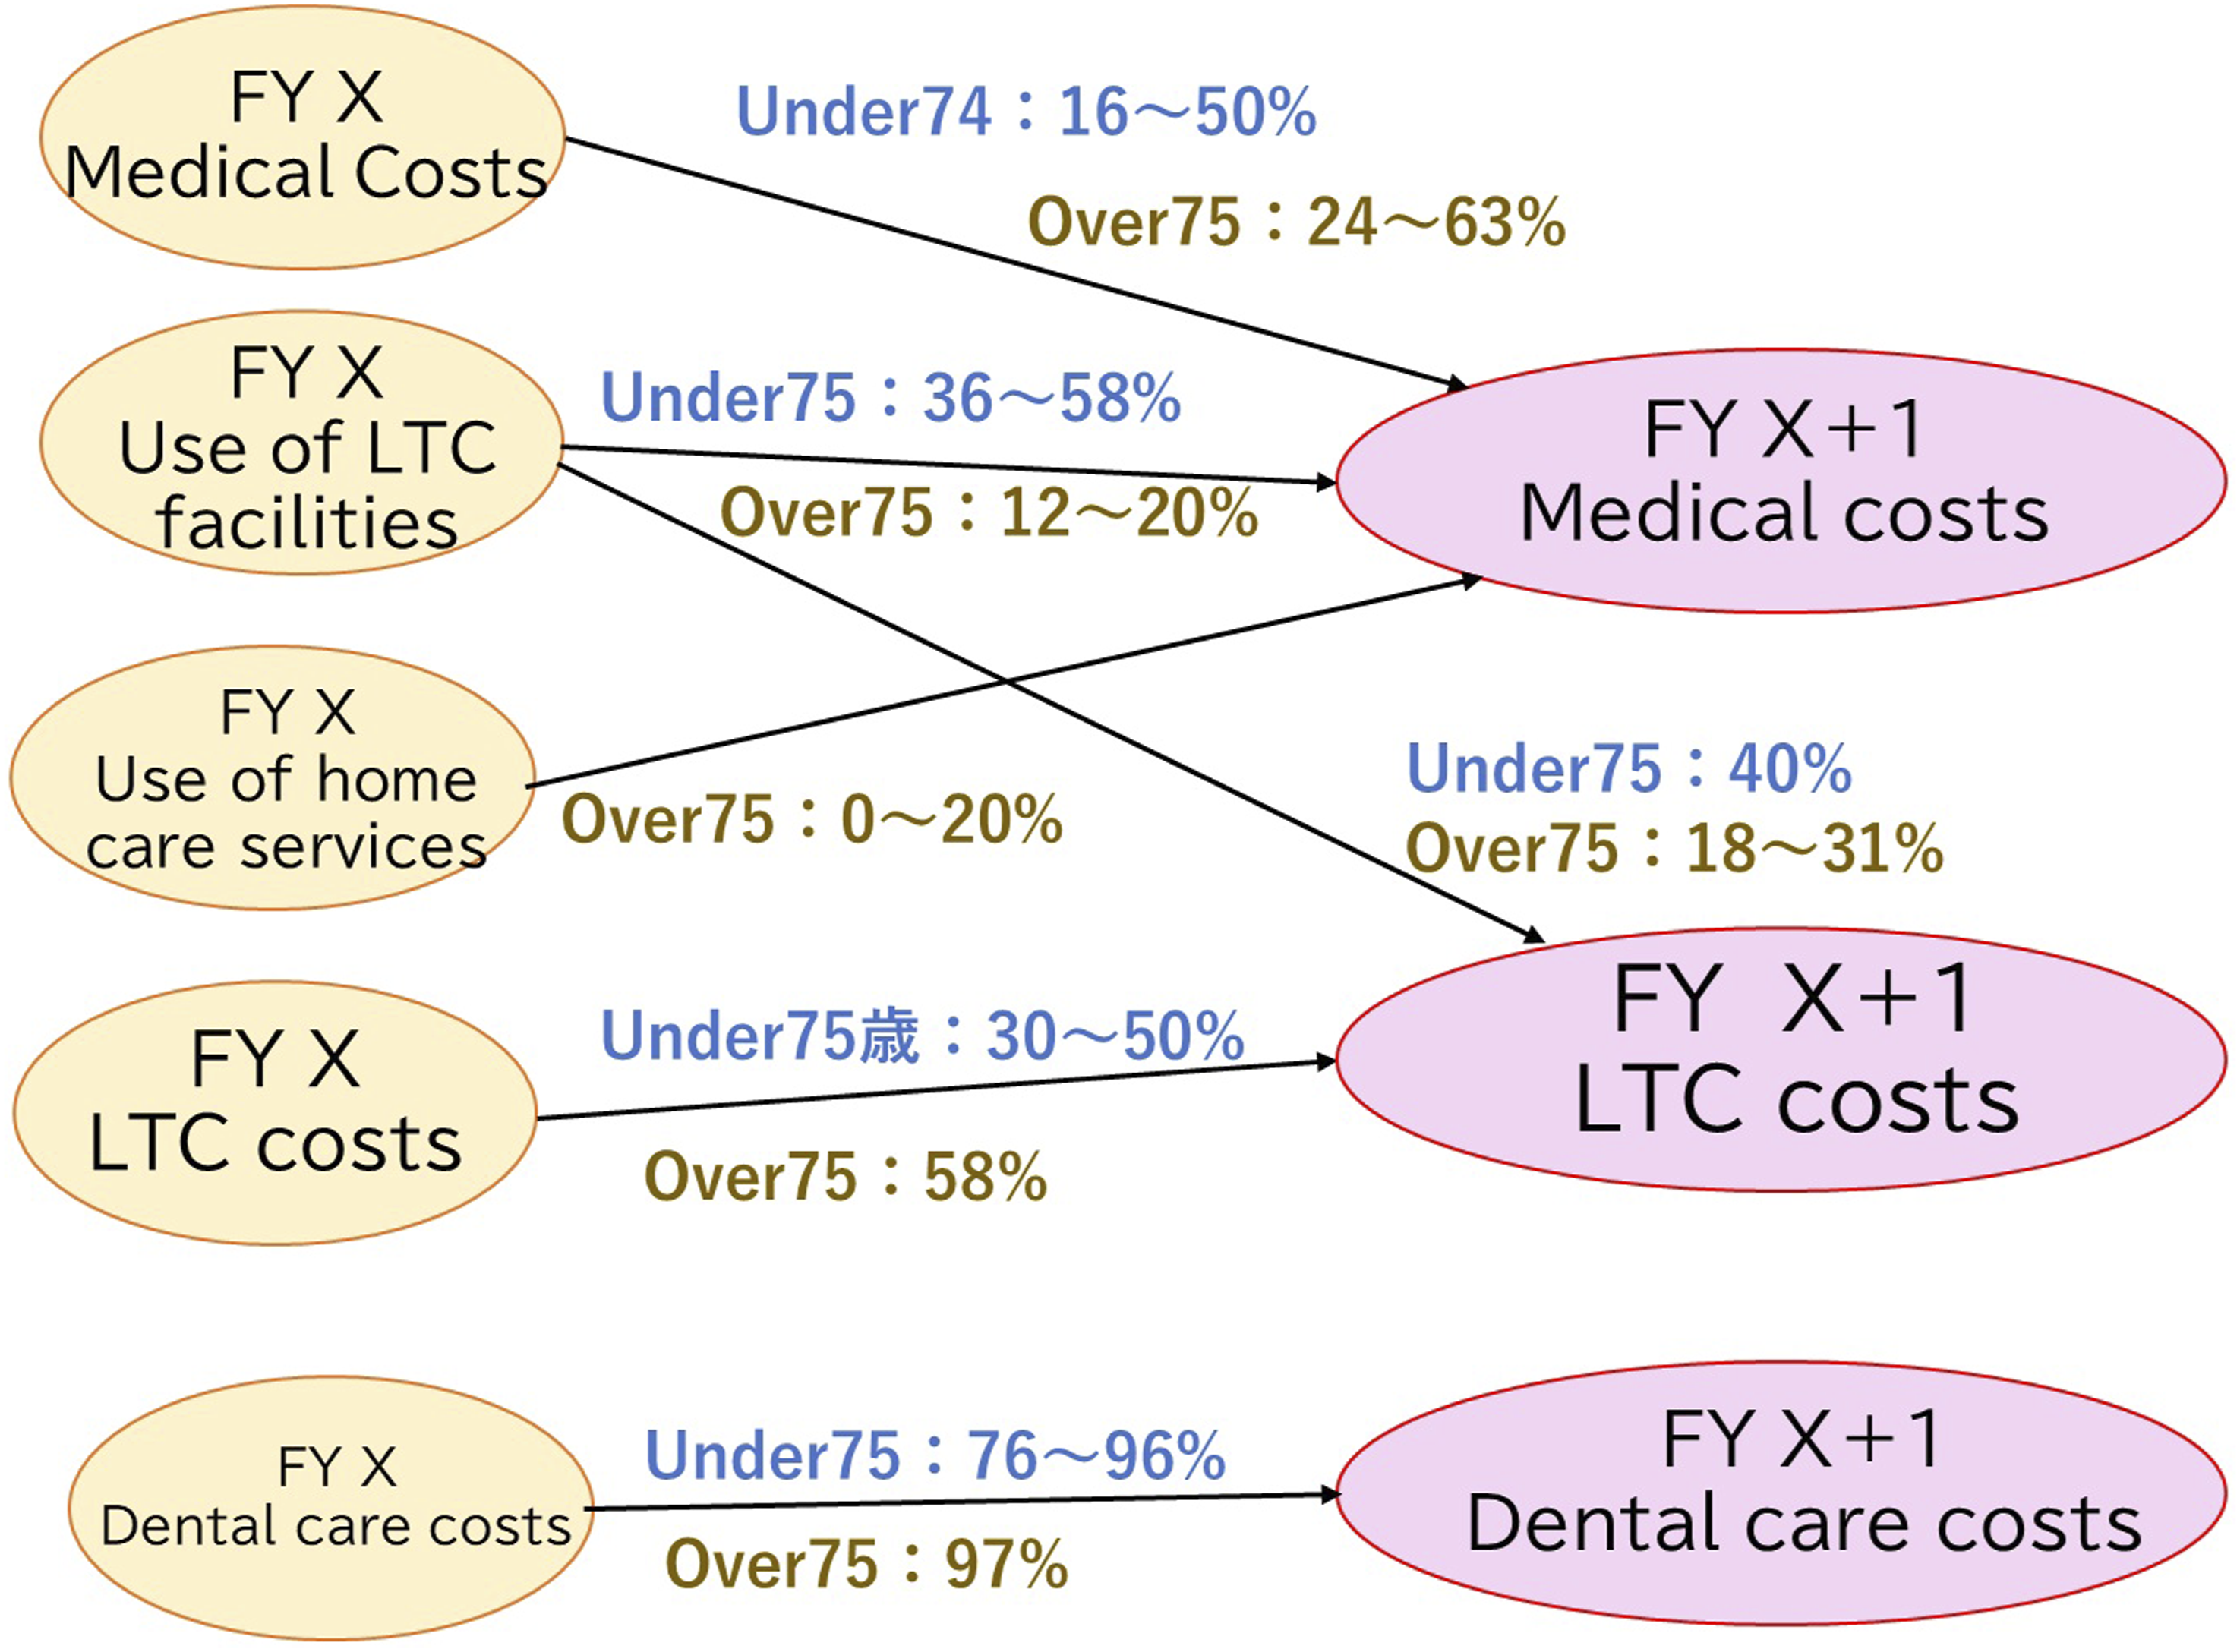
Discussion
An analysis of medical claims targeting LTCI users revealed that medical costs for year X as well as the usage status of facilities and home care services influenced year X + 1 medical costs. Year X’s LTC costs and the usage status of facility services may influence the LTC costs of year X + 1. Only year X’s dental care costs appeared to influence the dental care costs of year X + 1. Moreover, the presence or absence of type 2 diabetes, dental care expenses (status of dental visits), and level of care had an extremely small influence on medical, LTC, and dental care costs 1 year later.
Comparison and verification with prior research
We found that the medical costs of the previous year influenced the same costs in the following year and that the degree of this influence was high, especially among older people. Masuhara et al. 23 stated that, although medical costs show wide and random variations during youth and middle age, they may be closely correlated with past medical costs among older adults. We obtained similar outcomes. However, as the results indicated that predictive accuracy was extremely low, with an R 2 of 0.37 in the 74-or-younger model and 0.21 in the 75-or-older model, there is a need to reconsider the explanatory variables and target period.
Among participants aged 74 or younger, the usage or non-usage of facility services in the previous year had a significant influence on LTC costs in the following year, and among participants aged 75 or older, the LTC costs in the previous year had a significant influence on such expenditures in the following year. Under Japan’s LTCI program, the usage of LTC facility services is always costly. This indicates a pattern of people aged 74 or younger seeing their LTC costs rise dramatically the year after having used such facilities for the first time in the previous year, as very few people aged 74 or younger use these services. In other words, although this cannot be explained using the models based on our results, even among people aged 75 or older, LTC costs increased the following year if they had used LTC facility services.
The LTCI system varies by country. The LTCI system originated in the Netherlands. However, Germany and Japan were the first countries to legislate a public LTCI program and have a history of over 20 years of implementing numerous reforms and improvements. Germany’s LTCI Act prioritizes home-based care as well as prevention and rehabilitation as its two basic principles. Hence, even if an analysis similar to that employed in our study were conducted using German data, we assume that the outcomes would differ from the findings obtained in Japan, where numerous LTC facility services are offered. 27
The dental care costs accrued in the previous year significantly influenced the same costs in the following year. Takeuchi et al. and Kiuchi et al. noted the possibility of dental care interventions helping optimize medical and LTC costs.21,22 However, our findings imply that the degree of their contribution was not significant.
Our findings showed that high-accuracy ML models differed according to the participants’ age and the type of cost model. Alexandre et al., who used ML, indicated that if medical cost prediction was the objective, RF should be prioritized, whereas Ugochukwu et al., who analyzed models for determining medical insurance costs, revealed that the RF model’s prediction errors were small, a finding that differed from that of our study.12,18 Therefore, based on these results, when predicting medical, dental, and LTC costs, instead of assuming that there is an ML model that is optimal for all situations, it is important, especially when forecasting medical costs, to identify appropriate methods and techniques that match the data each time before embarking on analyses and comparisons.
Limitations
Medical insurance and LTCI systems are not internationally standardized, and the type, quality, and price of services differ by country. It is highly unlikely that applying the current analytical techniques to other countries and simply comparing their results will generate useful data. Because patients’ self-payment ratios also differ, the development of coefficients and other items that correct for such differences becomes necessary.
Moreover, because of the circumstances related to the periods of the databases that were available for use (2017–2019), we could produce only 2 years’ worth of prediction models for the following 1 year, resulting in a model that estimated the period only from years X to X + 1. However, substantial individual differences are present across the years when major medical, dental, and LTC costs accrue, and this frequency increases with age. Using long-term databases and building models that include patients’ personal health-related events in the medical, dental, and LTC sectors (especially for surgeries and other expensive events), we can establish more precise models for estimating medical, dental, and LTC costs.
Another limitation of this study was the exclusion of potentially important variables such as detailed clinical indicators, medication use, and socioeconomic status. These factors are known to influence healthcare expenditure and may improve model performance if included in future analyses. Additionally, although ML models were employed, full hyperparameter optimization and regularization procedures were limited, which might have affected predictive accuracy. The dataset might also contain unmeasured sources of bias or residual confounding factors, and the exclusion of records with missing values might have introduced selection bias, potentially influencing the generalizability of the results.
Conclusions
We investigated the influence of personal medical, dental, and LTC costs on such expenses in the short-term and quantitatively described the degree of their influence. To the best of our knowledge, this is the first study to combine a full range of personal medical, dental, and LTC costs to make predictions.
As a result of our analyses, which target patients with type 2 diabetes who also use LTCI, we found that medical costs in year X + 1 were notably influenced by medical costs in year X as well as the usage or non-usage of facilities and home-based care services. The LTC costs in year X + 1 were significantly influenced by medical costs in year X and the usage or non-usage of facility services. Dental care costs in year X + 1 were significantly influenced by dental care costs in year X. Moreover, the presence or absence of type 2 diabetes, dental care costs (status of dental visits), and level of care had an extremely small influence on medical, LTC, and dental care costs 1 year later. Because the predictive accuracy of LTC costs was high in our study, the results are reliable, especially as a model for predicting LTC costs in year X + 1.
Our results indicated that high-accuracy ML models differed according to age and cost models. Thus, when building prediction models that link medical, LTC, and dental care costs, it is important to set up individually tailored techniques each time that match the data before performing analyses and making comparisons.
Footnotes
Ethical considerations
This study was approved by Graduate School of Health Sciences, Hokkaido University Research Ethics Committee (approval no. 22-50-2) on December 13, 2024.
Author contribution
TS designed the study, performed the data analysis, and drafted the manuscript. HS, HE, TA, and WN contributed to data collection and field investigation. KO provided critical advice on the study design and supervised the overall research process. All authors reviewed and approved the final version of the manuscript.
Funding
The authors disclosed receipt of the following financial support for the research, authorship, and/or publication of this article: This work was funded by KAKENHI (Grant Number 22K17319), provided by the Japan Society for the Promotion of Science.
Declaration of conflicting interests
The authors declared no potential conflicts of interest with respect to the research, authorship, and/or publication of this article.
Data Availability Statement
The data that support the findings of this study are available from the corresponding author upon reasonable request.