
Abstract
Effective and accurate use of routinely collected health data to produce Key Performance Indicator reporting is dependent on the underlying data quality. In this research, Process Mining methodology and tools were leveraged to assess the data quality of time-based Emergency Department data sourced from electronic health records. This research was done working closely with the domain experts to validate the process models. The hospital patient journey model was used to assess flow abnormalities which resulted from incorrect timestamp data used in time-based performance metrics. The research demonstrated process mining as a feasible methodology to assess data quality of time-based hospital performance metrics. The insight gained from this research enabled appropriate corrective actions to be put in place to address the data quality issues.
Keywords
Introduction
Hospitals embrace innovative cross-disciplinary process improvement practices to ameliorate efficiency of care (EoC) and quality of care (QoC) delivered to their patients. One of the drivers for process improvement initiatives stems from the need to address poor performance metrics in core operational processes, 1 the implementation of new policies mandated by government or funding agencies and policy conformance while improving the provision of patient-centred care. Poor key performance indicators (KPIs) reported on core operational areas are often a starting point for process improvement activities.
The Emergency Department (ED) being the doorway into the Australian public hospital system is often overcrowded and linked with poor performance associated with morbidity and mortality. 2 Compliance with ED KPIs is perceived to ease ED overcrowding and improve patient flow, enabling the ED to focus on delivery of timely care required by its acute patients. In Australia, the National Emergency Access Target (NEAT) calls for EDs to discharge, admit or transfer 90 per cent of its patients within 4 h of presentation by 2015. 3 Measures relating to care timeliness, including ED throughput and care outcomes such as mortality, form the majority of ED quality measures. 4
The widespread implementation and use of electronic health records (EHRs) also referred as electronic medical records (EMRs) facilitate the collection, analysis and dissemination of time-based performance metrics. EHR is a longitudinal collection of electronic health information of a patient. 5 EHR has also been defined as a systematic electronic collection of patient’s health information such as a patient’s medical history. 6 It has been reported that the definition of EHR in the literature is rather ambiguous. 7 Numerical data are unambiguous and interpretable; literature review showed that 22 per cent of clinical decision support systems (CDSS) used only numerical data. 8 EHR-based CDSS are considered a solution to improve QoC. 9 Data from EHR are also being used for accountability and quality improvements.10,11
The volume of health data available for research will continue to grow. 12 Researchers working with large datasets need to understand not only the complexity of health processes but also the context within which data collection and management took place, in order to establish meaningful relationship with the real world. 11 It also becomes necessary for the end user of data (researcher and/or management) to be confident in the data quality (DQ) of the dataset used for the purposes of producing both performance reports and research output. Furthermore, a researcher may access data from a data warehouse put together by the Information Technology (IT) department external to the researcher. As such, the researcher does not have the insight into the extract, transform and load (ETL) process of the underlying dataset supplied for research. Therefore, the onus is on the researcher to take additional steps in understanding the data and subsequently assessing the DQ of the dataset used. Improving DQ will improve QoC. 11 This will also improve accuracy, completeness and consistency of computations. 13 Accuracy, availability, usability, integrity, consistency, standardisation and timeliness are some characteristics of high-quality data. 14 Many researchers have discussed problems with DQ, especially in large data extracted from EHRs and have proposed ways to address the inherent DQ issues.11,15,16 DQ assessment and improvement methodologies could be classified as either data-driven or process-driven strategies. 17 The approach taken in this research for DQ assessment and improvement is process-driven.
In this research, process mining (PM) technique was used to gain insight into the real process and subsequently the DQ of the variables used to produce time-based performance metrics for hospitals. PM sits between ‘machine learning and data mining’ on the one hand and ‘process modelling and analyses’ on the other. 18 Analysing historical data will give a true picture of the executed process.
The objective of this research is twofold. First is to construct a patient journey model from start-to-end using time-based data normally used for KPI reporting to give a holistic view of the patient journey. Cross-checking the patient journey model with domain experts will confirm whether the model emulates the day-to-day processes. Non-conformances in the process model could be attributed to incorrect data or other operational reasons. Second is to target process improvement activities to address the DQ issues that might have contributed to the abnormal flow and/or to implement strategies that will facilitate better process compliance. The focus of this article is on ED processes and ED time-based performance metrics; as such, only the ED model is discussed in the following sections.
Method
PM activities can be categorised into four perspectives: the control-flow perspective, the organisational perspective, the time perspective and the case perspective. 19 The PM perspective used in this research is the control-flow perspective. The goal of control-flow perspective focuses on the ordering of activities with the intention to discover all possible paths. 19 The activities are ordered chronologically using timestamp data recorded when a particular event took place. This perspective is suited for the discovery of abnormal flow because of its reliance on timestamp data. The timestamp data used in this research are date/time fields extracted from EHRs used to produce the hospital time-based performance metrics. The data gathering requirements were based on the hospital’s time-based KPI reporting.
The main software used for PM was Fluxicon’s Disco. 20 Disco is a specialised PM software available for free under their educational/academic licence. This software was used to construct the patient journey model from start-to-end. Other ancillary software used included MS Excel and MS Access, which were necessary for pre-processing of the derived event log. An alternate open-source PM software is ProM which may also be used instead of Disco.
Study setting and data
A retrospective administrative data of all hospital patients who presented to the ED at Flinders Medical Centre (FMC) from 1 January 2010 to 17 June 2014 were supplied by the hospital. FMC is a tertiary public teaching hospital with one of the busiest EDs in Australia, attending to approximately 60,000 patients per annum. PM methodology has been used in other context at FMC in previous research. 1 At FMC, all incoming patients are triaged upon presentation using the Australasian Triage Scale (ATS) which assigns each patient to an urgency category ranging from 1 (to be seen immediately) to 5 (should be seen within 120 min). Patients are streamed into those who are likely to be discharged from the ED and those who are likely to be admitted to the hospital.
The ED data supplied by the hospital were extracted from the FMC’s in-house Emergency Department Information System (EDIS). The patient journey data supplied by FMC contain information on admitted patients only and record detailed information on the movement of patients from the time of admission to the time of discharge. An individual patient could have multiple admissions at different points in time, and each admission is allocated a unique journey number that remains the same until discharge. The data from EDIS and the patient journey data are part of a state-wide collection of EHR. Similar data could be retrieved for other hospitals within the network. Ethics approval for the use of data was granted by the Southern Adelaide Health Service/Flinders University Human Research Ethics Committee.
PM – feature extraction
The fundamental element needed for PM is historical event log. Event logs are auto-generated data that capture, among other information, the timestamp of meaningful events and reveal insight into how a process was executed. The event log in this research was derived from the two datasets (EDIS and patient journey data) supplied by the hospital as mentioned above. The required features necessary to derive the event log were based on the data used by FMC to produce their time-based performance reporting. The feature extraction involves the amalgamation of raw data from two datasets, paying careful attention when linking admissions from one dataset with the other dataset. The process of deriving the event log is a far from trivial exercise and is detailed in previous work. 1 The derived event log was then used for PM within Disco to construct the patient journeys from start-to-end.
The dataset contained date and time fields needed to derive timestamps for the following: ‘Triage Date/Time’, ‘Nurse Seen Date/Time’, ‘Doctor Seen Date/Time’, ‘ED Departure Date/Time’ and ‘Ward Date/Time’. All these fields were converted to the date/time data type. The ‘Triage Date/Time’ is the timestamp when a patient enters the ED and is triaged according to treatment priority using ATS previously discussed. The ‘Nurse Seen Date/Time’ and ‘Doctor Seen Date/Time’ fields are manually entered when the patient is seen either by a nurse or by a doctor. ‘ED Departure Date/Time’ is the timestamp of a patient’s ED Disposition. The ‘Ward Date/Time’ field captures the timestamp of the ward(s) occupied by an in-patient. In the ED, the activities are classified into four main phases/processes: ‘Triage’ phase, the ‘Nurse Seen’ phase, the ‘Doctor Seen’ phase and the ‘ED Disposition’ phase. Beyond the ED, the activities are the ward(s) occupied by an in-patient. All these timestamps and activity names are essential fields required for constructing the processes that took place in the patient’s journey from start-to-end. A snippet of the derived event log is shown in Figure 1.
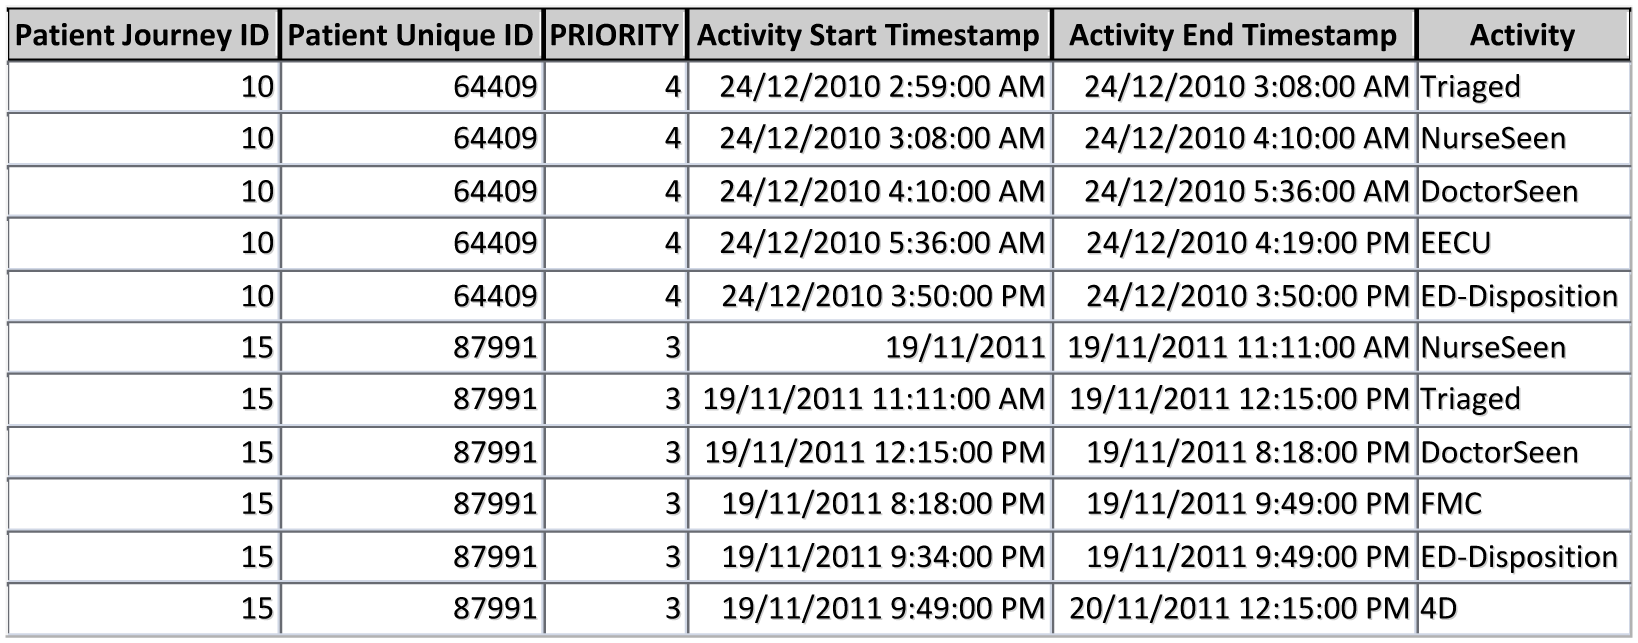
Snippet of the derived event log.
Each tuple contains information about an event. Once a systematic method is established to generate the event log of the process of interest, other attributes/fields for patient journeys and activities can be easily added for further analysis. The essential fields needed for process flow discovery are ‘Patient Journey ID’, ‘Activity Start Timestamp’, ‘Activity End Timestamp’ and ‘Activity’ fields. These fields and format make the event log usable and compatible to be used in ProM to take advantage of other PM algorithms. An event log contains millions of records; therefore, for meaningful analysis, it is necessary to filter the event log according to a specific scope to produce models that are interpretable.
Insight into the DQ and process information from the derived event log
The derived event log was then used to gain insight into the DQ of the various fields used in feature extraction and to discover the executed ED process flow. The derived event log which was pre-processed using MS Access was saved in a comma separated values (CSV) format. This CSV file was loaded into Disco to construct the patient flow model from start-to-end using Disco’s in-built process discovery algorithm. The technicality of PM algorithm is not of interest, and this level of detail is hidden from the end user. A manual check of the model comparing it with the data from the derived event log using a small number of events is advisable and is a good practice when dealing with big dataset. The derived activities represent a phase or process within the patient’s journey. The phases correlate to the time-based performance metrics. Table 1 shows the ED time-based calculation used in performance metrics at FMC.
Time-based calculation used in ED performance reporting at FMC.
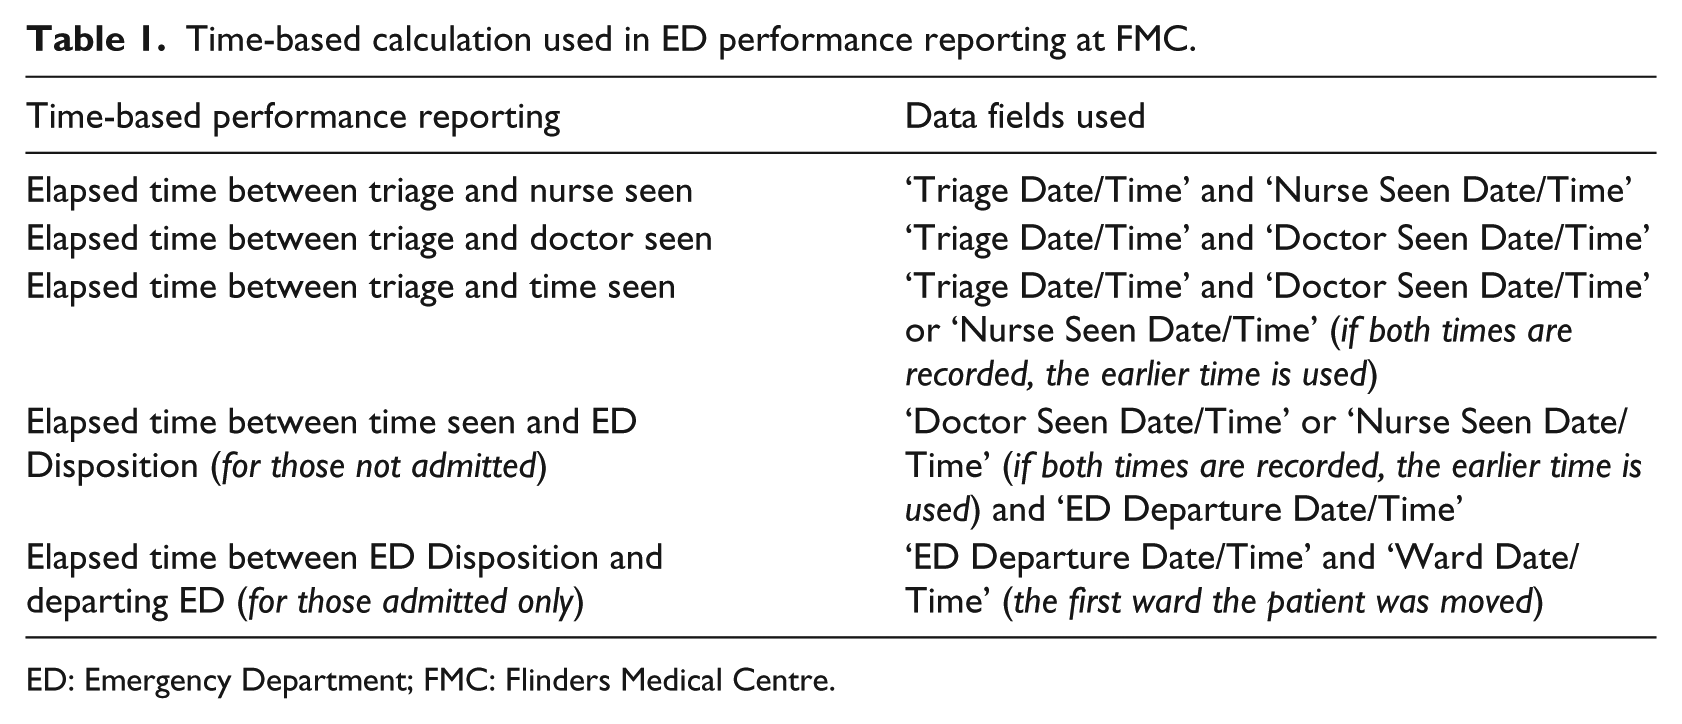
ED: Emergency Department; FMC: Flinders Medical Centre.
Constructing the event log based on these fields aids in discovering discrepancies in data for the specific fields used for KPI reports because the patient flow model is formulated using these timestamps in chronological order. On the other hand, because the derived event log relates to the processes that took place in the patient journey, any DQ issues identified can be traced to the process area to initiate improvement.
Results
The ‘Results’ section is presented and discussed under four main sections. Section ‘Snippet of the overall patient flow model’ is directly linked with the discovery of DQ issues pertaining to ED performance metrics. The other sections are presented to depict the complete steps that can be used to drill down a large dataset to identify specific time-based DQ issues. The sections are presented in chronological order representing steps taken to examine time-based discrepancies. This was done working closely with the domain experts. Figure 2 shows the overall patient flow model for the duration of the study constructed from the derived event log. This figure is shown for the purpose of completeness only. It represents the main flow demonstrating 273,024 patient journeys from start-to-end. The rectangles represent the various phases of the patient journey. Within the ED, the phases represent four main processes, and beyond the ED, they represent the ward(s) occupied by the patient during their admission. The main phases within the ED, the focus of this article is in the oval as shown in Figure 2.
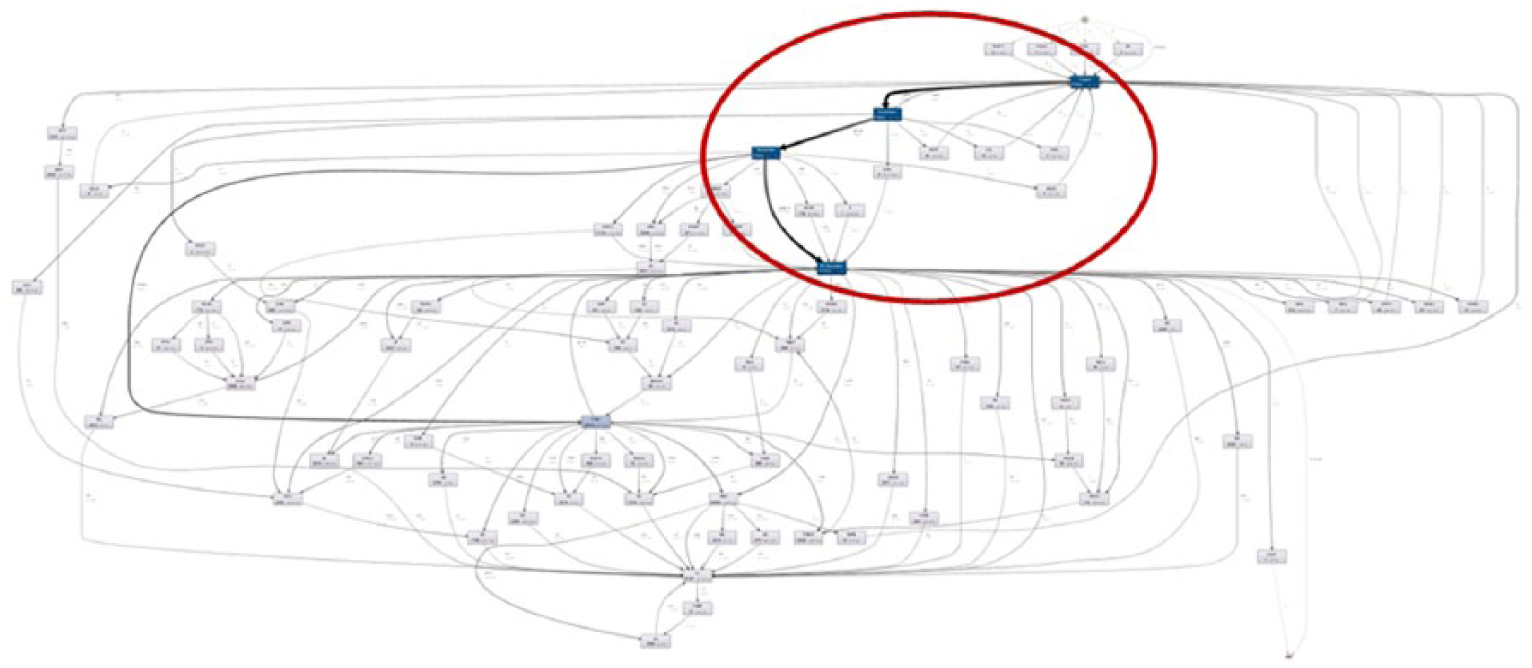
Overall patient flow model from ED presentation to hospital discharge (figure shown for completeness only).
Snippet of the overall patient flow model
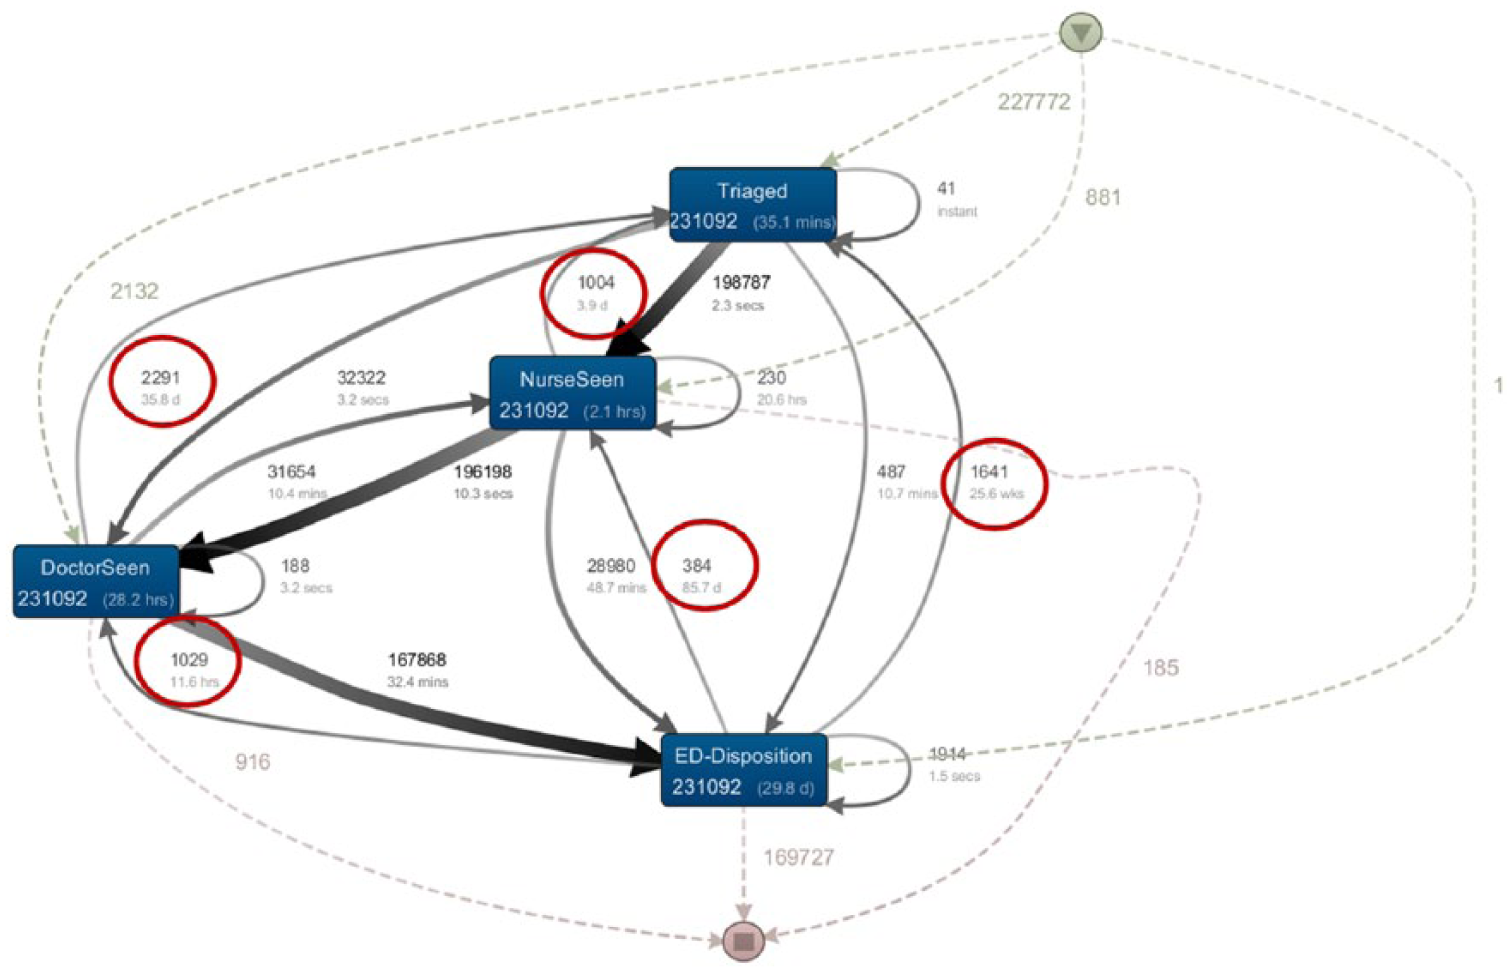
A snippet of the initial patient flow model, expanding on the main process flow within the ED, is shown in Figure 3. The lines with arrows represent the direction of flow. The patient flow in Figure 3 highlighted fundamental flaws in the data and is not a correct reflection of the patient journey. After triage, patients are seen by a nurse and then by a doctor or the patients could be seen directly by a doctor followed by a nurse. The ED disposition decision is made by the doctor in consultation with a more senior consultant if required. As such, the patient journey within the ED should flow from ‘Triage’ phase to either the ‘Nurse Seen’ phase or the ‘Doctor Seen’ phase and finally to ‘ED Disposition’ phase. In Figure 3, for example, there are patients who are being ‘Triaged’ after being seen by a nurse, seen by a doctor or after ED disposition. It is possible for the patient journey to flow from ‘Doctor Seen’ phase to ‘Nurse Seen’ phase. The number of journeys with abnormal flow and the duration of the abnormal flow are highlighted inside the ovals in Figure 3. The numbers inside each rectangle/phase represent the number of patient journeys and the mean processing time for each phase. The numbers next to dashed lines represent patient journeys from phases that are not visible in the current figure. It is possible to display all phases and path as needed. This was not done here as this will produce a complex diagram as per Figure 2.
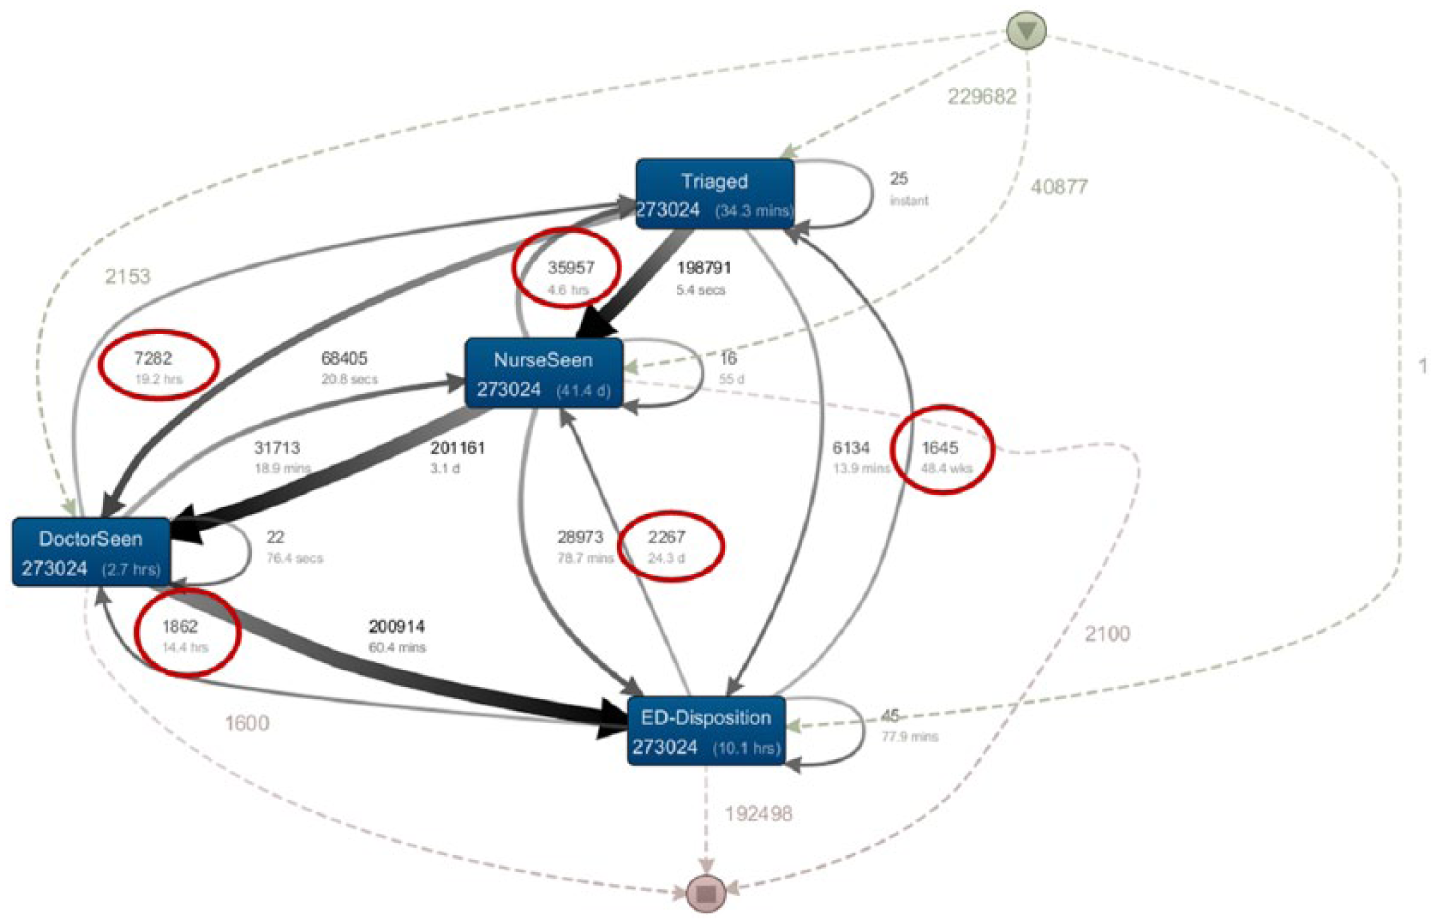
A snippet of the initial patient flow model representing ED phases.
This abnormality or non-conformance in the flow prompted a closer look at the raw data used to derive the event log. Two issues with the raw data were identified:
There were many records in the dataset, with time of activity recorded as zero. Because the time recorded in this field is in minutes past midnight, the zeros were converted to 12 midnight. The domain experts clarified the actual execution of work that might have contributed to this discrepancy; either the event did not occur in which case this field should be null and not zero, or this event did occur but the data were not promptly entered to reflect the actual time in which case this field should also be null and not zero. There is no automatic timestamp to capture the time accurately in the system.
This issue affects the time calculation for ‘Elapsed time between triage and time seen’ performance reporting. ‘Elapsed time between triage and time seen’ is the elapsed time between either a ‘Nurse Seen’ time or a ‘Doctor Seen’ time, whichever occurs first, and ‘Triage’ time. Records with zeros converted to midnight will therefore contribute to incorrect calculation of this performance metric.
As a result, appropriate corrective actions were put in place to account for the zeros as missing values rather than midnight.
First iteration of patient flow model
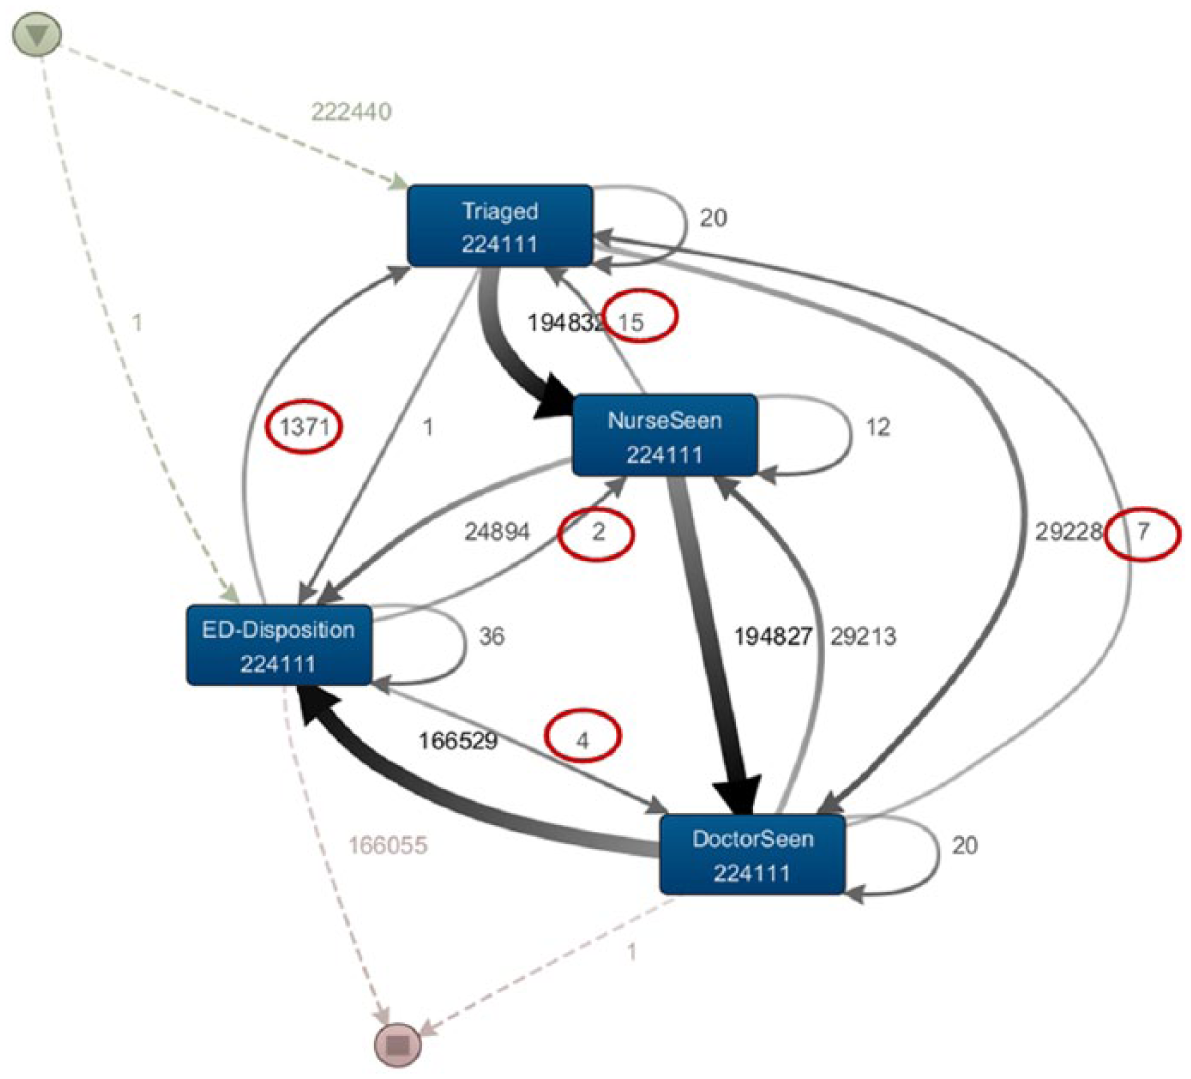
A step-by-step elimination process was used to facilitate discovery of other DQ issues. Records with zero time were temporarily removed to create the first iteration of the patient flow model focussing on ED phases as shown in Figure 4. Once again, the derived log used to construct the patient flow model is an imperfect reflection of patient journeys. There are still arrows flowing in unexpected directions, but the number of journeys with abnormal flow is much less than in the previous model. A closer look at the individual patient journeys within Disco revealed that there were many timestamps with different events taking place at the same time. For example, there were records where patients were triaged and seen by a nurse or doctor at the same time. In such circumstances, there were no issues with the data.
First iteration of the patient flow model representing ED phases.
The domain experts clarified the actual process and confirmed that this is a true reflection of the work flow in the ED. In addition to detecting abnormality, PM can also be used to detect conformance to processes.
Second iteration of the patient flow model
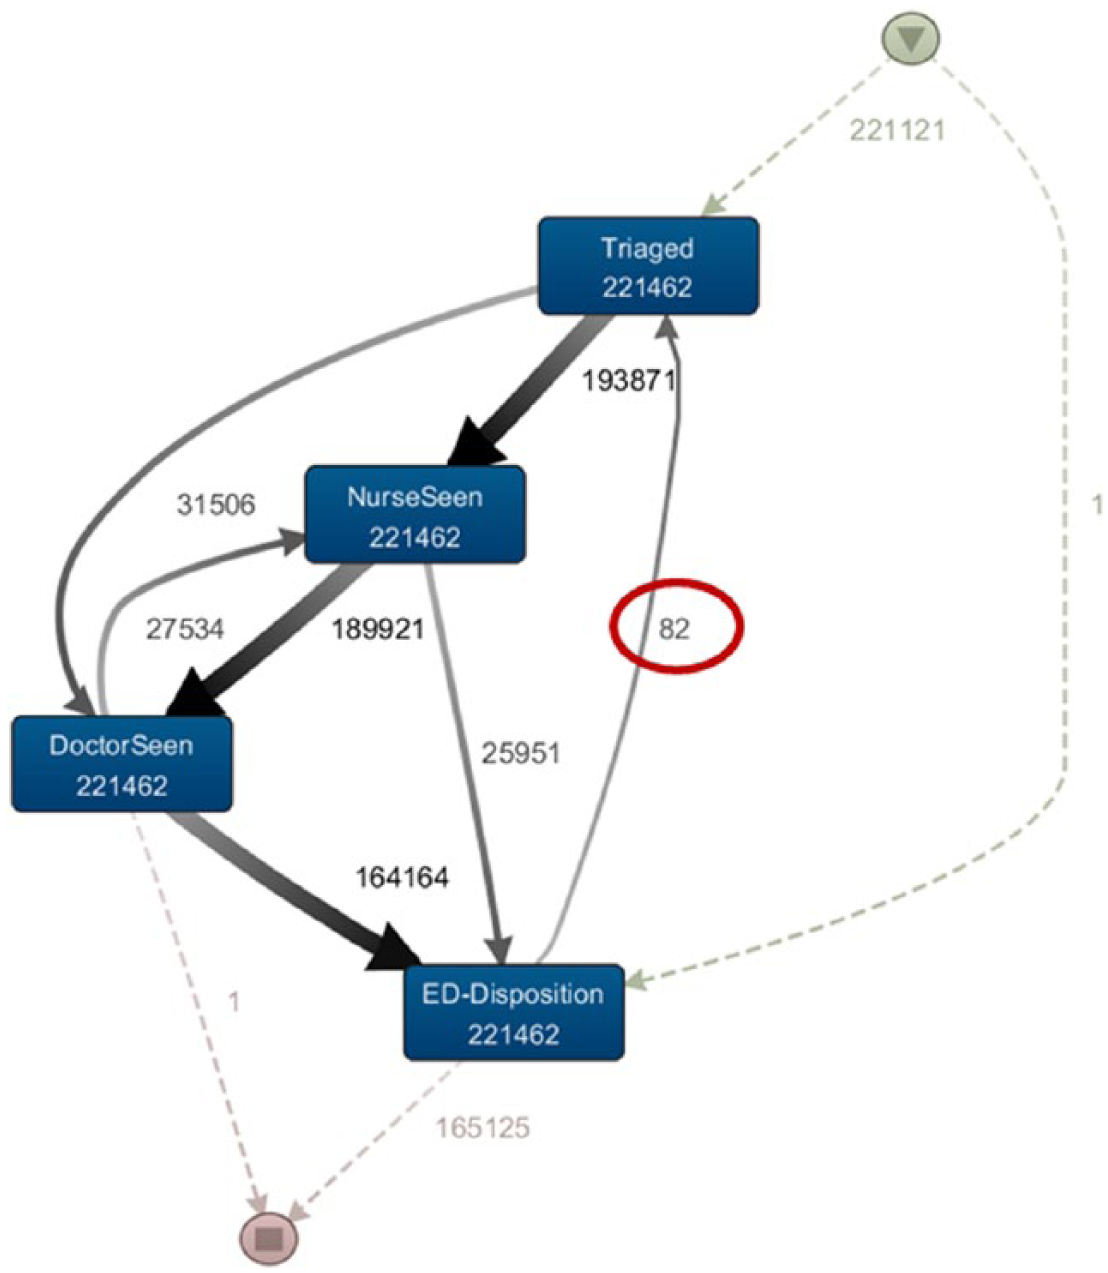
The second iteration of the patient flow model was constructed after eliminating records with zero time fields and records where distinct events took place at the same time as discussed in section ‘First iteration of patient flow model’. The resultant patient flow model is shown Figure 5. There are still some issues with this model, but the frequency of journeys flowing in unexpected directions is less, as highlighted inside the ovals.
Second iteration of the patient flow model representing ED phases.
Exploring the dataset further using the PM tool, drilling down to individual patient journeys indicated issues with the Patient Journey IDs. This is a derived field. Patient journey should be unique for each admission. However, in some instances, this was not the case. There were records where two patients were sharing one Patient Journey ID. This is highlighted in Figure 6 which represents one patient journey. The Unit Record Number (URN) is unique for each patient as seen in the highlighted area but shows that this particular admission has two patients attached to it.
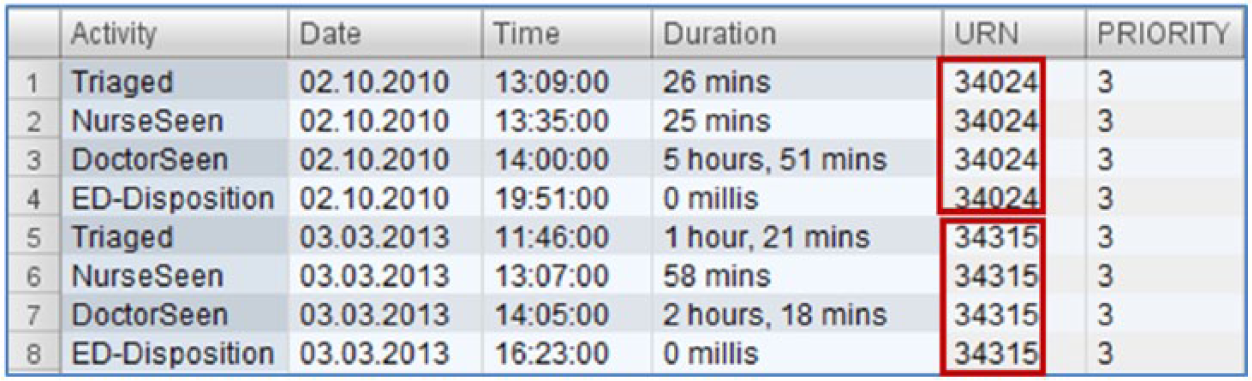
Patient journey details.
The Patient Journey ID field is a derived field for the purposes of constructing the patient journey model from start-to-end. As such, this was not a data entry error and could be fixed easily by changing the algorithm used to derive the Patient Journey ID. Although not directly linked to the ED time-based performance metrics, this discovery is still important for other PM activities using the derived event log.
Third iteration of the patient flow model
After the records with incorrect Patient Journey ID were eliminated, there was only one remaining flow in an unexpected direction: the path/flow direction from ‘ED Disposition’ phase to ‘Triage’ phase as shown in Figure 7.
Third iteration of the patient flow model representing ED phases.
Since the ‘ED Disposition’ phase to ‘Triage’ phase was the only remaining phase with abnormal flow direction, this phase was zoomed in further to reduce the number of journeys involved, to ease the job of inspecting data. This is shown in Figure 8.
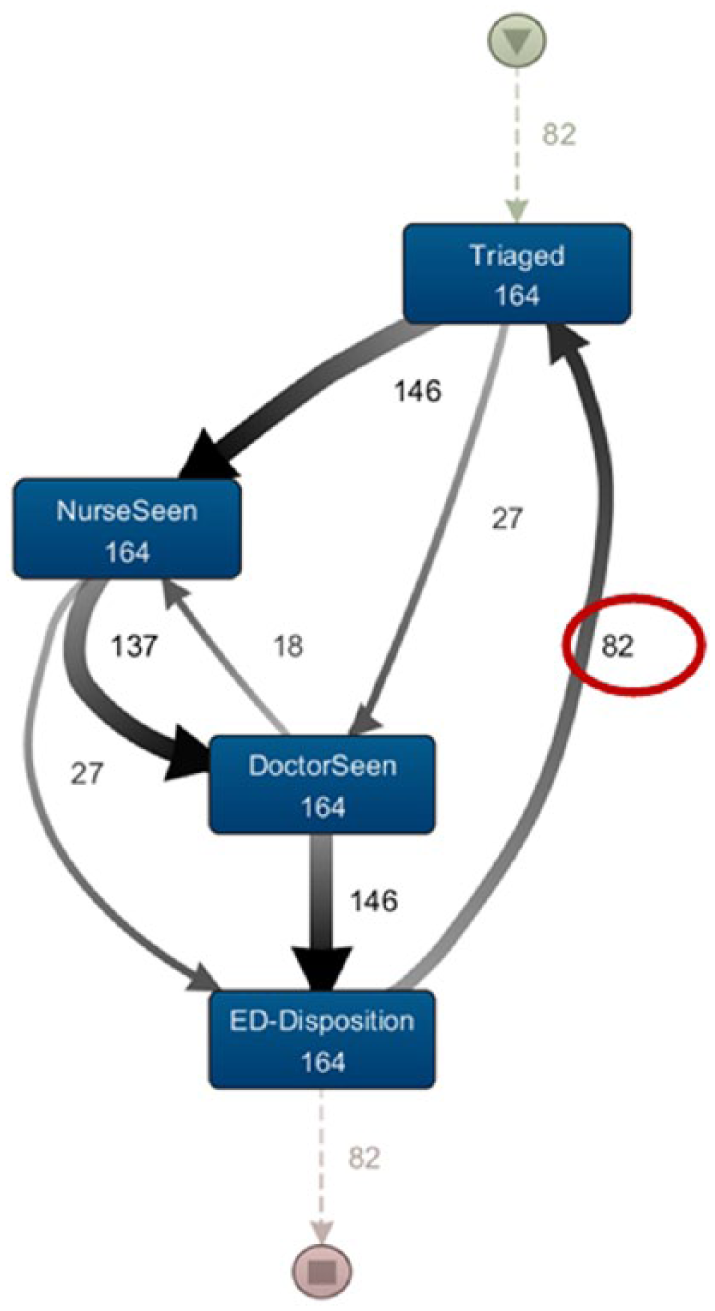
First iteration of ‘ED Disposition’ phase to ‘Triage’ phase zoomed in.
Looking further at the data of the patient journey once again indicated problems with Patient Journey ID for patients admitted and discharged from the ED twice but not recognised as a separate admission as per Figure 9. This problem is also easily rectified by fixing Patient Journey IDs.
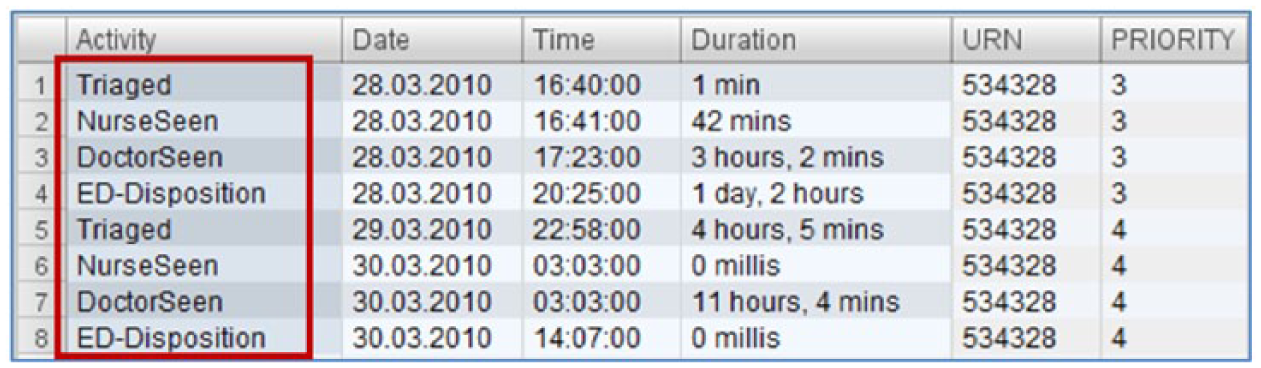
Patient journey details with duplicate date entry.
The latter part of the iterative process (sections ‘Second iteration of the patient flow model’ and ‘Third iteration of the patient flow model’) are important to be considered when the data will be used to build simulation models as described in previous research. 1
Discussion
It has been reported that ED time-based metric is a useful tool to evaluate ED processes. 21 Widespread transparency and accountability are looked upon favourably and are seen to improve hospital processes. The availability of EHR poses opportunities and challenges. It has provided opportunities to undertake retrospective studies and advance evidence-based practice to improve EoC and QoC. Small sample size is no longer an issue with the availability of large datasets and the availability of technology to process them. However, poor DQ is seen as a barrier to optimal use of routinely collected data. 11 Policies and organisational models together with a positive attitude to data sharing are seen to influence DQ. 22
The demand for high-quality data is indispensable with the prevalence of CDSS that relies on statistical results analysed from EHRs data. 23 Real success of CDSS will come with more accurate capture of the data items needed for decision making. 8 Championing to improve DQ and raising staff awareness of the consequence of inaccurate data will help staff make a more concerted effort to ensure fields used for analysis are correctly completed. In the Welsh system, the Quality and Outcomes framework combined with peer pressure has been reported to improve the quality of general practitioner (GP) records, and a financial incentive scheme such as the DQ system was introduced to improve the quality of EHR. 24 As demonstrated in this research, the inaccuracy of data in certain fields was highlighted, and the visual representation of this abnormal flow makes it possible to have a dialogue with the front-line staff in raising awareness of the implications of inaccurate data.
Studies have demonstrated that incorporation of mandatory data entry fields relevant to the process at hand is associated with high data completeness and accuracy. 25 It is also important to provide real-world context in any process improvement activities. Nursing staff should be included in process re-design in areas where data entry is predominantly done by nurses, to improve quality of information. 26
Using PM, the abnormalities in process flow could be investigated at process level and at data level. Process improvement can be targeted where it is needed to improve EoC and QoC. QoC can be compromised as a result of dysfunctional processes. 27 Time-based performance measurements in ED have been reported to contribute to process improvements when unrecognised gaps were identified and measures taken to improve the underlying process. 4
This single site nature of this study is a limitation. The specific DQ issues highlighted at this hospital might not be applicable to other hospitals within the network. However, similar fields could be extracted from other hospitals for future investigations of DQ using PM.
Conclusion
It is imperative to ensure the quality of the data used to report on hospital KPIs is of high quality as it may influence funding models and decisions made by policy makers. Furthermore, improving DQ also improves QoC. An effective way to assess DQ of fields used to generate time-based KPIs from large datasets is necessary.
Application of PM in healthcare is still in its infancy. In this research, the flow of patients within the hospital from start-to-end was constructed using data extracted from fields used to report on time-based performance metrics. The visual representation of patient flow enabled the assessment of the DQ of the data fields used to construct the patient flow diagrams. The use of PM in healthcare gives insight into complex hospital processes and enhances knowledge discovery. This process knowledge complements statistical analysis by giving insight into the aggregate reporting of numbers. Visualisation of the historical process adds profundity that is not easily apparent by looking at numbers alone.
This is the first known research of its kind demonstrating an innovative use of PM to assess the DQ of data used to report on time-based ED performance metrics for a large dataset. The abnormality in the patient flow was assessed by the domain experts and attributed to incorrect data. As a result of this work, appropriate corrective actions were put in place to account for the zeros as missing values rather than midnight in order to address the DQ issues. The PM framework used in this research is generalisable. It is based on data fields used to produce time-based performance metrics common to most hospitals.
Footnotes
Declaration of Conflicting Interests
The author(s) declared no potential conflicts of interest with respect to the research, authorship, and/or publication of this article.
Funding
The author(s) received no financial support for the research, authorship and/or publication of this article.