
Abstract
Objective
This study aimed to assess the practicality and trustworthiness of explainable artificial intelligence (XAI) methods used for explaining clinical predictive models.
Methods
Two popular XAIs used for explaining clinical predictive models were evaluated based on their ability to generate domain-appropriate representations, impact clinical workflow, and consistency. Explanations were benchmarked against true clinical deterioration triggers recorded in the data system and agreement was quantified. The evaluation was conducted using two Electronic Medical Records datasets from major hospitals in Australia. Results were examined and commented on by a senior clinician.
Results
Findings demonstrate a violation of consistency criteria and moderate concordance (0.47-0.8) with true triggers, undermining reliability and actionability, criteria for clinicians’ trust in XAI.
Conclusion
Explanations are not trustworthy to guide clinical interventions, though they may offer useful insights and help model troubleshooting. Clinician-informed XAI development and presentation, clear disclaimers on limitations, and critical clinical judgment can promote informed decisions and prevent over-reliance.
Keywords
Introduction
ML-based tools have the potential to significantly improve health and healthcare delivery, 1 yet these methods are often ”black-box” in nature. In this context, ML models often fail to elucidate which influential factors affect individual predictions as well as how changes to these observable inputs affect or modulate the outcome being predicted. This is an important deficiency because clinicians’ understanding and confidence in using predictions to guide interventions in a complex process that is modelled is the key to trust. Knowing the main contributing factors allows their evaluation in terms of their coherence with respect to the application task and its potential actionability could help in building trust in clinical settings. 2 If the explanation cannot explain why a future problem will evolve, and thus justify treatment interventions then clinicians can rightly be sceptical. The lack of transparency in their function reduces their trustworthiness3,4 and is a barrier to their adoption for clinical decision-making. Understanding the methods should also be sufficient for clinician to suspect when the tools are not working, or being used outside the purpose for which they were developed.
To understand complex ML models, different eXplainable AI (XAI) methods have been proposed in the literature. 3 These methods can be categorised into (i) gradient-based e.g., SmoothGrad, 5 Integrated Gradients, 6 Deep Taylor Decomposition (DTD) 7 ), Layer-wise propagation, 8 and (ii) perturbation-based e.g. LIME, 9 Shap. 10 Still, there is little understanding of how applicable or useful they are in clinical settings or whether they should be significantly re-tailored or even novel XAI methods developed.
From clinicians’ view, knowing the subset of features driving the model outputs is crucial as it allows them to compare the data-driven model decisions to their clinical judgment, especially important in case of a disagreement. 2 Findings suggest that rigorous evaluation of explanations against the following criteria: (i) domain-appropriate representation, (ii) potential actionability and (iii) consistency could contribute to building trust in clinical settings. 2 Recent studies11,12 report inconsistency between the explanations generated by various popular explanation methods. This variability implies that at least some generated explanations are incorrect. If incorrect, explanations at a patient level could be misleading and could lead to wrong decisions with dire consequences in applications such as healthcare. However, there is no literature focused on evaluating explanations, their usability and their effect on trust in clinical settings.
The objective of this paper is to: i) examine the (dis)agreement among the most commonly used XAI methods in clinical settings, ii) assess their utility and trustworthiness, iii) identify key requirements for building trust and iv) provide actionable insights to mitigate identified limitations. To our knowledge, this is the first study of its kind.
To that end, we presented results of the quantitative analysis of explanations at both the patient (i.e. local explanations) and the cohort (i.e. global explanations) level. We discussed them in terms of their coherence with respect to the application task, impact on the workflow and consistency. The anaysis focused on two the most used XAI methods for explaining clinical predictive models: Shap 10 and DTD. 13 It is performed on two EMR datasets sourced from the two major Australian hospitals examining data-driven models predicting unexpected patient deterioration 14 and hospital readmission after discharge. 15 These results and their implications from clinicians’ perspectives are discussed and the necessary criteria for having trustworthy explanations and how these guide the choice of intervention provided.
The main contributions of this paper are: • Conducted comprehensive benchmarking and analysis of two popular XAI methods to evaluate their effectiveness in explaining ML-powered clinical prediction models. • Contributes to debate on what degree an explanation could be sufficient by discussing implications of the results in the context of applicability and usefulness in clinical settings. • Highlights the limitations and potential benefits of state-of-the-art XAI methods in clinical contexts, contributing to developing of trustworthy XAI solutions. • Suggested necessary criteria for trustworthy explanations. • Provided actionable insights to mitigate risks of identified shortcomings and concrete suggestions/directions for future research.
Methods
Datasets
This is a cross-sectional study. To evaluate XAI methods, two datasets from two published studies were used. Vital Signs (VS) dataset comprise vital signs and administrative data with N = 3,237,601 records. These were used to predict patient deterioration in acute settings. 14 The second dataset comprised administrative data, pathology, and medication data. These were used for predicting patient readmission within 30 days (RA30). 15 In this study, we considered Children’s cohort and an All-inclusive scenario comprising N = 139,941 records. Datasets characteristics are provided in the Supplemental information Table S1 and S3.
Predictive models
To explore the agreement between the features obtained by different methods we selected three modelling approaches, each representative of one modelling paradigm: regression, conventional ML, and deep neural network (DNN) (Figure 1(a)). We chose logistic regression(LR) with l1 regularization (L1),
16
aka LASSO, as the most accepted predictive model for clinical applications. Unlike other ML models which are generally more complex, it allows insight into the model structure (interpretability) and is a trusted and accepted model among clinicians. Its main disadvantages are the inability to capture complex patterns and hence poorer performance when dealing with high-dimensional or non-linear data. Thus, choosing between interpretable and explainable depends on the specific requirements of the application. We considered XGB
17
as representative of conventional ML, which along with the random forest demonstrated to be powerful models when dealing with large and complex data. Dense NN model
16
was deployed to explore the explainability of NN-based models. Details regarding model development i.e. inputs, outputs, hyperparameters and training, are provided in the Supplement Section 1. Visual summary of the experiment design: Models and XAIs (a) Agreement metrics (b) and evaluation criteria (c) used to assess XAIs. PL and CL stand for evaluation performed at patient and cohort levels, respectively.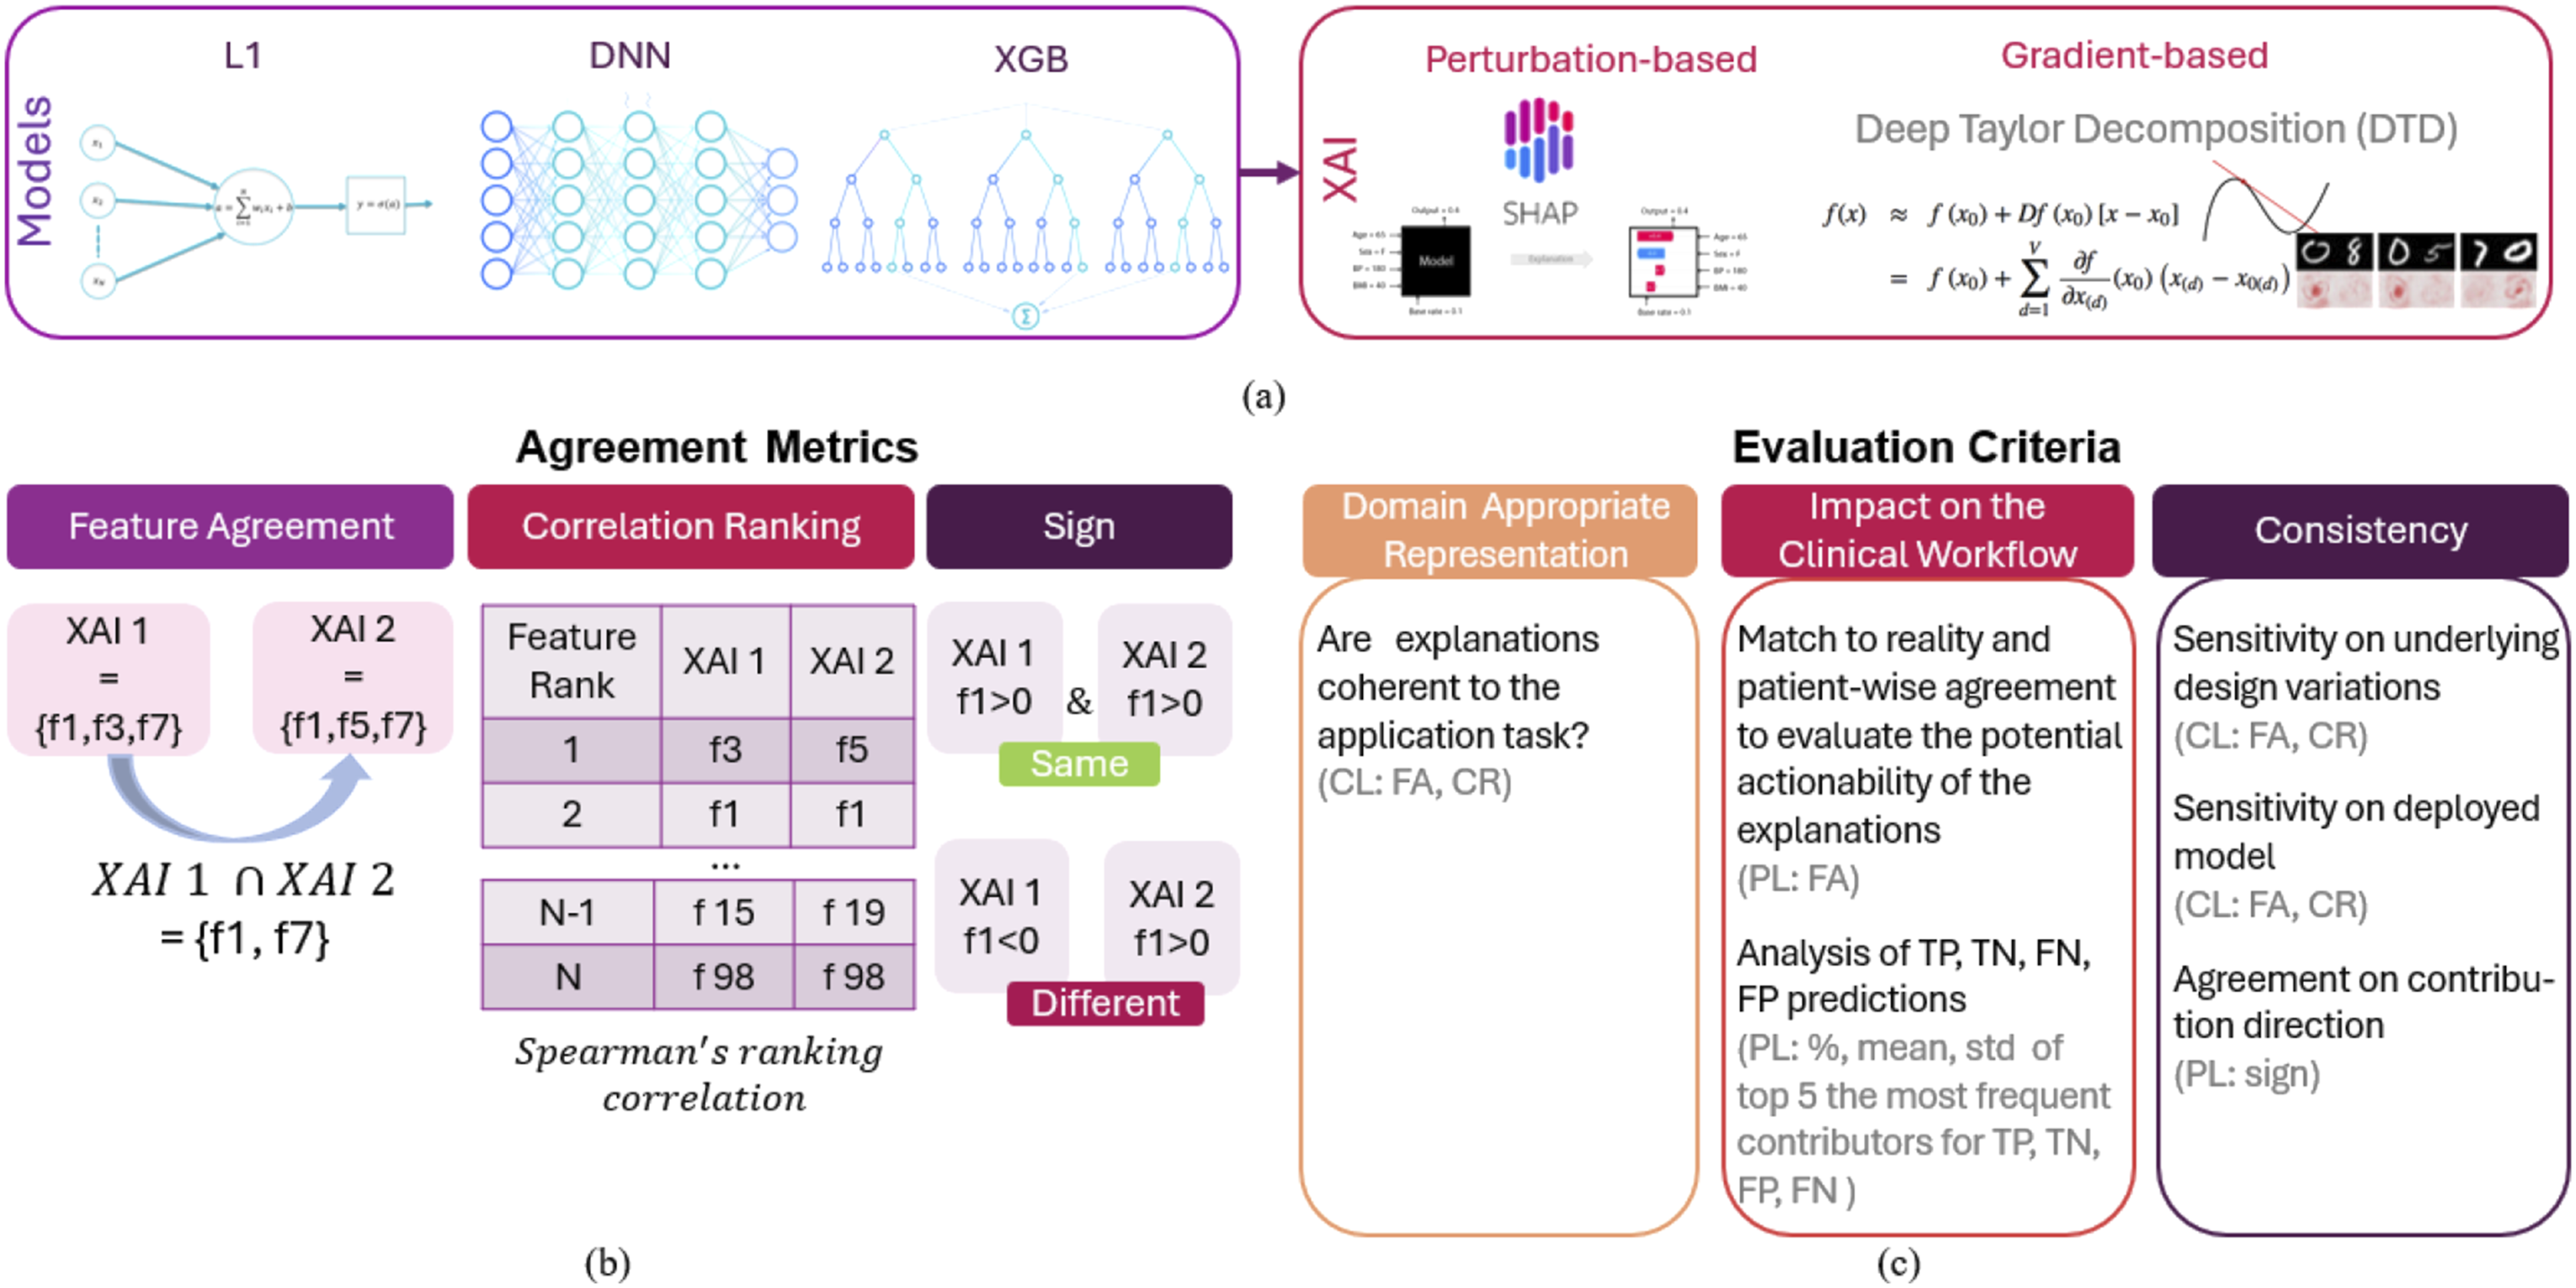
Explanations
Two XAI methods, one gradient-based named Deep Taylor Decomposition (DTD), and one perturbation-based named Shap were employed to explain the models’ outputs (1a). Shap 10 explains by calculating the contribution of each feature to a model’s prediction by averaging the marginal effects of the feature across all possible feature combinations, the principle adopted from cooperative game theory. DTD 7 decomposes a model’s output back to its input features, attributing the prediction to individual input features through the process of Taylor expansion, which assigns relevance scores to highlight the contribution of each feature. To measure agreement, we compared generated explanations at the patient and the cohort levels and used metrics introduced by Krishna et al. 11 Patient-wise explanations (i.e. local explanations) are those computed for each patient individually for each predicted outcome. To gain an insight into features that underpin decisions of a predictive model overall, we analysed explanations at the cohort level (i.e. global explanations) which are obtained by adding up the absolute values of all explanations obtained for individual patients and averaging them over the total number of considered patients.
Agreement metrics
•
•
•
Experiment design
To evaluate explanations against the criteria suggested by Tonekaboni et al. 2 we used explanations obtained for EMR-based predictive models reported in published studies.14,15 To that end extensive analysis is performed to investigate whether explanations (i) have domain-appropriate representation, i.e. whether their representation is coherent with respect to the application task, (ii) they may impact clinical workflow and (iii) are consistent (Figure 1(c)).
To assess whether the explanations are coherent i.e. domain-appropriate for the application task, we analysed explanations at the cohort level. Explanations that are redundant are not desirable unless critical to potential clinical workflows, i.e. they should not further obfuscate model behaviour to a clinician. 2 Therefore, top contributors at the cohort level obtained by different methods were compared and their representation in the context of the application task is assessed based on clinical expert knowledge. To account for the inherent randomness in the optimisation procedure, analysis is performed on results obtained by running each algorithm five times.
To evaluate the potential actionability of the explanations, i.e. whether they are informative and may impact the workflow by informing follow-up clinical workflow while simultaneously being parsimonious and timely, explanations at the patient level were analysed, assessed and discussed. In this scenario, only the samples that correctly predicted patient deterioration/readmission were considered. To understand how explanations for incorrect predictions differ from correct ones, we analysed percentage of occurrence of the most frequent top contributors for each case (TP, TN, FN and FP), their means and standard deviations. Doing a patient-level analysis allowed for the evaluation of explanations generated for each patient individually, assessment of their informativeness and their potential impact on the workflow. E.g. If explanation of the main contributing factor can guide the choice of intervention, the risk assessment tool will help to allocate resources and explanations that should facilitate decision-making. 2
Explanations intended to build trust in clinical settings could benefit from being rigorously evaluated against the ground truth. With that objective in mind, local explanations obtained for VS datasets were benchmarked against the red flag triggers recorded by the data collection system deployed in the hospital. We compared whether the top feature (either the original feature (e.g. SpO2) or its derivatives e.g. its min, max, std, average, count, slope) are matching the cause of the correctly predicted future red flag event recorded by the deployed system (one of the following measurements: blood pressure, pulse, oxygen saturation (SpO2), GCS, Sedation score or respiratory rate). In the analysis, only correct predictions were considered. Multiple red flags could potentially arise within the prediction window, but only the first one was considered (see Figure 2). Concordance was computed as a fraction of the total count of samples for which the explanation was matching the trigger recorded by the deployed data collection system and the total number of correctly predicted red flags. Given that none of the predictors in RA30 dataset offers a cause for patient readmission which could be considered as a ground truth, RA30 detest was excluded from benchmarking analysis. Considering that different methods may produce different results
12
and the discordance could impact clinicians’ trust, explanation agreement between the methods at the patient has been also investigated and discussed. Visualisation of the benchmarking process.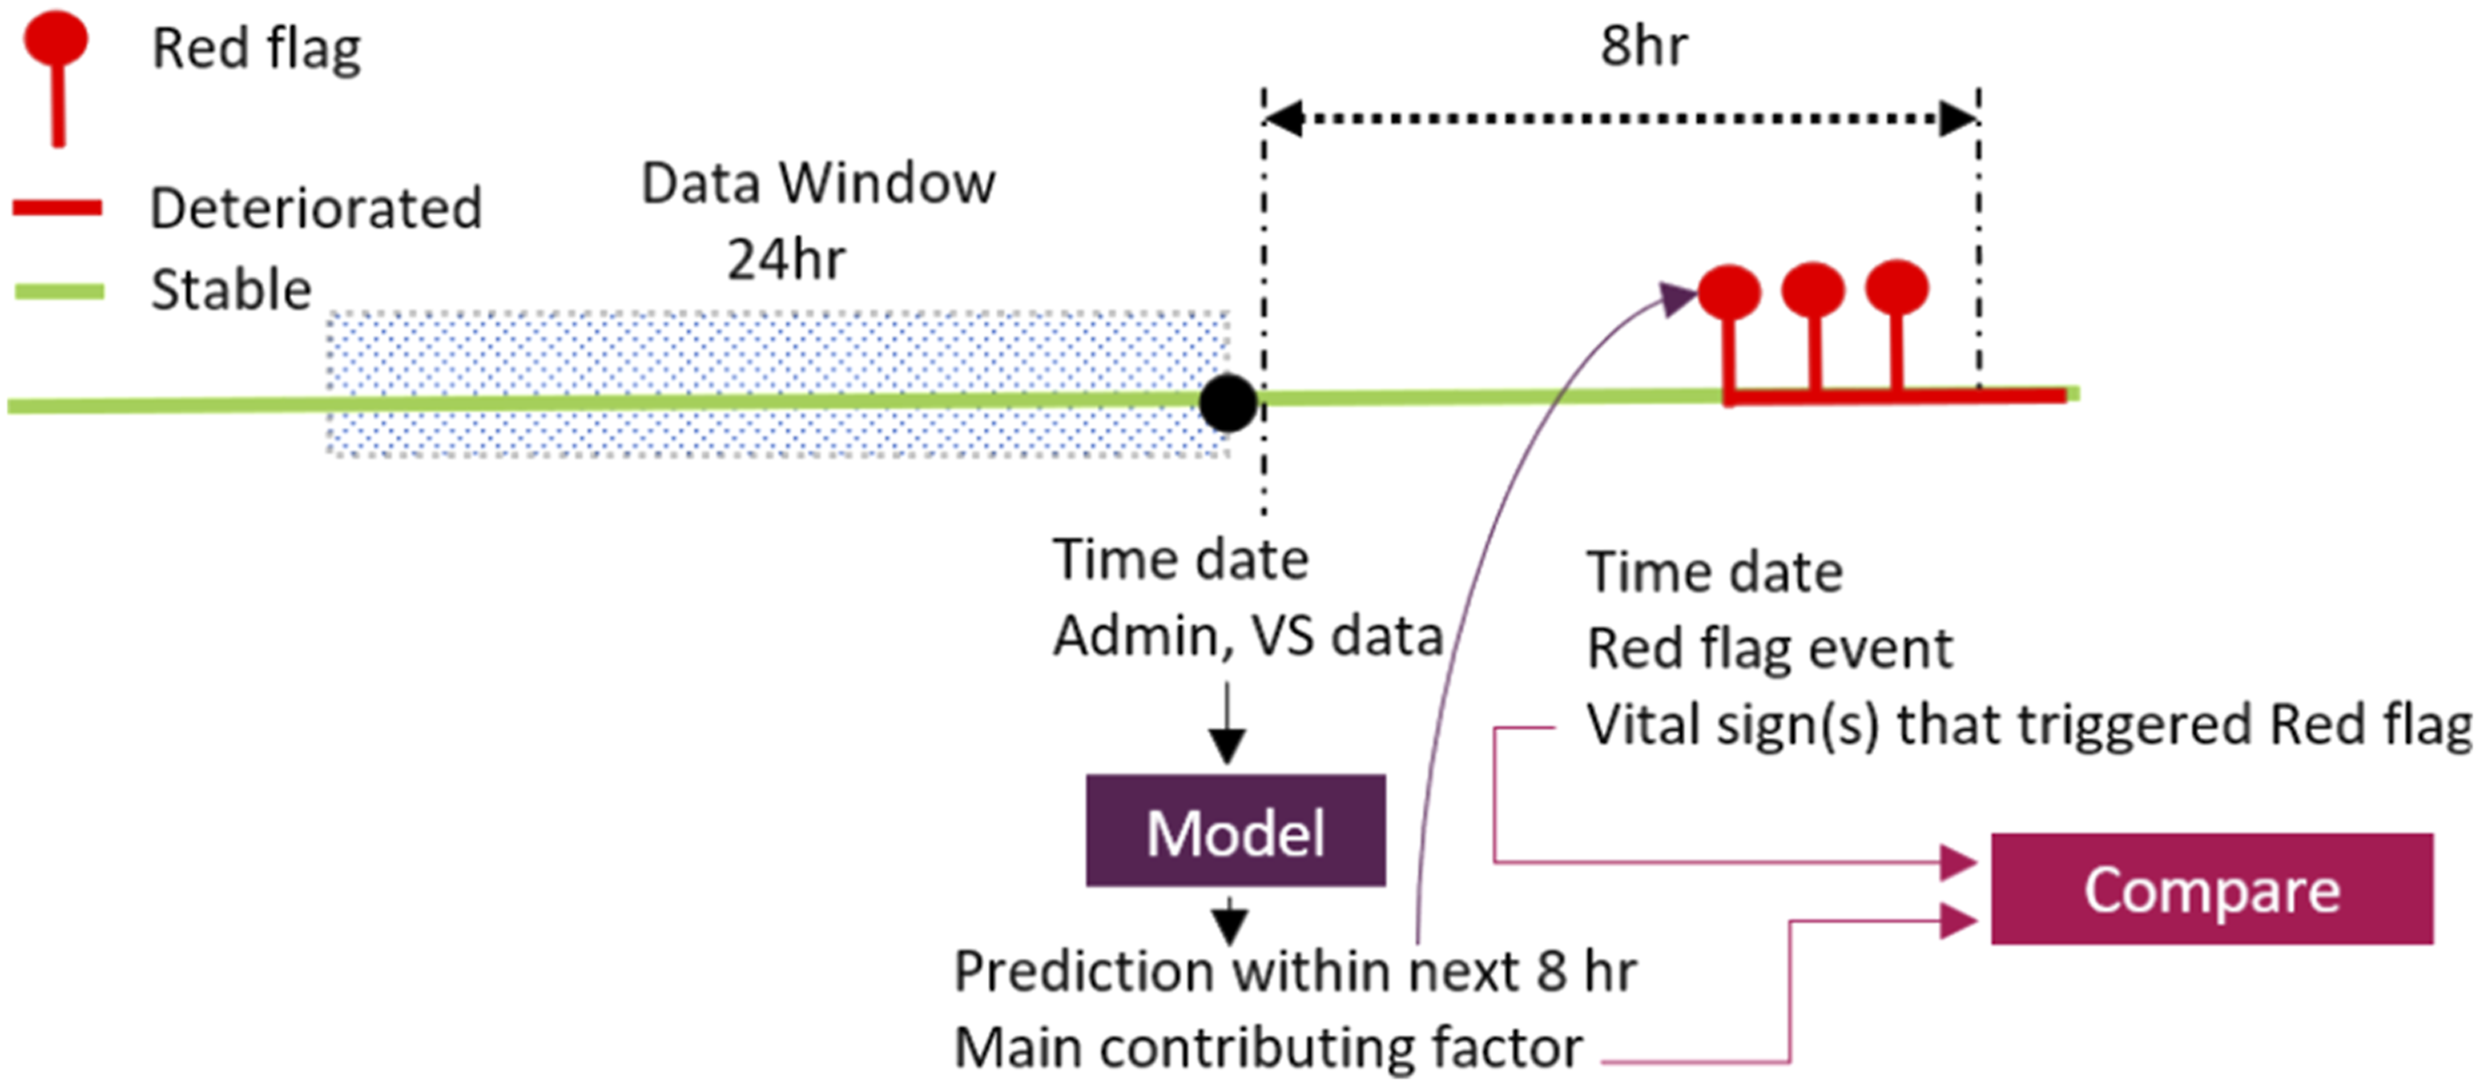
Explanations should be consistent, i.e. they should (i) yield observable changes for any changes in predictions due to changes in inputs, (ii) be invariant to underlying design variations, i.e. they should only reflect relevant clinical variability. Violating any of these elements results in inconsistent explanations. This undermines their reliable actionability which in turn has a negative impact on clinicians’ trust. 2 The first consistency factor suggests causality. However, though considered XAIs make correlations transparent these are patterns, not causal relationships. On occasions, the patterns may be casual, but this is not to be expected. Aas et al. 18 showed that marginal Shapley values may lead to incorrect explanations when features are highly correlated. While DTD can provide insights into how a neural network processes information by decomposing the NN into a sum of simple interpretable functions and associating them with a specific input feature to score each feature, it is not specifically designed for causal inference.
To examine the consistency of explanations in relation to variations in the design of underlying models (DNN and XGB), explanations calculated at the cohort level were analysed for each of the five independent runs. Obtained explanations were compared across the runs and their agreement was quantified with FA and CR metrics. Unlike DTD which is applicable only to NNs, Shap explainer can be applied to any model. Therefore, the consistency of Shap explanations in relation to the deployed models, XGB and NN, was analysed and quantified with FA and CR metrics. To explore the consistency of explanations regarding the direction of contribution (i.e., sign), explanations obtained at the patient level for both XGB and DNN models using the Shap method were analysed across five independent runs.
Results
Domain appropriate representation
Domain appropriate representation criteria: Top contributors for VS and RA30 datasets (Run 1).
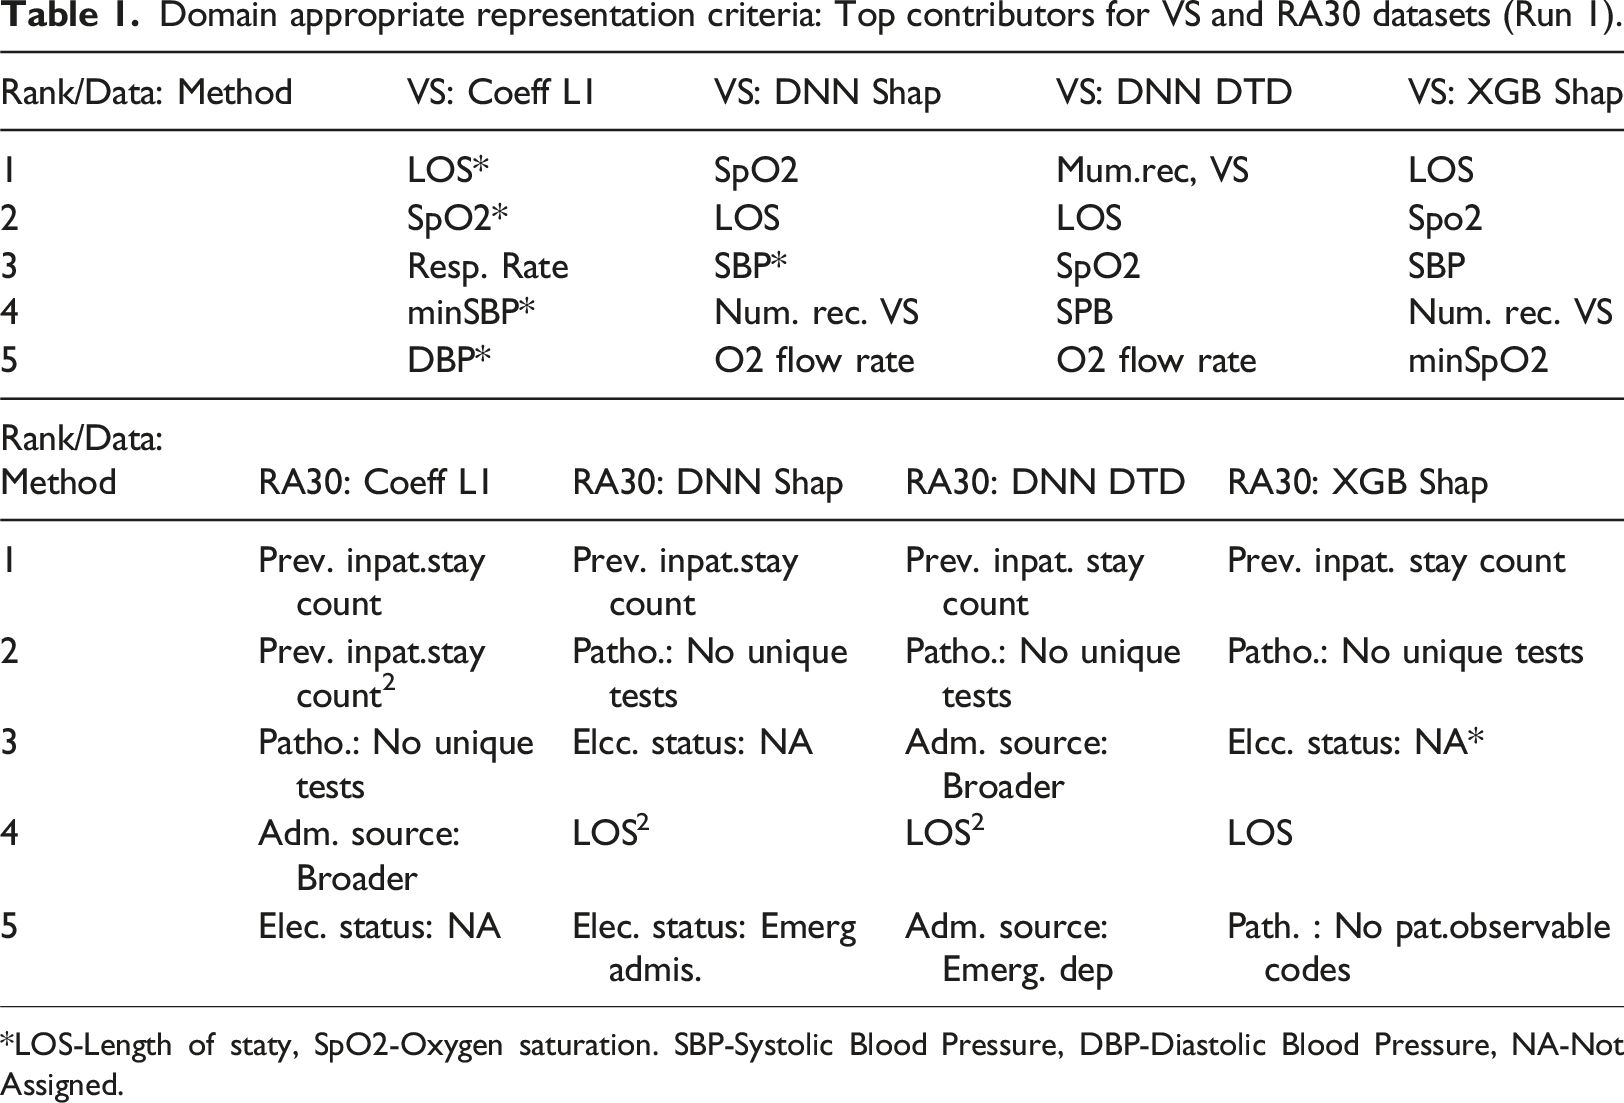
*LOS-Length of staty, SpO2-Oxygen saturation. SBP-Systolic Blood Pressure, DBP-Diastolic Blood Pressure, NA-Not Assigned.
Impact on the clinical workflow
Match benchmarking
The fraction of samples for which the explanations and true flag triggers were matching is shown in Figure 3(a). The top row shows the fraction of samples that matched the ground truth when correctly predicted samples that have an administrative feature (e.g. LOS) as the main contributor were excluded from comparison as they cannot be directly benchmarked against the causes recorded by the Early Warning System (EWS). The percentage of excluded samples was 2.7% for DNN-DTD, 13% for DNN-Shap 13% and 37% for XGB-Shap. Bottom row reports matching when samples with an administrative feature as the main predictors were considered. Match benchmarking: Fraction for which explanations of the most contributing predictors match recorded red flag events (a) and patient-wise agreement on the top contributor across all methods over 5 independent runs (b).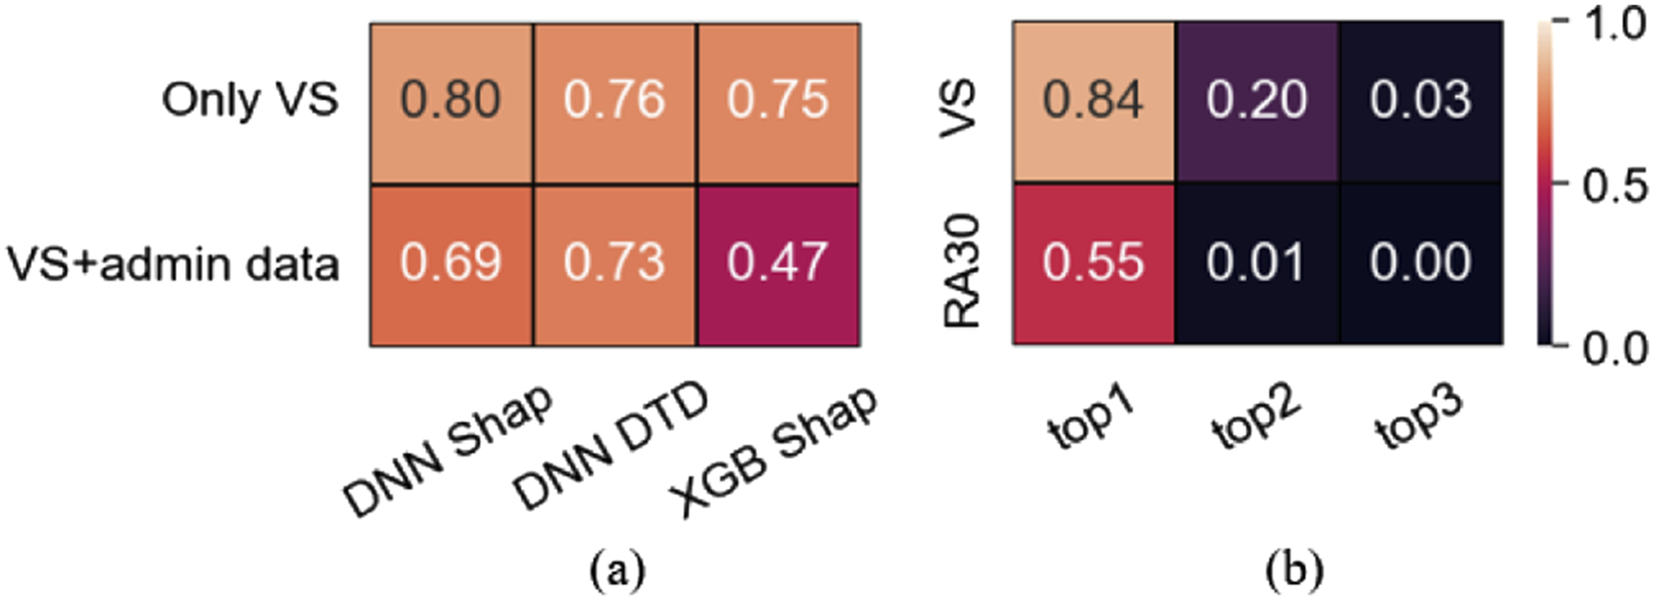
Overall agreement varied from moderate (47%) to strong (80%). Excluding samples where LOS was the top feature (37% of correct predictions in XGB) resulted in remarkable agreement increase (75-80%, Figure 3(a)), a level that is clinically relevant i.e. potentially reliable, and actionable explanations. Agreement on the top contributor across the methods for VS dataset is high (84%, Figure 3(b)) including its sign agreement (99%, Figure 5(c)) contributed building the trust.
Patient-wise concordance of top contributors
For the VS, the average agreement across all methods over 5 independent runs (Figure 3(b)) was 84% when we compared whether the top features are derivatives of the same vital sign (e.g. SpO2), somewhat less (82%) when we compared the exact names of the features (e.g. min SpO2). The concordance was 20% for the top two features (regardless of their order), and less than 3% when the top three features were considered. For the RA30 dataset, the concordance overall was remarkably poorer (Figure 3(b)).
Detailed results of agreement analysis are reported in Supplemental Information Table S27–28.
Explanations for correct and incorrect predictions
Features identified as main contributors in correctly classified samples were also main contributors for the incorrect ones (Figure 4). Though means differ (Supplement S29, S30) the variability in the two subgroups is such that their ranges are not distinctly separate. Impact on the clinical workflow: Main contributors for correct and incorrect predictions. (a) VS: datset; LOS: length of stay; HR: heart rate; AP: level of consciousness; BP: blood pressure; RR: respiratory rate; O2 FR: oxygen flow rate; NRVS: num.rec.VS. (b) RA30 datset. PISC: Prev. inpat. stay count; PNUT: Patho.: No unique tests; CTOC: care type: Other care; ESNA: Elec. status: Not Assigned; ESEA: Elec. status: Emerg. Care.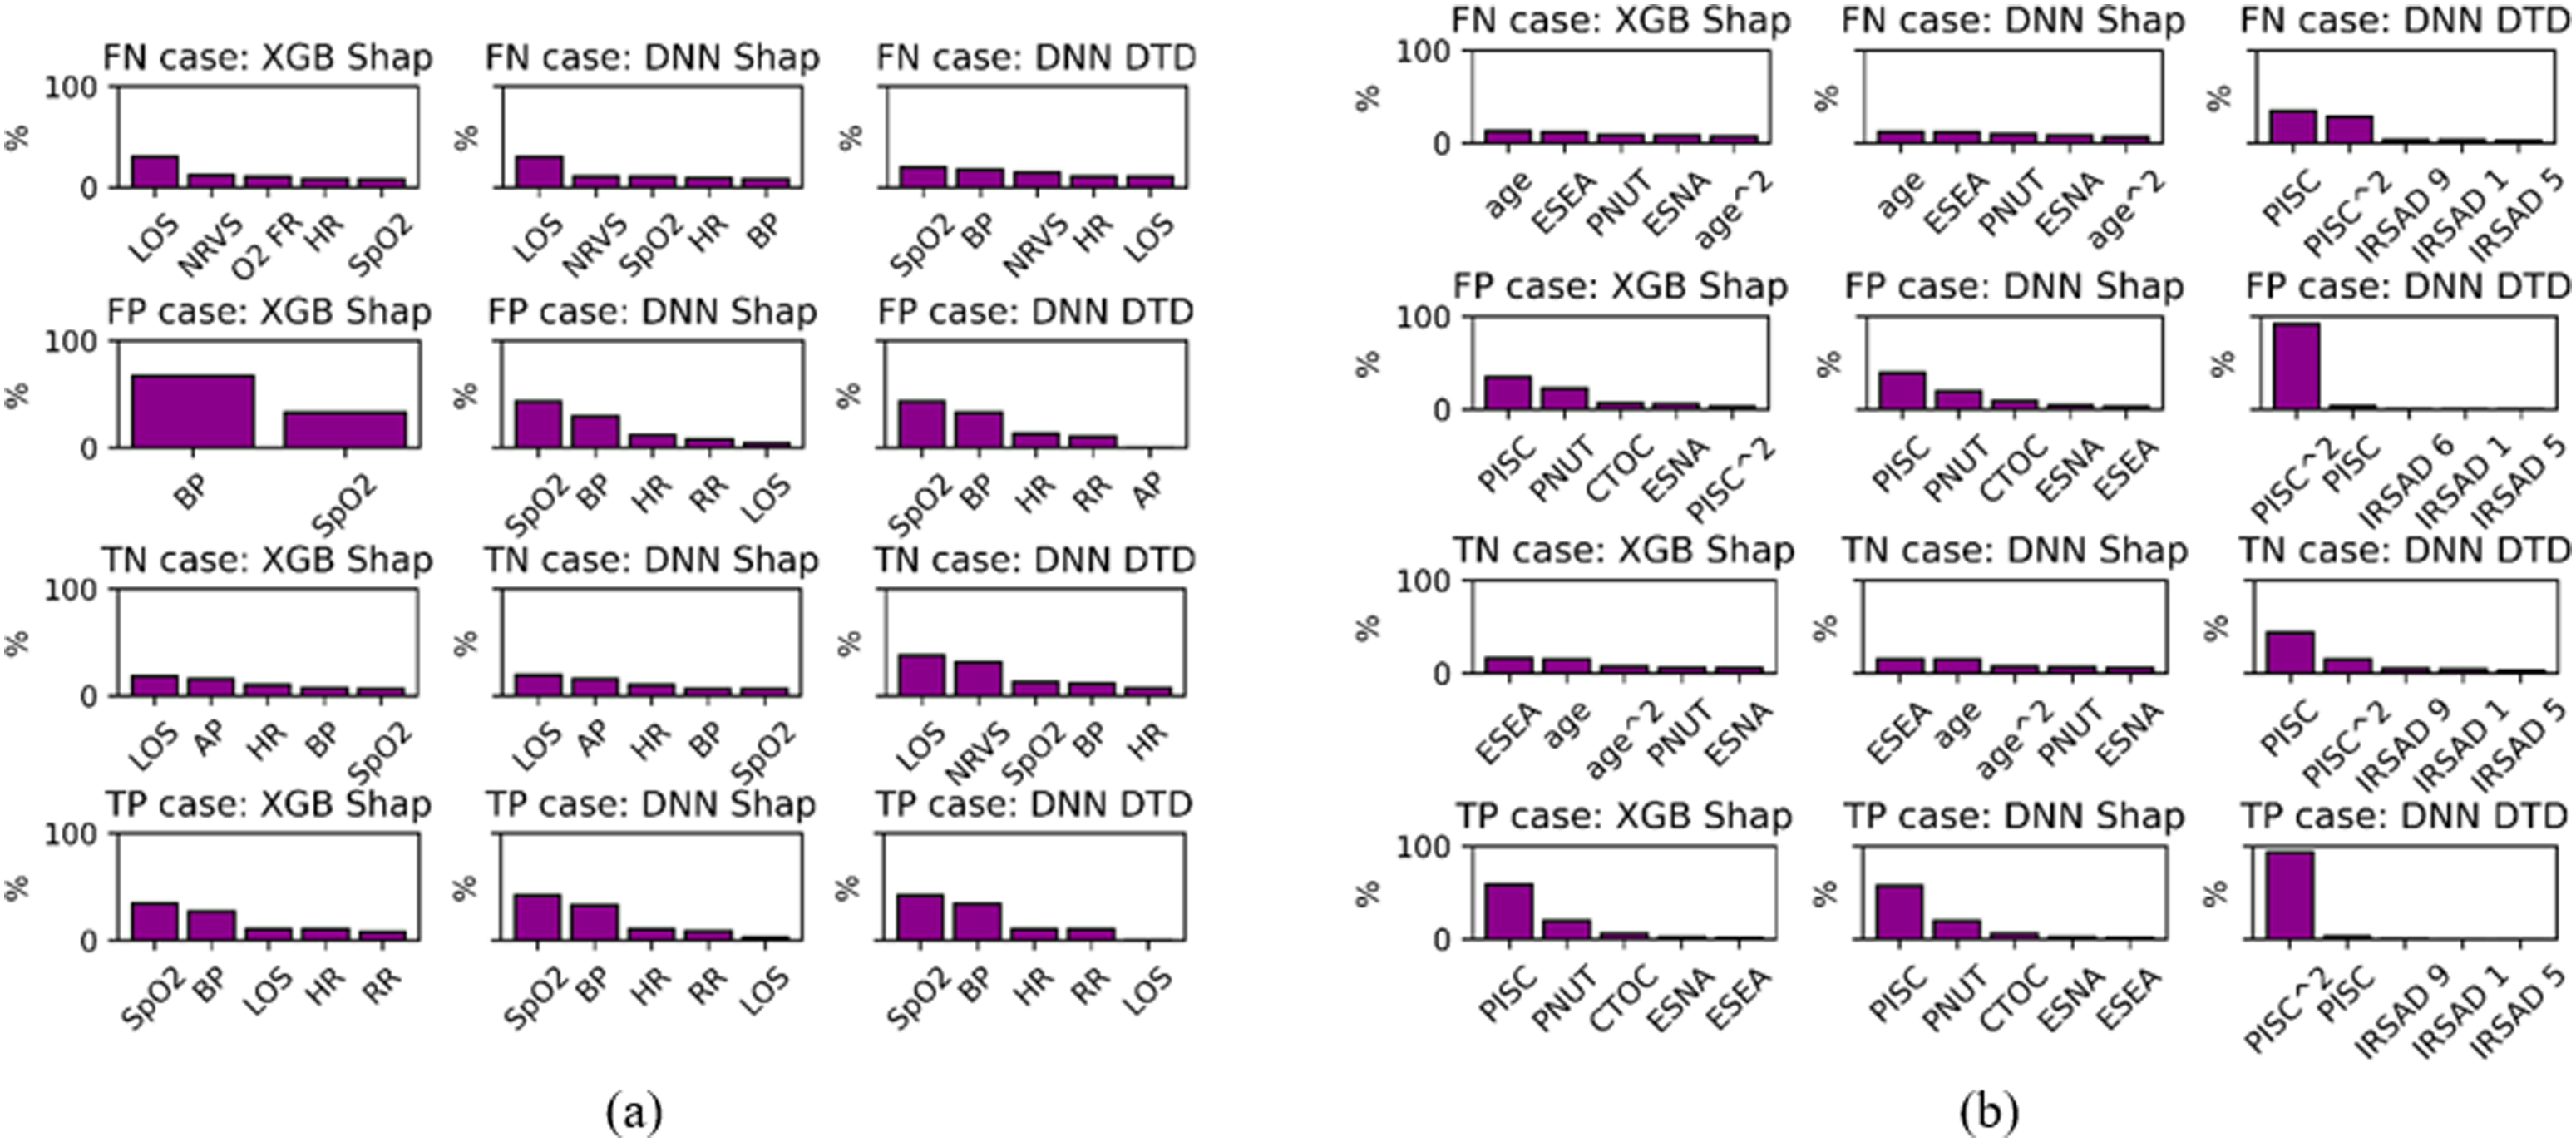
Consistency
Shap demonstrated insensitivity to underlying design variations, moderate consistency with respect to the deployed model and strong sign agreement for the main contributor. Explanations obtained with the DTD had the poorest consistency (see Figure 5(a)–(c)). Consistency results represented by an average agreement across 5 independent runs.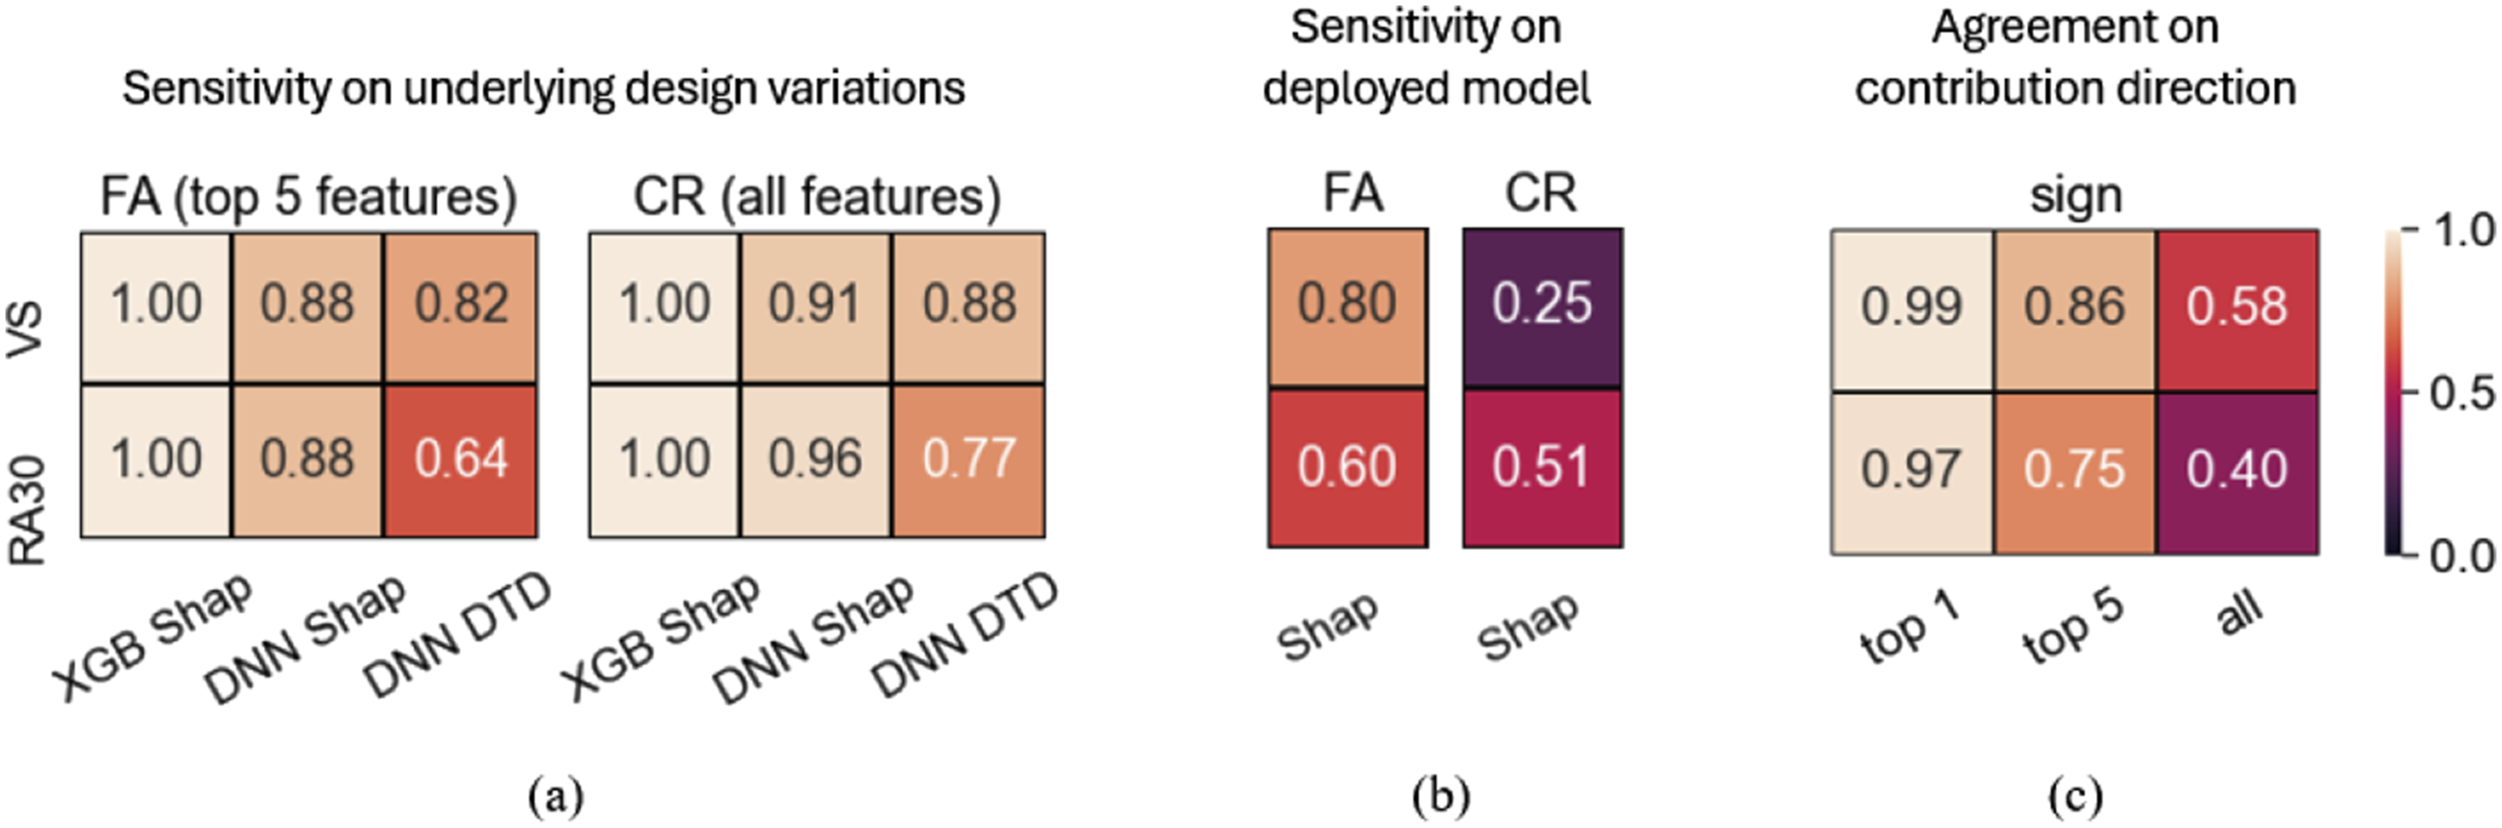
Discussion
Several studies2,19–21 have explored the role of explainability in AI-based clinical decision-support tools.
Physicians viewed XAI as crucial for their trust in technology. 19 Given hypothetical scenario, physicians trusted outputs from model-agnostic explainability methods more than those from models without explanations. 20 These studies assumed explanation consistency, but a recent study showed that state-of-the-art explanation methods often disagree in their outputs. 11 This study explores XAI agreement and disagreement in a clinical context, examining its potential implications to address a key challenge in the clinical adoption of ML models: the need for transparency and explainability.
Regarding domain-appropriate representation, except for the regression model (L1), all other methods included two predictors suggested by experts. One of the reasons for the unexpected result with L1 on the RA30 outcome metric could be the particularity of the paediatric cohort. Some features recognised as relevant for these models, however, might be partially or completely non-representative for supporting clinical decision-making. For example, a patient’s admission source or elective status may not be as clinically relevant as recent pathology results.
In the context of predicting patient deterioration and risk of readmission, explanations obtained at the patient level were recognised by clinical collaborators as actionable, i.e. can guide the choice of intervention and can help busy clinicians prioritise their efforts while evaluating patients. 14 However, while the studies14,15 have assessed model performance, there is no evidence supporting explanations correctness. To that end, one of the major contributions of this paper relates to the examination of the correctness of the generated explanations against the true causes recorded by the data collection system deployed in the study hospital (i.e. benchmarking), albeit only on one dataset (VS).
Benchmarking explanations obtained for patient representation was impossible as there was no ground truth. Still, identified top predictors benefit from being already recognized as informative in predicting patient representation. Though, the agreement on the most contributing factor across the methods was 55% which may affect clinicians’ trust adversely. The overlap in top features between correct and incorrect predictions suggests that, although the model is identifying relevant features, it may not be using them effectively. This could be due to highly skewed distributions and overlapping feature values between correct and incorrect predictions, leading to inconsistent performance. For clinicians and practitioners, this emphasizes the importance of carefully interpreting model outputs and potentially refining the model to reduce incorrect predictions.
When considering timeliness, both algorithms can be leveraged to provide real-time predictions and explanations that provide relevant complementary information that is well aligned with the current clinical workflows, allowing for early intervention and the prioritisation of clinical efforts for care planning.
Results demonstrate violation of consistency criteria, undermining reliability and actionability whcih in turn may impact clinicians’ trust adversly. From the clinical perspective, there are 3 sources of imperfection in the input features and the data available that could cause discrepancy and/or incorrectness of the results 12 : (i) Incomplete information to exactly “resolve” the question: missing features which, if available, would explain more of the variation and causation of the outputs. (ii) Dependence between factors. Several or most of the inputs have interrelationships with other input features and observations, e.g. in vital signs, pulse and blood pressure or respiratory rate, oxygen flow, and oxygen saturation. While these are each “independently related to the outcome” in the model, they are not independent of each other. This means that different groups of features could have the same implications for clinicians and hence the decision-making. Aas et al. 18 showed Shap 10 may lead to incorrect explanations when features are highly correlated. (iii) Errors, missing data that could be observed or contradictory information. From the modelling perspective, the main reasons for discrepancy can be attributed to the optimisation objective which is simply minimisation of the prediction error. Consequently (i) Causal and/or clinically relevant associations might not be discovered and hence post hoc not explainable. (ii) Since different ML methods operate on different principles, different features may be identified as the most relevant.
Findings align with the literature 11 and support opinion that current explainability approaches are not reliable and cannot be trusted at the patient level. 22 However, while the initial observation of inconsistency and misalignment with the true triggers might give the impression that XAI is useless to clinicians as it cannot guide interventions, it is important to consider other factors before drawing conclusion. If we view explanations as a mean to gain deeper insights while acknowledging their imperfections, 23 they can still provide valuable information to clinicians, especially when minimal trust is established. Moreover, when highly correlation different groups of features may point out in the same direction. In situations where a clinician knows little about the patient’s condition, receiving an explanation could be a helpful suggestion, even if it is correct only half of the time because it provides some additional information. However, if a clinician is already highly confident that a patient is deteriorating in a recognisable, clinical pattern, providing an alternative explanation would require consideration in the same way alternative diagnoses or treatments would be considered. Additionally, it can aid model troubleshooting and system audits, helping improve performance and identify biases in model development phase. 22
XAI-explanations should be rigorously assessed based on their domain-appropriate representations, potential actionability and consistency with the approach deployed in this study. Accounting for feature interdependencies, defining explanation uncertainty and CIs based on data distributions for correct/incorrect predictions and patient risk groups, implementation of robust data validation and imputation strategies, aligning optimisation objectives in model development with clinical goals, enhanced data collection, considering and presenting only actionable explanations to inform clinicians can help in mitigating identified limitations at the practitioners’ end. XAI can be misleading and considered harmful.24,25 Thus, using clinical judgment to critically evaluate AI explanations, being vigilant about data quality, aware of XAI limitations, and treating AI outputs just as additional information can contribute to more informed decisions while preventing over-reliance
Limitations
This study considered only the most popular and readily available state-of-the-art XAI methods. Exploring recent methods that account for causality or multicollinearity e.g.26–30 would be valuable in future. The clinical implications of the results have been discussed with one senior clinician. Qualitative study on this topic could generalise insights.
Conclusion
Evaluation of two popular XAIs for explaining clinical predictive models showed good domain-appropriate representation, albeit moderate consistency and agreement with reality. This paper is suggesting that 1) if sufficient disparate ML methods agree on influential relationships, 2) if observable and input factors can be modified and they change the model output, and 3) if the adjusted ML model outcomes concur and agree with the real-world results, then we are one step closer to trustworthy explanations. Unless these conditions are met, no explanation method should be considered trustworthy and or used to guide the choice of clinical intervention. However, they might still be useful in helping clinicians in cases when they know little about a patient although the information is present or to identify “at risk” patients who look deceptively stable. In the latter case there is a danger of over-relying on AI that could lead to incorrect clinical decisions.
The process of selecting the best model involves well-established criteria for assessment. Though a large body of literature uses XAI to meet regulatory requirements or increase trust, there are currently no standardised criteria or recommendations for their application-specific development, evaluation, and/or selection. Also, studies involving XAI component are already available at ClinicalTrials.gov. Thus, the development of comprehensive clinically informed actionable XAI recommendations is critical. Their integration into the development process can assist clinicians to optimise trust by avoiding over-reliance while not dismissing potential benefits.
Supplemental Material
Supplemental Material - Benchmarking the most popular XAI used for explaining clinical predictive models: Untrustworthy but could be useful
Supplemental Material Benchmarking the most popular XAI used for explaining clinical predictive models: Untrustworthy but could be useful by Aida Brankovic, David Cook, Jessica Rahman, Sankalp Khanna and Wenjie Huang in Health Informatics Journal
Footnotes
Acknowledgement
We acknowledge the Responsible Innovation Future Science Program for recognizing the value of this study, supporting its extension, and co-funding it alongside the Australian e-Health Research Centre.
Author contributions
A.B. initiated the project and was a project lead, provided project conception, and performed the analysis. D.C. was the clinical lead and provided clinical guidance in interpreting the results and discussing their implications. J.R. contributed to the literature review and the creation of a Supplementary information file. S.K. contributed results discussion. W.H. created a pipeline for the NN model and DTD explainer. A.B made the first article draft. All authors contributed to revising the first article draft and approving the final version of the manuscript.
Declaration of conflicting interests
The author(s) declared no potential conflicts of interest with respect to the research, authorship, and/or publication of this article.
Funding
Research funding provided to A.B. from the University of Queensland, with in-kind contributions from AEHRC.
Ethical statement
Preprint
Brankovic, Aida, et al. “Evaluation of Popular XAI Applied to Clinical Prediction Models: Can They be Trusted?.” arXiv preprint arXiv:2306.11985, 2023, https://arxiv.org/abs/2306.11985.
Supplemental Material
Supplemental material for this article is available online.
References
Supplementary Material
Please find the following supplemental material available below.
For Open Access articles published under a Creative Commons License, all supplemental material carries the same license as the article it is associated with.
For non-Open Access articles published, all supplemental material carries a non-exclusive license, and permission requests for re-use of supplemental material or any part of supplemental material shall be sent directly to the copyright owner as specified in the copyright notice associated with the article.