
Abstract
Objectives
Complex diseases, like diabetic kidney disease (DKD), often exhibit heterogeneity, challenging accurate risk prediction with machine learning. Traditional global models ignore patient differences, and subgroup learning lacks interpretability and predictive efficiency. This study introduces the Interpretable Subgroup Learning-based Modeling (iSLIM) framework to address these issues.
Methods
iSLIM integrates expert knowledge with a tree-based recursive partitioning approach to identify DKD subgroups within an EHR dataset of 11,559 patients. It then constructs separate models for each subgroup, enhancing predictive accuracy while preserving interpretability.
Results
Five clinically relevant subgroups are identified, achieving an average sensitivity of 0.8074, outperforming a single global model by 0.1104. Post hoc analyses provide pathological and biological evidence supporting subgroup validity and potential DKD risk factors.
Conclusion
The iSLIM surpasses traditional global model in predictive performance and subgroup-specific risk factor interpretation, enhancing the understanding of DKD’s heterogeneous mechanisms and potentially increasing the adoption of machine learning models in clinical decision-making.
Keywords
Introduction
The rapid digitization of the healthcare industry 1 has ushered in an era of unprecedented electronic health record (EHR) data, remarkably enhancing the entire digital health ecosystem and propelling the development of clinical decision support tools.2,3 Within this transformative landscape, machine learning (ML), a subset of artificial intelligence (AI), has been set with high expectations, typically in application of clinical decision support systems (CDSS).4,5 These systems significantly advanced disease risk prediction methodologies and augmented clinical decision-making.6,7 The predominant predictive modeling strategy involves training a single model on data from a population at risk, known as the global modeling strategy. While effective in achieving superior generalization, it falls short when faced with the inherent heterogeneity of most complex diseases. 8 For example, as pointed out by Ford et al., 9 the diagnosis of diabetes by a global model, typically reliant on glycosylated hemoglobin (HbA1c), exhibits intricate variations across ethnicities. This underscores the limitations of a global model, which may overlook delicate relationships and fail to be the optimal choice across diverse subpopulations.
In response, the subgroup learning strategy offers an alternative solution. This strategy requires the training of independent models using data from each subgroup and providing a refined approach to address the complexity of different patient populations. 10 Nevertheless, subgroup learning still faces certain problems in practical applications. First, the strategy relies on the accurate identification of subgroups. Given the incomplete understanding of many complex diseases, there is a growing emphasis on adopting data-driven subgrouping method.11,12 Yet, a drawback arises from the lack of interpretability in most data-driven subgroup identification, a crucial factor for physicians in understanding and making confident decisions. 13 For example, clustering, while capable of automatically identifying subgroups, is viewed with clinical skepticism due to its opacity. While some studies proposed hybrid approaches that incorporate knowledge, 14 the predominant focus remains on knowledge discovery rather than risk prediction.; second, subgrouping severely affects the predictive performance of the model, leading to insufficient training samples and a consequent decline in performance. 15 Although techniques such as multicenter modeling and oversampling, like the synthetic minority oversampling technique (SMOTE),16,17 offer solutions, obtaining compatible data is difficult in practice and raises safety and cost concerns; third, predictive modeling performance measurement often ignores clinical needs, with physicians expressing a preference for metrics like sensitivity and precision over the area under the curve (AUC); finally, many subgroup models neglect to contribute to disease pathogenesis, depriving physicians of informative clues for further exploration. The above issues cannot be ignored when integrating subgroup strategies into broader digital health systems such as CDSS. Presently, there is a dearth of comprehensive studies addressing these multifaceted issues, and enhanced subgroup strategy approaches remain limited.
These issues are particularly relevant in the context of predicting complex diseases characterized by heterogeneity. Diabetic kidney disease (DKD) is a notable example, for which there is currently a lack of recognized understanding of pathogenesis and lacks international guidelines. Its traditional predictors, such as microalbuminuria, proteinuria, and estimated glomerular filtration rate (eGFR) 18 are considered inadequate and unreliable.19,20 Variations in DKD incidence across groups is influenced by factors such as race, 21 gender, 22 and age. 23 While predictive models based on electronic medical record data, such as the logistic regression employed by Makino et al. 24 with an accuracy of 71%, have shown promise, it is essential to acknowledge the use of global learning strategies inevitably receives the benefit of potential heterogeneity, and the prevention and cure rates of DKD have so far been unsatisfactory. Improving the prediction and prevention of DKD risk requires addressing the multifaceted challenges associated with subgroup strategy. This is critical to advance understanding and prevention of all complex diseases.
This study aims to address the aforementioned issues of disease predictive modeling, especially for complex diseases with heterogeneity. We propose a subgroup learning-based framework that leverages DKD EHR data and machine learning with expert guidance. The main focus is on enhancing interpretability of subgroup identification, ensure the performance of predictive models, and provide valuable insights for disease exploration, thus enhance the predictive capabilities of CDSS and contribute to the advancement of personalized medicine and digital health solutions.
Methods
Study cohort
We utilized a cohort from the Healthcare Enterprise Repository for Ontological Narration (HERON) at the University of Kansas Medical Center (KUMC), which comprised EHR of 11,559 patients with Type 2 Diabetes Mellitus (T2DM) from January 2010 to December 2016. The surveillance, prevention, and management of diabetes mellitus (SUPREME-DM) definition of diabetes was adopted in this study to define diabetes status. 25 All patients had no prior history of renal disease, with diabetes onset occurring at least 30 days before the endpoint, and had at least one valid eGFR or albumin-to-creatinine (ACR) record from outpatient visits to determine DKD status. The case group included patients diagnosed with DKD, defined by the first occurrence of an abnormal eGFR or ACR. The control group consisted of diabetic patients with consistently normal eGFR values (≥60 mL/min/1.73 m2) and no history of microalbuminuria, with the endpoint defined as the last recorded normal eGFR or ACR. In this cohort, 5580 patients (44.73%) were identified with DKD, aligning with the typical range of 30% to 50% for T2DM patients developing DKD. 26
This dataset received approval from the HERON Data Request Oversight Committee and complied with HIPAA de-identification criteria. The KUMC Institutional Review Board (IRB) reviewed and approved the consent procedures.
Expert knowledge for subgroup learning
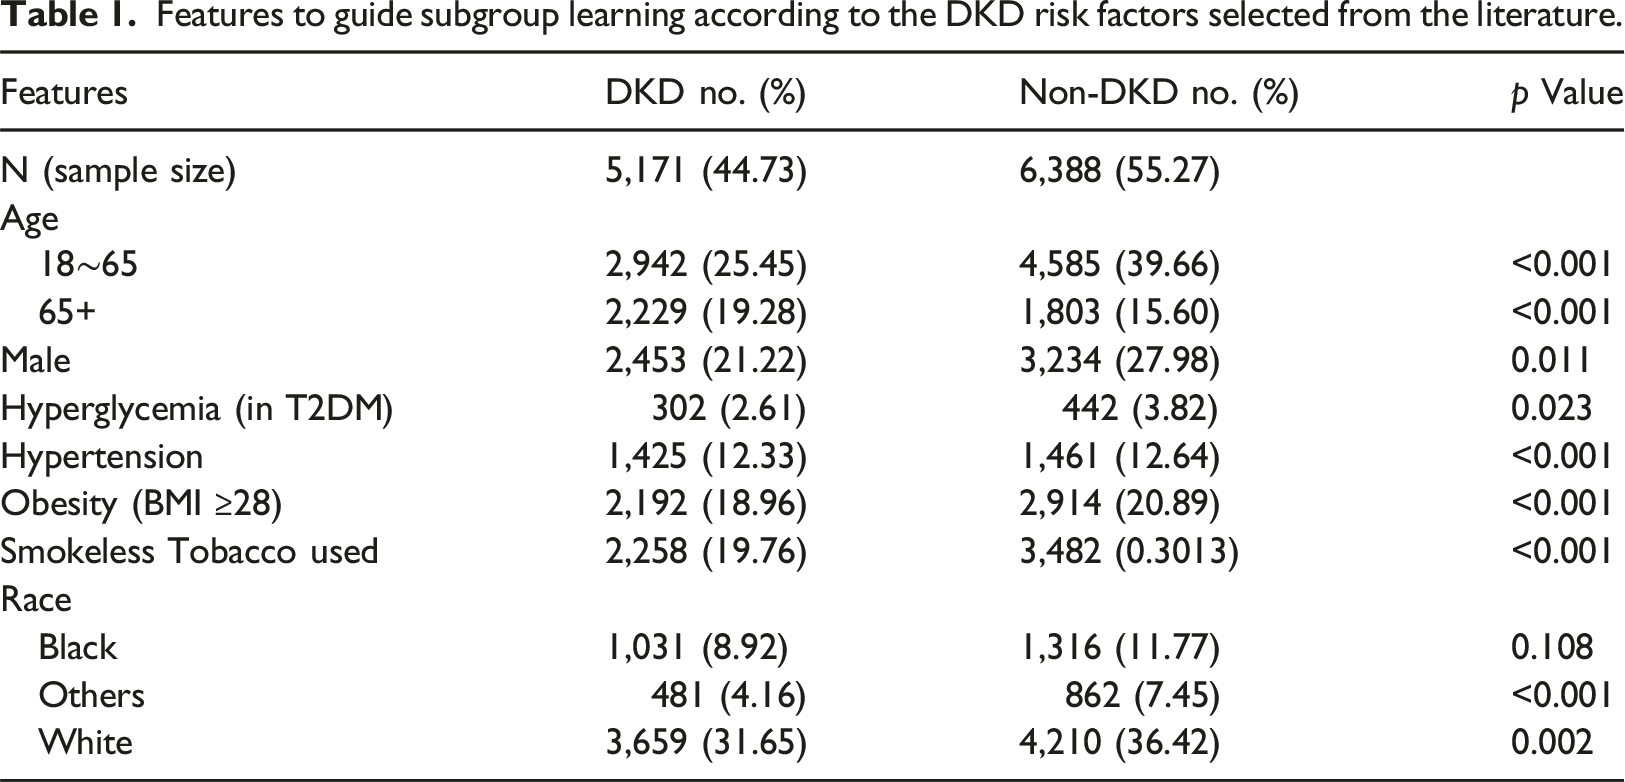
Features to guide subgroup learning according to the DKD risk factors selected from the literature.
Clinical variables for prediction modeling
We utilized a set of 401 clinical variables (features) identified as important for predicting DKD. 32 The selected features included the subgroup learning factors, lab. tests, medications, and history etc. These features demonstrated significance in predicting DKD onset and were robust to data perturbations.
Measurement for prediction performance
Although AUC is commonly used in model evaluation, it is less likely to represent the outcomes of individual patients. Clinicians prioritize clinically relevant thresholds over AUC’s overall performance, favoring sensitivity and precision, which inherently trade off, and the choice depends on the disease management strategy. In the context of DKD, underdiagnosis is costlier than misdiagnosis, so we focused on identifying as many at-risk individuals as possible, emphasizing sensitivity both in subgrouping and modeling process, as the main criterion for model performance assessment.
Subgroup learning-based modeling
The proposed Interpretable Subgroup Learning-based Modeling (iSLIM) framework, as illustrated in Figure 1, begins by integrating expert knowledge with a transparent 'white-box' tree-based recursive partitioning method33,34 to identify subgroups in the dataset, thereby ensuring interpretability. During the iterative tree construction, optimal sensitivity gain—derived from the prediction values of the LightGBM model—is used as the criterion for node splitting to maintain clinical relevance. This process continues until the tree is fully grown, with each leaf node representing an identified subgroup. The pooled data from the corresponding training and validation subsets are then merged to re-train the model and adjust hyperparameters, creating a unique LightGBM prediction model for each subgroup. This approach not only optimizes predictive performance but also captures subgroup-specific risk factors and relationships that may be obscured in a global model. Finally, the models are validated using their respective testing subsets. Flowchart of the proposed iSLIM framework.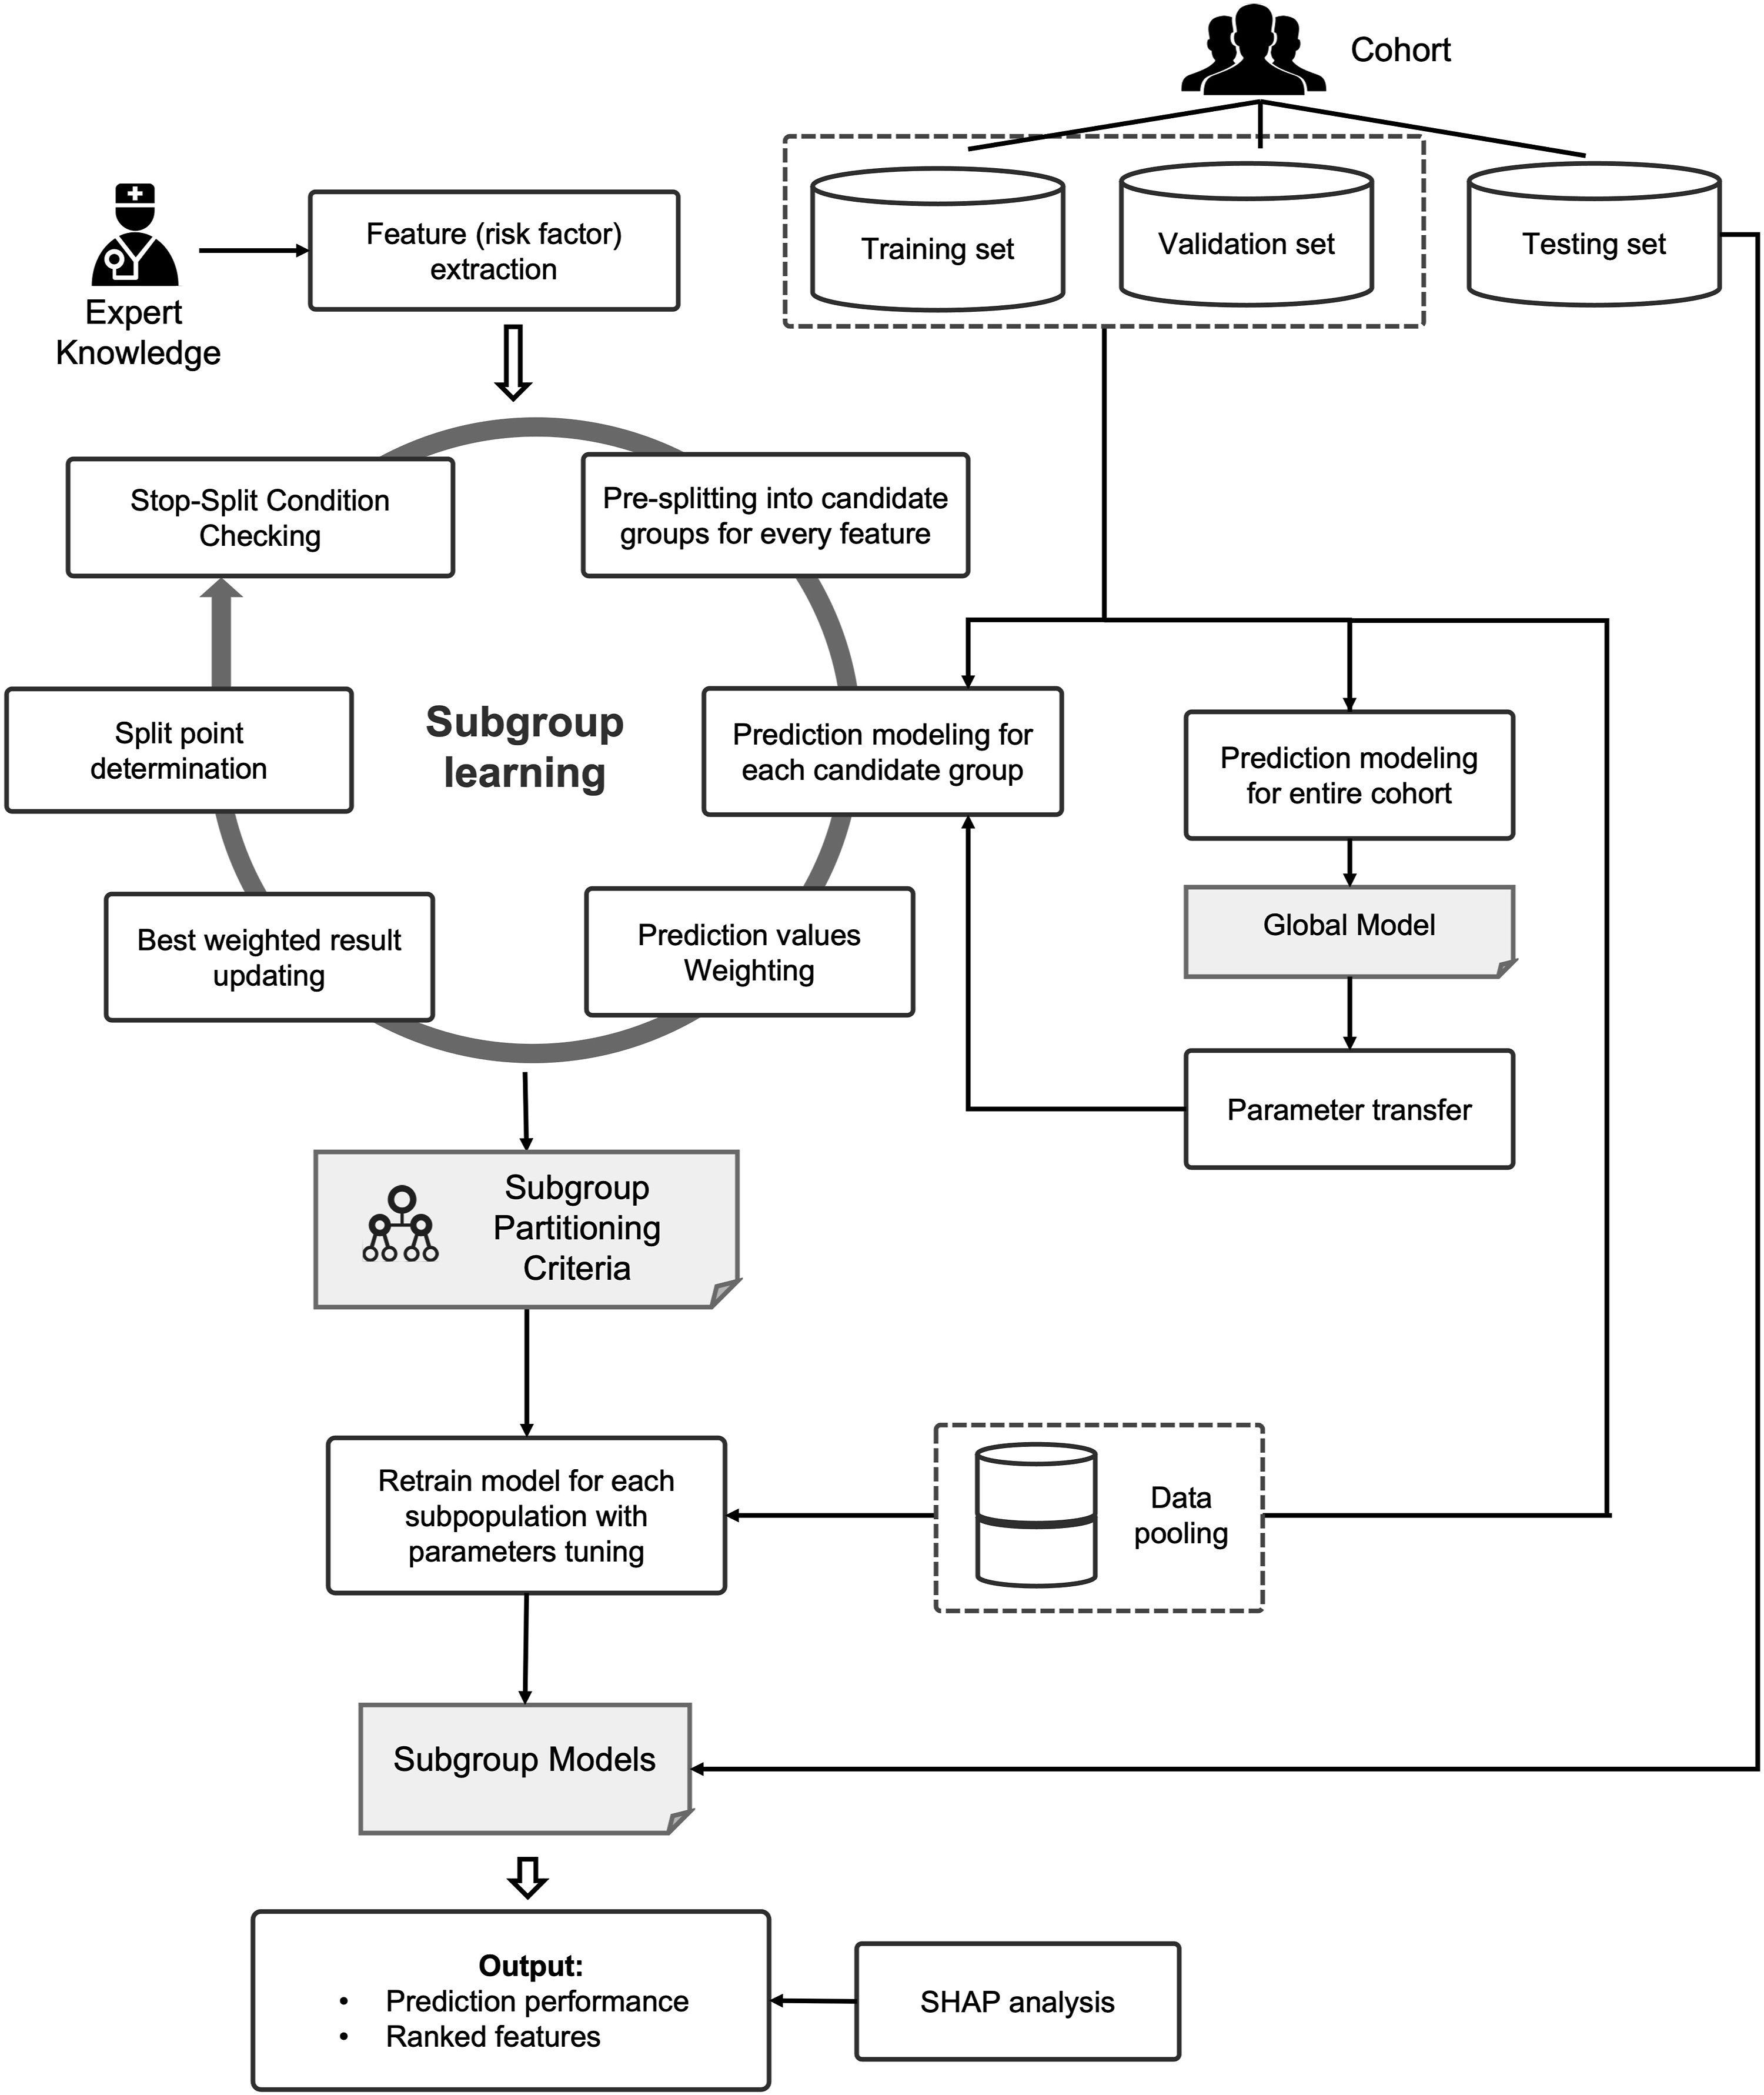
To counter model performance degradation from sample partitioning in subgroup learning, we implement parameters-based transfer learning.35,36 This approach initializes the LightGBM subgroup prediction model using the global model, with the residuals from the initial model serving as inputs for subsequent weak classifiers. Through iterative training, this method ensures effective inheritance of global knowledge while maintaining performance.
In evaluating the representativeness and influence of each subgroup’s key features, we employ SHAP analysi. 37 SHAP values are utilized to interpret feature importance within each subgroup model, helping to identify subgroup-specific risk factors and their relative impacts. The iSLIM framework is a systematically developed approach, not just a combination of methods, and is aligned with real-world clinical scenarios.
Experimental setting
Stratified random sampling extracted 20% of the original dataset (2312) as the testing set, with the remaining samples (9247) divided into an 8:2 ratio for training (7398) and validation (1849). Key parameters for the tree-based recursive method included the minimum leaf node size (MLN) and minimum internal node size (MIN). A grid-search technique with a range of MLN = 500–2000 and MIN = 1000–2500 (step size = 50) prevented overfitting or underfitting. Given that the cohort dataset had undergone preliminary cleaning, features with more than 90% missing values and those not specific to DKD patients were already removed, effectively reducing data sparsity. Consequently, we opted to utilize LightGBM’s default missing value handling mechanism without additional preprocessing. This approach leverages LightGBM’s built-in capabilities for managing sparse data, streamlining our modeling process while maintaining data integrity. Sensitivity was the primary performance metric, with precision, AUC, and f1-score also calculated. Twenty-five bootstrap rounds on the testing subset were conducted for each group, applying the student’s t-test for p-value calculation.
Results
Identified subgroups
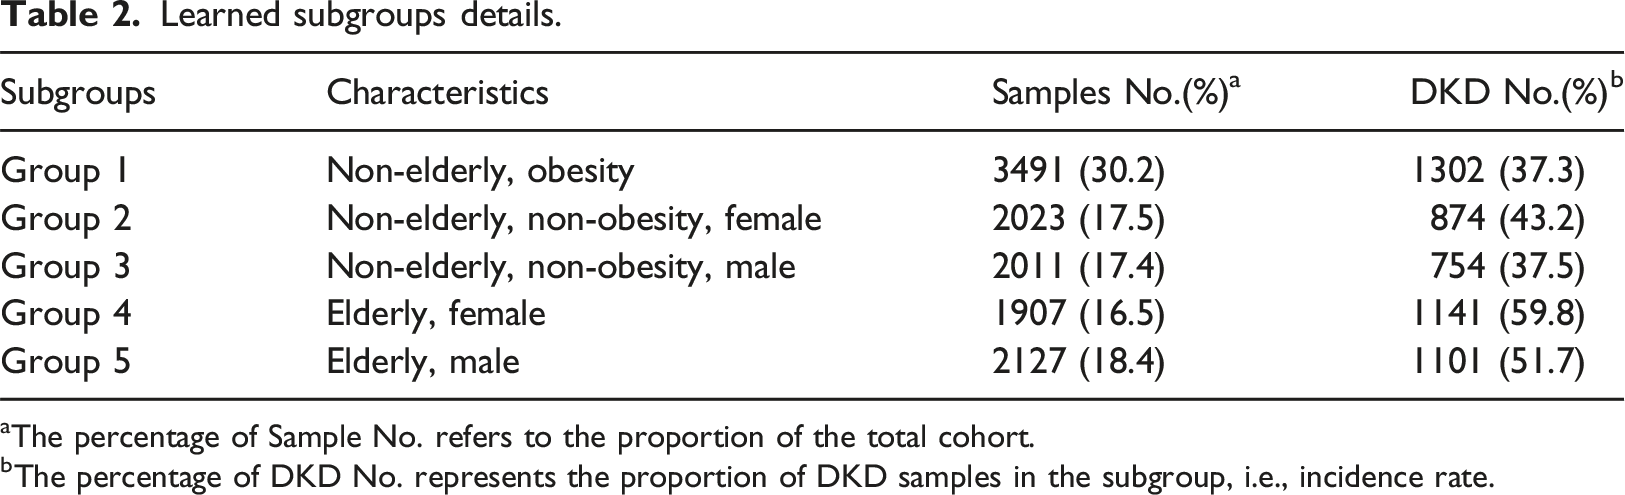
With final parameters set at MLN = 650 and MIN = 1500, we obtained the optimal tree split by three risk factors (including root node): age, obesity, and gender, which constitute five subgroups (see Figure 2 and Table 2). Other risk factors were eliminated in the optimal split node selection. DKD incidence rate was above 50% in the elderly (groups 4, 5), which was considerably higher than that of the non-elderly men (groups 1, 3; 37%) and non-elderly, non-obesity women (Group 2; 43%) subgroups. Final learned subgroup tree. Learned subgroups details. aThe percentage of Sample No. refers to the proportion of the total cohort. The percentage of DKD No. represents the proportion of DKD samples in the subgroup, i.e., incidence rate.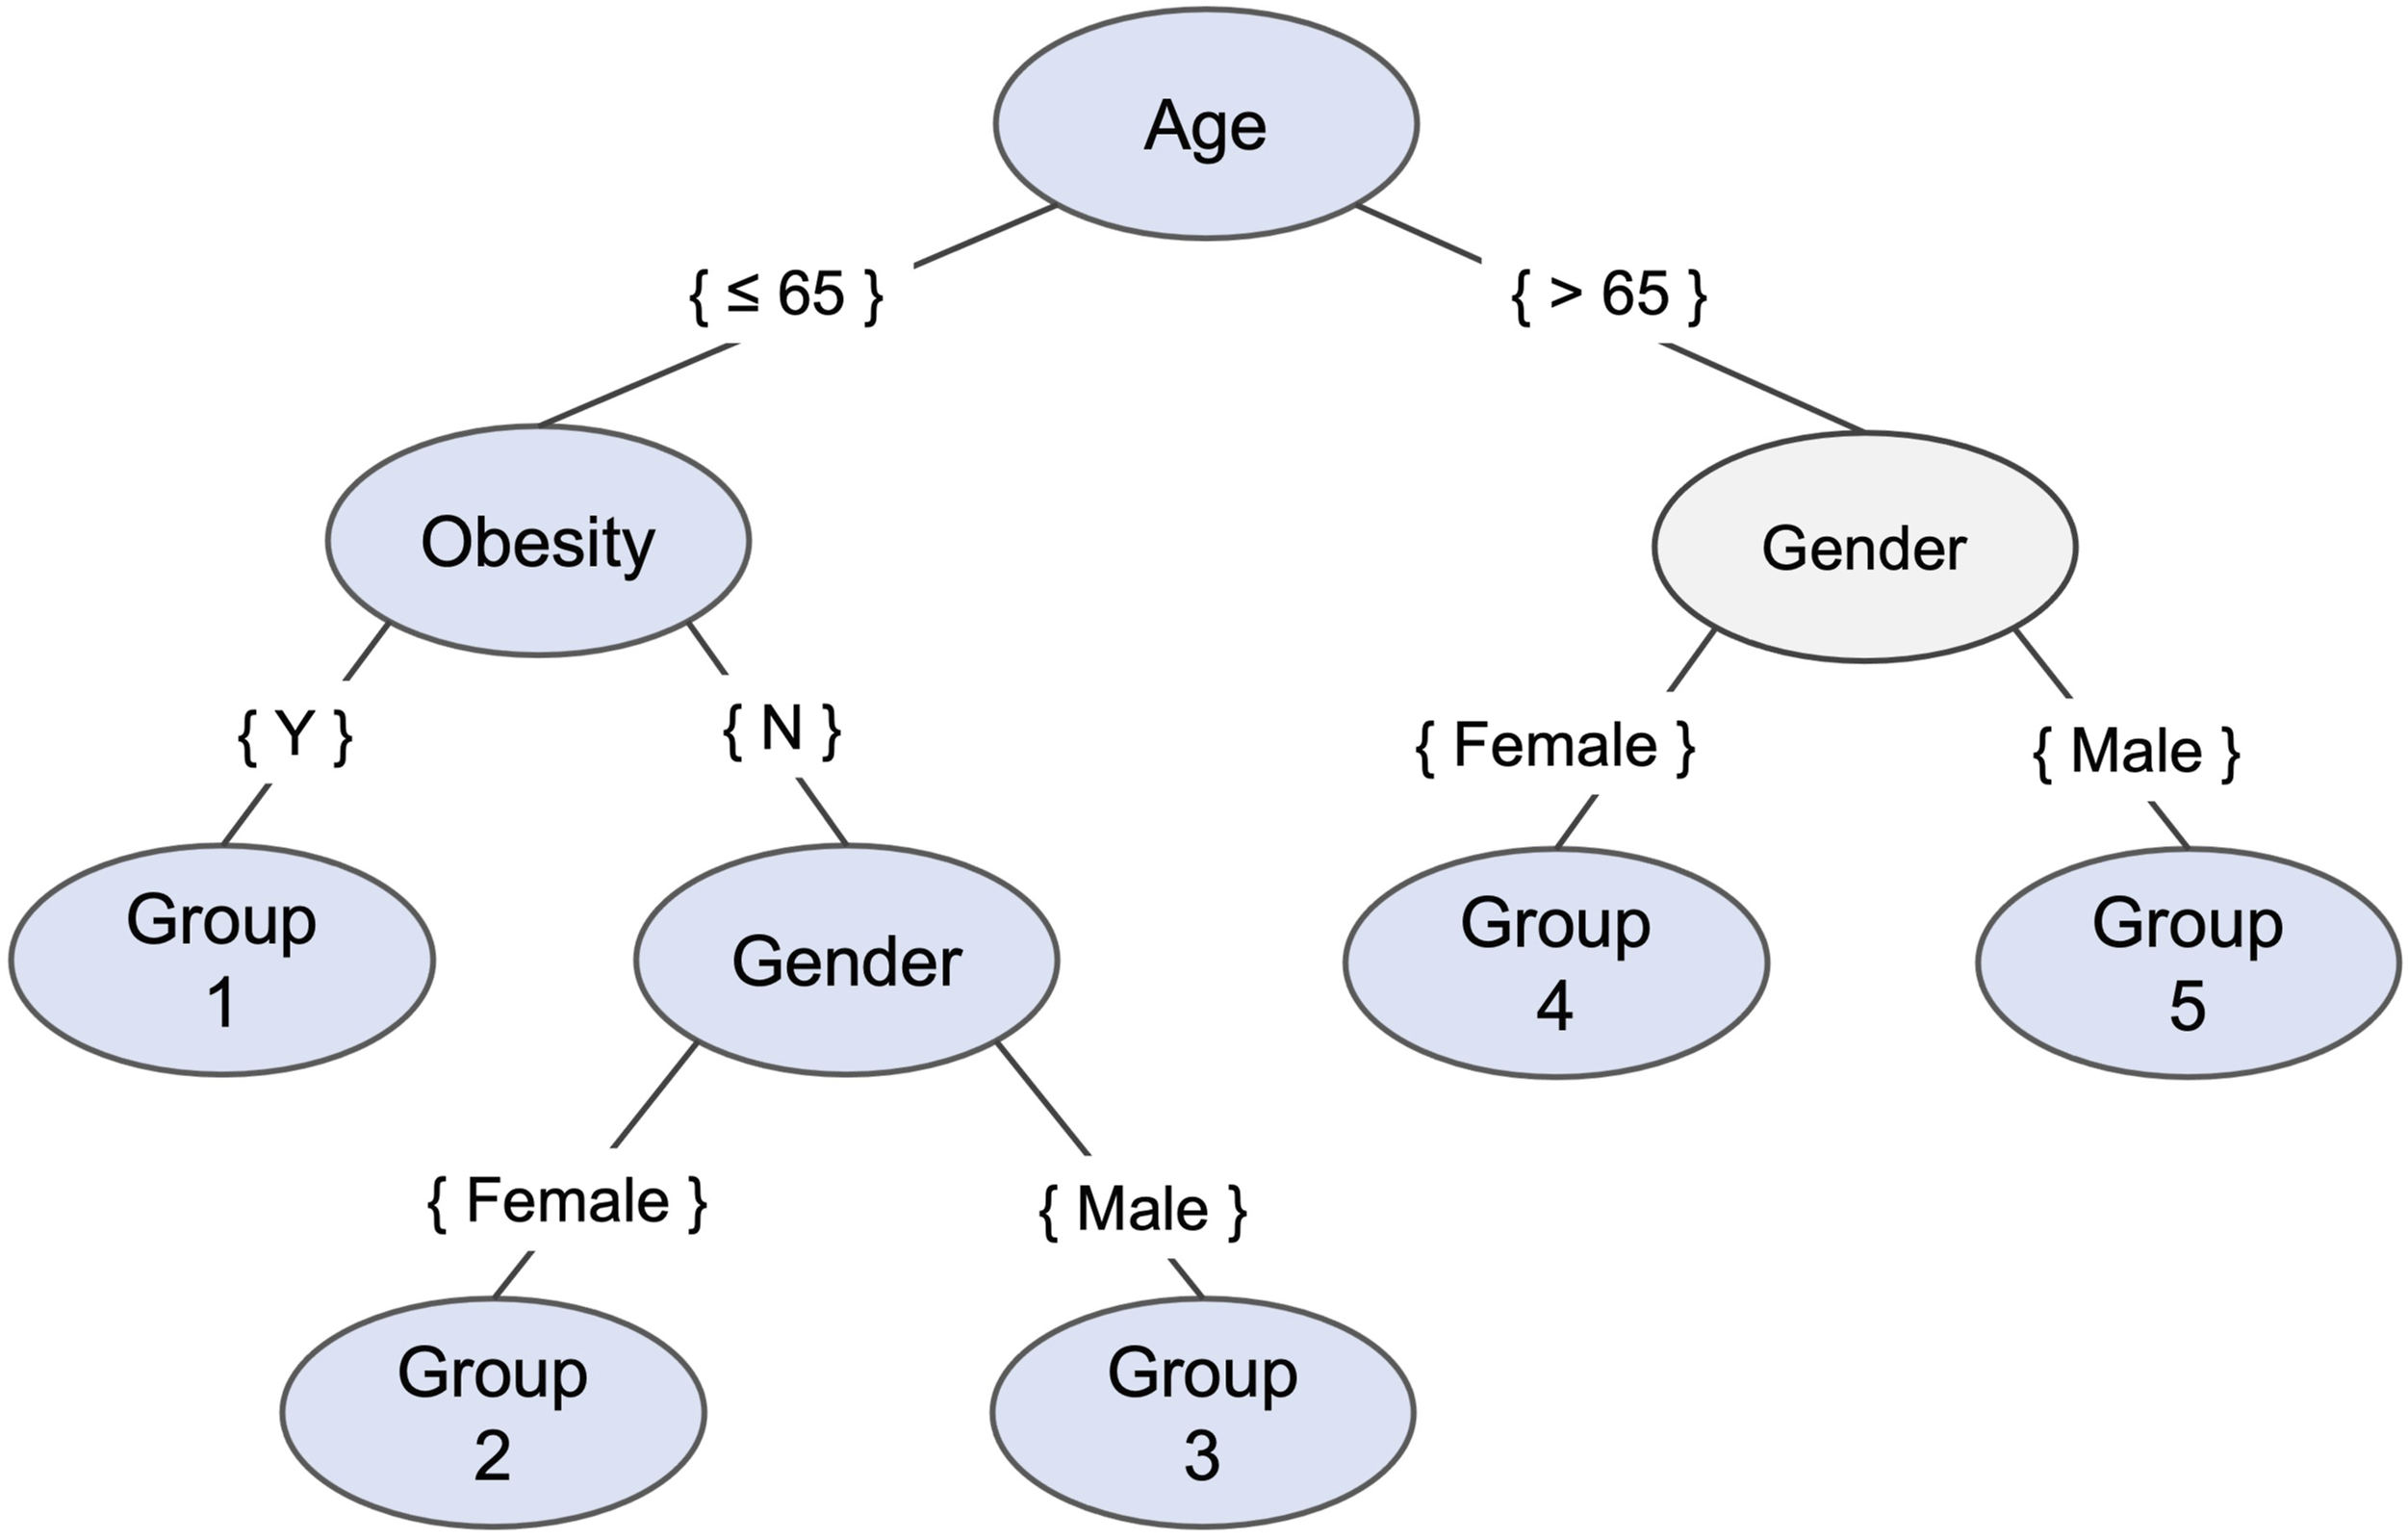
Model performance
The Youden index was used to determine the best cut-off point on the receiver operating characteristic curve for each prediction model.
38
In Figure 3, the subgroup models had an average sensitivity of 0.8074, outperforming the global model by 0.1104 on average, with Groups 2 having the largest gains of 0.1554. Although the average precision of subgroup models (0.666) was lower than the global model (0.735), their superior f1-score (average of 0.729 compared to 0.712 for the global model) demonstrates enhanced performance driven by heightened sensitivity. Despite a slightly lower average AUC for subgroup models (0.795) compared to the global model (0.814), it still aligns with expectations, ensuring effective prediction performance after sample partitioning. Comparison of predictive measures in the subgroup and global models.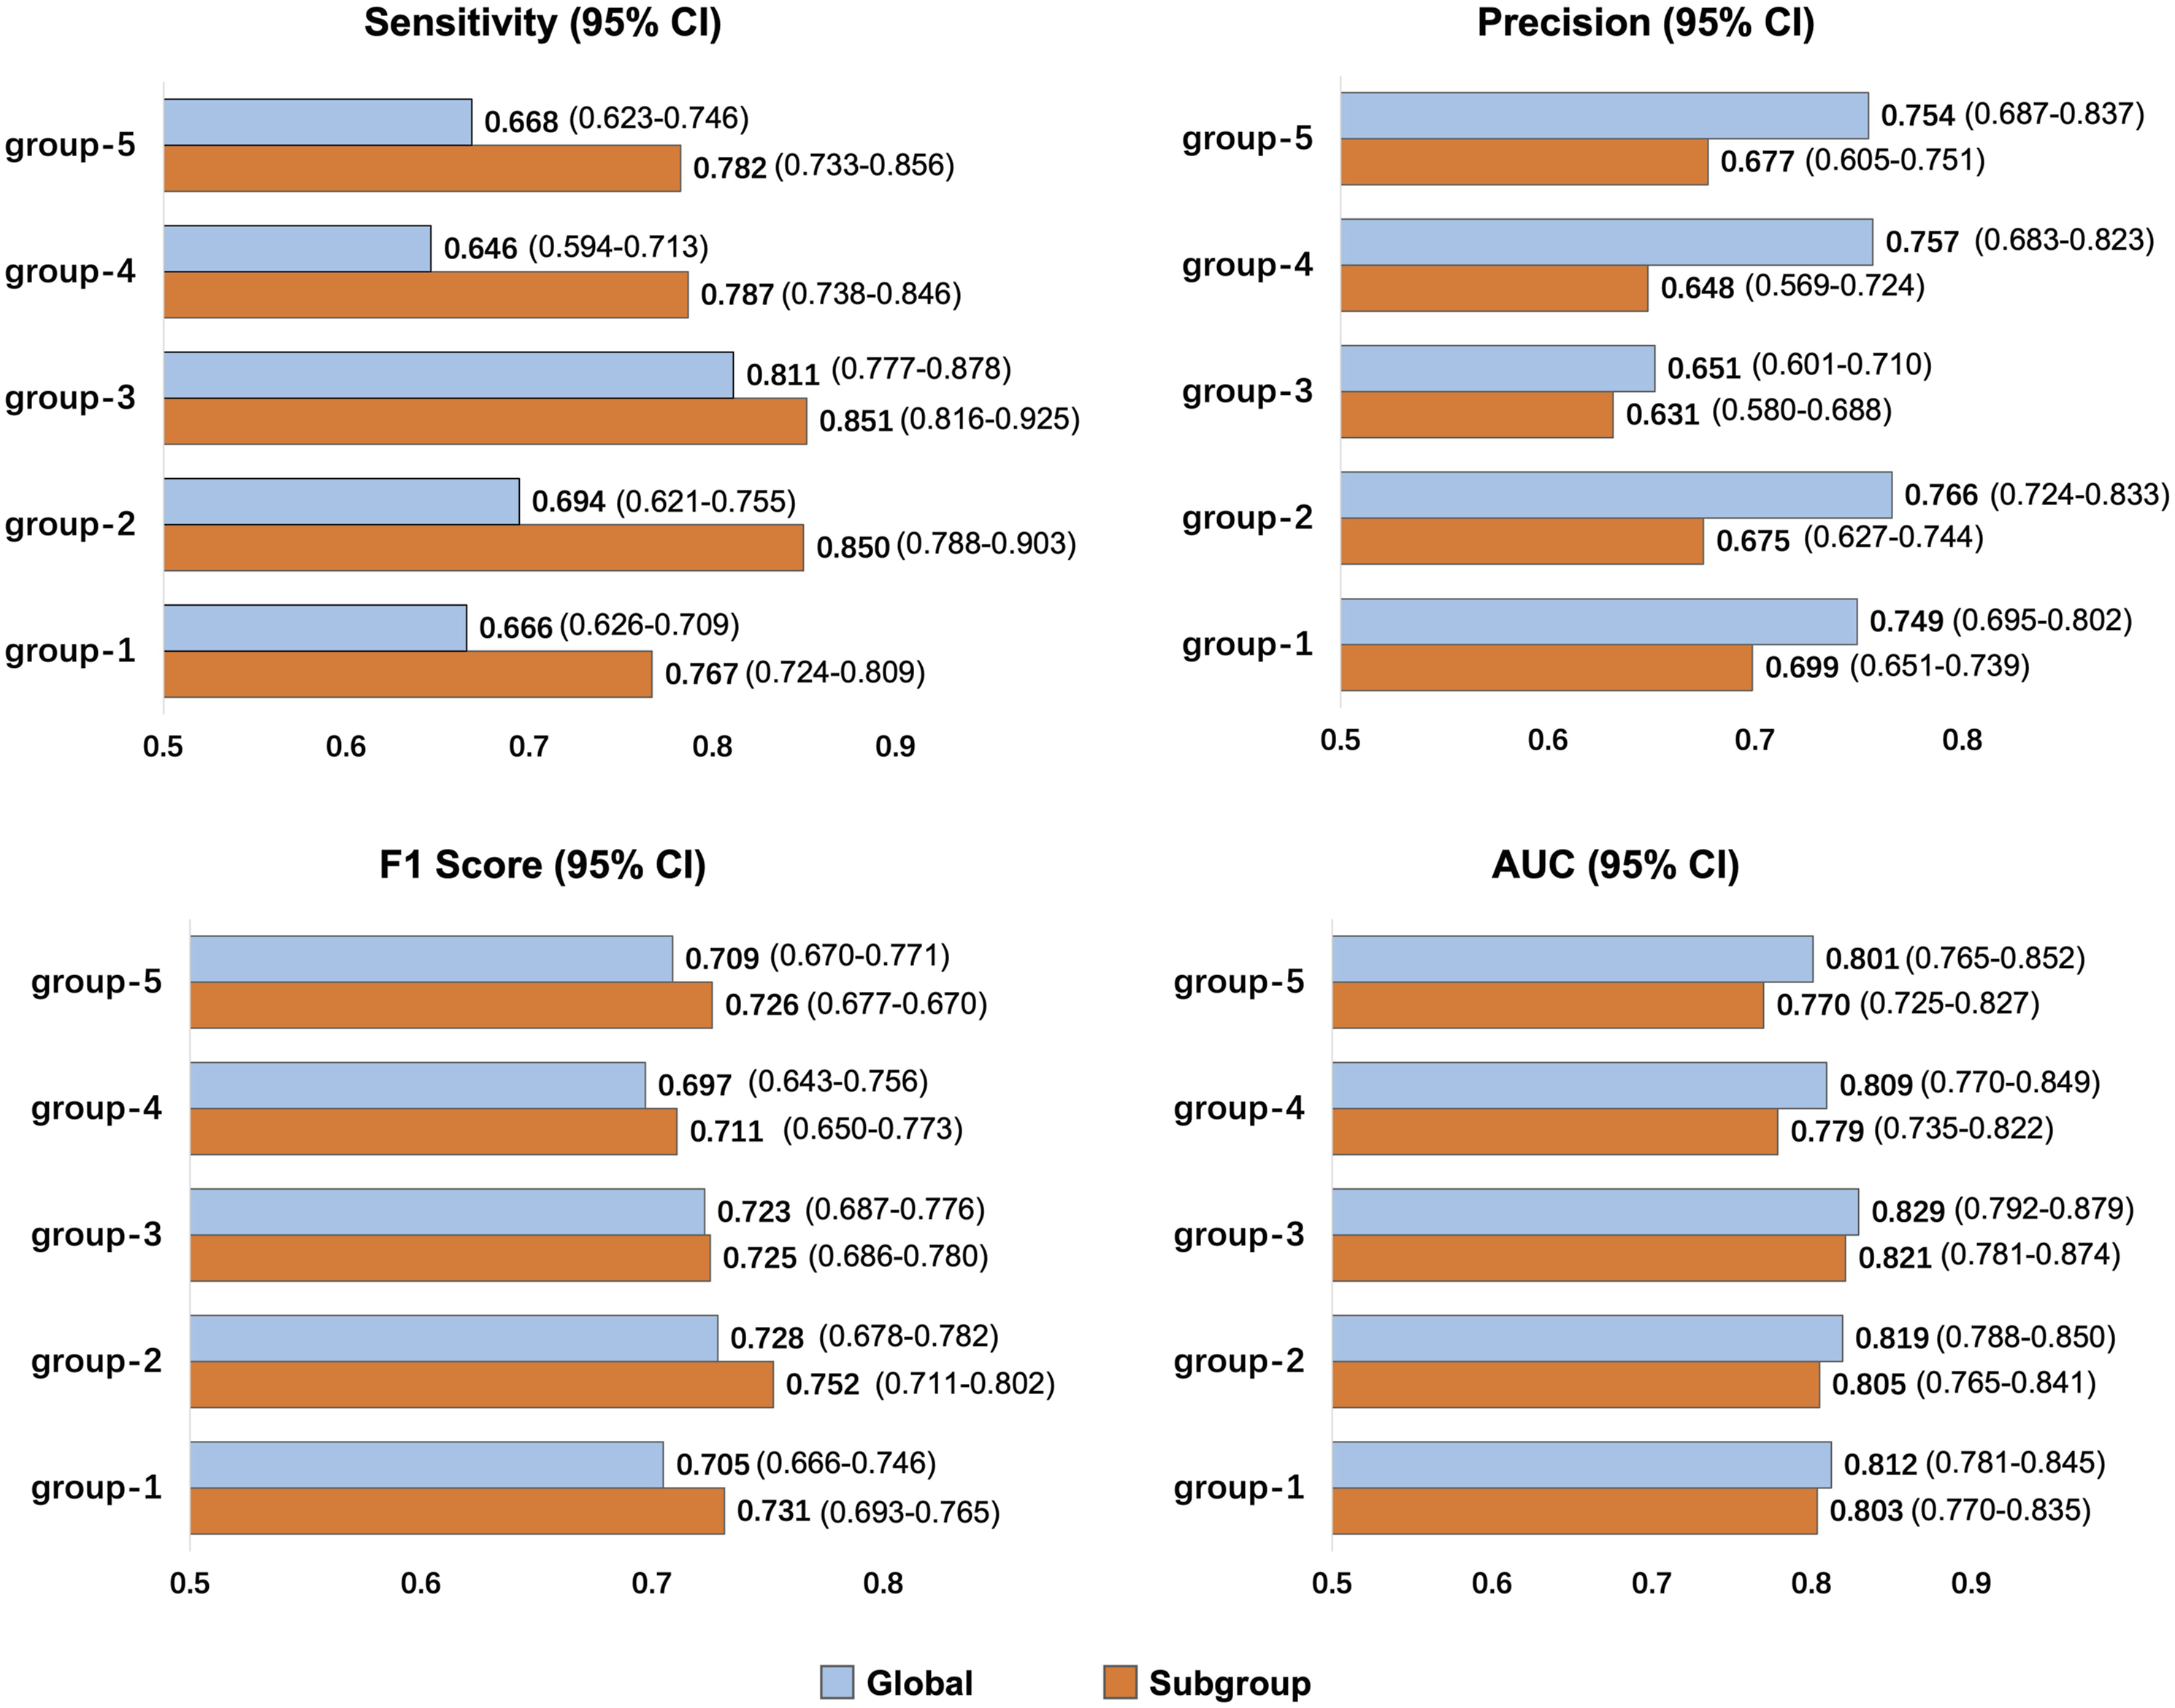
Feature comparison among learned subgroups
In analyzing feature importance output by LightGBM, we assessed the top-ranked features. Figure 4 shows the top 20 features identified in each subgroup model. Deduplication was applied to the top 20 features of each subgroup, resulting in a total of 58 unique features, ordered by their importance in the global model. The value in each color cell (feature) was specific ranking number among all 401 features of its subpopulation, the redder the color, the higher the ranking. Feature rankings were only partially consistent, and some vary greatly, which implies that some important features vital to the general population may have lost dominance in some individuals, while certain features that are more competent in describing the particularity emerged. Feature ranking heatmap of all subpopulations and cohort. Excerpts from the top 20 features of each subpopulation and global model.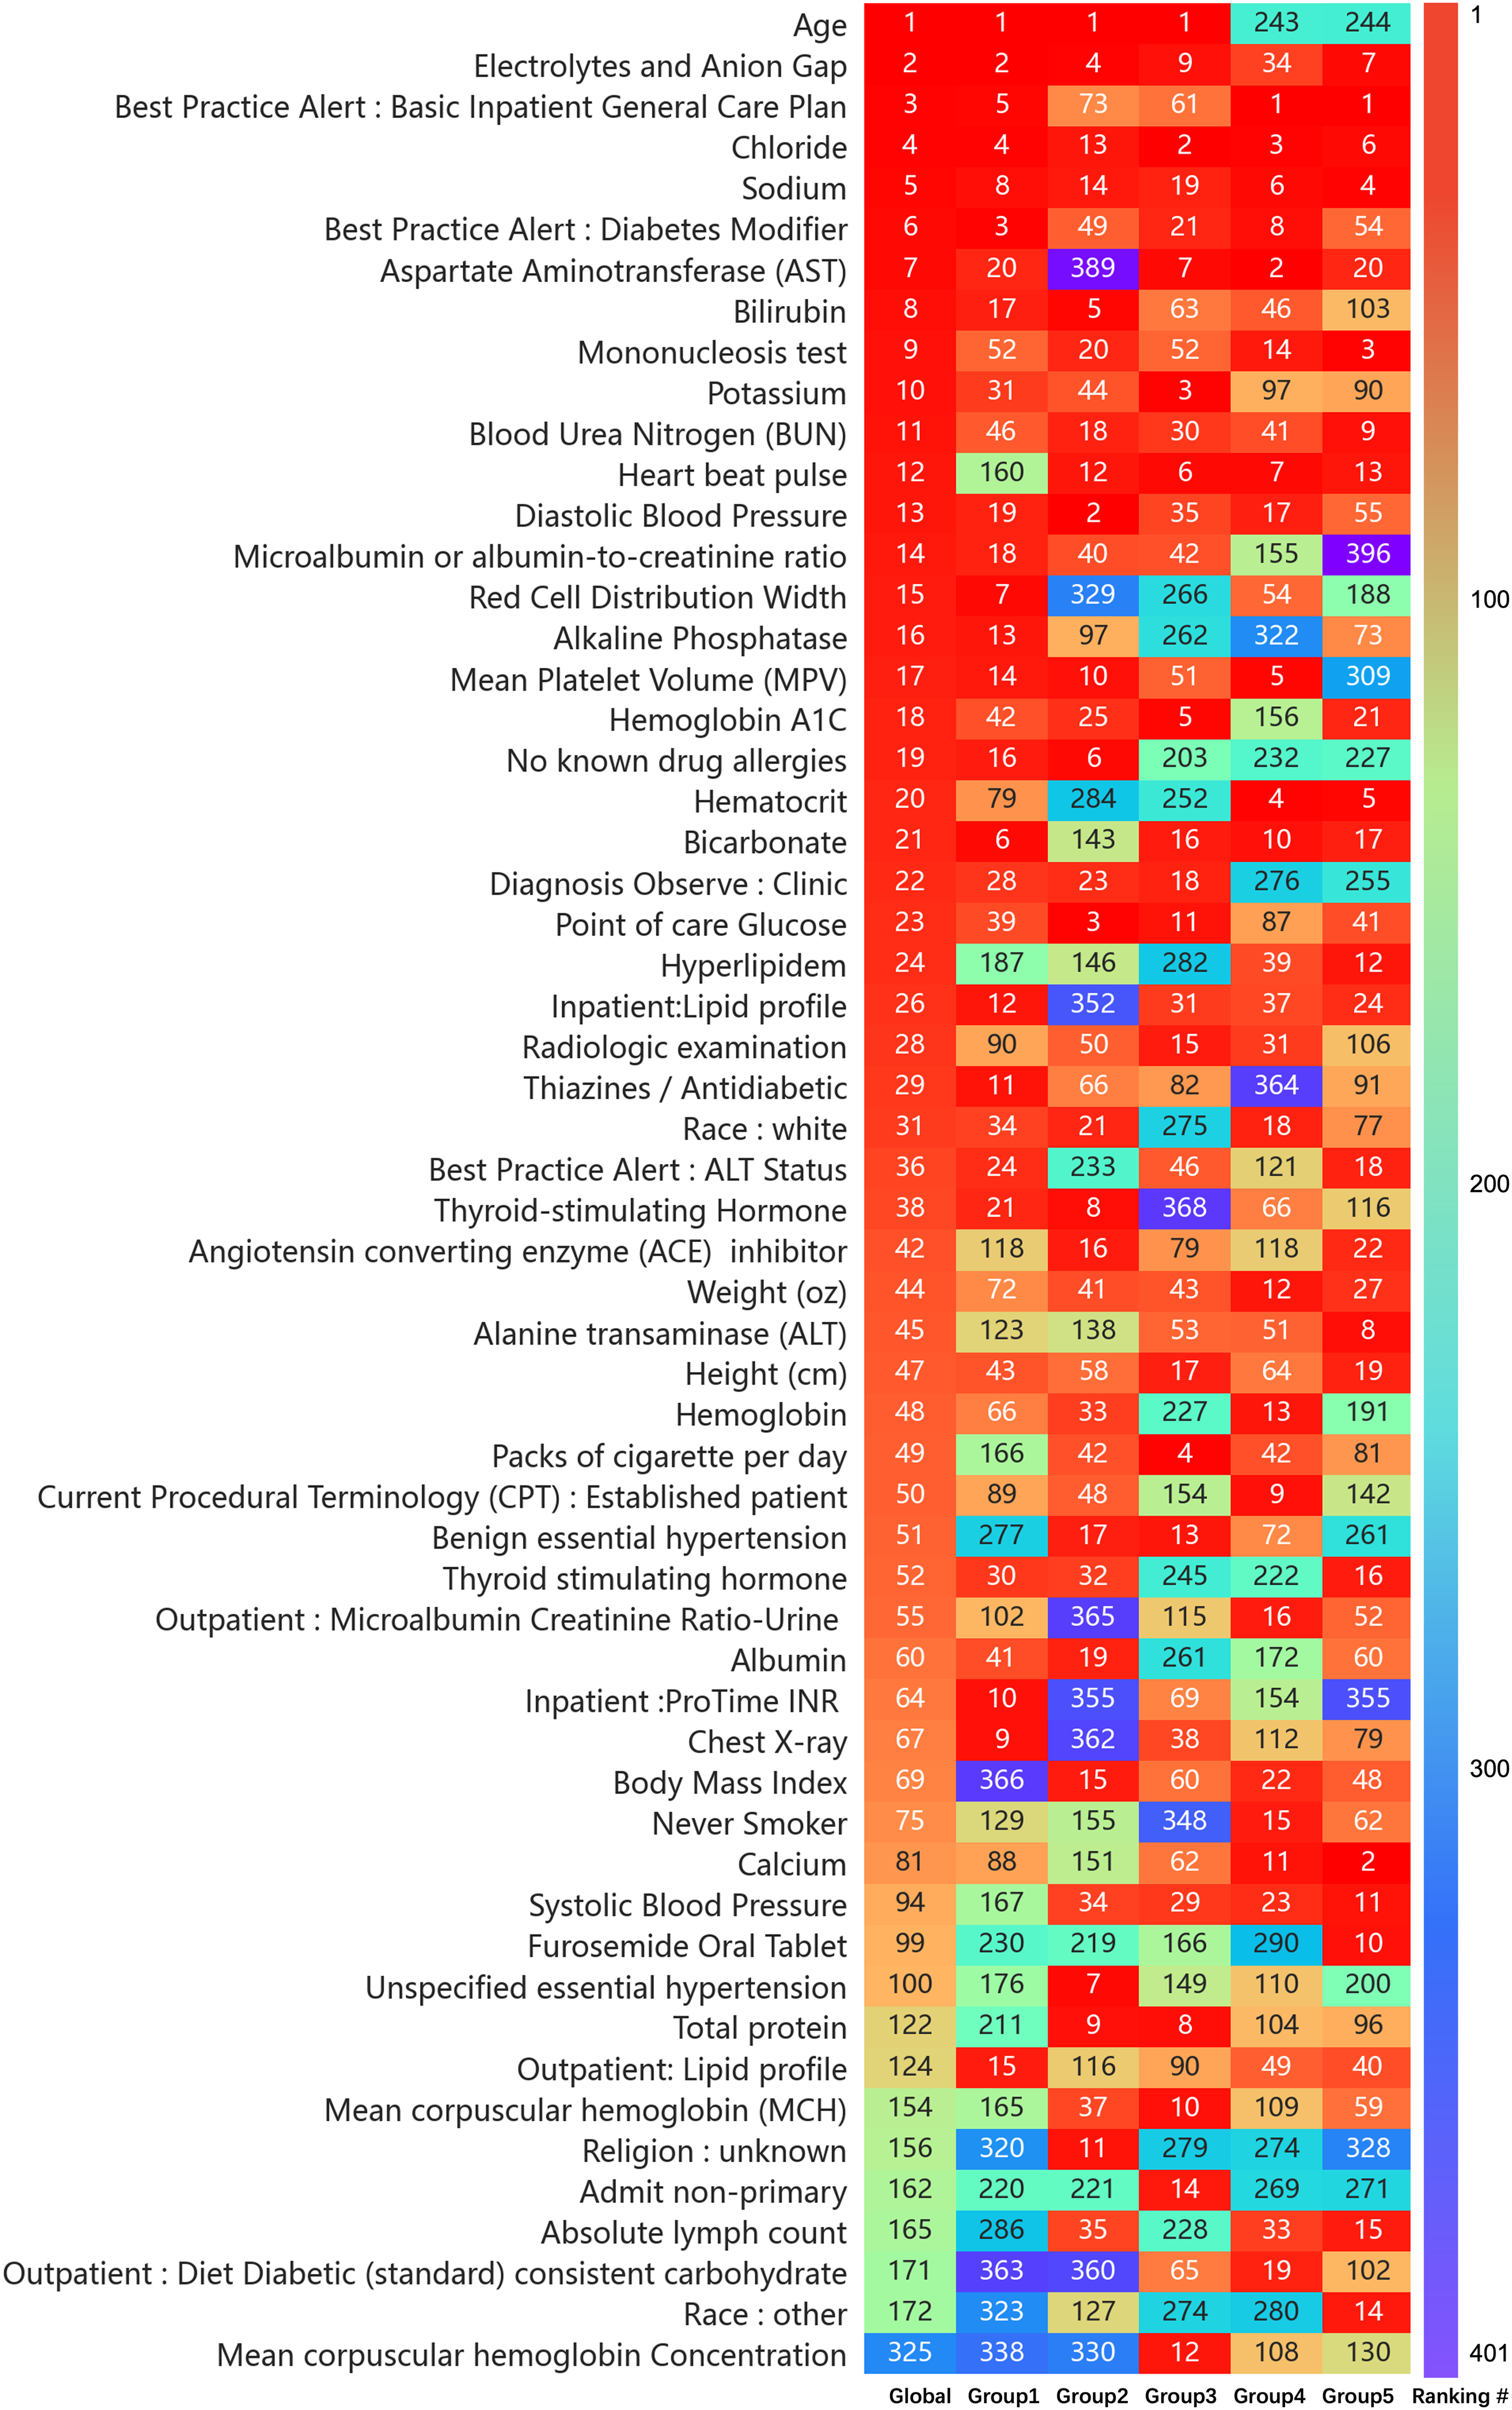
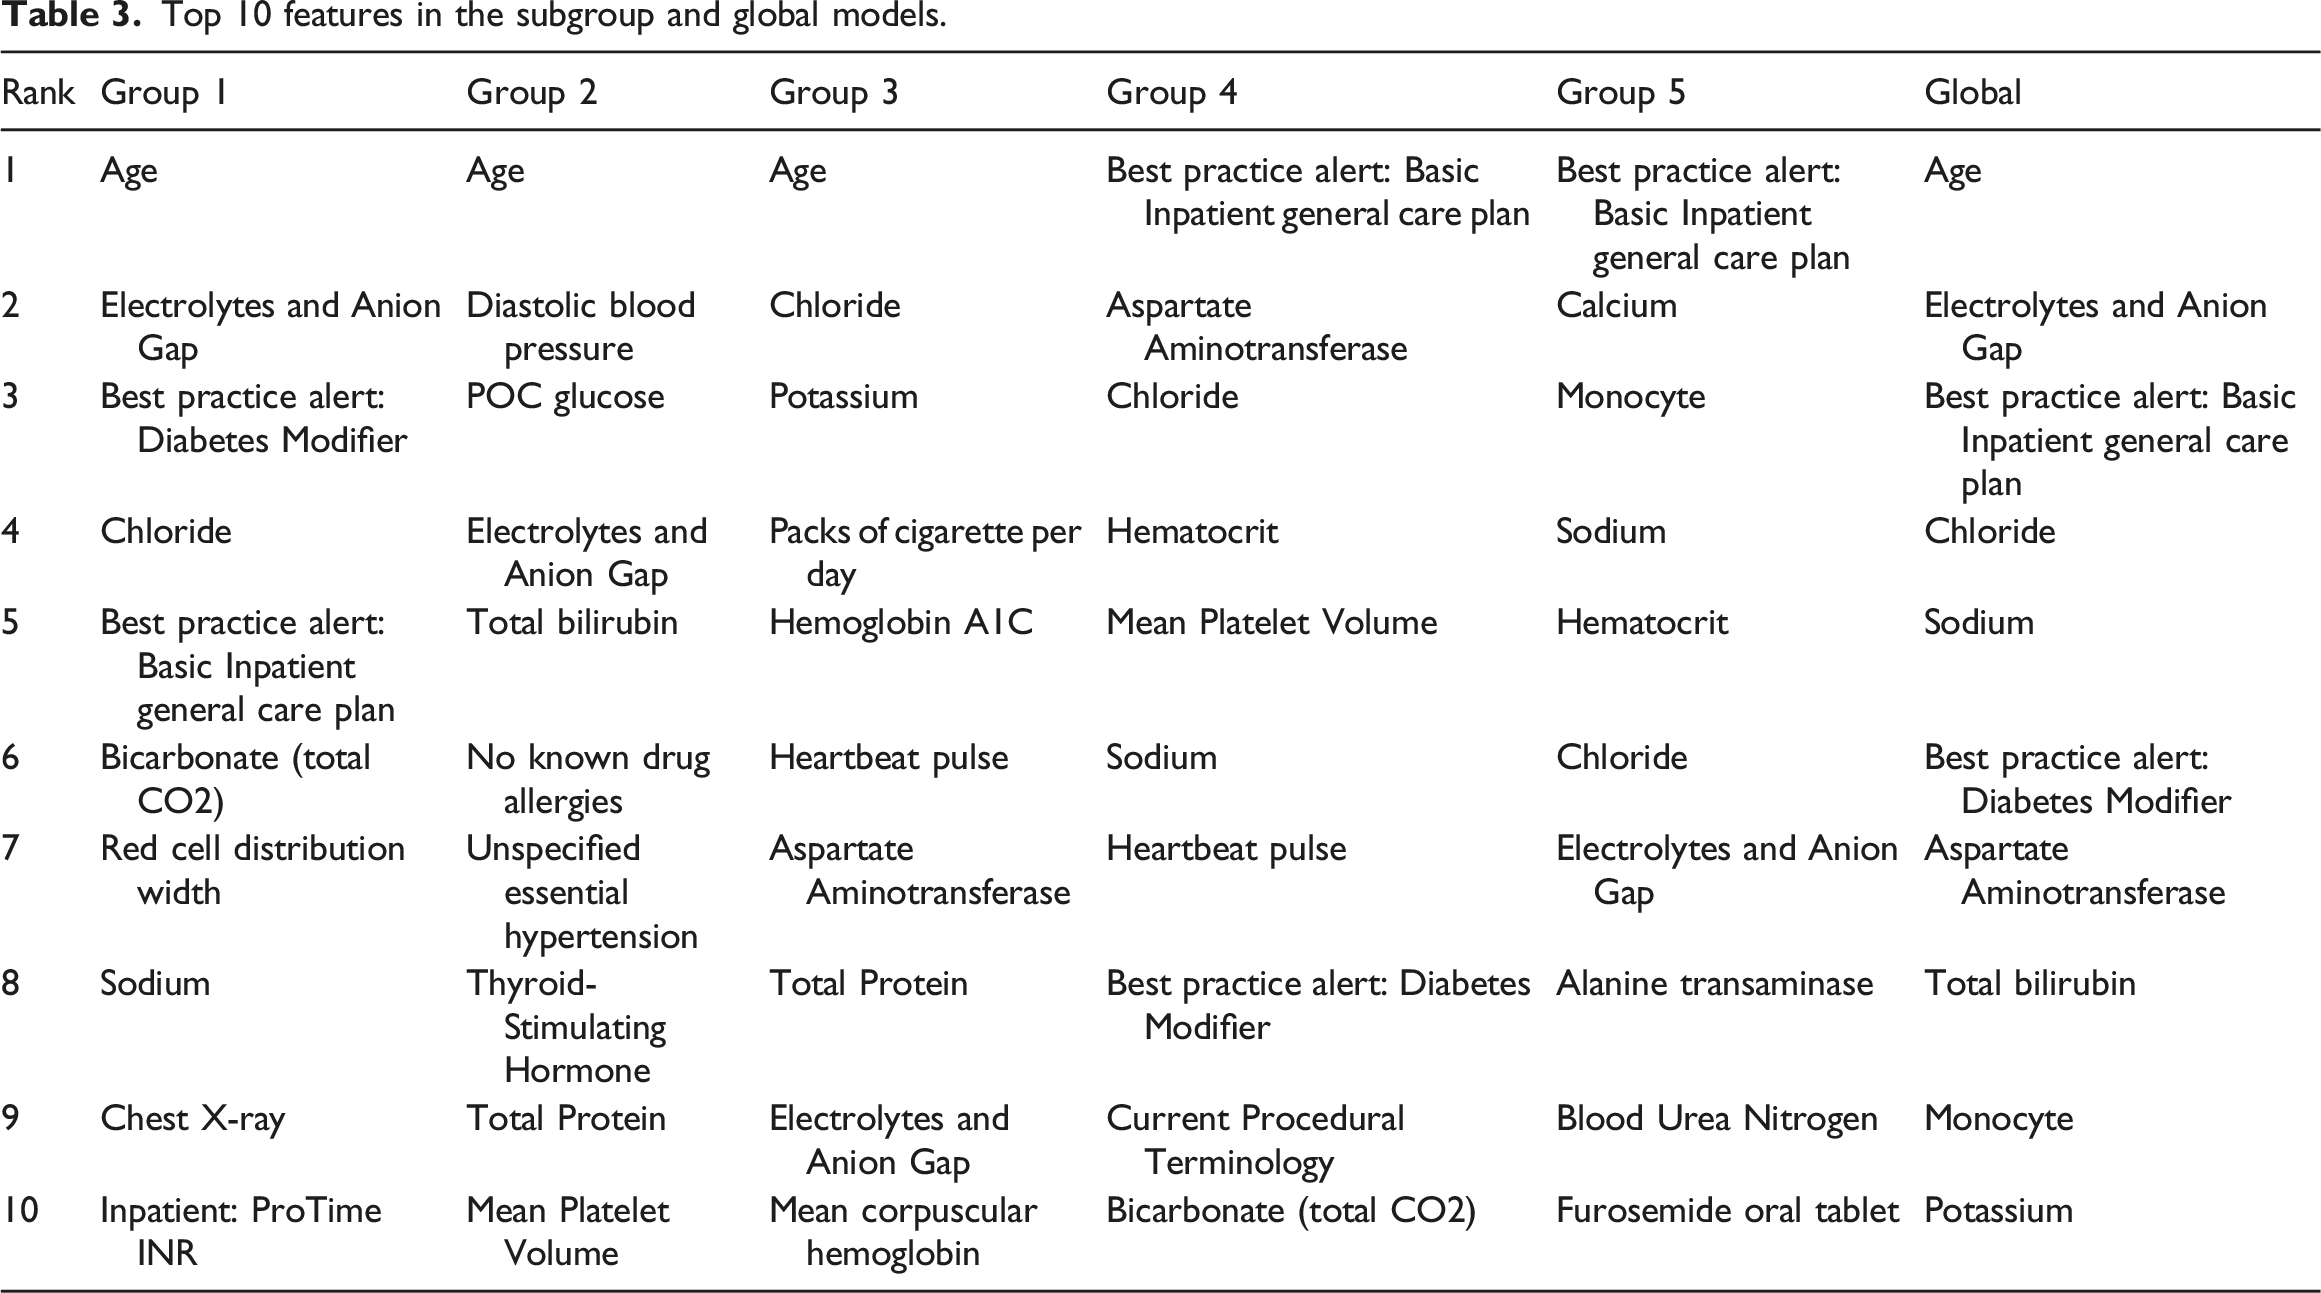
Top 10 features in the subgroup and global models.
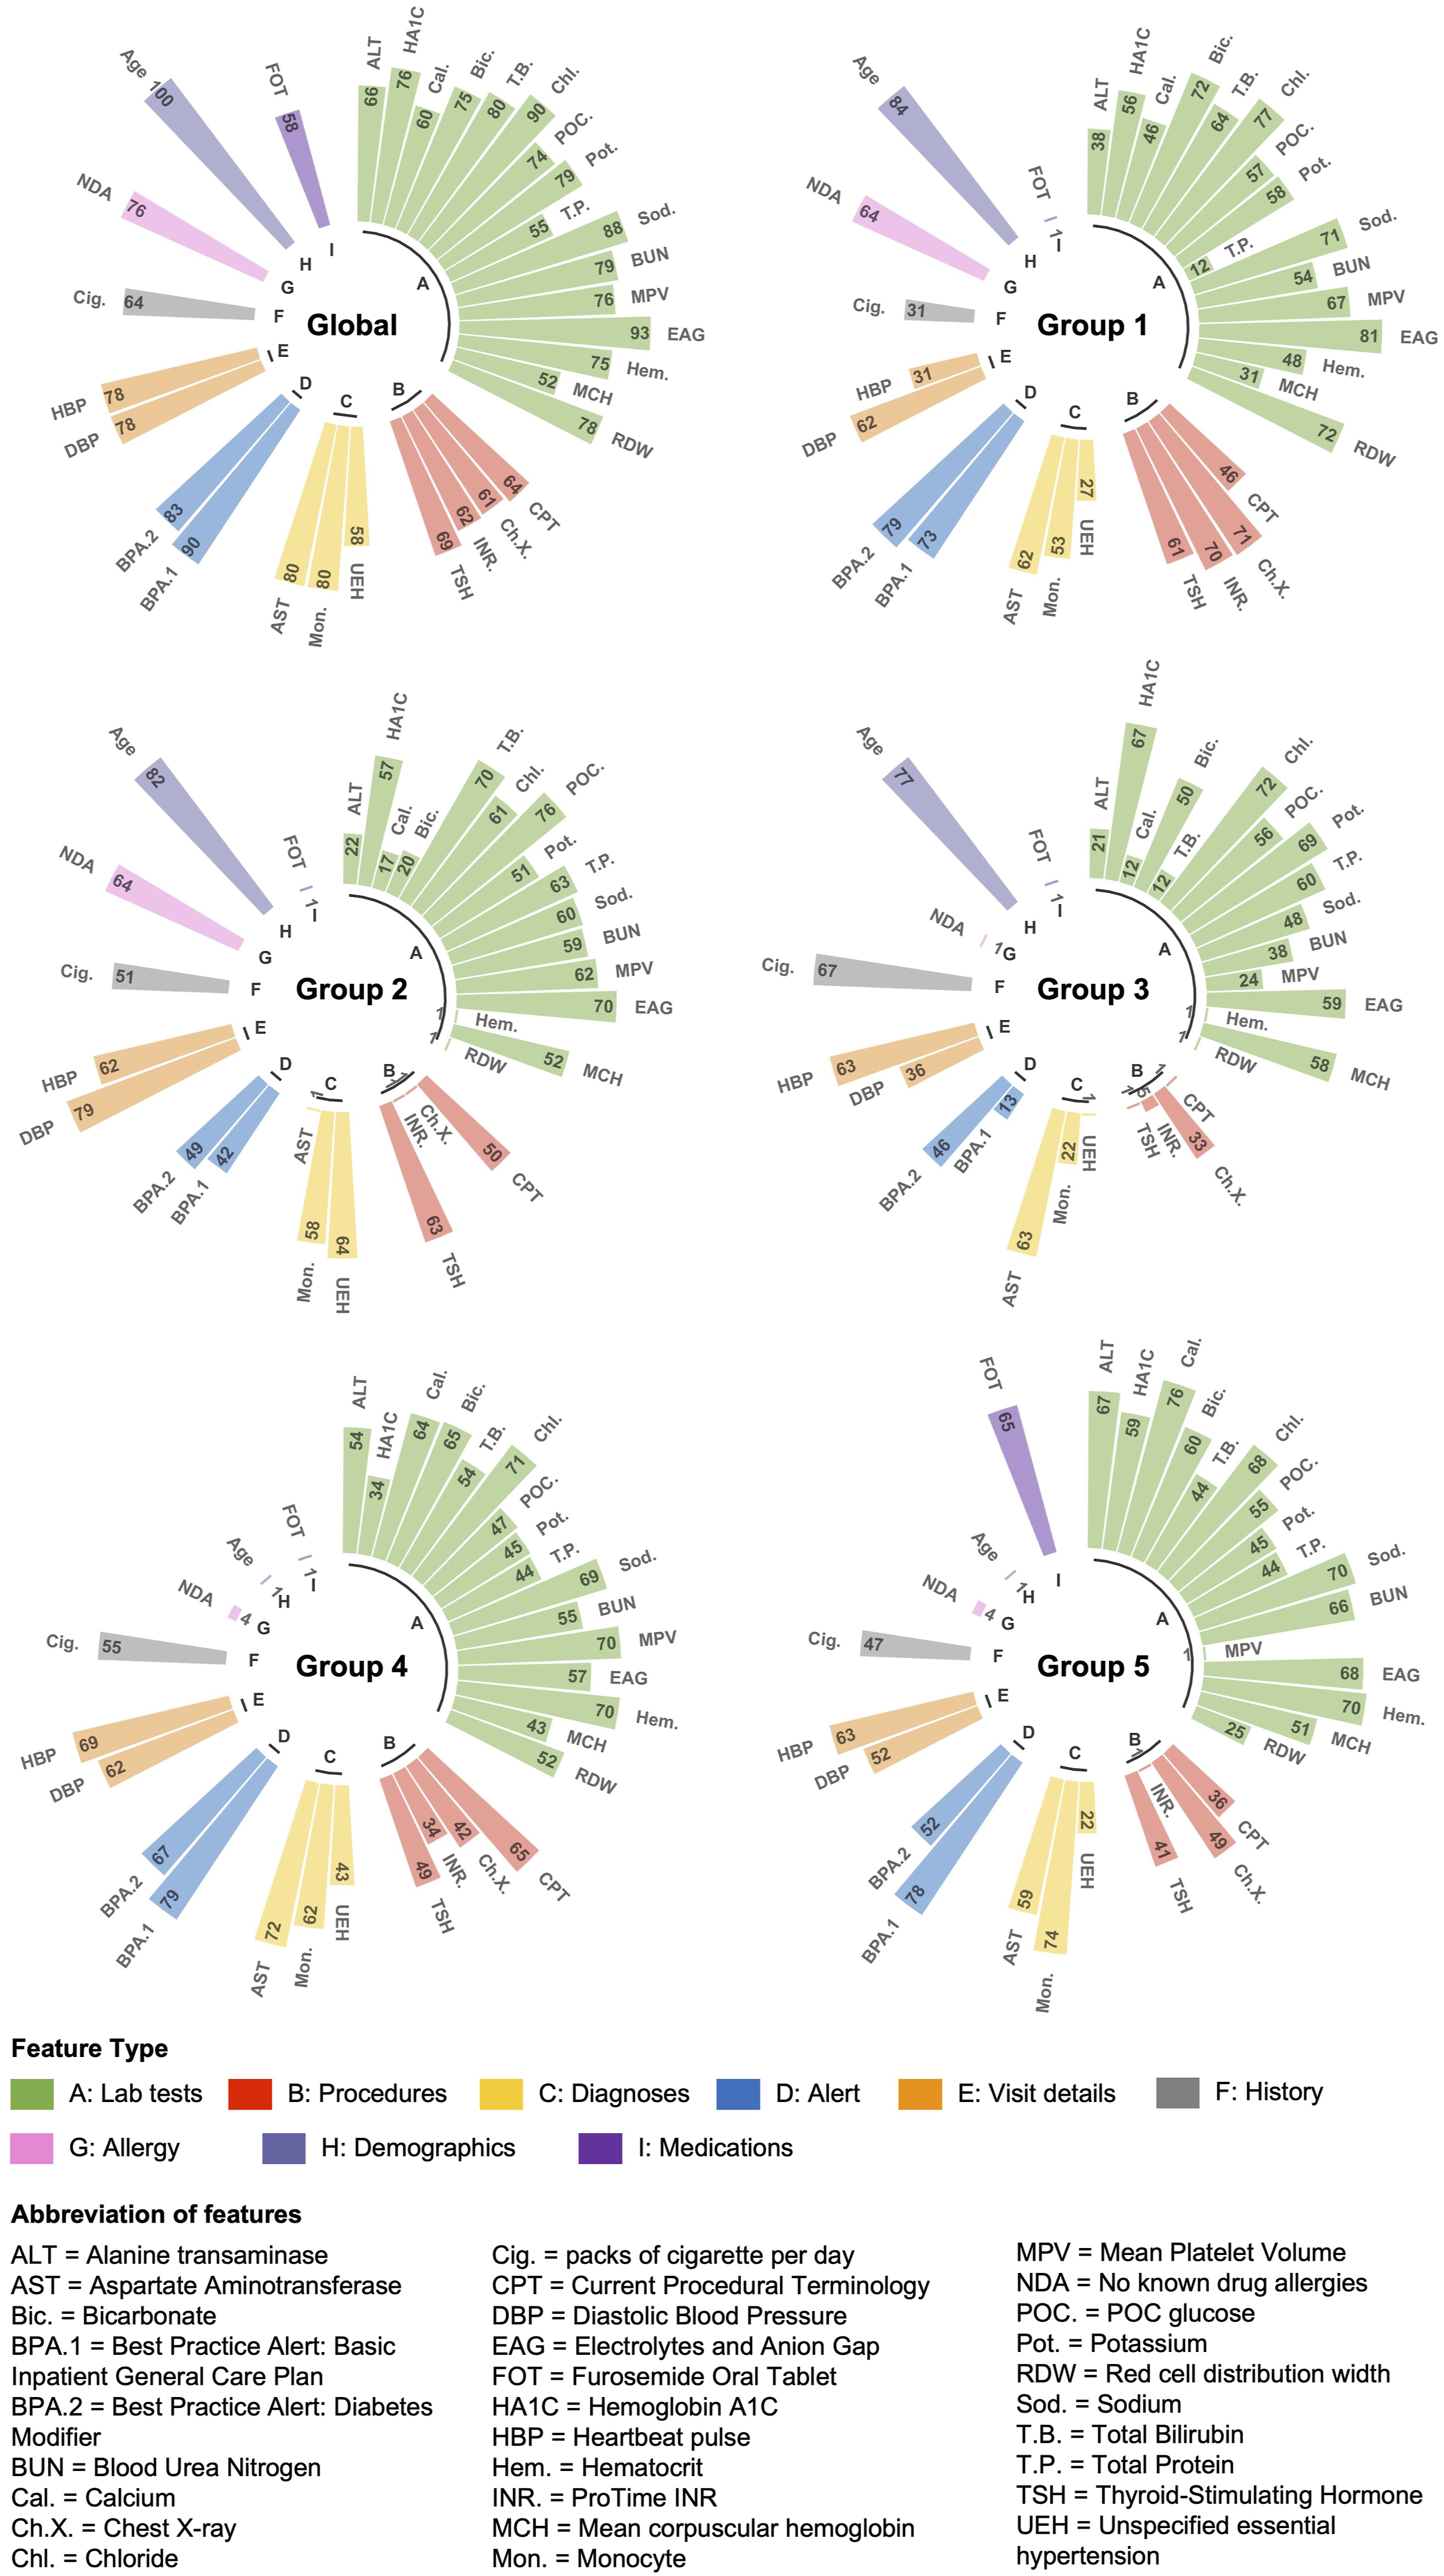
Top 10 important features comparison of all models. Importance of each feature from the lightGBM model was normalized by log10 × 100 after, and the length of each bar represents the importance degree of the feature.
Further investigating feature impact, SHAP analysis (Figure 6) reveals diverse influences. For instance, total bilirubin significantly decreases DKD risk for non-elderly women, while calcium has a substantial impact on elderly individuals. Mean corpuscular hemoglobin (MCH) affects various subgroups, particularly men, but not elderly women. DBP and unspecified essential hypertension have greater impacts on female subgroups, particularly non-elderly women. These findings underscore the nuanced influence of features across diverse subpopulations, highlighting potential risk factors for specific subgroups that may not appear equally important in global models. Comparison of the single feature SHAP values in multiple groups. The horizontal axis is the SHAP value. Each point represents a sample, and the sample size is stacked vertically.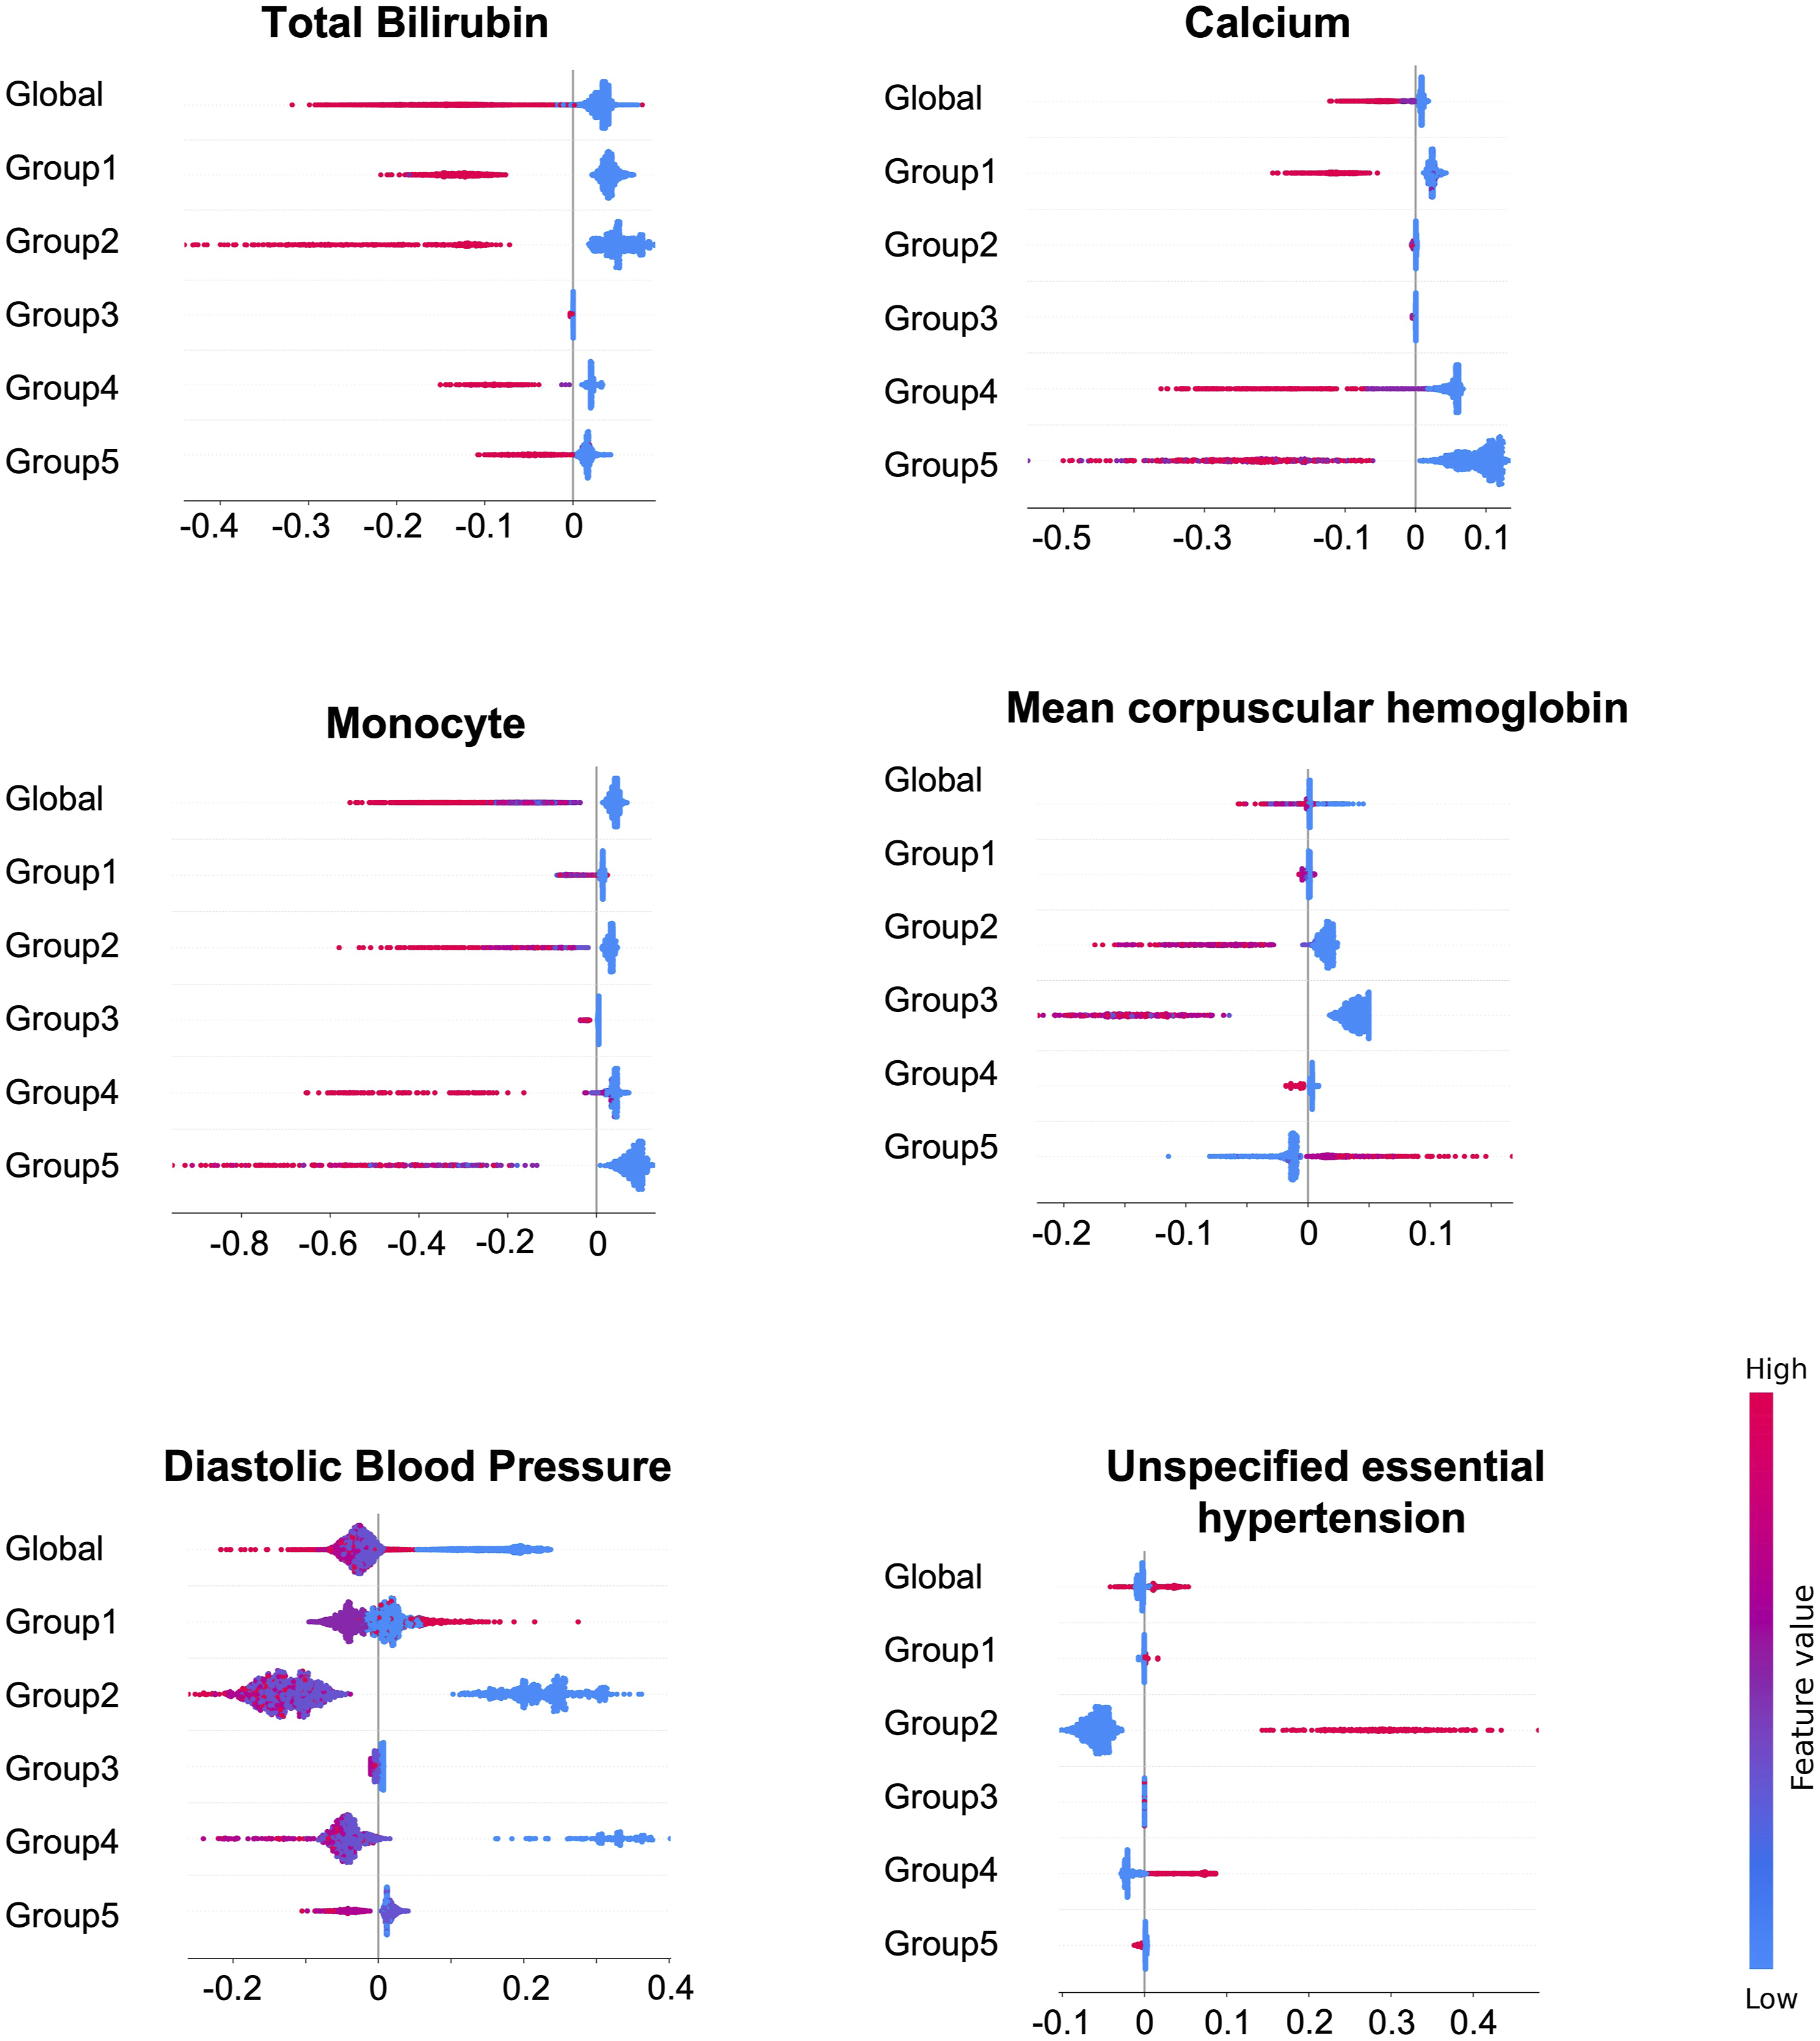
Discussion
Balancing interpretability and performance
In clinical settings, data-driven models can achieve impressive performance but often lack transparency and medical interpretability, compromising their clinical utility. Utilizing known medical knowledge can enhance the interpretability of subgroup identification and support clinical acceptance. However, overreliance on existing knowledge can result in biased perspectives, hinder the identification of new trends, and obscure certain relationships within the underlying mechanisms.
To achieve a balance between interpretability and performance, iSLIM offers a structured framework rooted in established DKD risk factors while also allowing for the discovery of novel patterns and risk factors within and across subgroups. It initially employs a white-box method to identify subgroups based on well-known factors like age, hypertension, and BMI, ensuring clinicians can easily understand the subgrouping process and logic. Subsequently, LightGBM is used for predictive modeling, with SHAP analysis enhancing interpretability by revealing feature importance and uncovering complex relationships. This approach not only validates and extends existing medical knowledge but also provides fresh insights into the heterogeneity of DKD.
Rational interpretation of the identified subgroups
The five DKD subgroups were identified based on the factors of age, gender, and obesity. These factors served as the optimal split nodes, as determined by tree-based methods, to classify the heterogeneous cohort into subgroups that achieve the best predictive performance within our framework. From a medical perspective, the heterogeneity of patient subgroups defined by these three factors, particularly in combination, has been reported in many clinical studies.23,26,39 This provides a rationale for our subgroup learning results. For example, one retrospective study has shown that older age, male, and being overweight are associated with increased creatinine (i.e., decreased kidney function). 40 Tanabe et al. found that patients with severe insulin resistant diabetes who are young and have high BMI is a subgroup with the highest risk of developing DKD, 41 thereby corresponding to our subgroup 1. Another study on renal function prediction has shown that the variability of prediction performance depends on gender, age, and BMI. 42 These findings suggest that the three factors are representative but also reflect the instability of a single risk equation or global model when facing heterogeneous diseases. However, previous research has failed to emphasize the importance of combinatorial impact of the three features, as well as how they may be used to distinguish DKD patients. Our study identified the five most representative subgroups and delivered a rank list of important features, thereby addressing the preceding issues and potentially inspiring further exploration of the DKD mechanisms.
Potential risk factors of subgroups
Improvement in sensitivity within subgroups is driven by unique features that, combined with pathology, guide physicians in exploring mechanisms and identifying risk factors for early alert and prevention. Despite residual confounders, potential risk factors are discussed below.
Lowering total bilirubin concentration clinically heightens the risk of renal insufficiency, 43 aligning with our findings that high total bilirubin reduces DKD risk. Our results also showed that Total bilirubin’s impact is pronounced in non-elderly females (subgroup 2) but minimal in males of the same age range (subgroup 3). In prior studies, total bilirubin emerges as a predictor of metabolic syndrome in females, 44 indicating a novel DKD risk factor with strong gender heterogeneity.
Calcium has a significant impact on the elderly, especially older men (subgroup 5). Decreased calcium metabolism associated with aging will lead to increased renal burden. 45 In our findings, furosemide was one of the top predictors of DKD in older men, and it increased renal calcium excretion.46,47 The association between calcium and furosemide needs to be further explored in studies of DKD risk in men.
Low mean corpuscular hemoglobin (MCH) generally increases the risk of DKD, but an exception exists in our result for older men (subgroup 5), where high MCH becomes a risk factor. Macrocytic anemia may be represented by high MCH. 48 Some studies have explained that the causes of anemia may be gradually complicated by aging, and the number of cases of macrocytic anemia increases in older people. 49 MCH warrants further investigation as a potential risk predictor for DKD in older males.
High-value unspecified essential hypertension shows a stronger association with DKD risk in non-elderly women (subgroup 2) than others, underscoring the importance of studying specific types of hypertension in understanding renal disease risk in women, such as pre-eclampsia, which can persist for years after delivery. 50
Decreased diastolic blood pressure (DBP) generally correlates with increased DKD risk, 51 particularly for women (subgroups 2 and 4). An exception is observed for obese individuals (subgroup 1), where increasing DBP renders them likely to develop DKD. In-depth analyses of DBP and obesity are warranted to elucidate their relationship or mechanism with DKD. As many studies have repeatedly confirmed the positive correlation between body weight and blood pressure, 52 and only a few studies have discussed that there are increased intracardiac filling pressures and impaired relaxation of the heart during diastole. 53 Accordingly, we advocate for in-depth analyses of DBP and obesity to elucidate their relationship or mechanism with DKD.
While the above factors may be non-specific and not directly causal, studying them can provide valuable insights into disease pathogenesis, playing significant roles in the etiological network. Our research identifies potential DKD risk factors as informative clues for physicians to decide on further investigation.
Limitation and future work
Several limitations should be addressed in future work. First, the dataset is derived from a single organization, which may lead clinical doctors to question the model’s generalizability and performance across different institutions. Expanding to multi-center data sources is essential to enhance the model’s applicability and robustness. Second, ongoing model optimization is necessary, and clinical doctors may anticipate the integration of new technologies, such as advanced deep learning models like explainable neural networks or large-scale language models (LLMs), to further improve prediction accuracy and interpretability. However, implementing these innovations requires fine-tuning and the use of techniques like reinforcement learning from human feedback (RLHF) and direct preference optimization (DPO), despite the associated learning costs. Finally, iSLIM’s dependence on expert knowledge underscores the need for continuous updates to incorporate the latest clinical insights. Without timely updates and rigorous clinical validation, the model’s practical applicability and reliability could be questioned by clinicians.
Conclusions
This study introduces the iSLIM framework, which focuses on often-overlooked patient populations and combines knowledge-based and data-driven technologies. Validation with the DKD cohort demonstrates its effectiveness in addressing heterogeneous disease prediction challenges through subgroup strategies. The framework can be integrated with EHR systems and CDSS to enhance machine learning tools in clinical settings, aid doctors in creating personalized prevention plans, and advance digital health systems for managing complex diseases.
Footnotes
Acknowledgements
Thanks to the Healthcare Enterprise Repository for Ontological Narration (HERON) at the University of Kansas Medical Center for providing the dataset used in this study. We appreciate the HERON Data Request Oversight Committee for their approval and adherence to Health Insurance Portability and Accountability Act (HIPAA) privacy rules.
Author Contributions
ML, YH, and BL designed and conceptualized the overall study. BL and XH performed model development and conducted the experiments. BL prepared the manuscript. ML, Eric Ngai, KL, XZ, WC, and HYC contributed to the evaluation of experimental results. ML and YH advised regarding motivation of the clinical design and domain for the study. All authors reviewed the manuscript critically for scientific content, and all authors gave final approval of the manuscript for publication.
Declaration of conflicting interests
The author(s) declared no potential conflicts of interest with respect to the research, authorship, and/or publication of this article.
Funding
This work was supported by the Major Research Plan of the National Natural Science Foundation of China (Key Program, Grant No. 91746204), the Science and Technology Development in Guangdong Province (Major Projects of Advanced and Key Techniques Innovation, Grant No. 2017B030308008), Guangdong Engineering Technology Research Center for Big Data Precision Healthcare (Grant No. 603141789047), the National Natural Science Foundation of China (Grant No. 72371116), WC is supported by the Guangzhou Science and Technology Plan Project (Grant No. 2023A04J0360). ML is supported by the NIH/NIDDK under award number R01DK116986 and NSF Smart and Connected Health award 2014554.