
Abstract
Keywords
Introduction
Sarcopenia is a condition of generalized low muscle mass and strength and poor physical performance that increases with aging and complicates many chronic diseases1,2 including renal diseases, cancers, etc. The etiology of sarcopenia is multifactorial, including effects of age, chronic disease, inflammation, neurologic disorders, physical inactivity, malnutrition, and obesity. Sarcopenia increases the risk for multiple costly health outcomes including falls, fractures, mobility disorders, impairments in activities of daily living, loss of independence, and long-term care placement.3–10 Research also shows that the resulting restrictions in activities of daily living and independence could have downstream effects on social engagement and psychological status.11,12 The age-adjusted mortality rate is also >2.3 times higher among sarcopenic compared to non-sarcopenic older adults.7,13–15 Sarcopenia also increases the risk for hospitalization and results in 2-fold increased costs for hospitalizations and for long-term care due to disability.10,16,17
To promote early clinical detection and treatment of patients having or at risk for sarcopenia, the European Working Group on Sarcopenia in Older People (EWGSOP2) presented consensus definitions for sarcopenia, characterizing probable sarcopenia by low muscle strength, confirmed sarcopenia by the presence of low muscle mass, and severe sarcopenia as the combination of low muscle strength, mass, and physical performance parameters. 2 However, patients with sarcopenia often go undetected in busy clinical practices. 18 First, sarcopenia diagnosis requires measuring muscle mass, strength, and performance,1,2,18 necessitating access to specialized equipment to measure muscle mass, such as magnetic resonance imaging (MRI), computed tomography (CT), or whole-body dual-energy x-ray absorptiometry (DXA), or dynamometry to measure grip strength. In addition, some tests such as gait speed require available space and time for assessment. The muscle mass measurement exams are not easily incorporated into routine office clinical practice, where primary providers have time-limited clinical encounters, and sometimes limited knowledge of sarcopenia and of its assessment through objective measures (e.g., grip strength). 18 Sarcopenia did not have an ICD code until 2016. 19 The previous research 20 combines natural language processing (NLP) techniques based on key words and phrases with expert review of text terms from clinical notes supporting sarcopenia (as well as cachexia and frailty, which can be related to sarcopenia) along with ICD codes, to identify patients with sarcopenia in the EHR. While this mechanism enabled some identification of sarcopenia, this mechanism showed low performance in detecting sarcopenia When relying on those few text terms and ICD codes, only those patients having these in their notes are detectable. However, sarcopenia is under-diagnosed. In another study we found less than 2% of those meeting sarcopenia criteria in the research testing core had the ICD10 code or text term in their clinical record. 21 On the other hand, the occurrence of ICD codes or terms in EHR clinical notes does not guarantee that the condition is present, and objective measurements were not typically documented within the EHR. Therefore, it is important to generate a tool to identify patients with, or at risk for, sarcopenia from data already available within electronic health records (EHR), even when objective measures such as grip strength and gait speed are not recorded during routine clinical practice. Large EHR datasets combining clinical text notes with diagnosis codes and other coded data provide an opportunity to identify patients with sarcopenia on a population level.
We previously used structured data from the EHR to generate machine learning models to detect the presence of sarcopenia criteria, using measurements in the research core as a gold standard. 21 To the best of our knowledge, the study cohort dataset used in the previous research 21 (and also in the current manuscript) has the largest patient cohort with direct measurements for sarcopenia combined with robust structured and unstructured data from a multiple health institution EHR data exchange. Clinical text note extraction manually is cumbersome and natural language processing (NLP) uses computer algorithms to select out key words and phrases. Our objective of the current analysis is to investigate an efficient and effective model to combine NLP derived information from clinical text notes with the coded (structured) data from the EHR to improve detection of sarcopenia. The main contributions of this research include: (1) Investigating and comparing various approaches to integrate the clinical text notes for sarcopenia detection; (2) Developing a model to integrate both the data-driven and knowledge-driven approaches to incorporate text data.
Materials and methods
Dataset and preprocessing
This retrospective analysis includes EHR data of patients who were categorized as sarcopenic or nonsarcopenic (controls) according to their muscle or physical performance testing in the a state Center for Musculoskeletal Health’s Function, Imaging, and Tissue Resource Core (FIT Core) from the previous study. 21 The testing includes grip strength,3,22 repeat chair stand test, 22 gait speed, 23 muscle strength, 24 Short Physical Performance Battery (SPPB),4,5 and appendicular skeletal muscle mass adjusted for height in meters-squared (ASM/m2) as measured by dual-energy X-ray absorptiometry (DXA). 1 Each test has a criteria threshold to identify sarcopenia. Patients were classified using definitions and thresholds for sarcopenia from the EWGSOP2 guidelines, 18 applied as in the previous publication 21 (See also Supplemental methods). For the current analysis, if a patient met one or more of the criteria test thresholds for sarcopenia, the patient was categorized as having sarcopenia, otherwise, the patient was categorized as a control. In this study, we included 1304 adult participants in the FIT Core protocol who had EHR data in a state Network for Patient Care between January 2016 and August 2020. The additional inclusion criteria were each patient having a minimum of 2 years of EHR data before the FIT Core visit date for muscle or physical performance testing. There are no exclusion criteria. This study was approved by the institutional review board (IRB) of a state University.
The structured data from the EHR includes diagnosis codes (ICD-10), laboratory test results, medications, and BMI values. For diagnoses, we used the third level to the leaf nodes of the ICD-10 code hierarchy, which groups diagnoses into categories. 25 For example, A00 to A09 are grouped as “intestinal infectious diseases”. We grouped various types of tumors or cancers together as the neoplasms group including ICD-10 codes from C00 to D49. Pregnancy or childbirth-relevant codes (O00 to O9A) were excluded. For medication, we used the drug group specified in the national drug code (NDC) directory and excluded “medical devices and supplies”, “diagnostic products”, “nasal agents- systemic topical”, and “dermatological” categories. The anti-infectious medications are grouped into one category, including “Anti-infective Agents – Misc.”, “Antifungals”, “Antivirals”, “Aminoglycosides”, “Antimycobacterial Agents”, “Cephalosporins”, “Fluoroquinolones”, “Penicillin”, “Tetracyclines” and “Macrolides”. Each diagnosis and medication variable were coded as binary representation (1 or 0) indicating whether the diagnosis was made for the patient or medication was prescribed. For laboratory tests, we included all tests having measures by 10% or more of the patients in our study cohort. The number values of the laboratory test results were then standardized to “low”, “normal” or “high” using the laboratory reference ranges. When multiple results of the same laboratory test were found in the EHR, the most recent result was used. If laboratory tests were not conducted or absent, they were considered as “normal,” operating under the assumption that if any given test result was not available it was more likely to be normal than abnormal, and we would not be able to conclude otherwise. The BMI values collected during the muscle or physician performance testing were used and coded to represent “low”, “normal” and “high” using the published standard. 21 Each laboratory test result or BMI value were coded as 0 or one or 2 representing “low”, “normal” or “high”.
Clinical notes include all types of clinical reports stored in the EHR. Because of the amount of textual data, we first applied UMLS MetaMap
26
to select the sentences containing concepts of selected semantic categories including ‘Disease or Syndrome’, ‘Diagnostic Procedure’, ‘Activity’, ‘Daily or Recreational Activity’, ‘Body Part, Organ, or Organ Component’, ‘Body Space or Junction’, ‘Medical Device’, and ‘Sign or Symptom’. Figure 1 shows a clinical report snippet with selected sentences containing concepts in some of these semantic categories of the UMLS MetaMap. The selected sentences in the clinical notes were processed to generate word-based n-grams. 1-g, 2-g, and 3-g were generated. Each n-gram is a clinical note feature. One hot encoding is used to represent the occurrence of each n-gram in the patient record. The n-grams are fit into the designed feature selection process and then integrated with the structured data for predictive analysis. Sentences that are selected using UMLS MetaMap.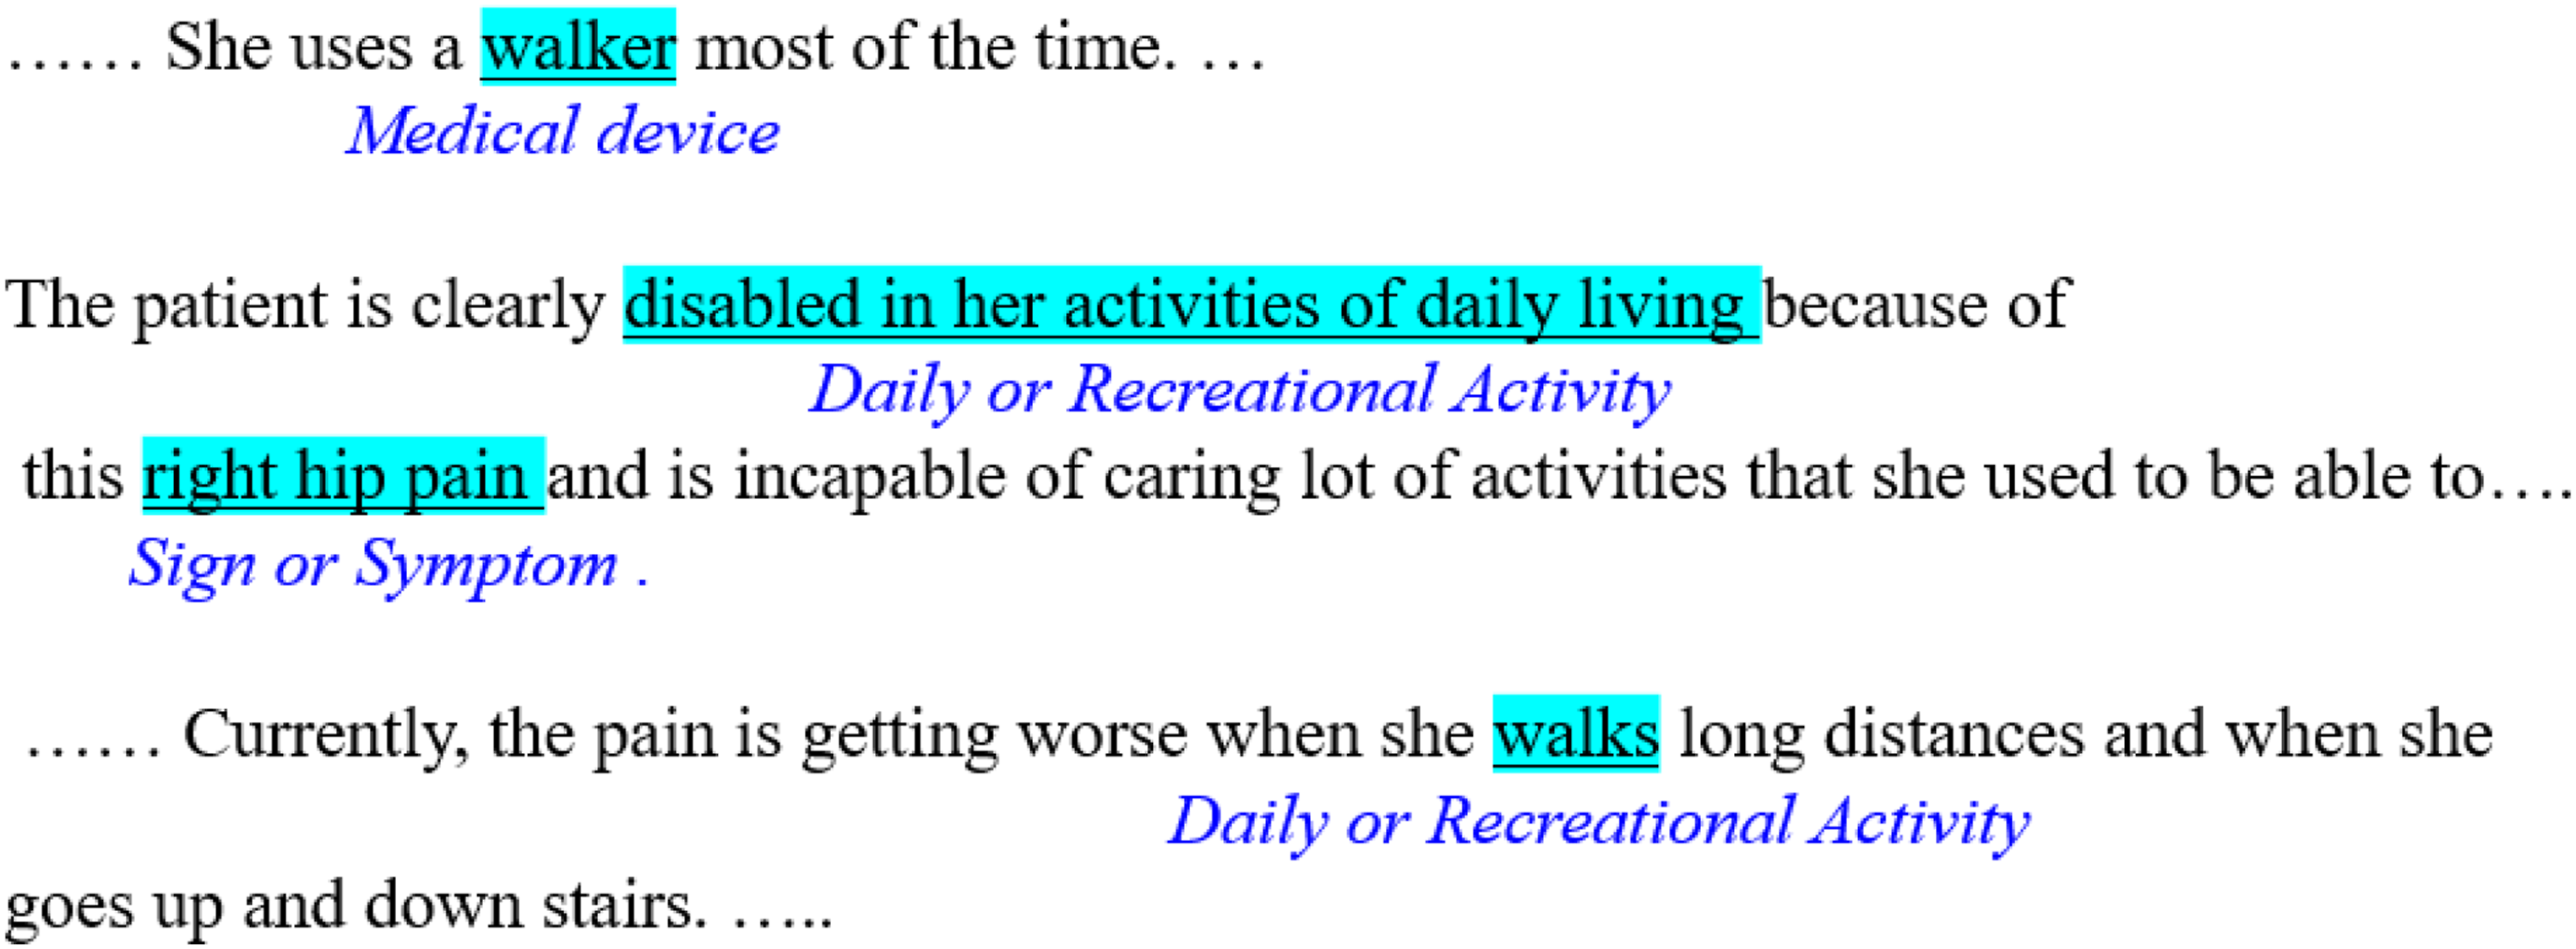
System framework
Figure 2 shows the system framework of our research, the structured data and clinical notes in our complete data set are first pre-processed by applying the steps mentioned in the previous section. Then, the complete data set is split into training and test data. The training set is used to create predictive models using logistic regression (LR), random forest (RF), support vector machines (SVM), Multi-Layer Perceptron (MLP), XGBoost, and Gradient Boosting (GB), respectively. We investigated three different approaches to integrate the structured data with clinical notes for sarcopenia detection. The first approach (referred to as “+Data-driven Clinical Notes Features (CNF)”) uses the data-driven feature selection method to first identify the relevant clinical note features with regards to the labels (control vs. sarcopenia) of the patients. In the data-driven feature selection approach, the note features are selected in a machine learning approach based on their impact on the fit of the model rather than on their conceptual connection to the outcome of interest. The selected clinical note features are treated as independent variables along with all structured data (without applying feature selection) to be fed into the learning models. The second approach (referred to as “+Data-driven All Features (AF) + Feature Selection (FS)”) uses the data-driven feature selection on both structured data and clinical note features to identify most important features. In the first and second approach, ANOVA F-test values were then calculated for each feature, and the elbow method
27
is used to determine the optimal number of features. Both “+Data-driven CNF” and “Data-driven AF + FS” do not involve intervention of human experts in feature selection (shown as orange arrow A in Figure 2). The third approach (referred to as “+Data-driven plus Knowledge-driven CNF”) integrates data-driven feature selection with the knowledge driven clinical note feature selection. After applying a feature selection to identify the relevant clinical note features, two or more domain experts go through the clinical note features to finalize the selection by limiting the features to those that are most relevant to sarcopenia from the expert knowledge point of view. The selected clinical note features are then fed into the learning models with the structured data (shown as yellow arrow B in Figure 2). The last approach (referred to as “+Augmented prediction using CNF”) does not feed the clinical note features into the learning models, but only adjust the prediction result based on the occurrences of the selected clinical note features identified by experts (show as blue arrow C in Figure 2). In this research, two clinicians (a full Professor and an Associate Professor) who are clinical and research faculty in an academic medical center in in the United States each with more than 10 years of experience in musculoskeletal disorders, identified the relevant clinical note features. System framework.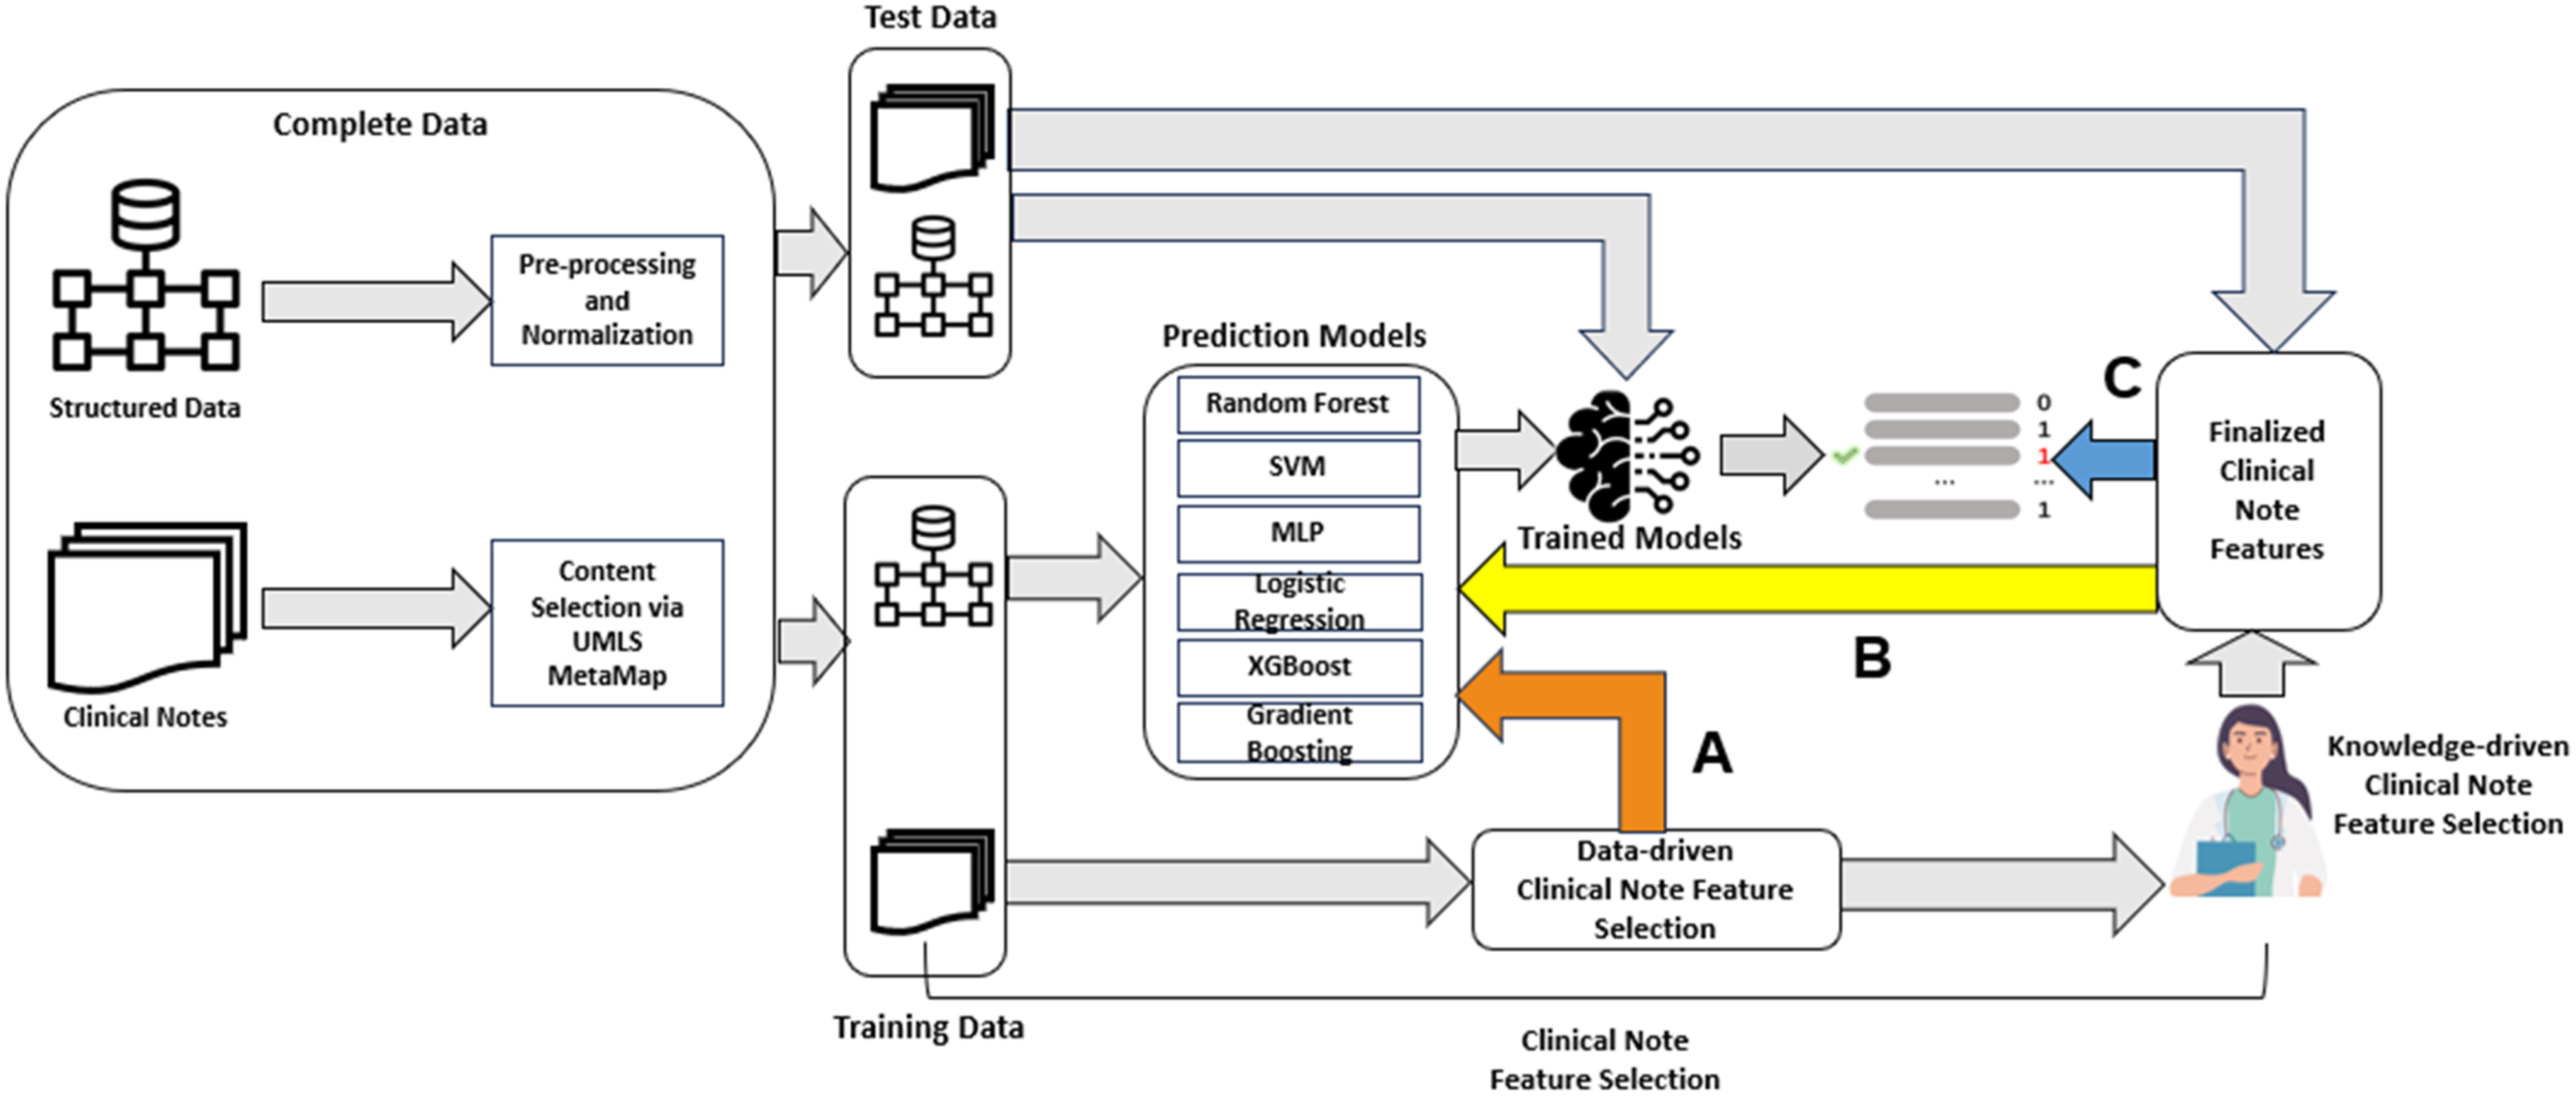
Data-driven and knowledge-driven CNF
To reduce the number of features and improve the sensitivity of our model without sacrificing the specificity to improve the overall performance, we investigated this integration of data-driven and knowledge-driven approach. The ANOVA F-test is used as a feature selection method to calculate a F-test score for each clinical note feature. To determine the number of the relevant features to be selected, we applied elbow methods on the generated graph using F-test scores to select the top relevant features. Then, the clinical experts review the top scored features and select the most relevant clinical note features to be included in the model building.
Augmented prediction using CNF
The “Data-driven CNF”, “Data-driven AF + FS”, and the “Data-driven and Knowledge-driven CNF” approaches use both structured data and clinical note features to train the prediction models. The “+Augmented prediction using CNF” approach only uses structured data to train the models but then adjusts the final predictions based on presence or absence of the knowledge-driven features. The adjustment process works as: If the predicted probability of a patient being sarcopenia is less than the threshold that is determined by a prediction model, but more than the mean probability of all non-sarcopenic patients, the clinical note features are used to adjust the prediction result by increasing the probability to above the threshold when the patient possesses one or more of those clinical note features. On the other hand, if the predicted probability of sarcopenia is less than the mean of the non-sarcopenic patients, the presence of these text features is not used to recategorize the patient. For example, if the clinical notes contain one or more features, such as “cane”, etc., that indicate the patient could have sarcopenia, the prediction result is only adjusted upward if the model’s original prediction result using structured data indicates that patient’s probability of sarcopenia is higher than the mean probability of all non-sarcopenic patients. This prevents falsely adjusting upward the probability of those having otherwise low probability.
Evaluation metrics and statistics
AUC (Area Under the ROC Curve), sensitivity and specificity are used to evaluate the performance of the proposed model and compare baseline models that without using clinical note features. For each model, we selected the top parameter sets and thresholds that performed best on the validation set in terms of AUC, then calculated the AUC, sensitivity, and specificity on the test set. The equations of the sensitivity and specificity are given in equations (1) and (2), where TP is true positive, FN is false negative, TN is true negative, and FP is false negative. To assess which model yields significant performance improvements over the models that are based on the structured data only, we conducted Mann-Whitney tests for the comparison. The statistical analyses were performed using Python version 3.9.0, and p-values <0.05 were considered statistically significant.


Experimental setting
We split our dataset into training (70% of the complete data), validation (10% of the complete data), and a test set (20% of the complete data) with a stratified approach. Hence, training, validation, and test sets preserve the same proportions of sarcopenia patients as observed in the original dataset. The validation set was used to fine-tune the parameters of the models, and the test set was used to evaluate the performance of all models. For all learning models, we use the top 10 best performed parameters to calculate the 95% confidence interval (CI) of AUC, sensitivity, and specificity values. To calculate confidence intervals, we first determine if the data follows a normal distribution by performing the Shapiro-Wilk and Kolmogorov-Smirnov tests. If both tests yield p-values above 0.05, we assume the data is normally distributed. Then, we calculate the 95% confidence interval using the mean and standard deviation. Otherwise, we create bootstrap samples from the original data, then calculate the 95% bootstrap confidence interval.
Results
Statistics of the dataset
Study cohort characteristics. a
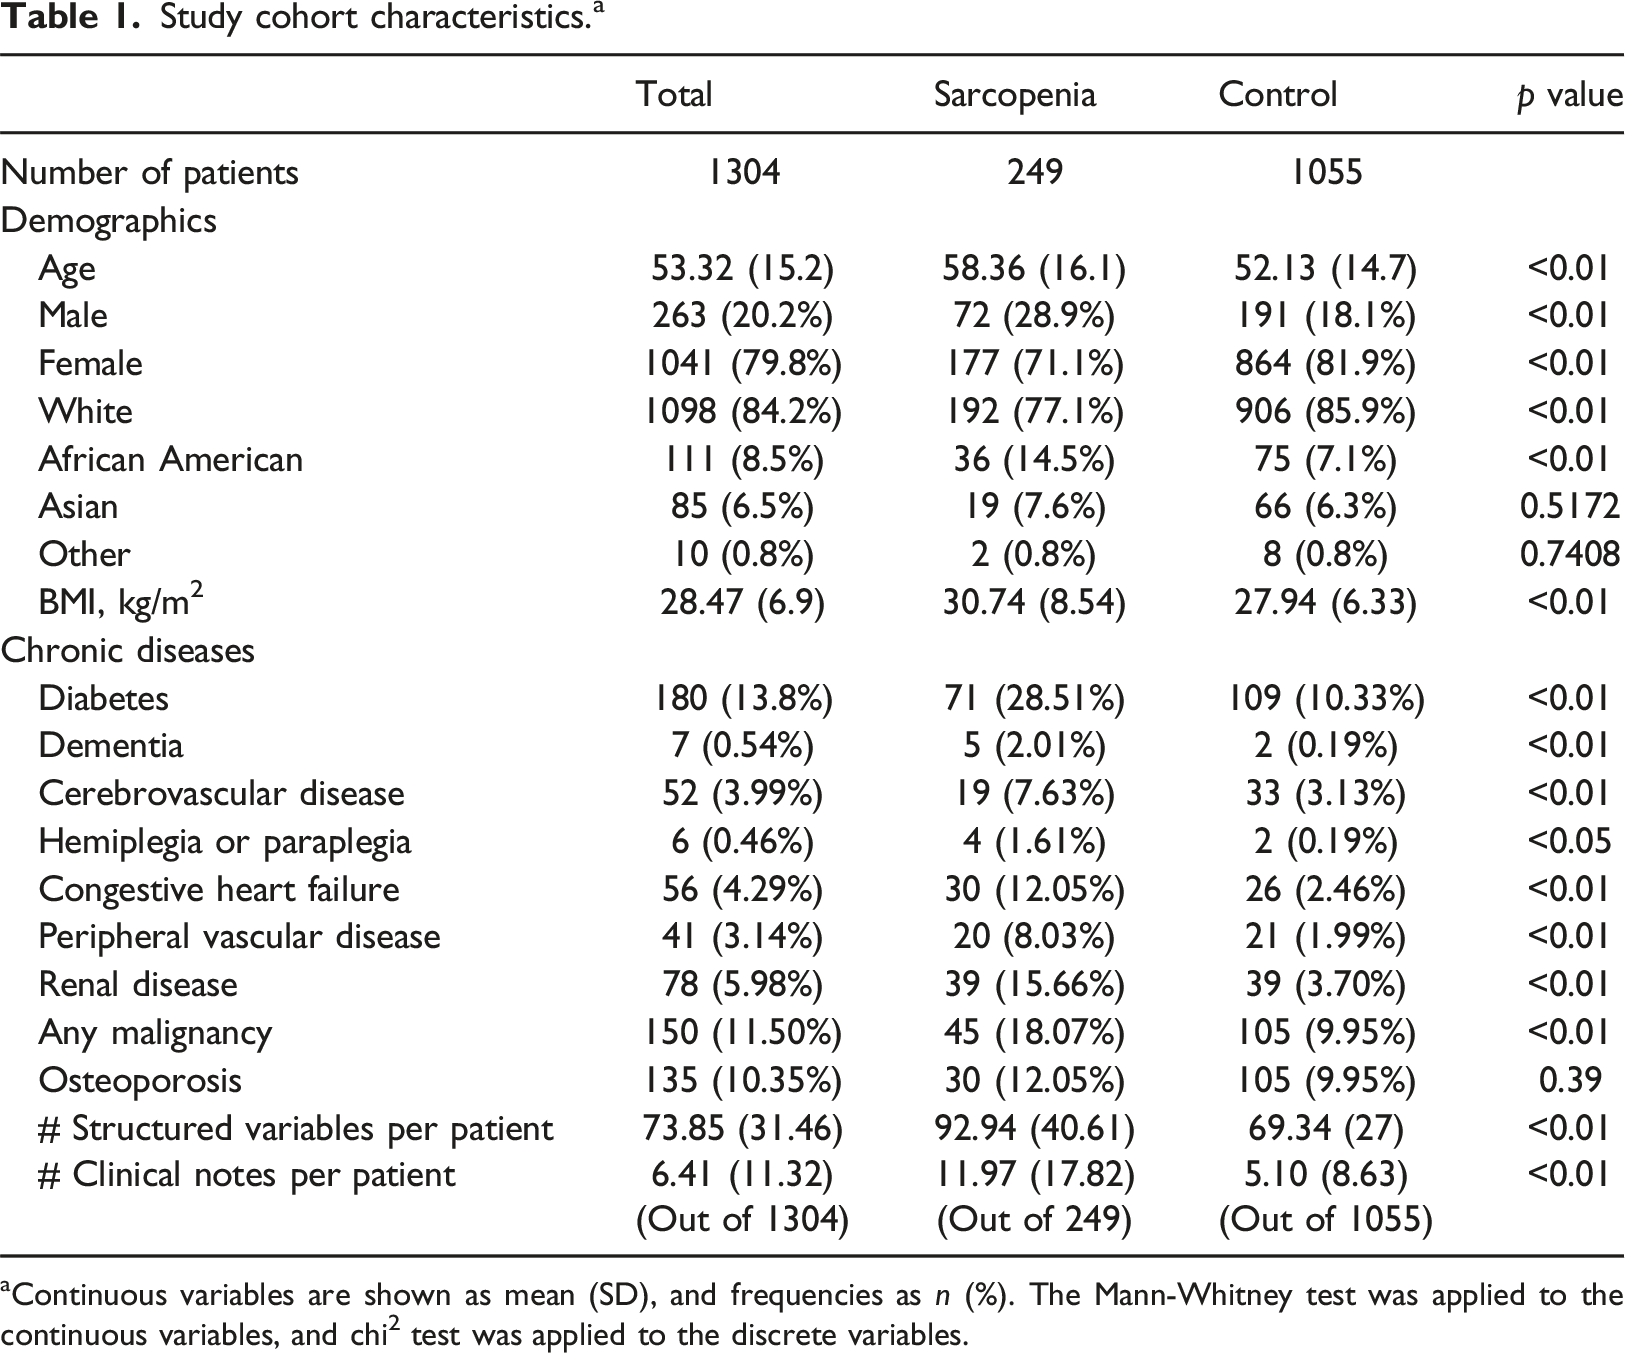
aContinuous variables are shown as mean (SD), and frequencies as n (%). The Mann-Whitney test was applied to the continuous variables, and chi2 test was applied to the discrete variables.
Selected clinical note features
By applying the data-driven clinical note feature selection process, we first generated 252,546 word-based n-grams including 1-, 2-, and 3-g. The ANOVA F-test values were then calculated for each gram. We applied the elbow method
27
to select the top 189 n-grams (listed in Supplemental document) that have the highest F-test values. Figure 3 shows the threshold determined by the elbow method. The selected n-grams included “spine”, “bilateral leg”, “marginal osteophytes”, and “positive musculoskeletal pain”, etc. However, most n-grams were considered likely non-specific to sarcopenia, though they could impact performance on sarcopenia tests. From the top ranked 189 n-grams, experts identified five n-grams that may be more likely to indicate whether the patient tests as sarcopenia based on their knowledge and literature28–31 - “steady”, “unsteady”, “cane”, “muscle tenderness”, and “walker”. These n-grams either could be used to describe the walking behavior or needs of a patient or describe a muscle symptom that are relevant to sarcopenia. “Sarcopenia” as a term was not found in these patients’ clinical notes; hence it is not included. Elbow method to select top clinical note features.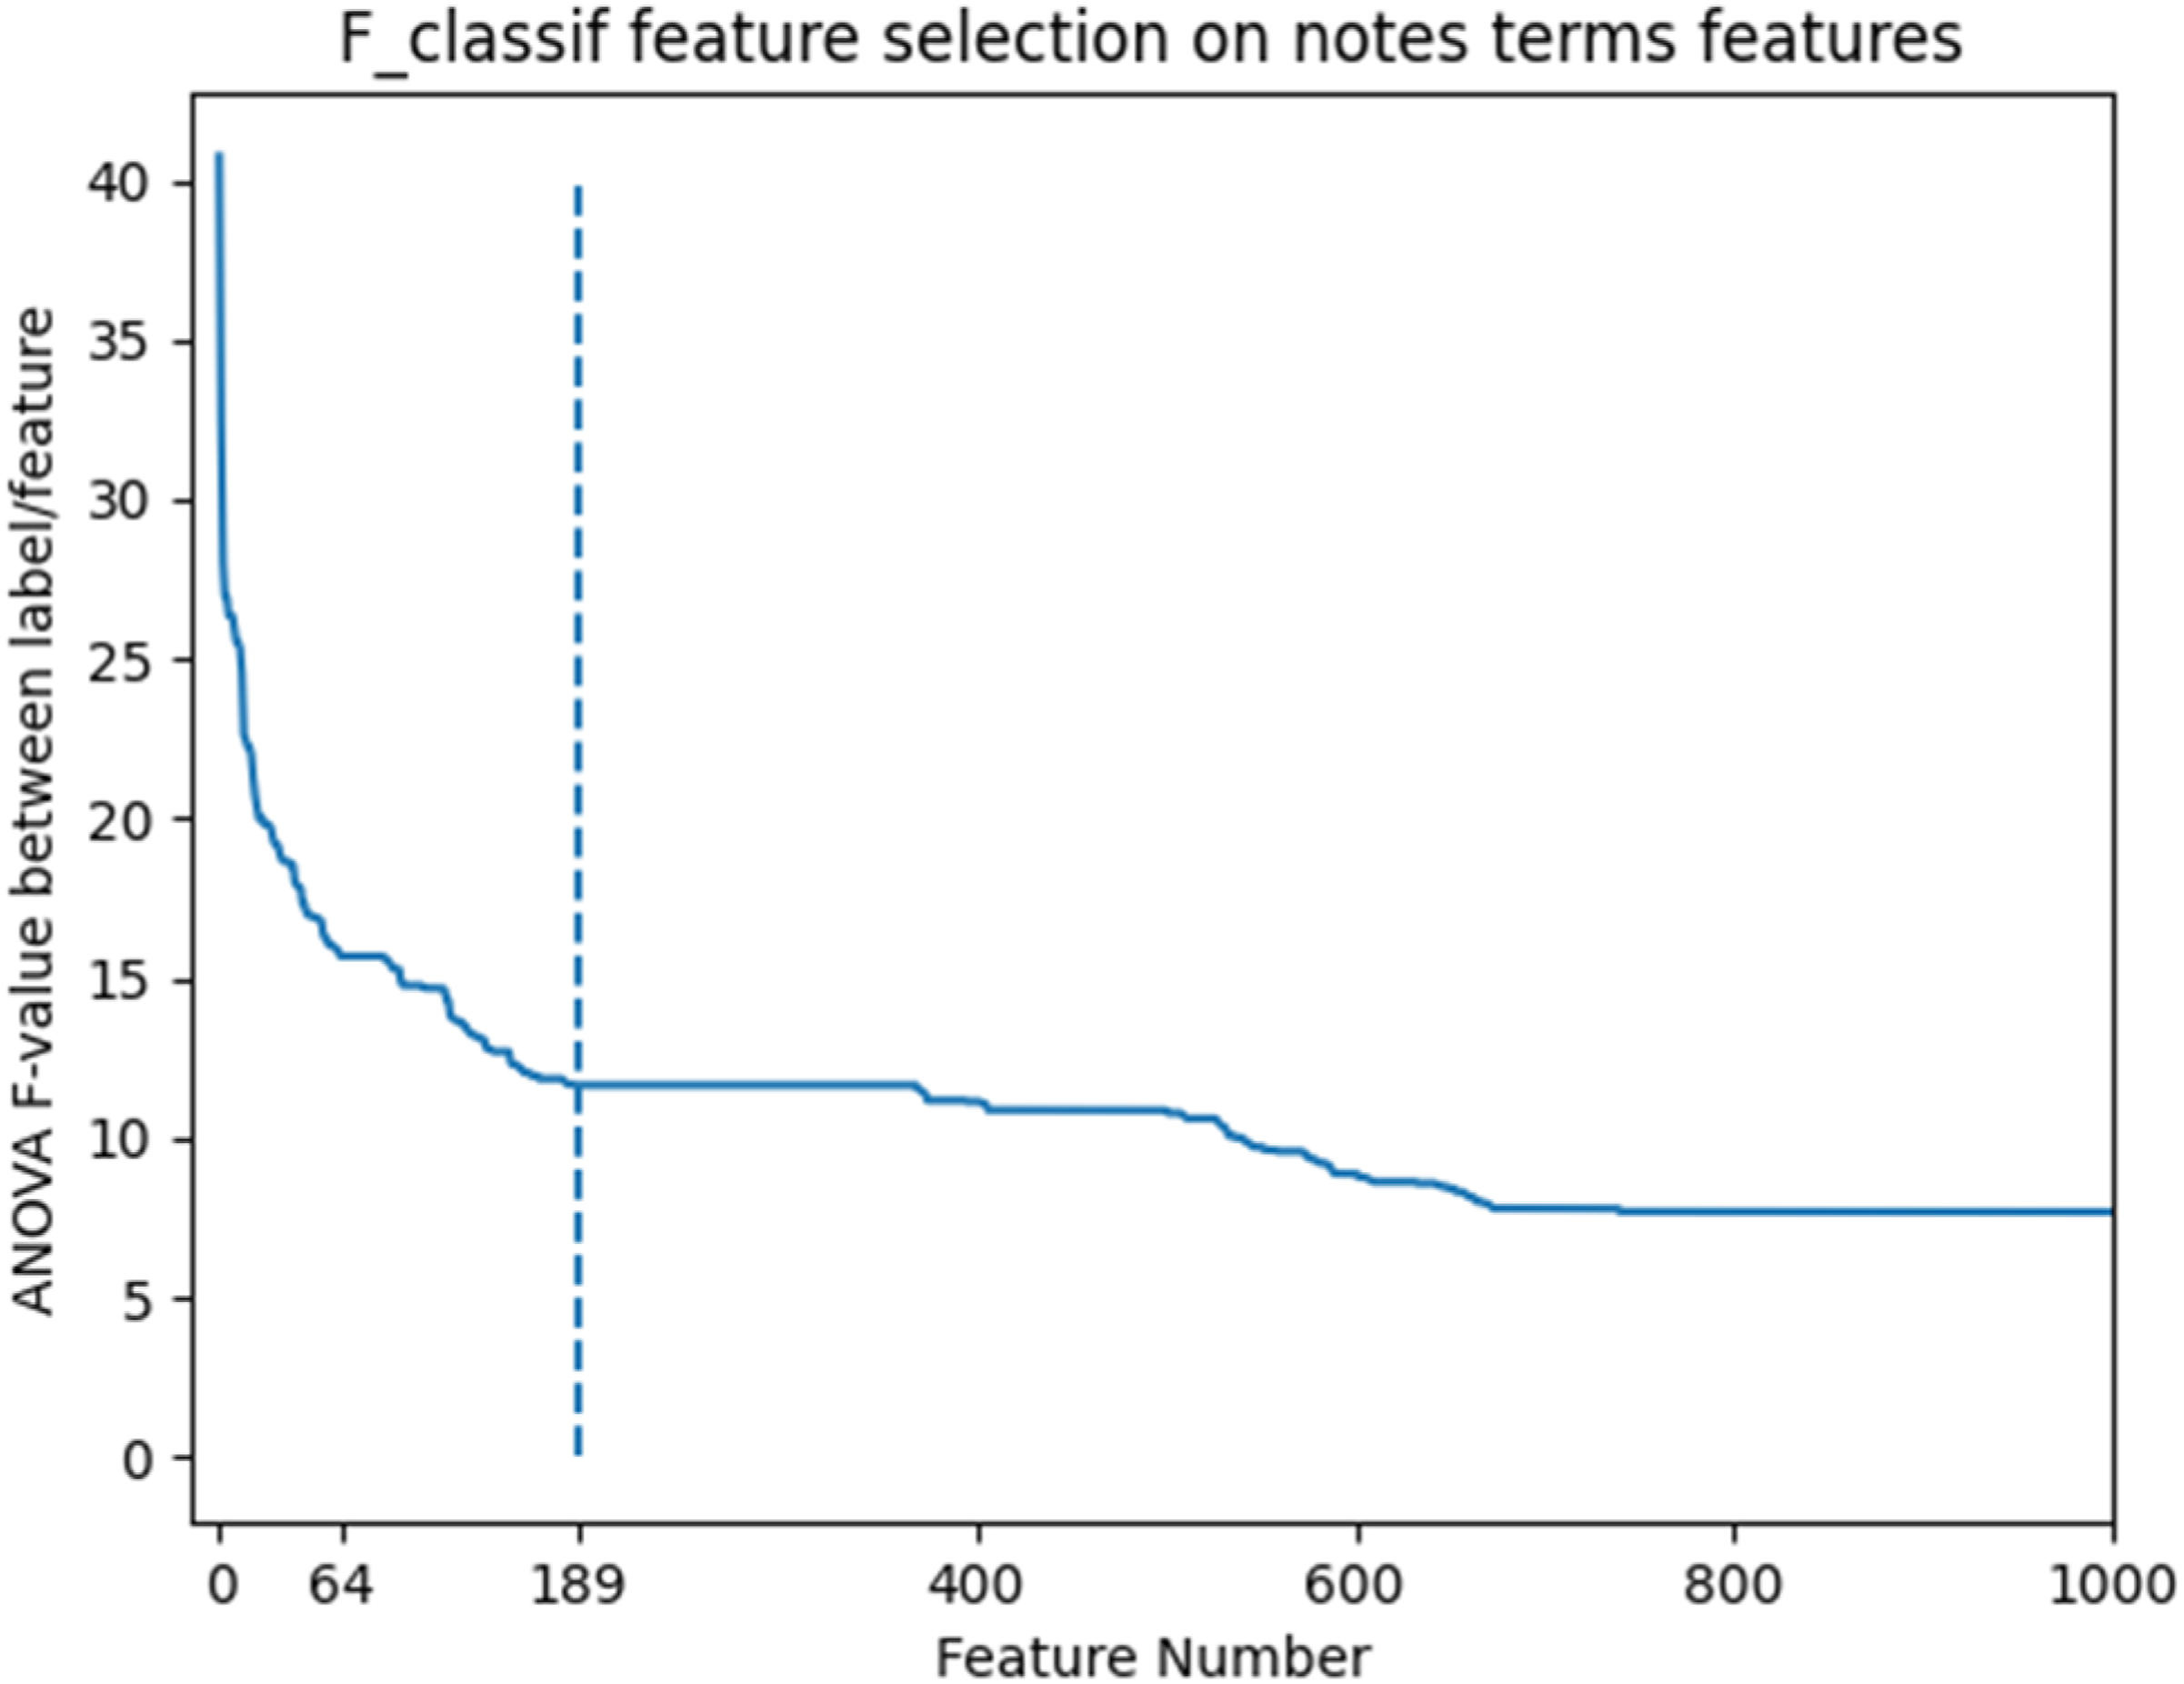
Performance evaluation and comparison
Performance comparison of AUC. a
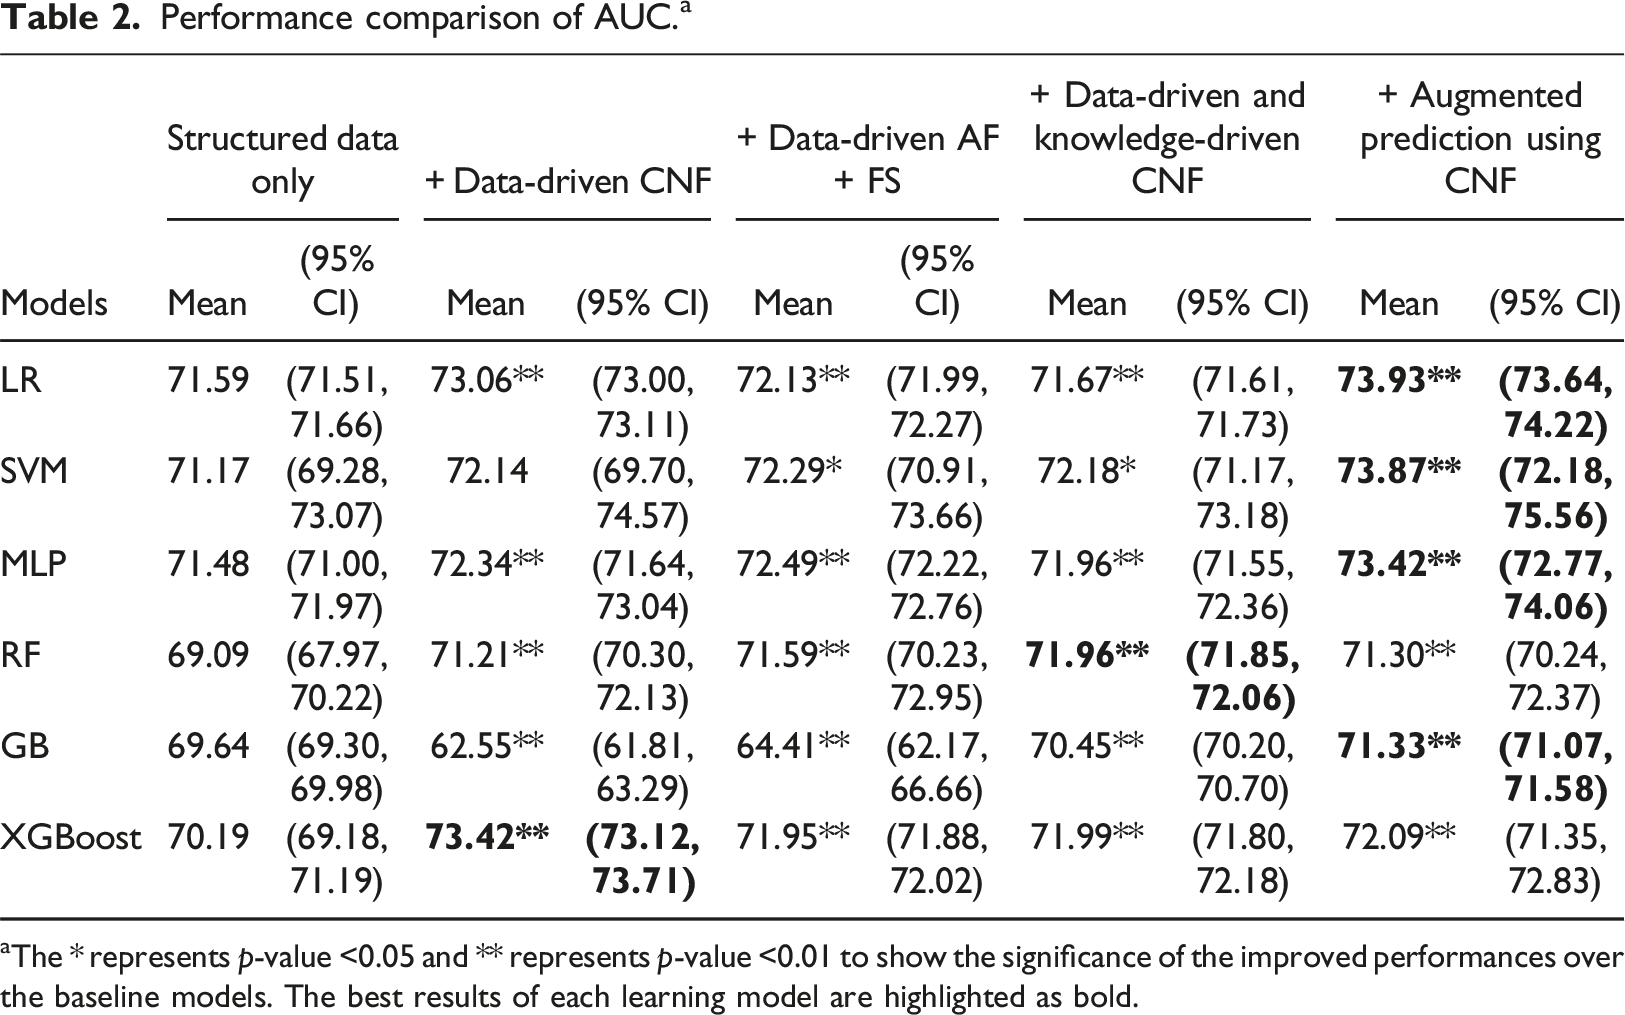
aThe * represents p-value <0.05 and ** represents p-value <0.01 to show the significance of the improved performances over the baseline models. The best results of each learning model are highlighted as bold.
Performance comparison of sensitivity. a
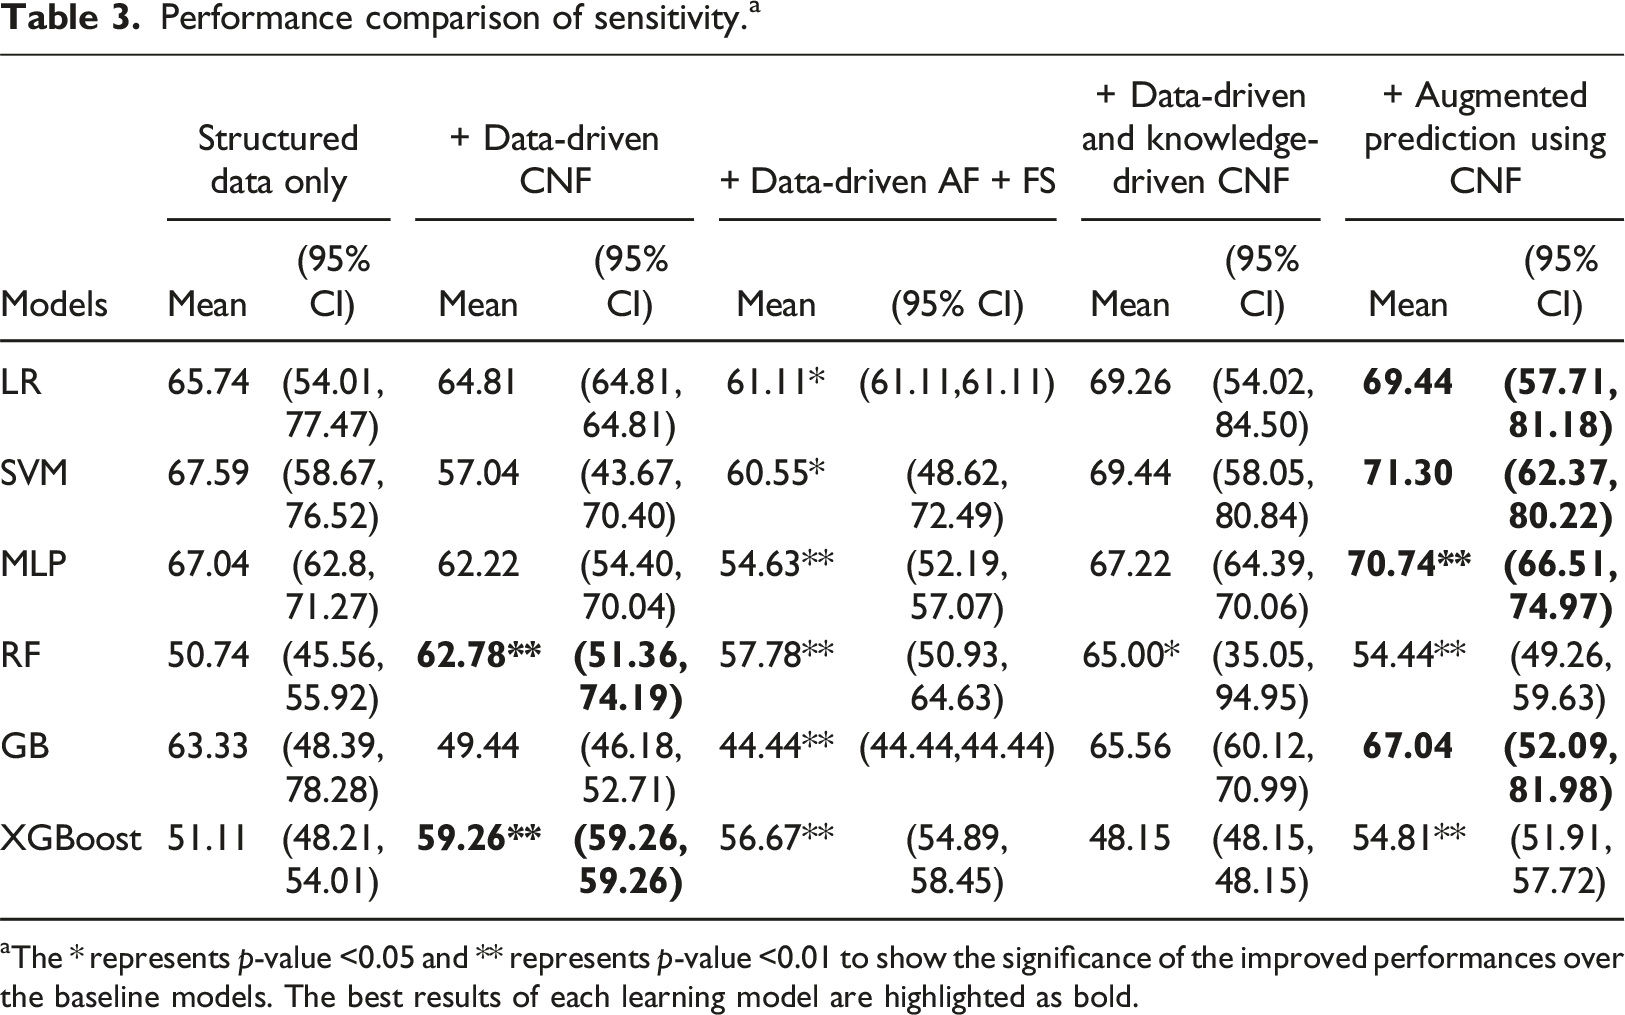
aThe * represents p-value <0.05 and ** represents p-value <0.01 to show the significance of the improved performances over the baseline models. The best results of each learning model are highlighted as bold.
Performance comparison of specificity. a
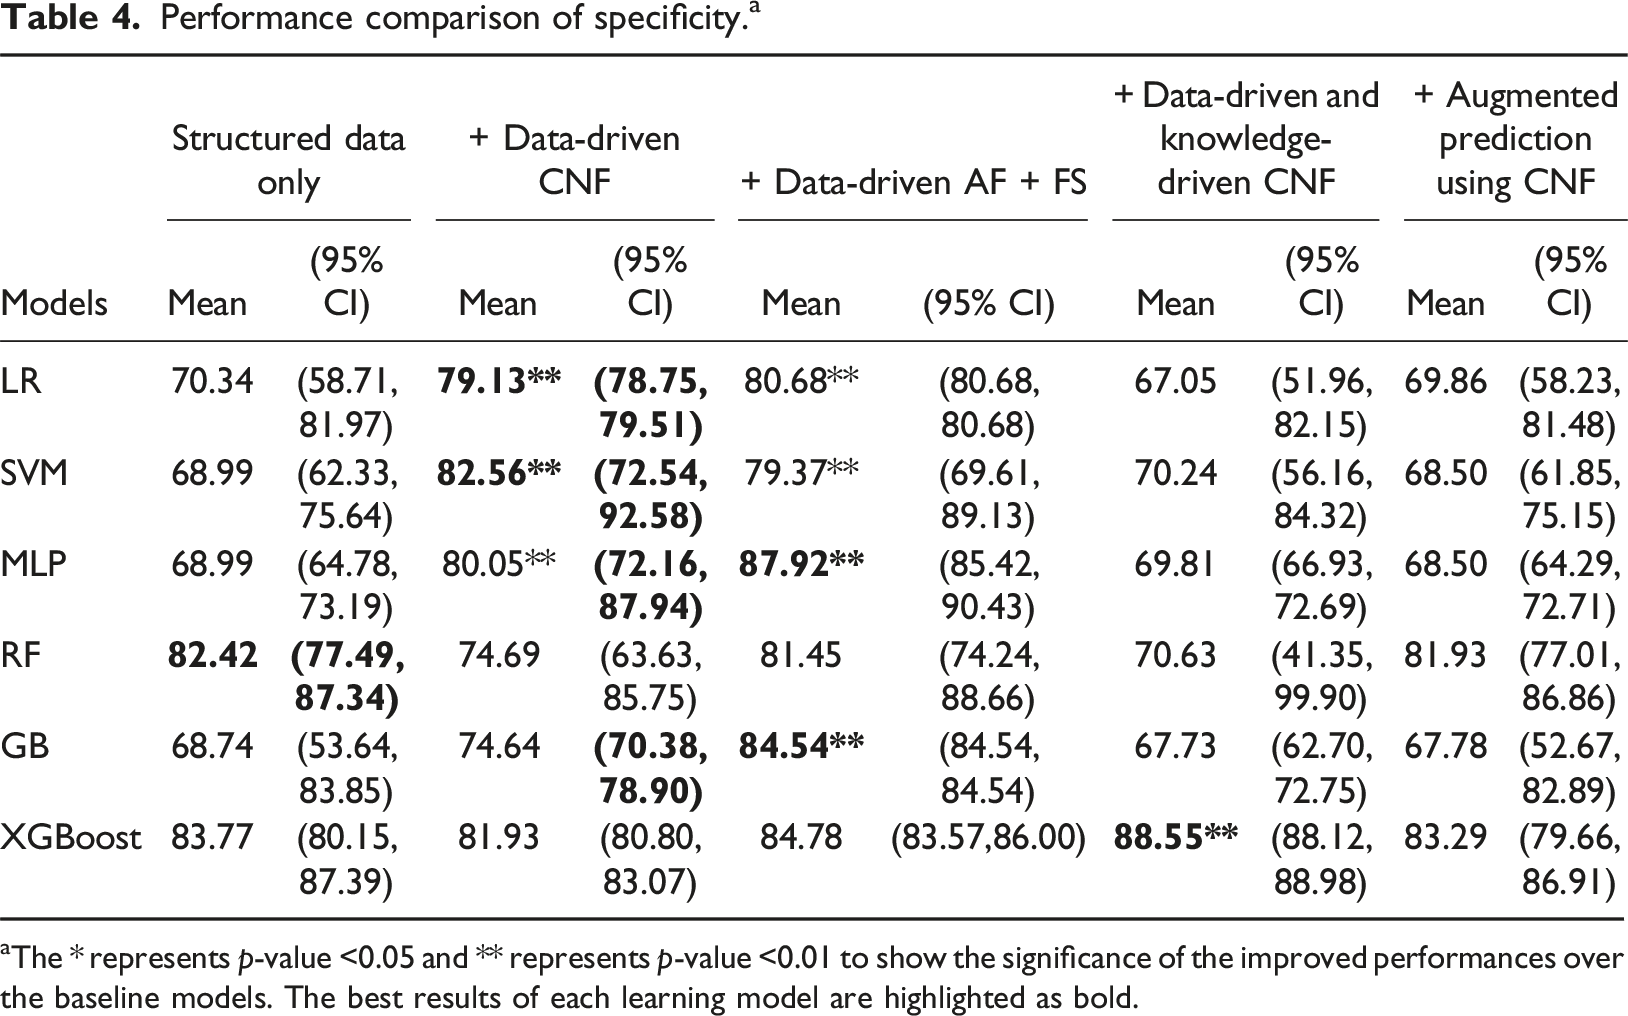
aThe * represents p-value <0.05 and ** represents p-value <0.01 to show the significance of the improved performances over the baseline models. The best results of each learning model are highlighted as bold.
The results indicate that, for every machine learning algorithm, there is at least one approach incorporating clinical note features that enhances sensitivity compared to the baseline, though for some models the sensitivity decreased, especially using the data driven CNF. For LR, SVM, MLP, and GB, the sensitivity increased 3.7% when adjusted results using CNF approach is used. For RF and XGBoost the sensitivity increased more than 8% when “+Data-driven CNF” approach is used. It is noticed that the “+Data-driven CNF” approach can significantly increase the specificities gained by LR, SVM and MLP, but sacrifice the sensitivity values. Whereas augmenting the prediction results using CNF approach can increase the sensitivities without sacrificing specificities. Hence, the “+ Augmented prediction using CNF” approach performs better overall.
Figure 4 shows the calibration slopes for the training and test datasets using the “+ Augmented prediction using CNF” approach. The best Brier scores gained on training data were 0.127 when MLP and LR were used, respectively. The best Brier score gained on test data were 0.137 and 0.139 when XGBoost and LR were used, respectively. Brier score calibration curves using the “+ augmented prediction using CNF” approach. (a) Brier score calibration curves for training dataset. (b) Brier score calibration curves for test dataset.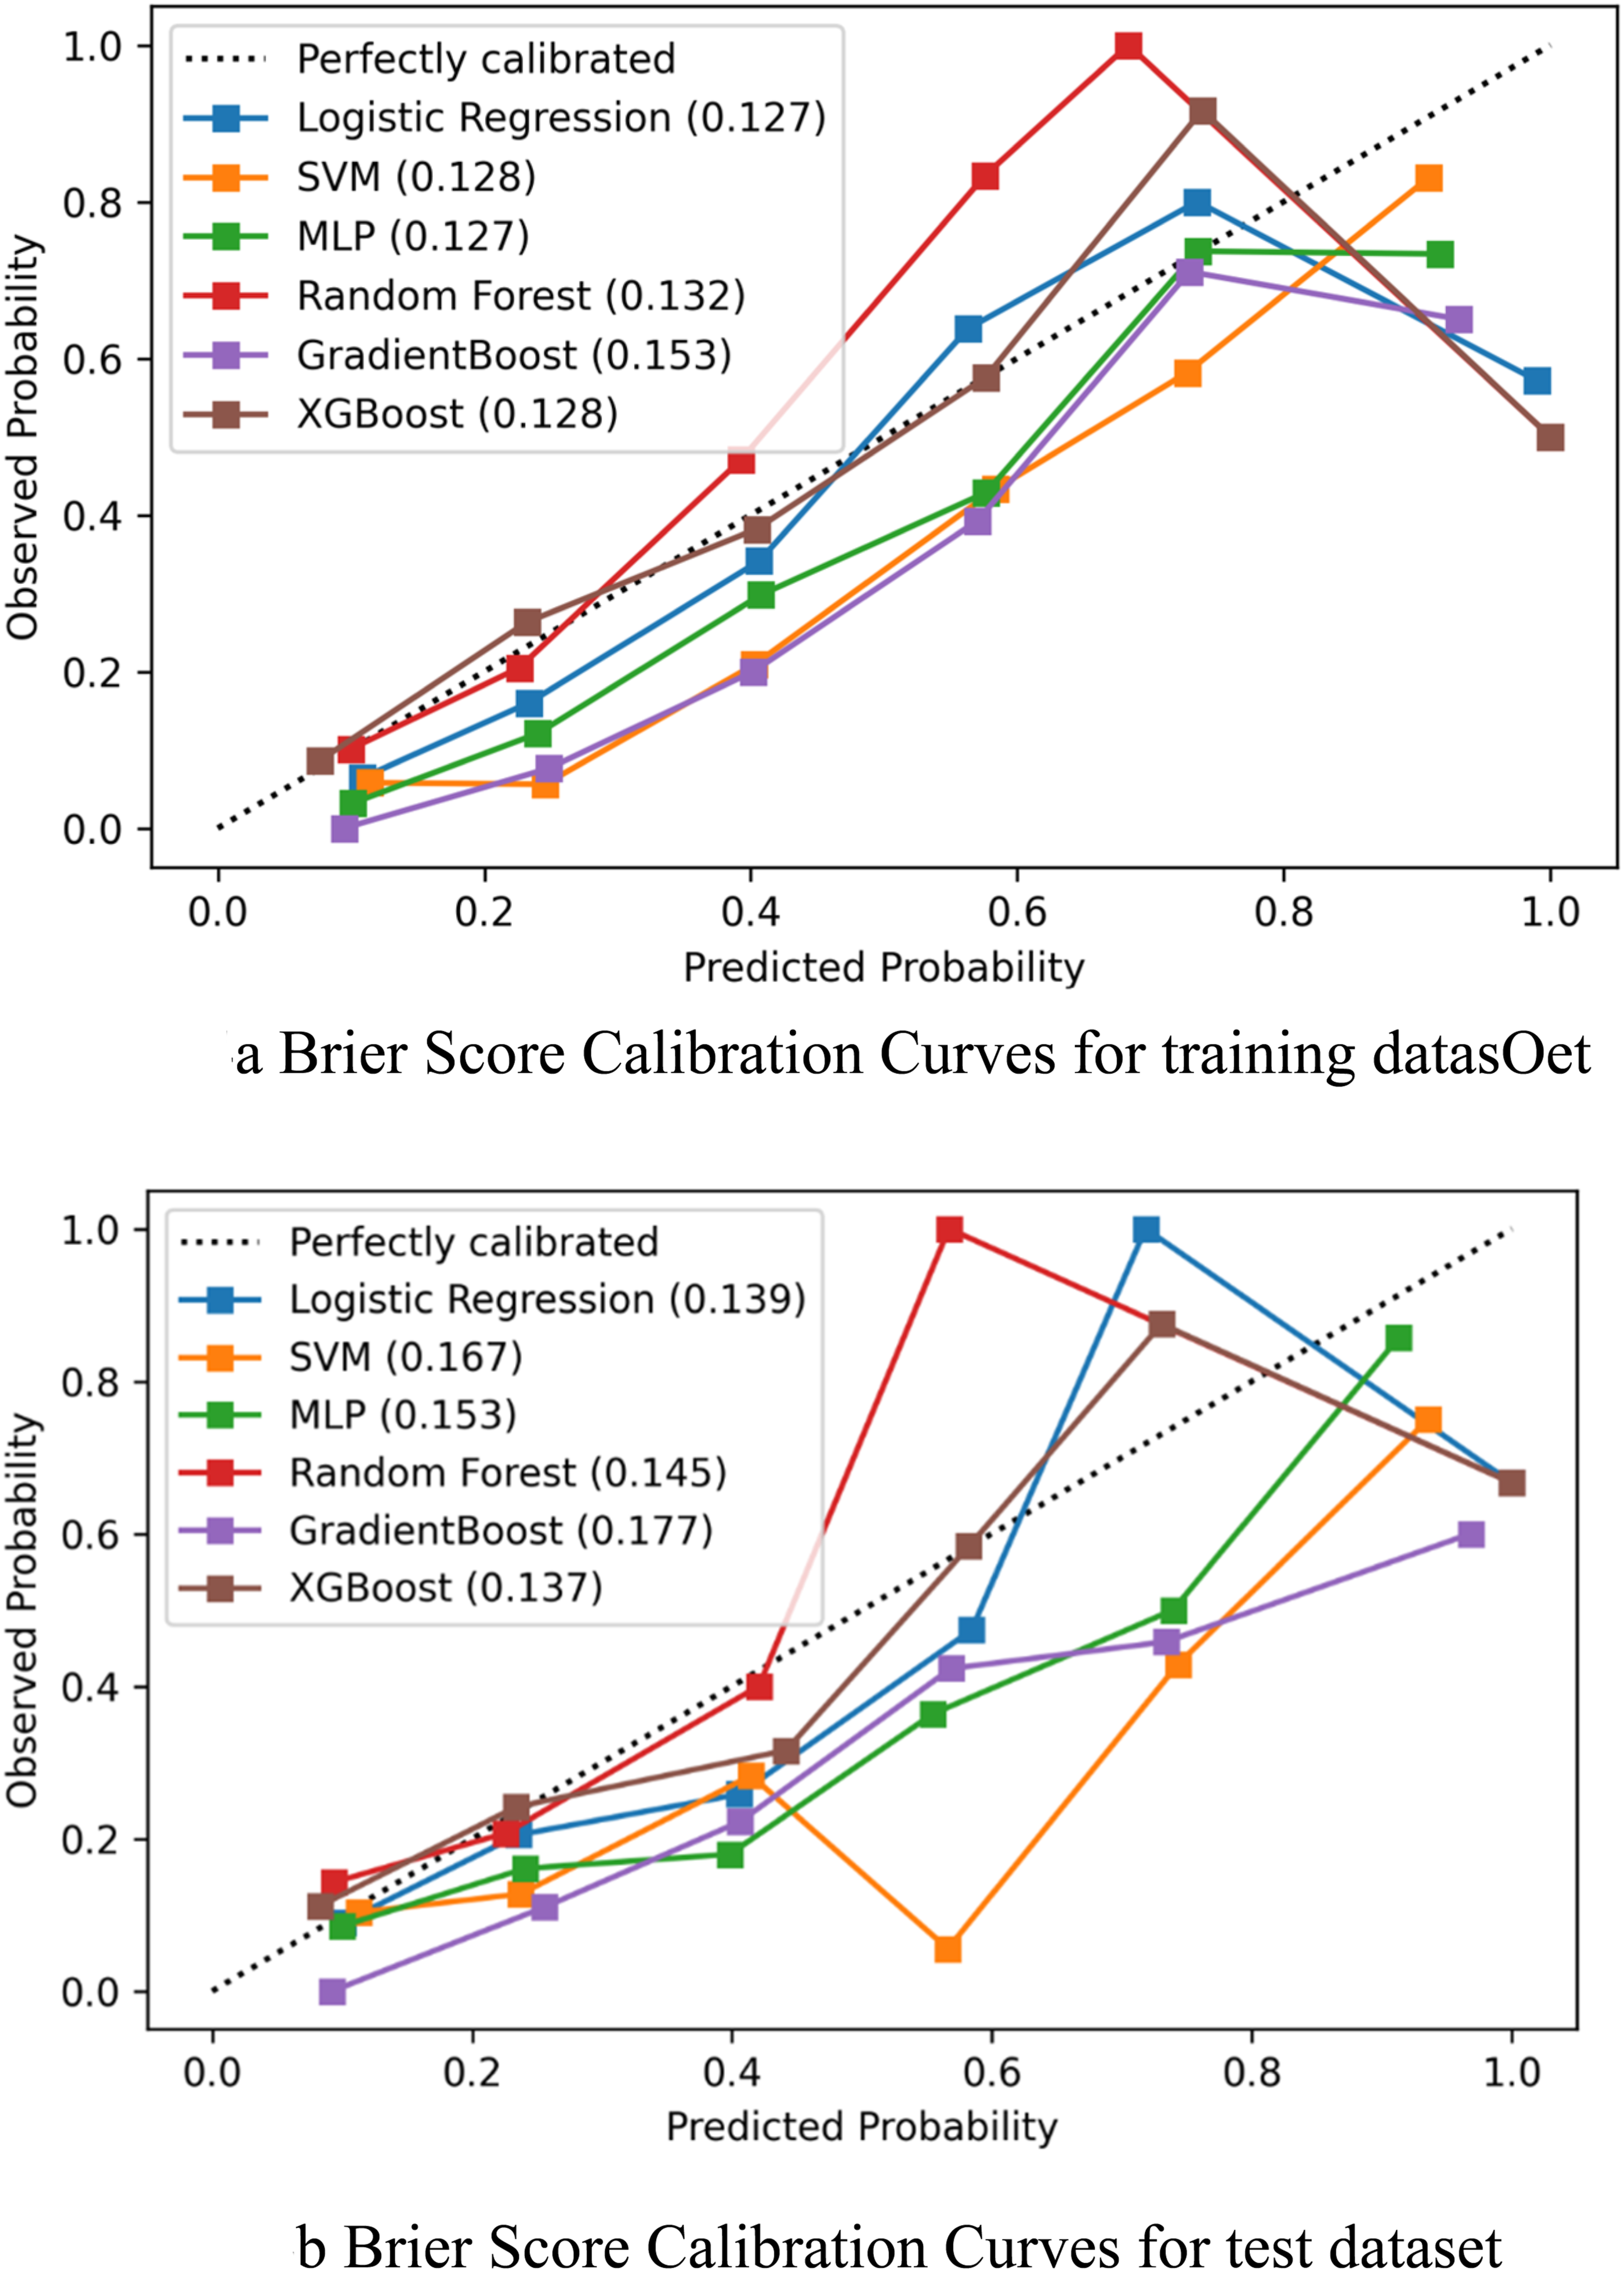
Case study
To further understand the impact of adding clinical note features in different models, we analyzed two different scenarios in this case study section. The case study is done using the local explanation capability of the Shapley Additive exPlanations (SHAP) method.
32
SHAP has been used in applying ML models for various clinical outcomes or disease prediction.33–35 The objective of SHAP is to explain the prediction
The first case (shown in Figure 5) demonstrates one patient who was a 56-year-old female and sarcopenic based on the test measurement criteria (ground truth) for sarcopenia. The waterfall plot (Figure 5(a)) shows that the diagnoses codes in category “symptoms and signs involving the nervous and musculoskeletal systems”, “slipping, tripping, stumbling and falls”, “injuries to the head” are important positive factors predicting sarcopenia. The literature
36
shows that the sympathetic nervous system affects skeletal muscle composition and influences the development of sarcopenia. Patients with sarcopenia also have a higher risk of falling, tripping and slipping,37,38 which can result in injuries to head
39
etc. Sarcopenia patients often have abnormal findings in functional studies40,41 and take medications for musculoskeletal symptoms.
42
When only structured data is used, the expected model output is lower than the actual output. Hence, the overall prediction of this case by logistic regression model is non-sarcopenic. After applying the “+Augmented prediction using CNF” approach, the prediction is changed to sarcopenic, because of the presence of two relevant clinical note features “cane” and “unsteady” in the clinical notes. The snippet of the clinical note is shown in Figure 5(b). Case study 1. (a) SHAP Waterfall plots for Case 1. (b) Clinical note snippet of Case 1.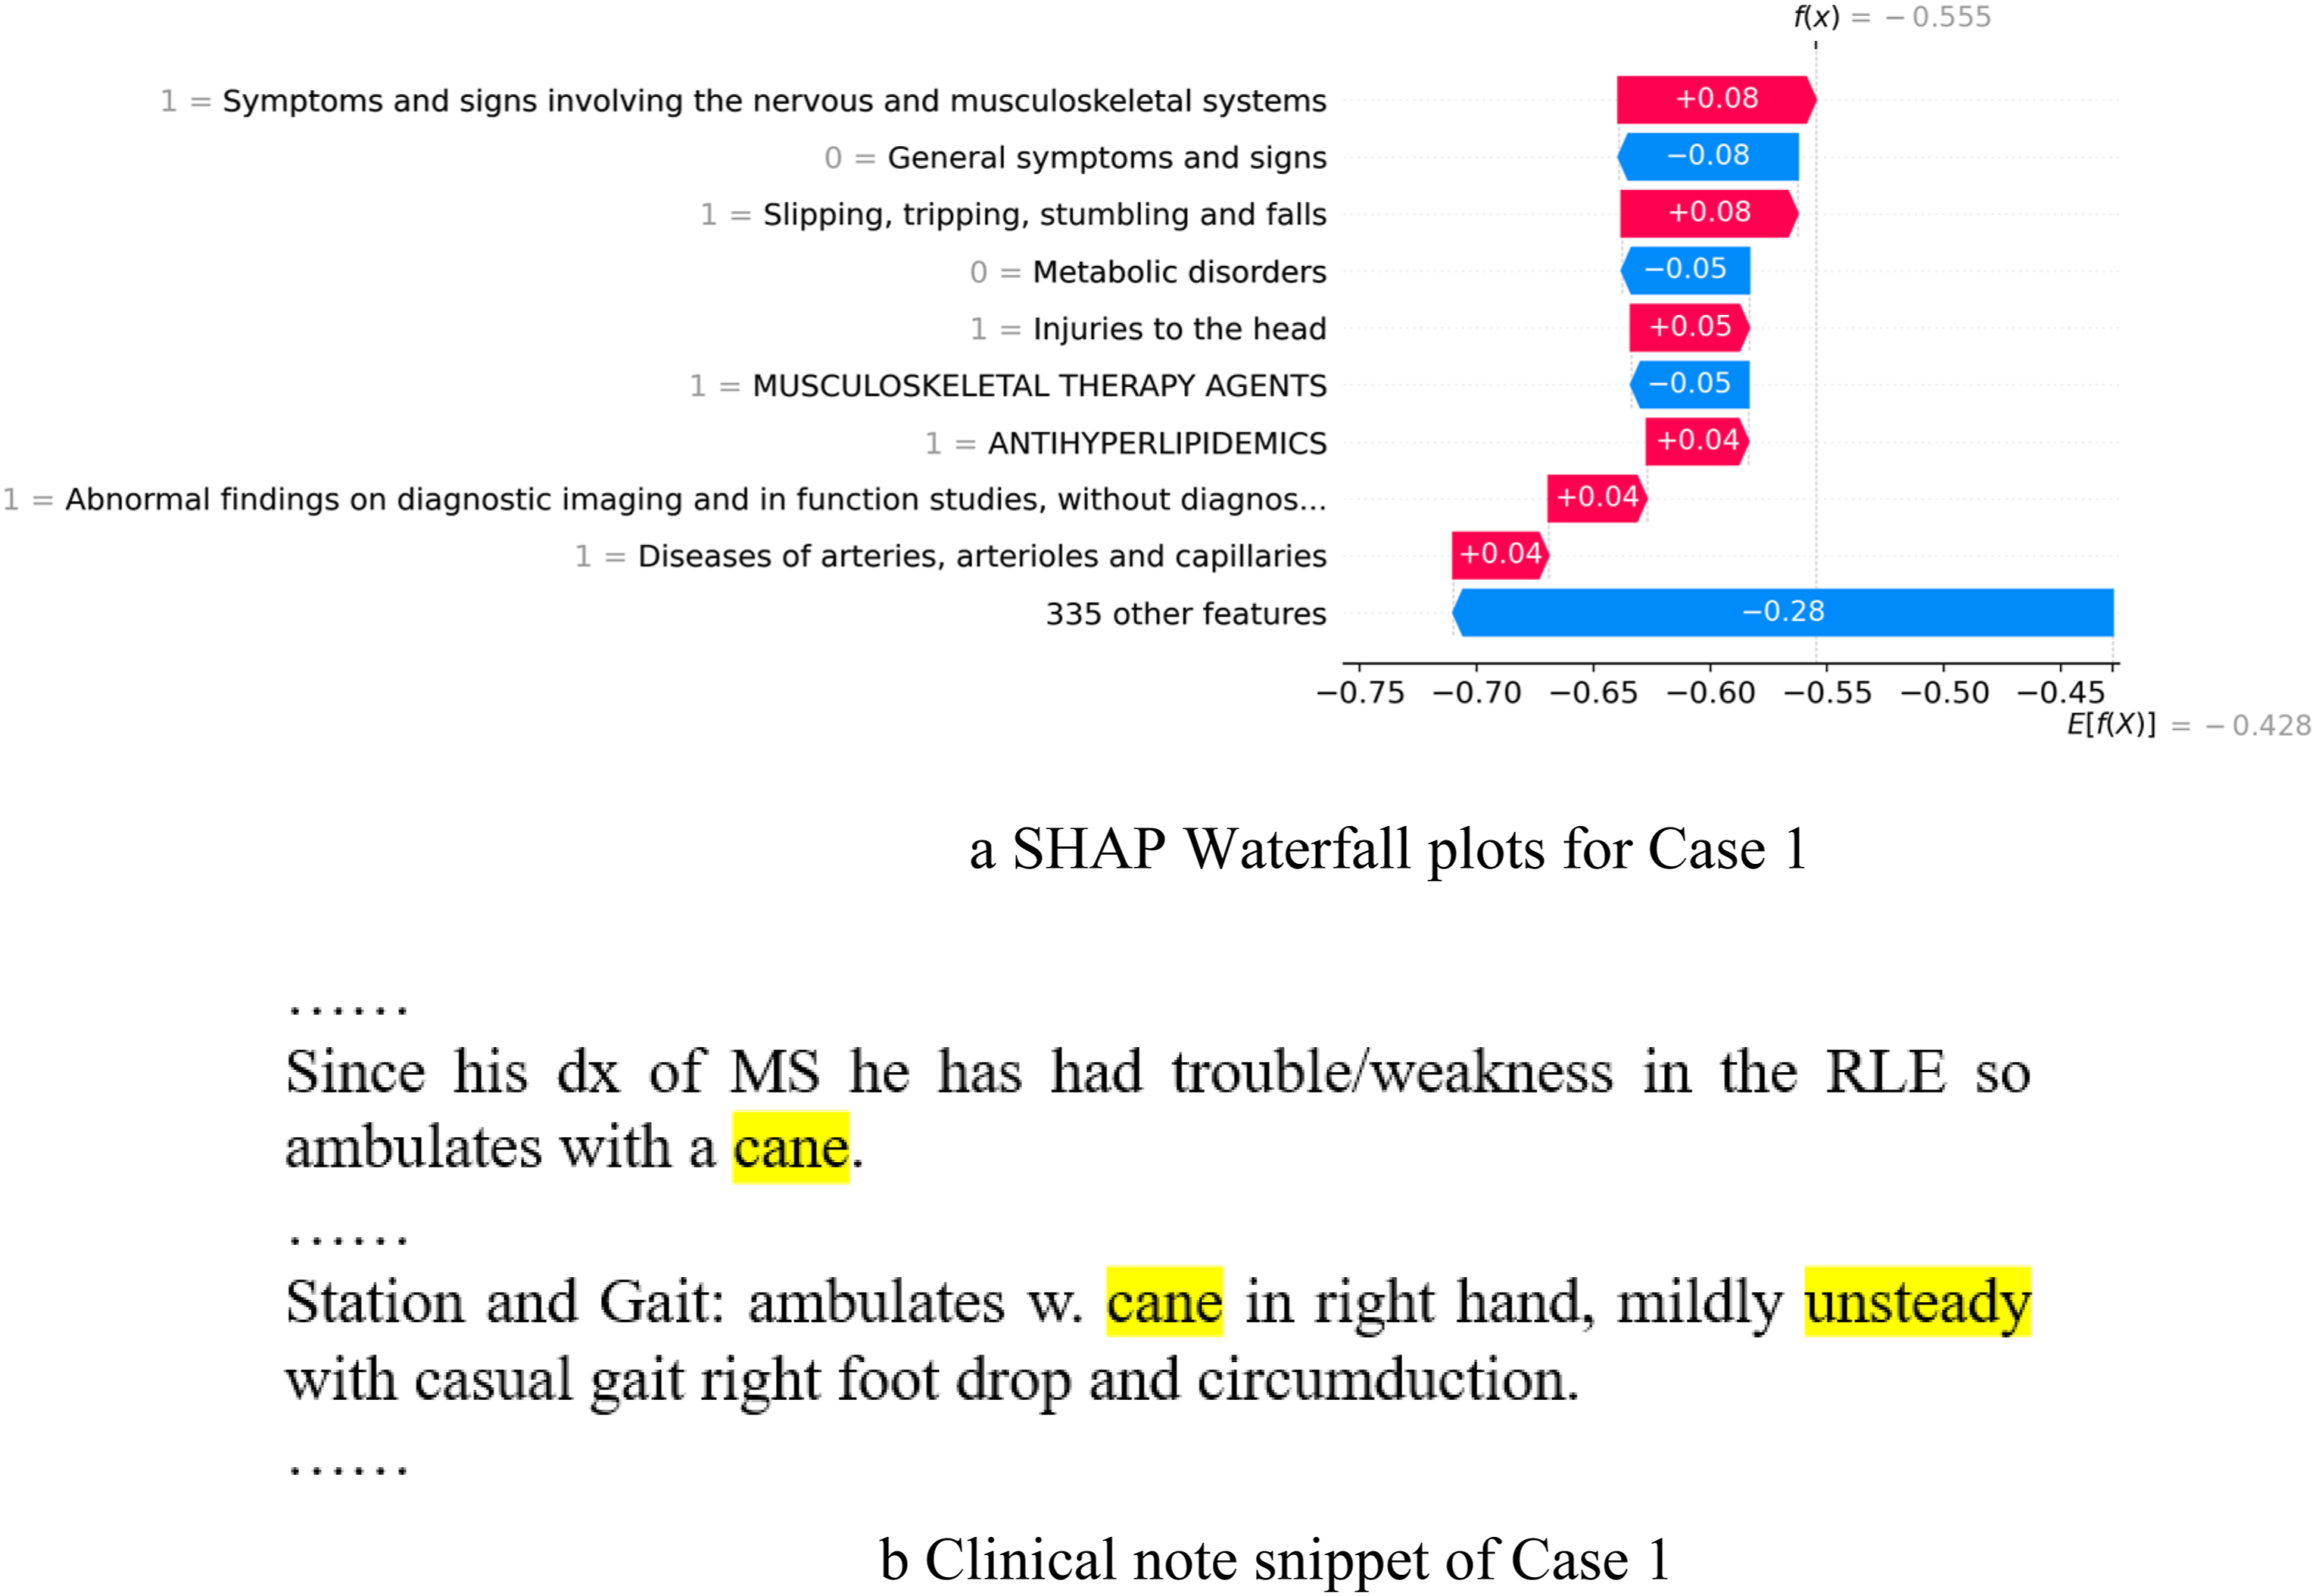
The second case (shown in Figure 6) demonstrates a patient who was who was a 75-year-old male and sarcopenic based on the test measurement criteria (ground truth) for sarcopenia. The diagnoses “diabetes mellitus”, “Overweight, obesity and other hyperalimentation”, “other forms of heart diseases”, “metabolic disorders” and “general symptoms and signs” are positive factors predicting sarcopenia. The literature shows
43
that diabetes and sarcopenia have bidirectional relations. The reduction of muscle mass is strongly associated with insulin resistance and the development of metabolic syndrome.43,44 Research45,46 also shows a high prevalence of sarcopenia among older adults with coronary heart disease or complex congenital heart disease. However, without adding the clinical note features, the random forest (RF) model predicted it as non-sarcopenic. After applying the “+data-driven and knowledge-driven CNF” approach, the case is correctly predicted as sarcopenic. The actual model output is larger than the expected output. It shows that adding the clinical note feature “walker” has a positive impact on the model. The snippet of the clinical note is shown in Figure 6(b). Case study 2. (a) SHAP Waterfall plots for Case 2. (b) Clinical note snippet of Case 2.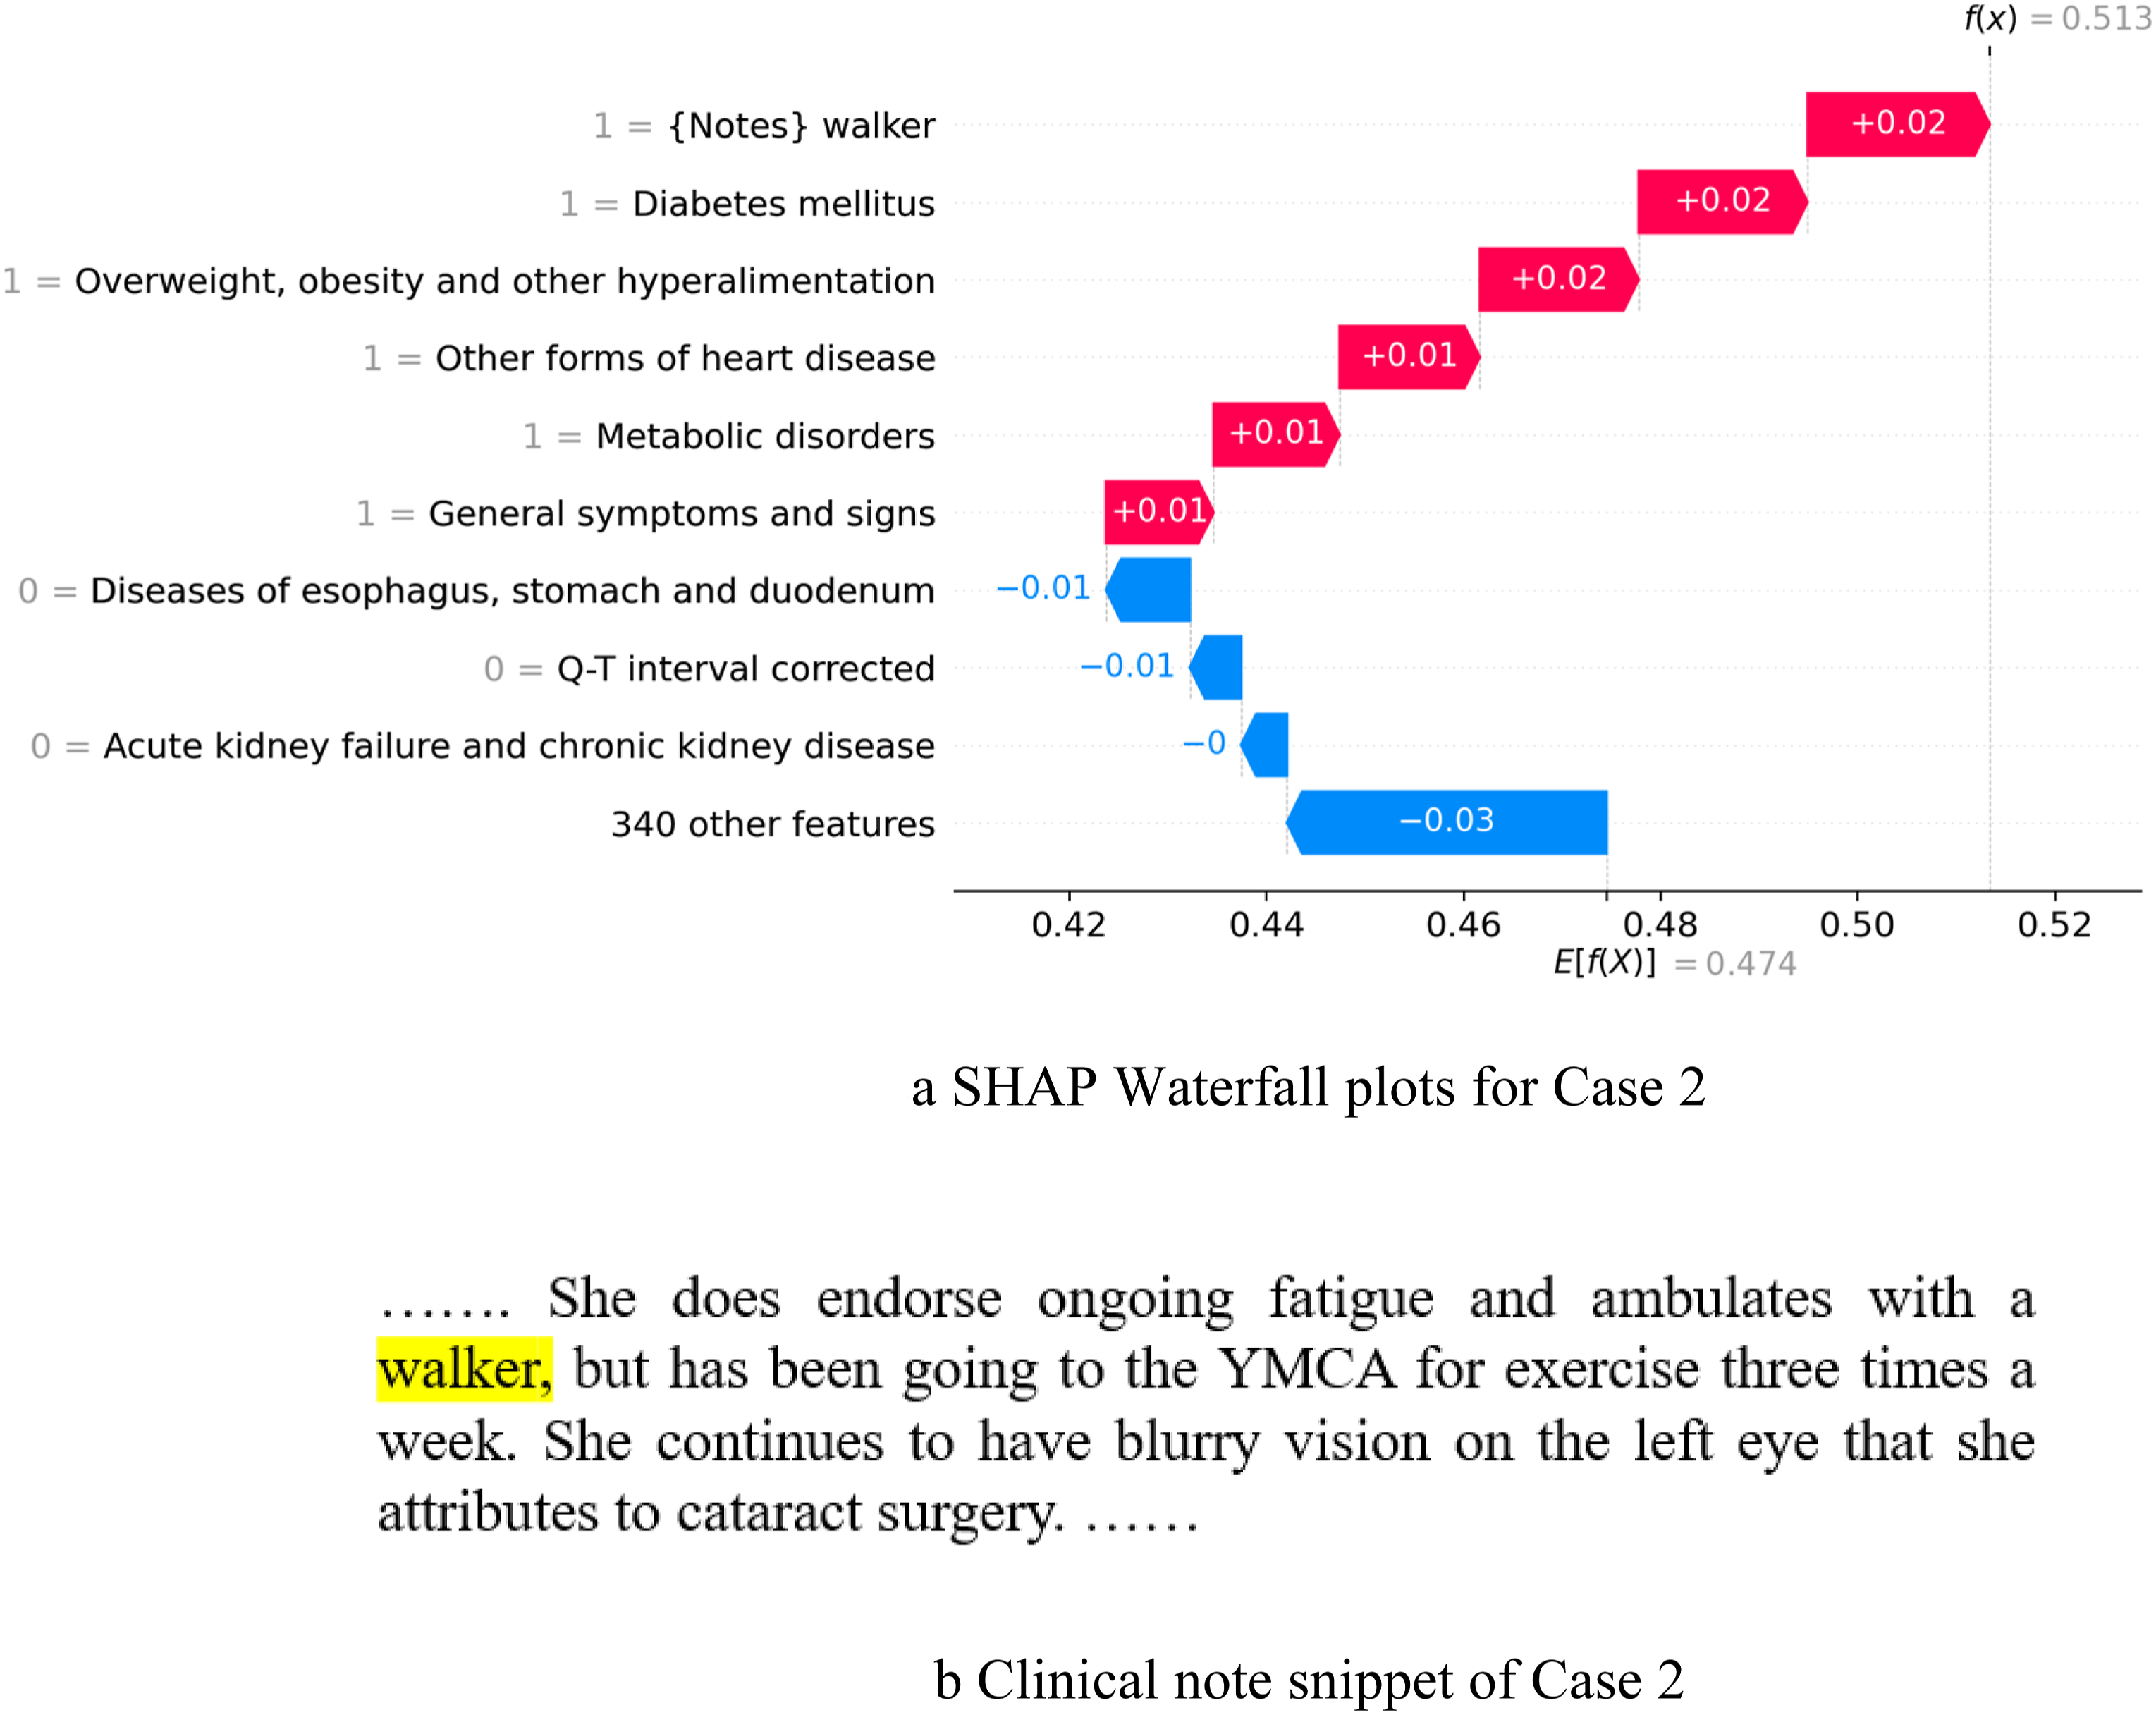
The third case (shown in Figure 7) demonstrates a patient who was a 25-year-old female and sarcopenic based on the test measurement criteria (ground truth) for sarcopenia. The diagnoses “aplastic anemias and other bone marrow failure syndromes”, and “inflammatory diseases of female pelvic organs” were positive factors predicting sarcopenia. The literature shows47,48 that sarcopenia can develop in patients with aplastic anemias and among patients who require haematopoietic cell transplantation (HSCT). However, without adding the clinical note features, the support vector machine (SVM) model predicted it as non-sarcopenic. After applying the “+Augmented prediction using CNF” approach, the case is predicted as sarcopenic. It shows that adding clinical note feature “muscle tenderness” has a positive impact on the model. The snippet of the clinical note is shown in Figure 7(b). Case study 3. (a) SHAP Waterfall plots for Case 3. (b) Clinical note snippet of Case 3.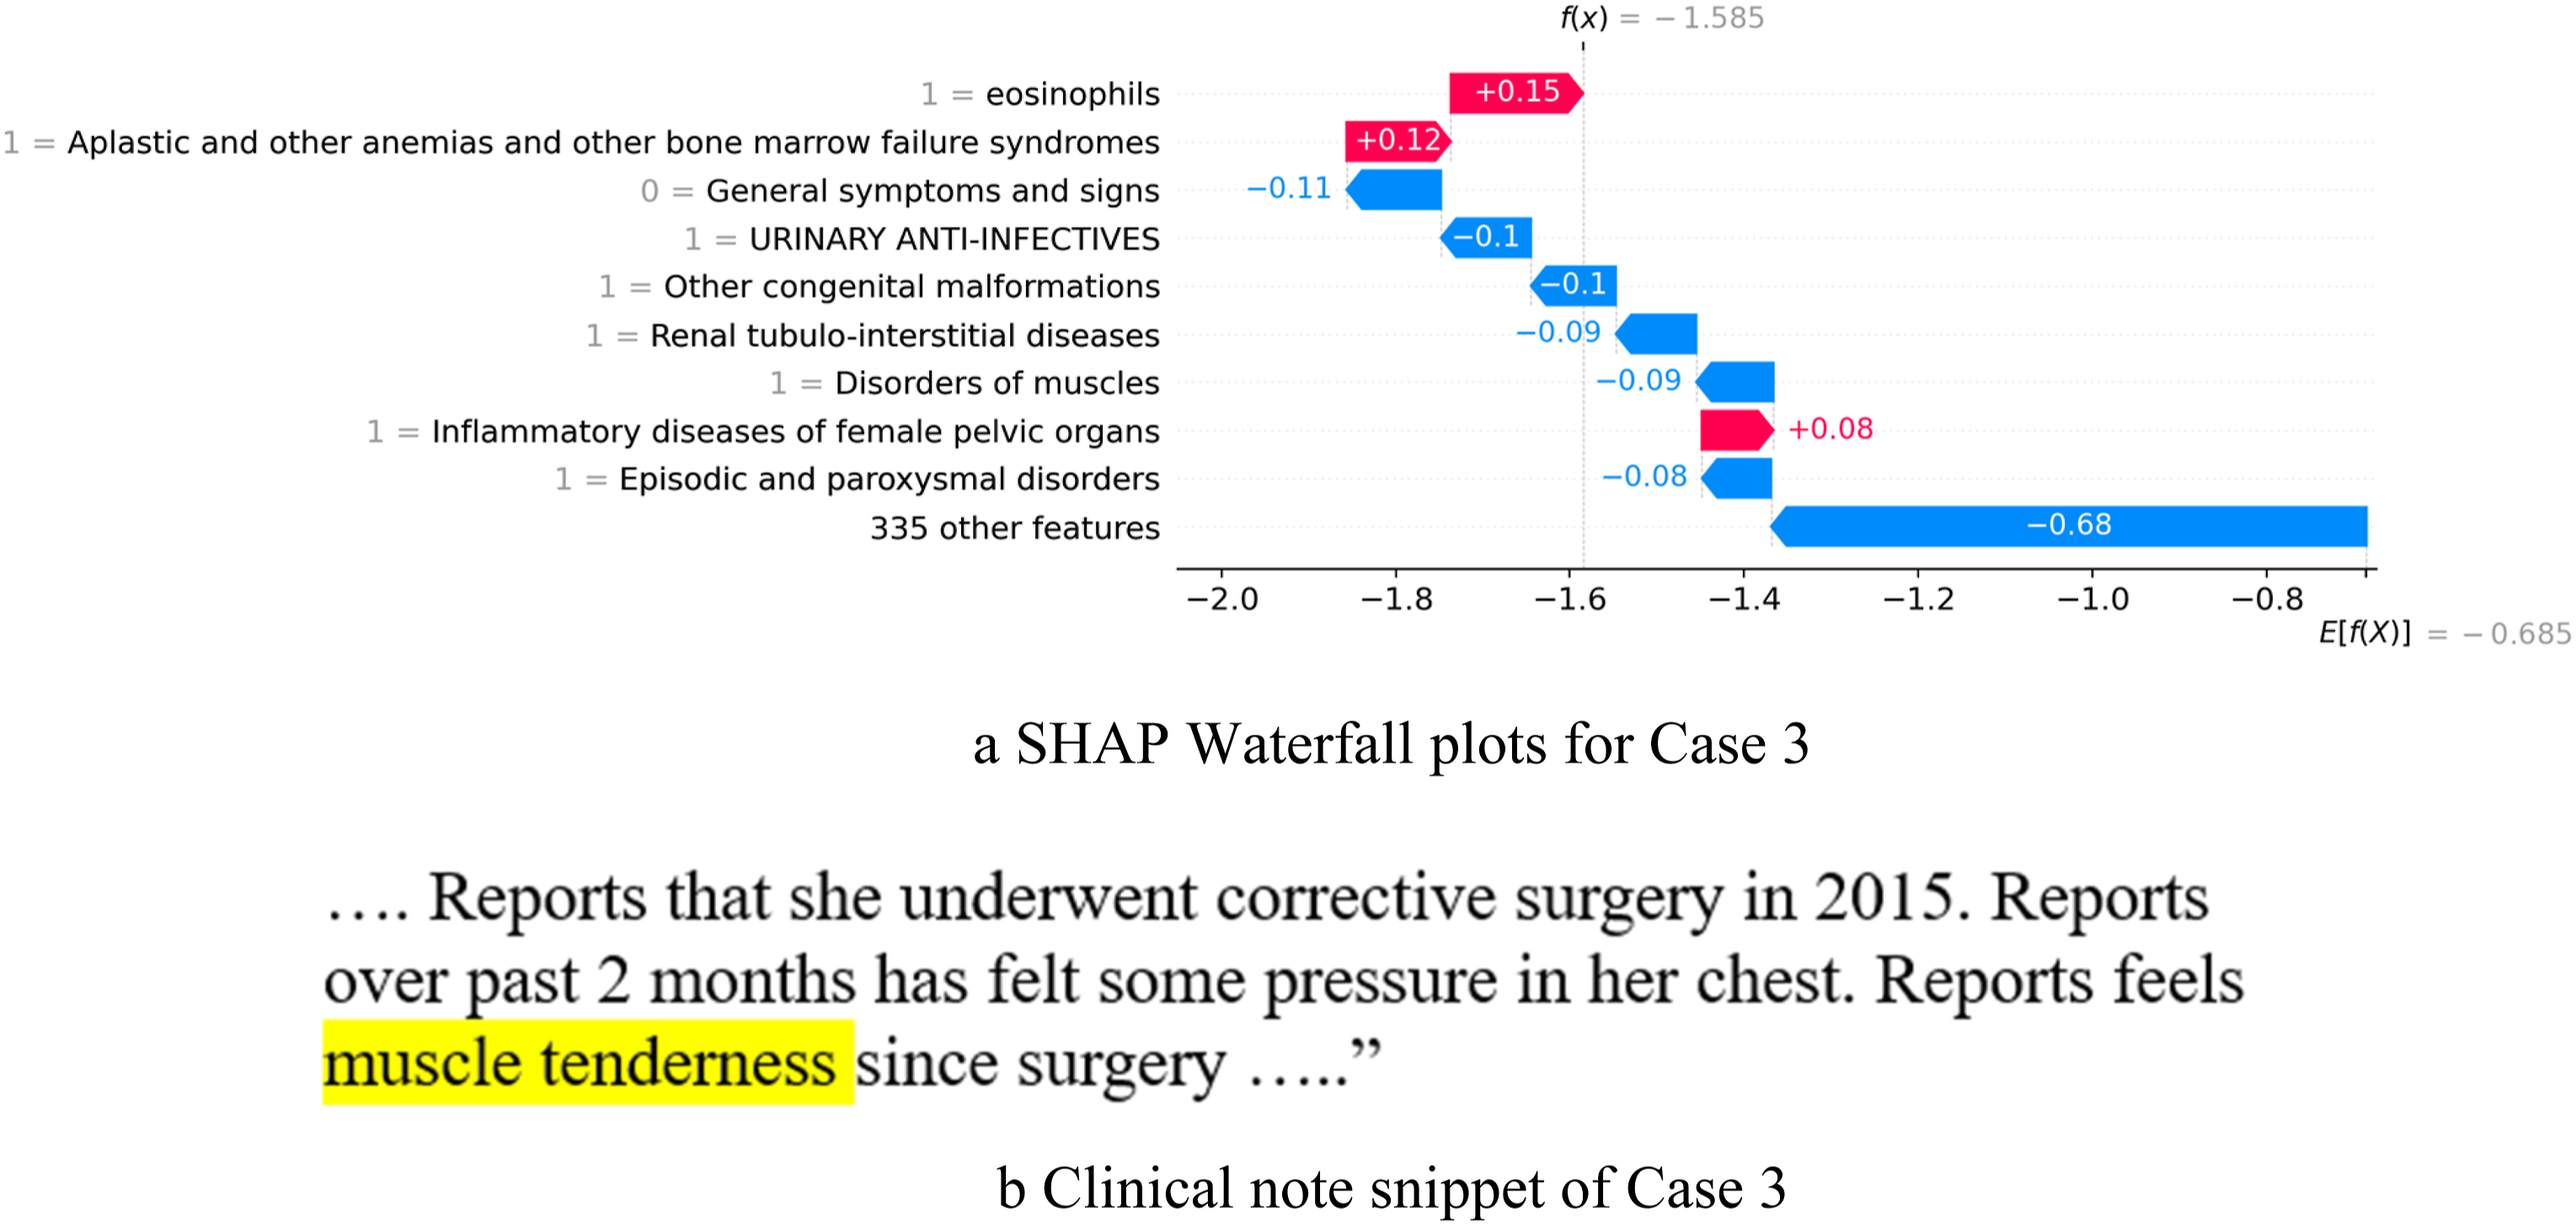
Discussion
Timely identification of sarcopenia is essential, as it enables the application of interventions to impede the advancement of the condition, enhance the quality of life for those affected, and decrease healthcare expenses. However, sarcopenia often goes undiagnosed and undocumented. Recent research shows that it is feasible to utilize specifically collected medical and muscle evaluation data,49–51 or physical activity data to detect sarcopenia. 52 Very few research studies have investigated using EHR data for sarcopenia detection, so physicians can efficiently identify patients at risk. Most existing approaches52,53 for predicting sarcopenia rely on data from the National Health and Nutrition Examination Survey (NHANES), which includes a broader range of patients and prospectively collected specific additional data not typically available in the EHR. Some of these approaches show better performances in terms of AUC (0.831) than ours (0.739), but likely reflect the different data sources. Our research lays a foundation for clinical decision support components which could be implemented within the EHR by utilizing the EHR data itself as a predictor. We previously demonstrated that using structured EHR data machine learning models can be built to identify predictors for sarcopenia. However, information written in the clinical notes can provide important indicators of early sarcopenia that might not rise to the level of detection through diagnosis codes or other diagnostic evaluations. In this study, we built on our prior machine learning work using structured data and we evaluated the impact of different approaches to integrate the clinical note features with the structured data from the EHR to improve the detection of sarcopenia prediction using various machine learning approaches. The performances show that when machine learning models are used with the “+Augmented prediction using CNF” approach, some model can significantly improve the sensitivity without reducing the specificity of sarcopenia detection over the baseline models that had only used structured data. When “+Data-driven CNF” approach is used, the specificity improves with a drop in sensitivity. The case studies also show that adding clinical notes can also enhance the interpretation of the models by linking the information written in the clinical notes with the structured data. We envision in the future creating a clinical decision support component using the “+Augmented Prediction Using CNF” approach on a large patient cohort, making it generalizable within the EHR system. This method allows human experts to validate system-ranked clinical note features before integrating them into predictive analysis. Additionally, incorporating SHAP visualization can enhance the model’s clinical utility by providing a case-based visualization tool.
Extracting disease relevant features from a large number of clinical notes can be challenging, especially when many different note features may be important to a disease. In the current research we developed a natural language processing (NLP) pipeline to first identify the sentences or chunks of clinical notes that might contain information that falls into a set of semantic types, such as ‘Activity’, and ‘Sign or Symptom’ etc., using UMLS MetaMap, 26 then we extracted n-grams and ranked them using feature selection strategy. Although the data-driven CNF approach improved the performances over the baseline approach, the extracted features might not all be supported by literature or might need further investigation. For example, the features “degenerative disc disease”, “lost balance”, “edema”, etc. have shown positive impact on sarcopenia detection in the data driven models, resulting in their inclusion as features in the data-driven CNF approaches. However, these features, and others that may predict sarcopenia, are not conceptually specific to sarcopenia, and may occur in clinical notes due to transient conditions or as the result of other conditions. These features might be study cohort dependent and might not be generalizable to a larger population. However, the knowledge driven features “cane”, “walker” etc., are interpretable by experts as being likely to explain performance on sarcopenia tests, and thus be relevant to patients who might have sarcopenia. Hence, it is necessary to combine data-driven and knowledge-driven approaches in clinical research. Human experts can contribute to selection at the feature validation stage to enhance the model’s generalizability and mitigate biases introduced by the data sources and enhance the interpretability of the ML models. It is worth noting that to avoid individual human biases, two or more human experts are needed to select and finalize the features to be included in the knowledge-driven approach.
It is worth noting that not all the clinical notes of a patient contain information that is relevant to the disease. For example, diagnostic imaging reports often do not have any description of the patients’ walking or activity behavior description that might be relevant to sarcopenia. While radiologic imaging may be useful to quantitate muscle size or other muscle characteristics, clinical imaging reports (usually done for other purposes) did not usually contain such information to characterize sarcopenia. Hence, including clinical reports that contain relevant information is crucial. On the other hand, physician notes may often not record all possible sarcopenia relevant information in order for the system to integrate this information for analysis.
Limitations of the study
Our research objective was to demonstrate the performances of the ML models on sarcopenia detection using EHR with and without text from clinical notes. We recognize the limitations of this study which include the following. The study cohort is not very large, although it includes various age groups and patients with different co-morbidities. Hence, further validation needs to be done to investigate which approach can be generalized to a larger population. The traditional NLP method is designed to process the clinical notes to identify candidate features. A more sophisticated NLP algorithm based on the large language models could be used to identify the candidate clinical note features in the future to possibly improve the performance of the data-driven approaches. However, there are patient privacy and legal concerns that would be raised if assessing clinical notes using external large language model platforms, as these notes can be difficult to completely de-identify. Thus, we could not apply those models to our data. Furthermore, many terms that may indicate sarcopenia (such as “muscle weakness”) are very nonspecific and many patients without sarcopenia report such a symptom to be documented in clinical notes, due to the subjectivity of the symptom, or the symptom being a focal or temporary condition associated with an illness or injury that may not reflect generalized sarcopenia or later performance on formal testing. While these participants had engaged in formal research measurements enabling the categorization as sarcopenic, they did not undergo a formal focused clinical evaluation to determine who should and should not have sarcopenia based on clinical history, symptoms, or other assessments in their EHR. A formal epidemiology study of sarcopenia could conduct such detailed questioning enabling identification of other predictors of sarcopenia. However, that would not be able to reflect the current clinical problem of underdiagnosis of sarcopenia and a lack of specific features found in EHR, which our study was conducted to address. Finally, the involvement of human experts in validating the selection of clinical note features might lead to disagreements on feature determination. To resolve such conflicts, multiple human experts are necessary, which could add to their workload. However, we believe that human-in-the-loop AI will be essential in the future to validate AI outputs and continually improve AI systems.
Conclusion
The current research investigated four different approaches to integrate features extracted from the narrative clinical notes with the structured data in the EHR for sarcopenia detection. The results show that using data-driven and knowledge-driven approaches together can improve performance and avoid biases that can be introduced by the data-driven approach. Future studies are needed to assess larger cohorts incorporating validated sarcopenia patients with detailed EHR data availability to enable a generalizable model to be evaluated in real-world clinical settings. The proposal framework can be applied to diseases like sarcopenia that need early detection by including key factors written in the narrative clinical notes.
Summary table
• It is crucial to combine both the structured data with the unstructured data from the Electronic Health Records for clinical decision support and disease detection. • We investigated various approaches to integrate the clinical text notes into models for sarcopenia detection. • We evaluated and developed a model to integrate the data-driven and knowledge-driven approaches to incorporate text data. • Further research needs to be done on larger cohorts and to evaluate the feasibility of developing a clinical decision support component for the EHR.
Supplemental Material
Supplemental Material - Integrating data-driven and knowledge-driven approaches to analyze clinical notes with structured data for sarcopenia detection
Supplemental Material for Integrating data-driven and knowledge-driven approaches to analyze clinical notes with structured data for sarcopenia detection by Xiao Luo, Haoran Ding, Stuart J Warden, Ranjani N Moorthi and Erik A Imel in Health Informatics Journal.
Footnotes
Declaration of conflicting interests
The author(s) declared no potential conflicts of interest with respect to the research, authorship, and/or publication of this article.
Funding
The author(s) disclosed receipt of the following financial support for the research, authorship, and/or publication of this article: this work was supported in part by funding from the NIH by NIAMS (P30AR072581 and R01AR077273) and by NIDDK (K23DK102824) and by NCATS (UL1TR002529). The content is solely the responsibility of the authors and does not necessarily represent the official views of the National Institutes of Health. The sponsor was not involved in the study conduct or writing or approving the manuscript.
Contributorship
EAI and XL had full access to all the data in the study and took responsibility for the integrity of the data and the accuracy of the data analysis. The study was conceptualized and designed by XL, SJW, RNM, and EAI; funding was obtained by XL, RNM, and EAI. Data collection and cleaning was done by HD, SJW, RNM, EAI, and XL. Analysis was by XL, HD, RNM, and EAI. Interpretation was by XL, RNM, SJW, and EAI. The first draft was completed by XL, RNM, and EAI, and subsequent versions edited and approved by all authors.
Ethical statement
Supplemental Material
Supplemental material for this article is available online.
References
Supplementary Material
Please find the following supplemental material available below.
For Open Access articles published under a Creative Commons License, all supplemental material carries the same license as the article it is associated with.
For non-Open Access articles published, all supplemental material carries a non-exclusive license, and permission requests for re-use of supplemental material or any part of supplemental material shall be sent directly to the copyright owner as specified in the copyright notice associated with the article.