
Abstract
Introduction
The clinical use of immunotherapy has brought a new era to cancer management, leading to durable responses in patients with melanoma, non-small cell lung cancer, and other malignances.1,2 In particular, immune checkpoint therapy is now the standard of care for many metastatic malignancies and increasingly in the neoadjuvant3,4 and adjuvant setting.5,6 However, a significant fraction of patients with cancer do not respond to immunotherapy.7–11 In addition, immunotherapy can be associated with potentially life-threatening toxicity, especially in the setting of combination therapy.12,13 Predictive biomarkers are therefore essential to optimize selection for patients most likely to benefit from immunotherapy while minimizing risk of toxicity. 14
PD-L1 expression is one of three currently FDA-approved biomarkers for immunotherapy, in addition to tumor mutation burden and mismatch repair status. 14 Direct assessment of PD-L1 expression on tumor cells and immune cells is a rational biomarker for response to anti-PD-1 and PD-L1 therapy.15,16 Multiple clinical trials of immunotherapy have demonstrated increased clinical benefit with increasing PD-L1 expression.9,17–22 As a result, PD-L1 expression is often used to determine patient eligibility for immunotherapy in clinical practice. 23
Since clinical trials represent only a small fraction of the patient population seen in clinical practice, 24 there is an increasing need for a better understanding of how PD-L1 expression relates to immunotherapy response in the real world. Real world databases such as those arising from electronic health records (EHR) contain a wealth of potential data to answer this important question, but often information such as PD-L1 status is not readily accessible in structured format, but only in textual form in clinical notes. For example, in the United States Veterans Affairs (VA) healthcare system, PD-L1 status is recorded only in clinical notes, including both oncology notes and pathology reports, and these notes’ formats are heterogenous across the VA’s nationwide EHR. In order to unlock the full potential of EHR data for generating real-world evidence for patients on receiving immune checkpoint inhibitors, it is an essential prior step to develop an accurate, repeatable, and validated process for extracting PD-L1 biomarker status from such notes.
Prior studies have developed algorithms to extract information from the EHR using natural language processing (NLP) approaches to semi-structured and unstructured clinical notes.25,26 Notes have substantial variability due to their free-form nature, including differences in language and format. NLP approaches can convert the free text of a note into a computer-interpretable representation. Prior studies have explored the process of ascertaining the cancer biomarker statuses such as epidermal growth factor receptor (EGFR) gene mutations and anaplastic lymphoma kinase (ALK) mutations from the EHR via NLP.27,28 Fewer studies have focused on PD-L1. One study automatically extracted numerous cancer biomarkers, including PD-L1, from pathology reports by mapping text to Unified Medical Language System (UMLS) Metathesaurus concepts. 29 However, this work was limited to pathology notes from a single regional system, whereas our work addresses oncology and pathology notes from a highly heterogeneous national system. Another group used a proprietary NLP tool to determine PD-L1 status from the EHR for an observational study but expressed that due to the proprietary nature of the tool they were unable to estimate the accuracy of that tool. 30
This study closes this gap in knowledge by describing the development of a machine learning-based NLP algorithm to extract PD-L1 status from clinical notes using data from the VA’s nationwide EHR database. We evaluate the performance of the resulting tool, describe its application to a large cohort of Veterans receiving immune checkpoint inhibitors, and discuss considerations in building a pipeline for downstream applications.
Methods
Data sources and preprocessing
This study is based on data from the VA Corporate Data Warehouse (CDW), which aggregates electronic health record data from VA facilities nationwide. All clinical notes matching the case-insensitive PD-L1 keyword regular expression “pd[l1-][1-]*”, were extracted from the CDW as the study’s full dataset.
Clinical notes in the full dataset were preprocessed as follows. After collapsing sequences of multiple spaces to a single space, each note was shortened into a preprocessed note consisting of snippets containing 20 characters before and 200 characters after each occurrence of the PD-L1 regular expression. Given that this expression may occur multiple times within a clinical note, a single preprocessed note may have multiple snippets. For each note, all snippets were joined together using a unique character string to demarcate the note’s snippets. The purpose of shortening each note in this way was to focus attention of both the human annotator and the NLP algorithm on only the segments of the note where a PD-L1 value could possibly be reported. The specific choice to define snippets using 20 characters before and 200 characters after each occurrence of the PD-L1 regular expression was made a priori based on informal data exploration; we observed that it was usually possible to determine the correct PD-L1 annotation with this snippet specification.
To format the clinical text into a favorable form for the software packages used in this study, several further changes to the text were performed during preprocessing. All occurrences of the “%”, “+”, “<”, and “>” characters were changed to “percent”, “positive”, “less than”, and “greater than”, respectively. Occurrences of “-” were converted to “negative”, except if occurring within the string “PD-L1” in order to facilitate tokenization.
Annotation process for model development
From the study’s full dataset, 1000 clinical notes were randomly sampled for annotation. Reviewers were grouped round-robin into four inter-annotator comparison pairings (i.e., annotators 1 and 2 were paired, as were 2 with 3, 3 with 4, and 4 with 5). Each reviewer annotated either 200 or 250 notes, with each pair of reviewers annotating 50 common notes.
Reviewers were asked to annotate PD-L1 lab. values by highlighting text within each preprocessed note. Reviewers were instructed to label all PD-L1 lab. value descriptors in each note. This included text phrases such as “<1%”, “50%”, “negative”, “positive”, “low”, and “high”. Example annotations are shown in Figure 1. Annotation was conducted using Label Studio, an open-source data labeling tool that provides a convenient interface for annotating text.
31
Examples of annotated notes. Notes are de-identified for the purposes of the figure only. (a) A clinical note with just one PD-L1 value annotated. (b) A clinical note with no PD-L1 values annotated. (c) A note with multiple snippets, each of which may or may not have an annotated PD-L1 value. (d) A note with multiple PD-L1 values within one text snippet. (e) A note with multiple PD-L1 lab values across several snippets.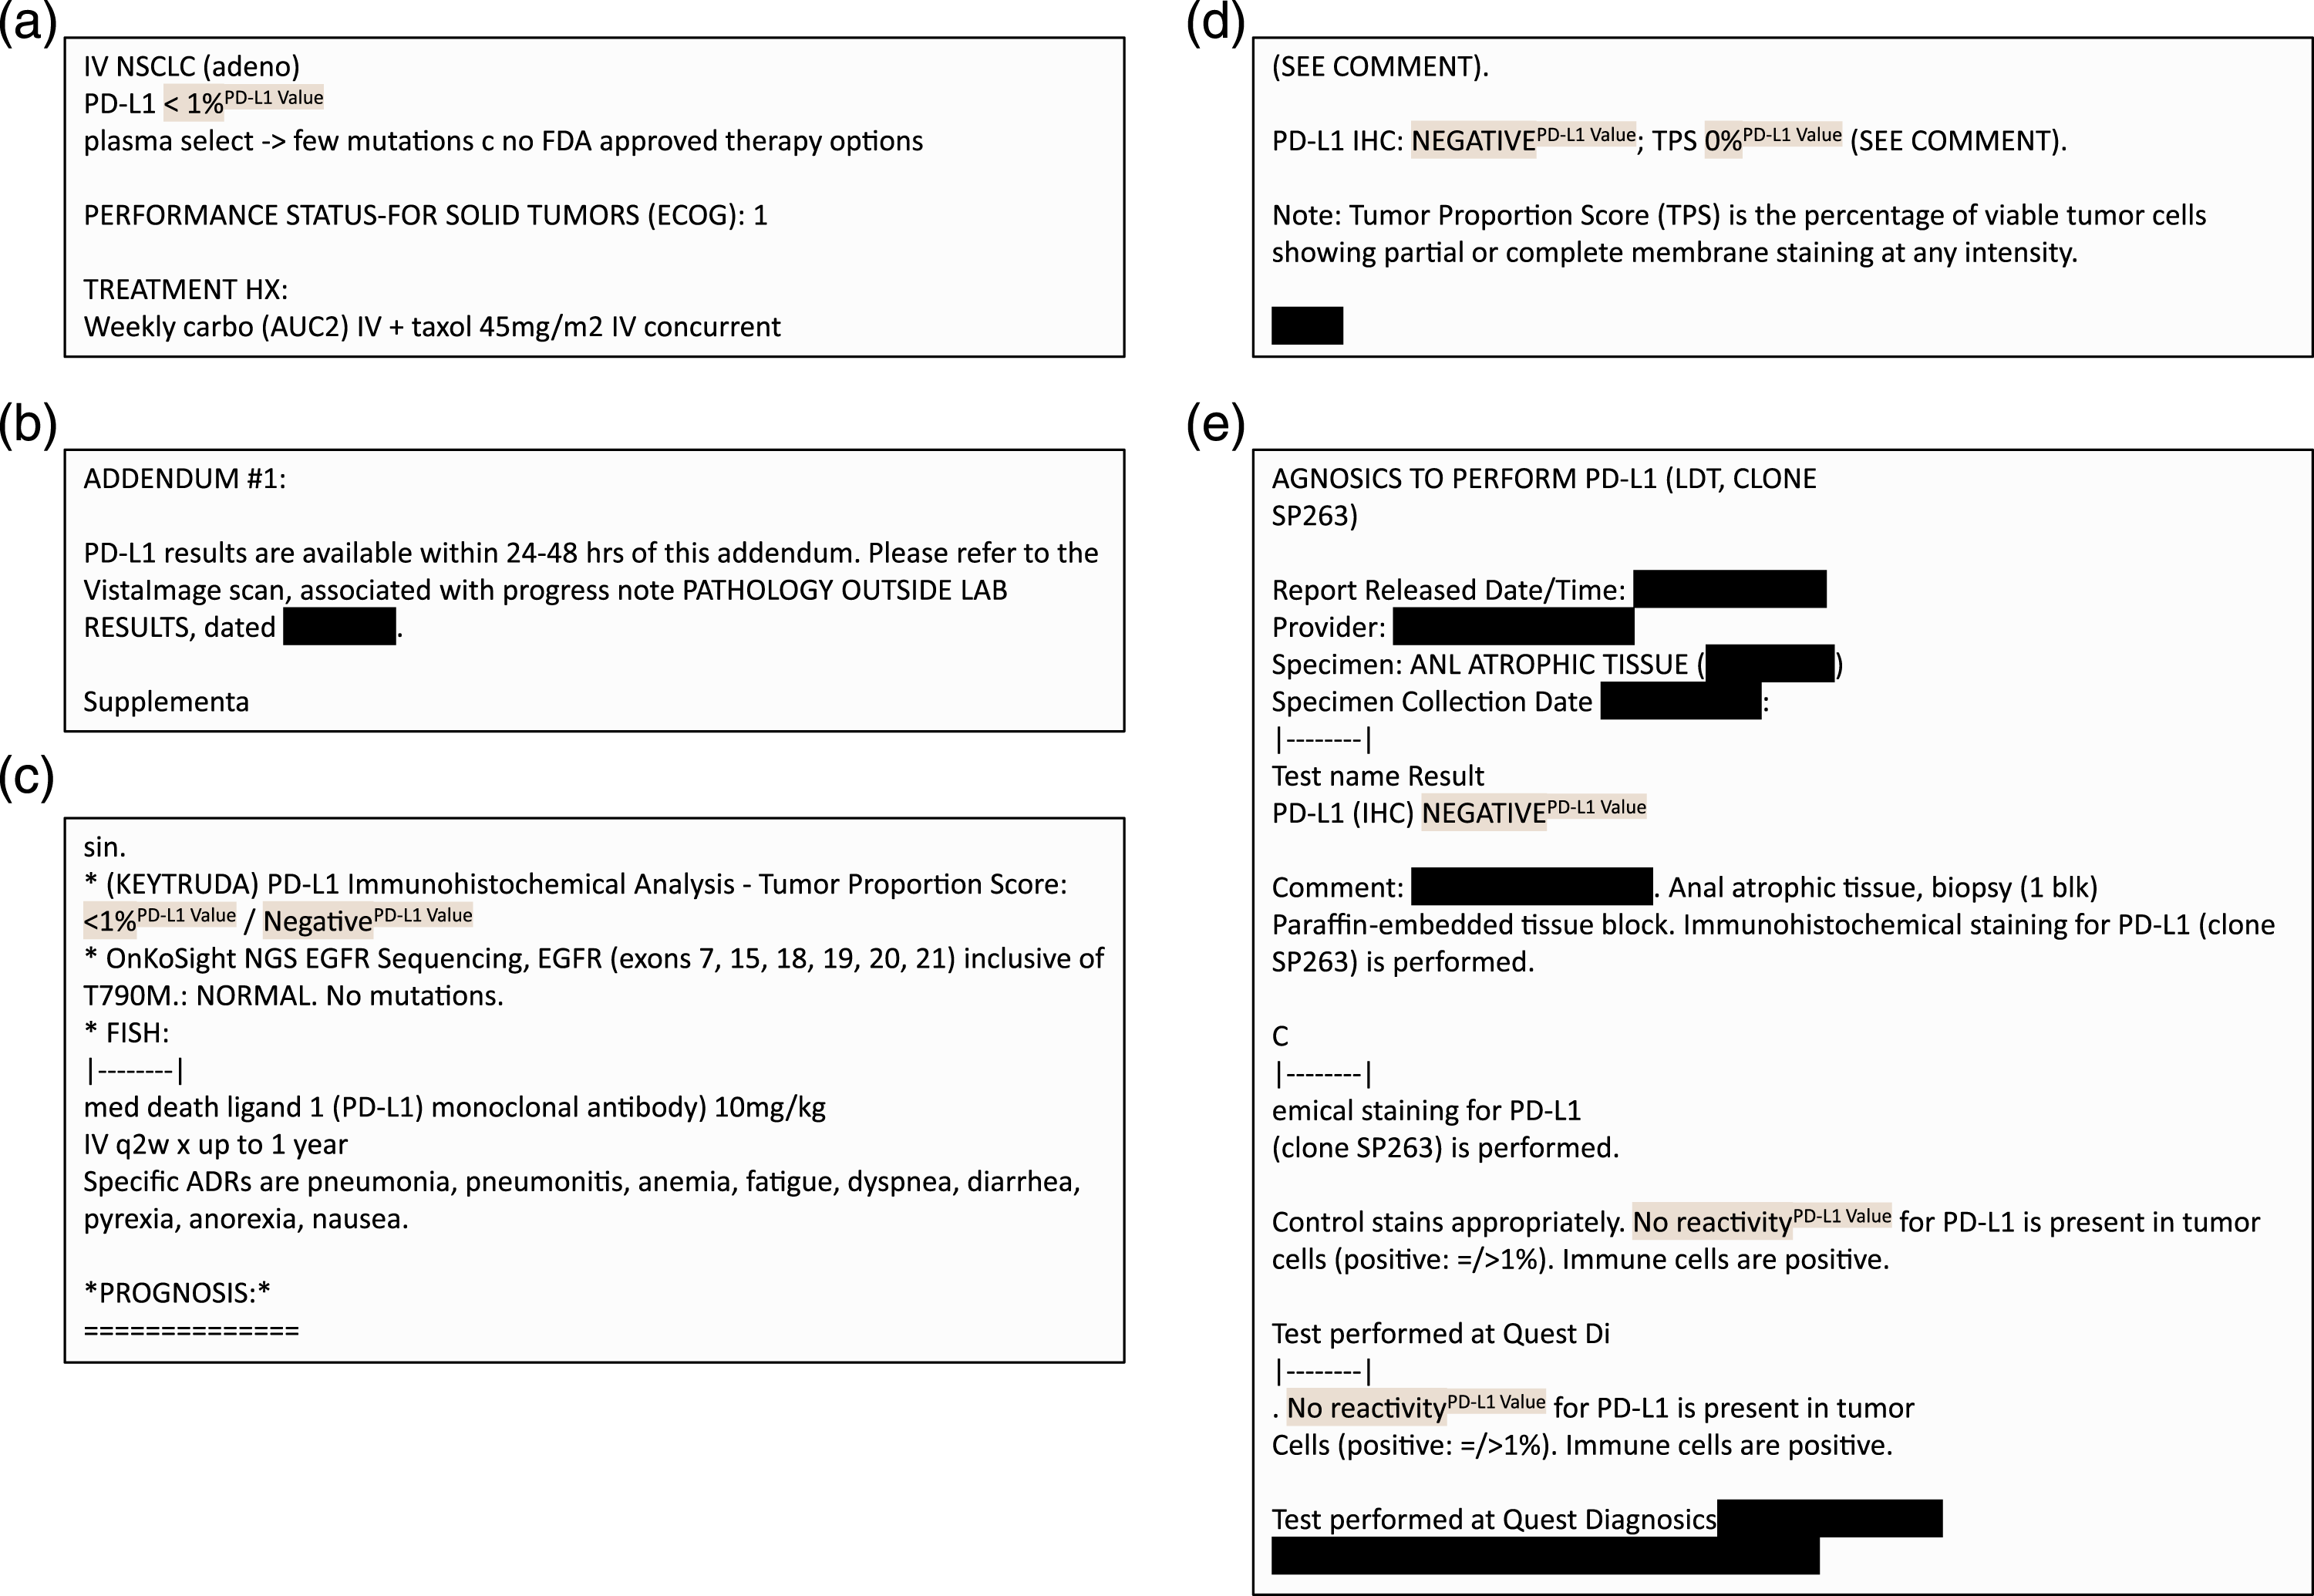
Annotation guidelines were defined based on guidance from a senior medical oncologist co-author, and annotation was carried out by co-authors with experience in biomedical informatics with training and oversight from the medical oncologist. A preliminary round of annotation and discussion was conducted to refine annotation guidelines. Inter-annotator agreement was evaluated using the sample-weighted average Cohen’s kappa score, as implemented in the open-source Python scikit-learn package. 32
Time required for annotation was calculated using annotation timestamp metadata from Label Studio. For each note, the time required for annotation was calculated as the difference between that annotation’s timestamp and the prior note’s annotation timestamp. To account for annotator breaks and artifacts arising from annotator error, annotation times greater than 300 s or less than 1 s were filtered out.
Machine learning–based NLP model development
We developed a machine learning–based NLP model to extract PD-L1 values using the open-source Python package spaCy 3.0 33 and the biomedically focused supplementary package scispaCy. 34 The problem was formulated as a named entity recognition task. SpaCy offers pre-trained pipelines among which specific components can be re-trained with problem-specific labels. Starting with the pre-trained en_core_sci_lg model from scispaCy, we used its pre-trained tokenizer and token representation components (tok2vec), and we re-trained the named entity recognition component on top of this using our annotated spans. Tokenization made use of a convolutional neural network and named-entity recognition made use of a transition-based parser. Default hyperparameters were used for training. 35
Postprocessing: Entity-level value standardization
Each predicted value produced by spaCy was standardized as follows. First, a whitelist of acceptable patterns to describe PD-L1 values was applied to eliminate extraneous text captured by the model. For example, if the text “value is less than 50 percent” was returned by the spaCy model as a predicted PD-L1 value, then “less than 50 percent” was captured as an acceptable substring for describing a PD-L1 value, while “value is” was eliminated. As another example, “high PD-L1” was mapped to “high”. Second, for text containing individual numeric values, inequalities, or ranges, these were extracted as follows. For individual values, the numeric value was extracted (e.g., “31 percent” was evaluated to the number 31). For strict inequalities, the numeric value was evaluated as one minus or one plus the number (e.g., “less than 50 percent” was evaluated as 49). For ranges, the upper value was taken (e.g., “1-49 percent” was evaluated as 49). After this step, all predicted PD-L1 values were mapped to either a single number or one of the following strings: “very low”, “low”, “moderate”, “high”, “negative”, “positive”.
Postprocessing: Document-level value resolution
The previous step (value standardization) mapped each individual predicted PD-L1 value to a standard form. However, each document may contain multiple such values. For example, often a document both states that PD-L1 was positive and also contains the numeric value (e.g., “PD-L1 positive (TPS 70)”). For each document, we took the most specific and highest available value, as follows. If any numbers were present, the highest number was selected. Otherwise, if “very low”, “low”, “moderate”, or “high” were present, the highest of these was selected. Otherwise, if both “negative” and “positive” were present in the document, “positive” was selected. The rationale for this hierarchy is that it is of greatest value to extract a numeric PD-L1 value, but if this is not available, it is still valuable (e.g., for cohort selection) to know less granular information on PD-L1 status.
Postprocessing: Document-level value mapping
In order to facilitate both evaluation and downstream use, each individual document level value was mapped to a 3-tuple of values at three levels of granularity: a numeric PD-L1 value, which we called fine granularity; the height of the PD-L1 value (“very low”, “low”, “moderate”, or “high”), called medium granularity; and the positivity of the PD-L1 value (“negative” or “positive”), called coarse granularity. First, each fine-granularity numeric value was mapped to a medium-granularity category as follows: value 0 was mapped to “very low”, values 1–9 were mapped to “low”, values 10–49 were mapped to “moderate”, and values 50–100 were mapped to “high”. Second, each medium-granularity category was mapped to a coarse-granularity category as follows: “very low” was mapped to “negative”, and the other three categories were mapped to “positive”. For example, 30 was mapped to the tuple (30, “moderate”, “positive”), “low” was mapped to the tuple (N/A, “low”, “positive”), and “positive” was mapped to (N/A, N/A, “positive”), where N/A represents a missing value. These thresholds were chosen based on common eligibility cutoffs in lung cancer and can be adjusted for disease- or indication-specific analyses if needed.
Evaluation strategy
Model performance was evaluated using 10-fold cross validation, with an 80% train, 10% development, and 10% test split in each fold. The train set was used for training, and development set was used for early stopping. Test sets were not used for training or early stopping.
The following evaluation measures were computed relative to each fold’s test set and averaged across folds. For coarse and medium granularity labels, the precision, recall, and F1 score of the model’s test-set performance were evaluated. For fine granularity (i.e., the numeric value), the precision, recall, and F1 score as to whether or not a numeric value was present in the annotated and predicted sets were evaluated, along with the mean absolute error of the numeric values in the subset of documents where both an annotated and predicted numeric value were present.
Results
Dataset characteristics
We identified 91,408 clinical notes matching the PD-L1 keyword regular expression as the study’s full dataset, representing 11,146 unique patients (median four notes per patient, interquartile range (IQR) 2–10). The annotated sample of 1000 notes represented 892 unique patients and contained 2043 annotated PD-L1 values; there were a median of two annotations for a PD-L1 lab. value in each note (IQR 0-4). Average preprocessed note length was 76.3 words (standard deviation 73.9 words). The most frequent clinical service represented in the annotated notes was Hematology and Oncology (575 notes), followed by Pathology (90 notes), Pharmacy (67 notes), Internal Medicine (19 notes), and other or unknown (249 notes). Inter-annotator agreement as measured by sample-weighted average Cohen’s kappa score was 0.920, reflecting a high level of agreement as to PD-L1 lab. value annotations between reviewers. The average time required for a human annotator to annotate each note was 24.7 s (IQR 8.3-27.7 s).
Evaluation results
Evaluation measures relative to the 10 test sets from 10-fold cross validation are shown, including the mean and standard deviation (sd) across the 10 test sets. for coarse and medium granularity labels, the precision, recall, and f1 score of the Model’s test-set performance are shown. for fine granularity (i.e., the numeric value), the precision, recall, and F1 score as to whether or not a numeric value was present in the annotated and predicted sets is shown, along with the mean absolute error of the numeric values in the subset of documents where both an annotated and predicted numeric value were present. The scale of precision, recall, and F1 is from 0 to 1, while the scale of mean absolute error of the extracted PD-L1 value is from 0% to 100%.
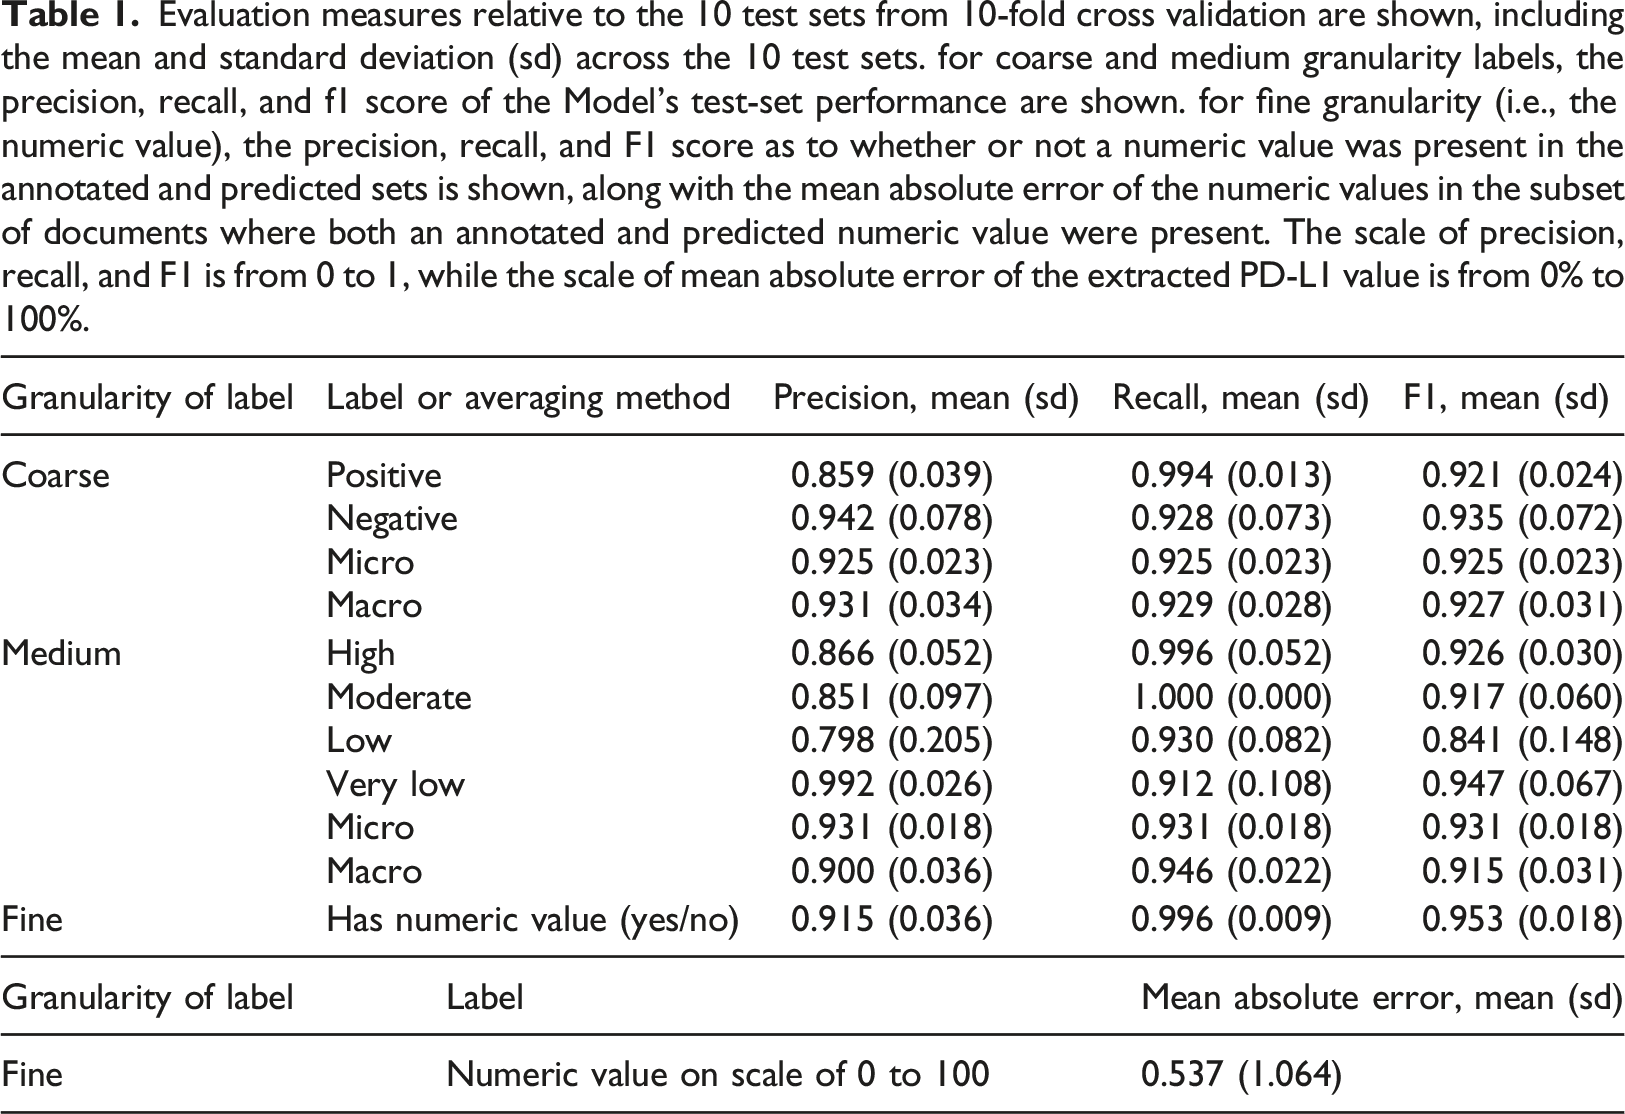
At the medium level of granularity, where each document was categorized as having high, moderate, low or very low PD-L1 levels, precision ranged from 0.798 to 0.992 and recall ranged from 0.912 to 1.000 across the labels.
For the fine level of granularity, each document was associated with a numeric PD-L1 value if one was available. The algorithm identified whether there was a numeric PD-L1 value associated with the document, on average, with a mean recall of 0.996 (sd, 0.009) and a mean precision of 0.915 (sd, 0.036). Among documents where an annotated and predicted numeric PD-L1 value were both present, the mean absolute difference in these values was 0.537 (sd, 1.064), on a scale of 0 to 100, reflecting a very high agreement in annotated and predicted values when both were present.
Error analysis
We analyzed errors using secondary manual review of the model predictions relative to the human annotations in the 10 tests sets. Across the 10 test sets, 68 errors were identified, and these were manually grouped into three major categories: (a) PD-L1 proximal errors (27 errors, 39.7%), (b) medical value proximal errors unrelated to PD-L1 (8 errors, 11.7%), and (c) annotation errors and uncertainties (33 errors, 48.5%). (a) PD-L1 proximal errors encompass incorrect model predictions where the model falsely identified a PD-L1 lab. value from text that was relevant to PD-L1. Of the 27 errors in this category, 10 of them were from the model incorrectly identifying PD-L1 lab. value cutoffs from a clinician describing future steps in a treatment plan where different lab. values would lead to different treatment decisions. Similarly, four other errors were the result of the model identifying reference values such as “1–10%” that are meant to aid in interpretation of the PD-L1 lab. value but were not the lab. value themselves, and one error was from a checklist template about PD-L1 related cutoffs for treatment decisions. Copy-and-pasted research article excerpts referring to PD-L1 accounted for seven errors. The model also misidentified two lab. values which actually described a PD-L1 related condition such as pneumonitis but not a PD-L1 lab. value itself. In 3 instances, the model captured only a part of the correct phrase such as identifying only the value “1Percent” from the correct annotation of “LESS THAN 1 Percent”. (b) Medical value proximal errors unrelated to PD-L1 encompass errors where the model mistakenly identifies a value that is unrelated to PD-L1 lab. values. Of the eight errors in this category, seven were from values that described other labs or medications such as “25%” from “25% dose reduction in 5-FU". Notably, many of the identified values were next to medical acronyms such as “PD-1”, “LVEF” or “TP53”. (c) Annotation errors and uncertainties refers to a grouping of errors where the human annotation missed the correct PD-L1 lab. value. Of the 33 notes in this group, secondary review showed that in 23 cases, the model actually correctly predicted the true value, while in 5 cases, both the model and human annotation failed to correctly identify the true value. In the remaining 5 cases, it was unclear even upon secondary review whether the model or human annotators were correct.
Application to full dataset
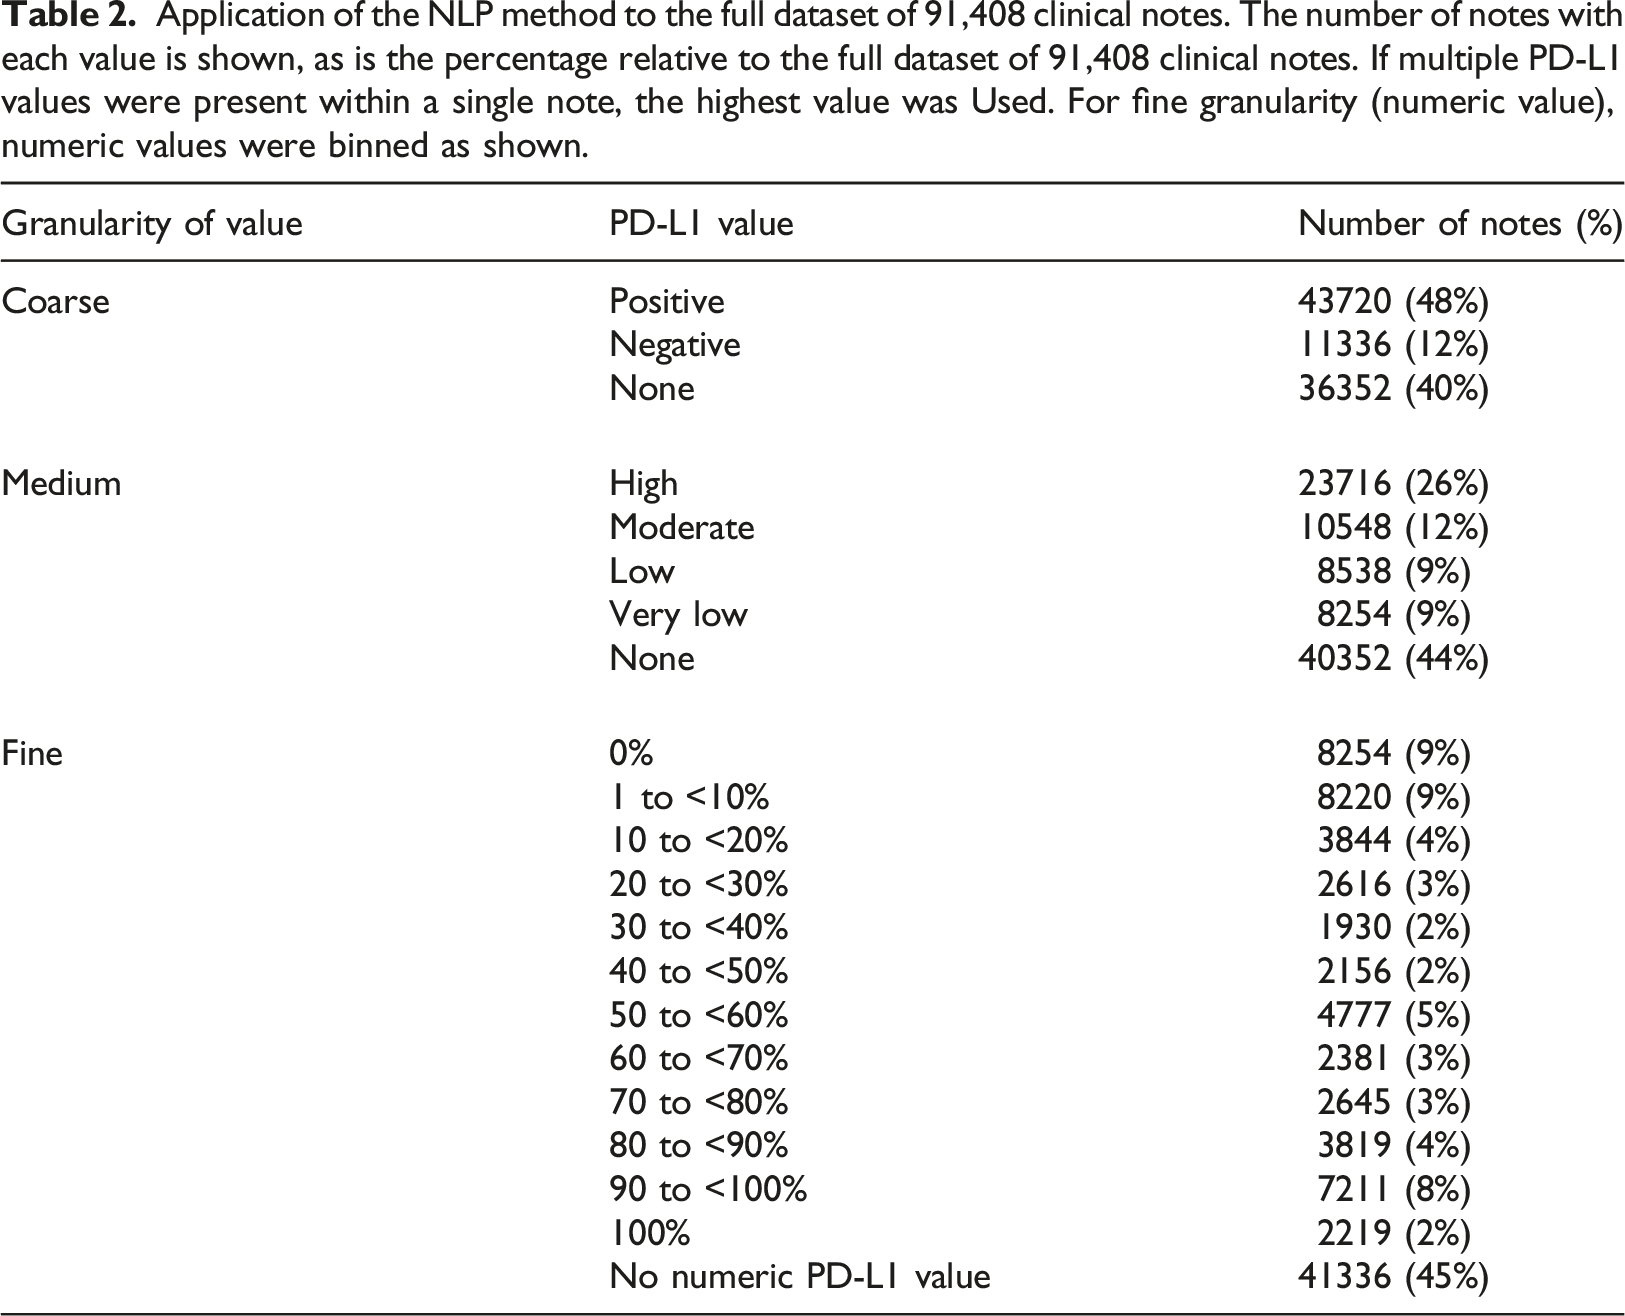
Application of the NLP method to the full dataset of 91,408 clinical notes. The number of notes with each value is shown, as is the percentage relative to the full dataset of 91,408 clinical notes. If multiple PD-L1 values were present within a single note, the highest value was Used. For fine granularity (numeric value), numeric values were binned as shown.
Integration into VA clinical trial matching application
The NLP method has been used to extract PD-L1 values for use in a clinical trial matching application which is presently in use across a number of VA hospitals nationally (Figure 2). For each patient, the most recent PD-L1 value is displayed, along with the context in the clinical note from which this value was extracted. The extracted values are used for automatically identifying patients’ eligibility for enrollment in clinical trials, and the value’s accuracy can be confirmed by VA clinical staff based on the note context. Integration of PD-L1 values produced by the NLP method in a clinical trial matching application in use at a number of VA hospitals nationally. The application shows both the extracted PD-L1 value, its date, and the snippet of the clinical note the value was extracted from (highlighted in the blue dashed box).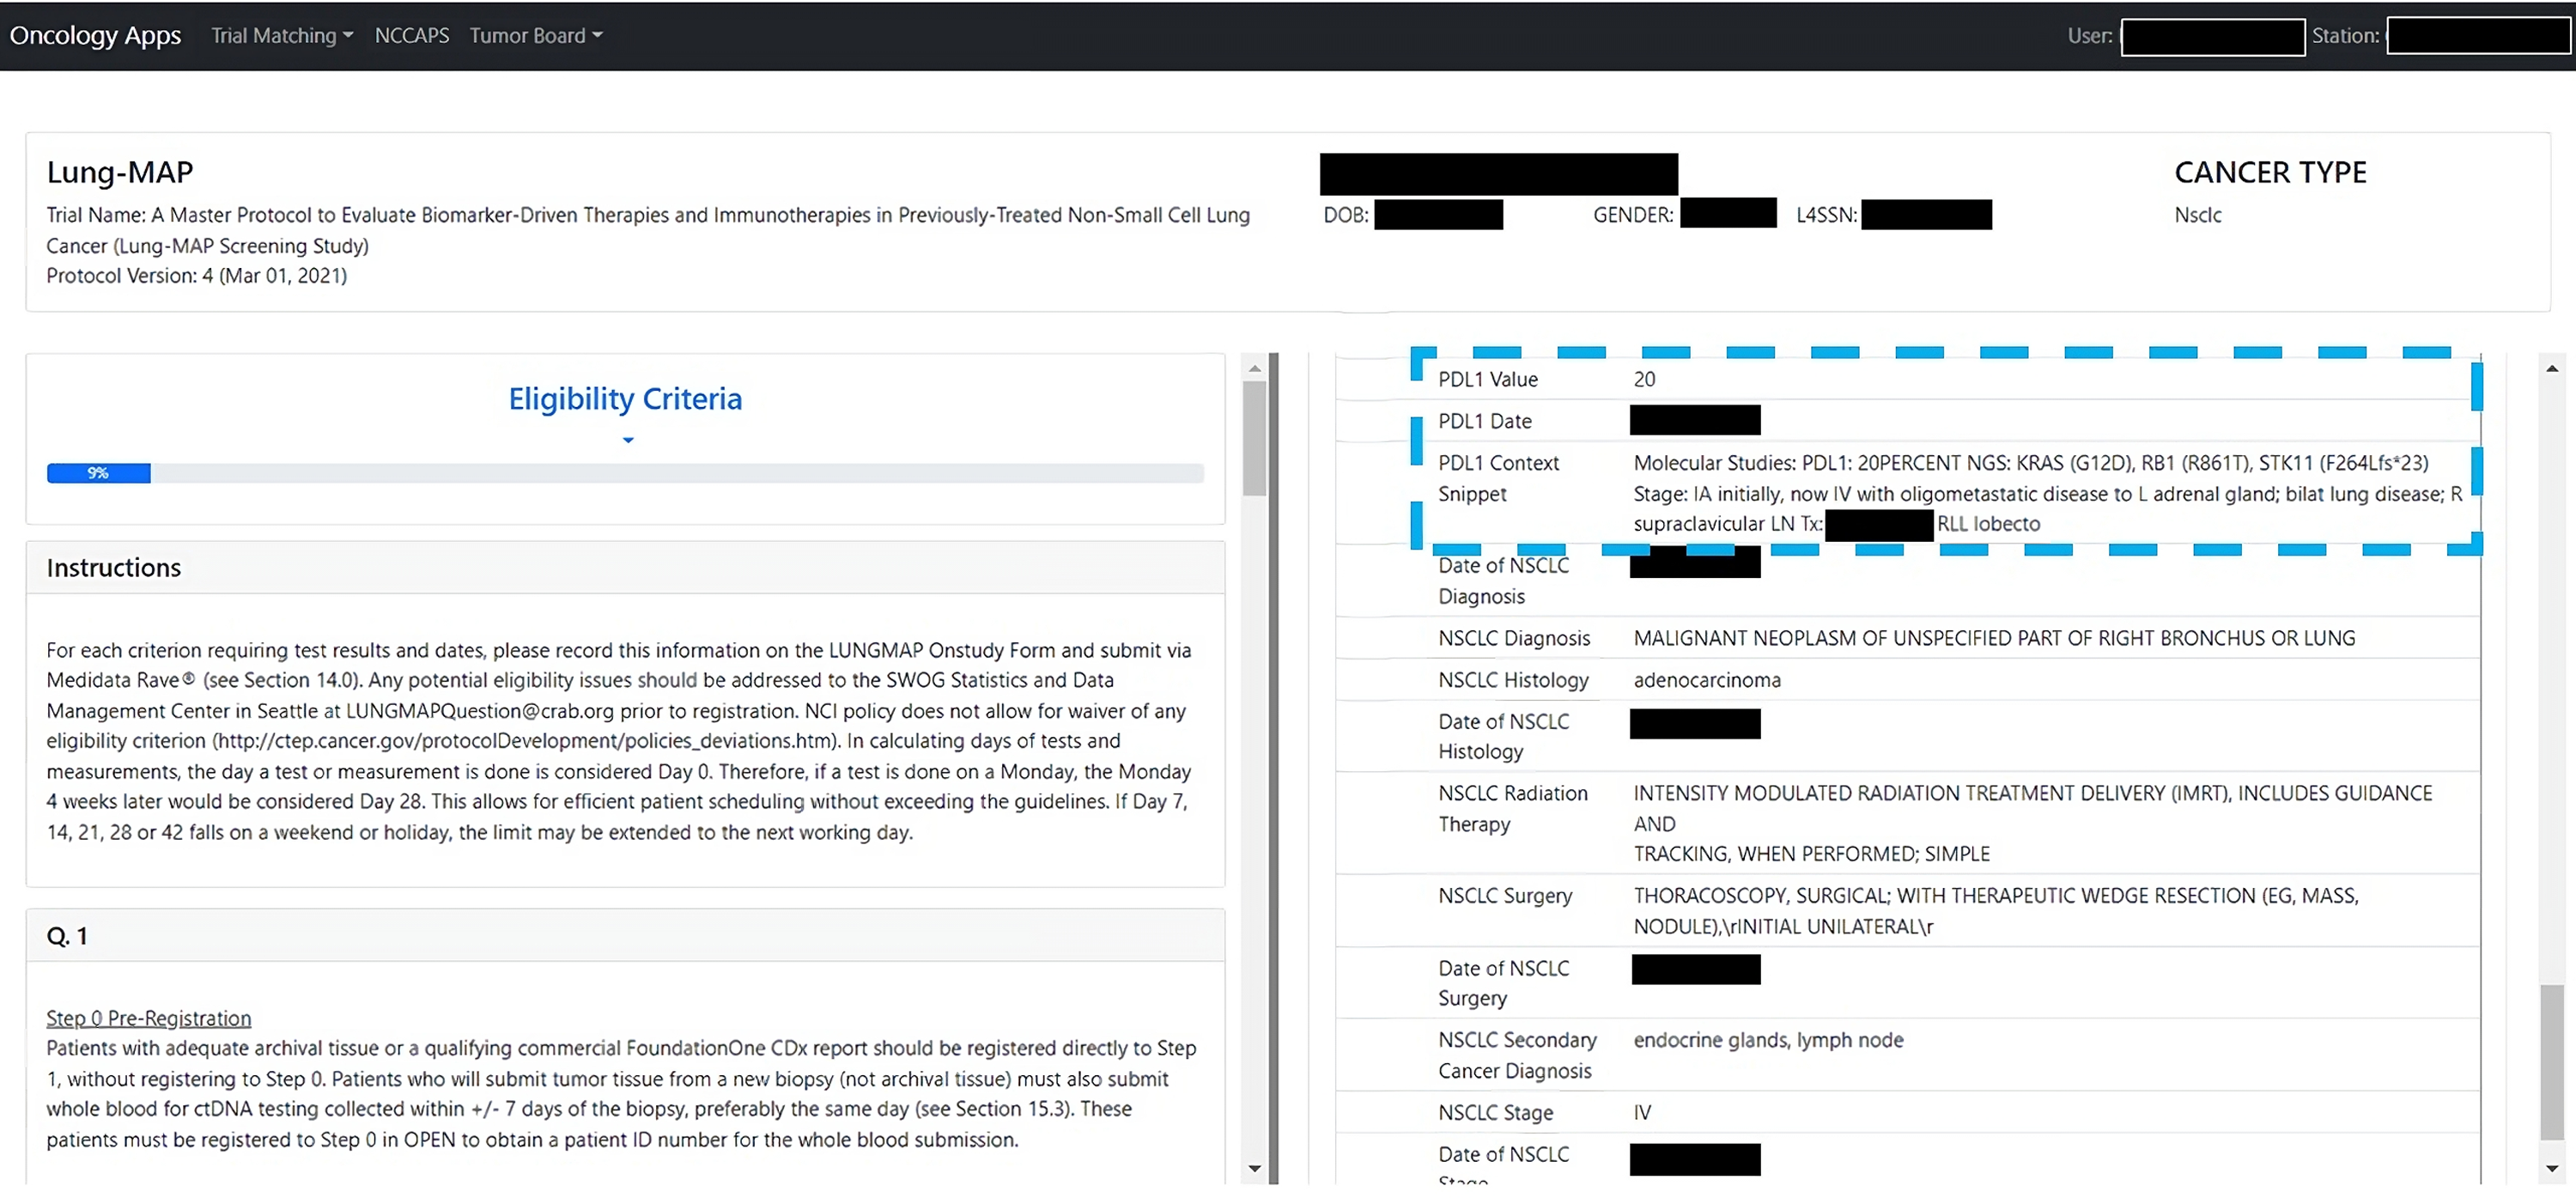
Discussion
Real-world evidence studies rely on the efficient derivation of relevant markers from the EHR. PD-L1 status is one of the main markers determining response to and eligibility for immunotherapy, and as such, is a confounder for many studies involving immunotherapy. Therefore, it is critical to account for PD-L1 such studies. However, PD-L1 often does not exist in structured data, creating a challenge to feasibility of executing statistically rigorous real-world studies. Here we presented an accurate automated pipeline for deriving PD-L1 status from clinical notes. To our knowledge, ours is the first publication describing an NLP algorithm to derive PD-L1 status from clinical notes in the EHR along with a rigorous evaluation of its performance at deriving PD-L1.
NLP algorithms are often necessary for population-level studies due to the infeasible amount of labor required to fully annotate large databases. We demonstrate how our model can extract PD-L1 values with high accuracy at fast speeds. By reducing the time and manual effort needed to review medical records, our work will enable future studies of key questions, such as whether new immunotherapy regimens are successfully extending life at the population-level and whether these treatments are targeted to the appropriate patient populations.
Beyond the application of this pipeline to enable real-world evidence studies, automated extraction of PD-L1 can also aid clinical trial recruitment efforts. Trial recruitment remains a critical barrier: many oncology trials close without reaching their recruitment goals. PD-L1 status is often a key discriminant of trial eligibility. The integration of this algorithm within the framework of an existing trial matching application can improve recruitment efforts by identifying eligible patients more reliably.
A limitation of our method is that performance may have been negatively impacted by incorrect annotations. In error analysis, the most frequent category of error was due to incorrect annotation by the human annotator. The medical doctors conducting the error analysis noted that it was occasionally unclear what the true annotation should have been; this was attributed to the clinical note writing style that may often have unclear references, complex idiosyncratic syntax, and typographic errors. Although the annotation task to label PD-L1 lab. values appeared relatively simple, the team of medical informatics researchers and clinicians required extensive discussion to come to consensus on guidelines, and even with these guidelines the annotation was not perfect, as revealed by error analysis. A second limitation is that our evaluation only quantified the method’s accuracy in the VA’s nationwide EHR database. While this database encompasses a wide diversity of clinical practices and documentation styles and therefore our NLP method is likely fairly robust to such variations, nevertheless additional validation and potential modifications would be needed before use in other settings.
In summary, we presented an accurate NLP method for deriving PD-L1 status from unstructured clinical notes. By reducing the time and manual effort needed to review medical records, our work will enable future population-level studies in cancer immunotherapy.
Footnotes
Author Contributions
NRF conceived the study. EL, RZ, and NRF designed the methods. JTW, DPT, DE, MTB, NVD, and NRF designed the problem formulation. EL, RZ, JL, and SG implemented natural language processing and evaluation. EL, JL, LH, CY, and NRF conducted annotation. All authors contributed to data analysis or interpretation. EL, RZ, JTW, and NRF drafted the manuscript. All authors reviewed and critically edited the manuscript for important intellectual content.
Declaration of conflicting interests
The author(s) declared no potential conflicts of interest with respect to the research, authorship, and/or publication of this article.
Funding
The author(s) disclosed receipt of the following financial support for the research, authorship, and/or publication of this article: This work was supported by the VA Cooperative Studies Program, VA Boston Medical Informatics Fellowship, and American Heart Association (870726). The views expressed are those of the authors and do not necessarily reflect the position or policy of the Department of Veterans Affairs or the United States government.
Ethical approval
The analyses for this report were conducted as part of a VA project to support clinical operations that was classified as non-research by the VA Boston Healthcare System Research and Development Committee. As a non-research project, informed consent was not applicable.