
Abstract
Introduction
Obstructive sleep apnea (OSA) has partial or complete blockages of the upper airway during sleep which causes pauses in the air supply to the person during sleep. 1 Apnea-hypopnea index (AHI) is a measure of the number of hypopnea and apnea events and is used to determine the severity of OSA. A number of comorbidities such as cardiovascular, respiratory, endocrine, metabolic, and psychiatric symptoms are associated with OSA. 2 OSA association with depression symptoms has been established,2–4 with 5%–63% OSA showing such symptoms and thus the coexistence of these two conditions. 2 The very big range indicates possible misdiagnosis. 5
OSA and depression present a complex interplay of symptoms that can mask each other, making diagnosis and treatment challenging.1,6 Patients with OSA due to disturbed sleep and oxygen during sleep have a higher tendency to sleepiness, poor concentration and alertness during the day which can lead to a number of difficulties such as accidents and quality of life. 7
Reduced production of neurotransmitters in the brain is associated with major depressive disorder (MDD). 8 OSA and MDD present common symptoms such as anxiety, restlessness, fatigue, and poor concentration. Identifying MDD is essential prior to treating OSA 9 and patients exhibiting symptoms of both OSA and depression necessitate treatment for both conditions. 10
Polysomnography (PSG) is the gold standard for diagnosis of OSA. 11 It requires overnight monitoring of the person and recording of electroencephalogram (EEG), electrooculogram (EOG), electromyogram (EMG), and electrocardiogram (ECG). However, this requires the person to sleep in the clinic while connected to a large number of electrical leads, making the assessment uncomfortable for the patient. Further, with only a few specialized sleep centers which are all located in major urban centers, patients often have long waiting periods before assessment. An alternate option is for home-based assessment, and this is feasible if there are a small number of sensors that can be easily placed on the user. For this purpose, only ECG and PPG have been proposed 12 which has the potential for home-based assessment.13,14
Clinical interviews are the “gold standard” for validating self-rated questionnaires that are used for detecting MDD. 15 However, both of these are subjective, time-consuming, and thus expensive. Mental health sleep clinics are related to Psychiatry and have emerged as the gold standard for detecting and treating MDD and OSA.16,17 However, these are few and located in large urban centers. Thus, the patients who report OSA symptoms are investigated for sleep disorders while the MDD condition is often under-diagnosed.18,19 To overcome this, machine learning models were proposed which use EEG, ECG, and breathing recordings as input to detect OSA patients with MDD. 20 However, recordings such as EEG require multiple leads and masks to be connected to the patient, making this unsuitable for home-based assessment.
ECG has been found to distinguish between healthy people and people with suicidal thoughts by Khandoker et al. 21 The authors reported the difference in heart rate variability of people with MDD. This work has identified the changes to the cardiac activity that are associated with MDD and are useful for detecting MDD. However, a number of MDD symptoms are similar to OSA, and thus there is a need to detect the differences between MDD and non-MDD patients with OSA.
Previous studies22–25 have demonstrated significant differences in ECG signals between individuals with OSA and healthy controls, identifying specific ECG markers such as variations in heart rate variability (HRV), changes in R-R intervals, and altered autonomic function indicative of OSA. Various studies26–28 have successfully utilized ECG data for detecting OSA, achieving high accuracy. For instance, Varon et al. 29 and Zarei et al. 27 used single-lead ECG recordings for sleep apnea detection, reporting accuracies up to 97.21%. Similarly, ECG has been effectively employed to identify mental disorders.27,30–34 Kobayashi et al. 32 and Khandoker et al. 34 achieved high sensitivity and specificity in detecting psychiatric conditions using ECG.
The association between OSA and MDD is well-documented, with overlapping symptoms such as fatigue, daytime sleepiness, poor concentration, and anxiety. Individuals with both conditions also exhibit a heightened risk of cardiovascular disease. 35 Despite these findings, no study has yet attempted to use only ECG to detect the comorbidity of MDD within the OSA cohort. To address this gap, we investigated sleep ECG parameters among OSA patients to screen for coexistence of MDD, expanding on previous research that focused on using ECG to differentiate OSA patients from healthy individuals.
Methods
Participants and data collection
Demographic and clinical data of OSA patients with and without MDD.
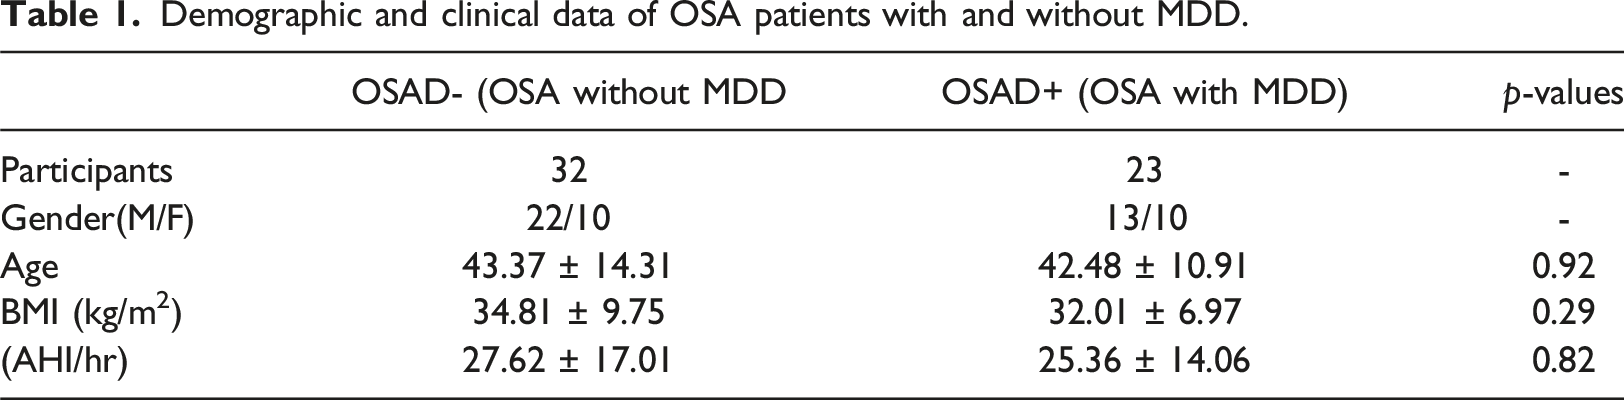
A consultant psychiatrist assessed OSA patients with mental health concerns using the Patient Health Questionnaire-9 (PHQ-9).42,43 This questionnaire, consisting of nine items, is utilized for assessing the severity of depressive symptoms through self-reporting. Participants select one or more response options, ranging from 0 (no presence of the symptom) to 3 (almost every day). The total score is calculated by summing the highest response for each item, falling within the range of 0 to 27. Scores of 5, 10, 15, and 20 on the PHQ-9 correspond to mild, moderate, moderately severe, and severe depression, respectively. 44 People with a positive score greater than 9 were considered to have MDD.
ECG signals were recorded at the sampling frequency of 100 Hz using the MiniScreen Plus (Löwenstein, Germany). The data has previously been reported in the work reported by Moussa et al. 20 and the deidentified recordings are available on request.
Data analysis
Segmentation
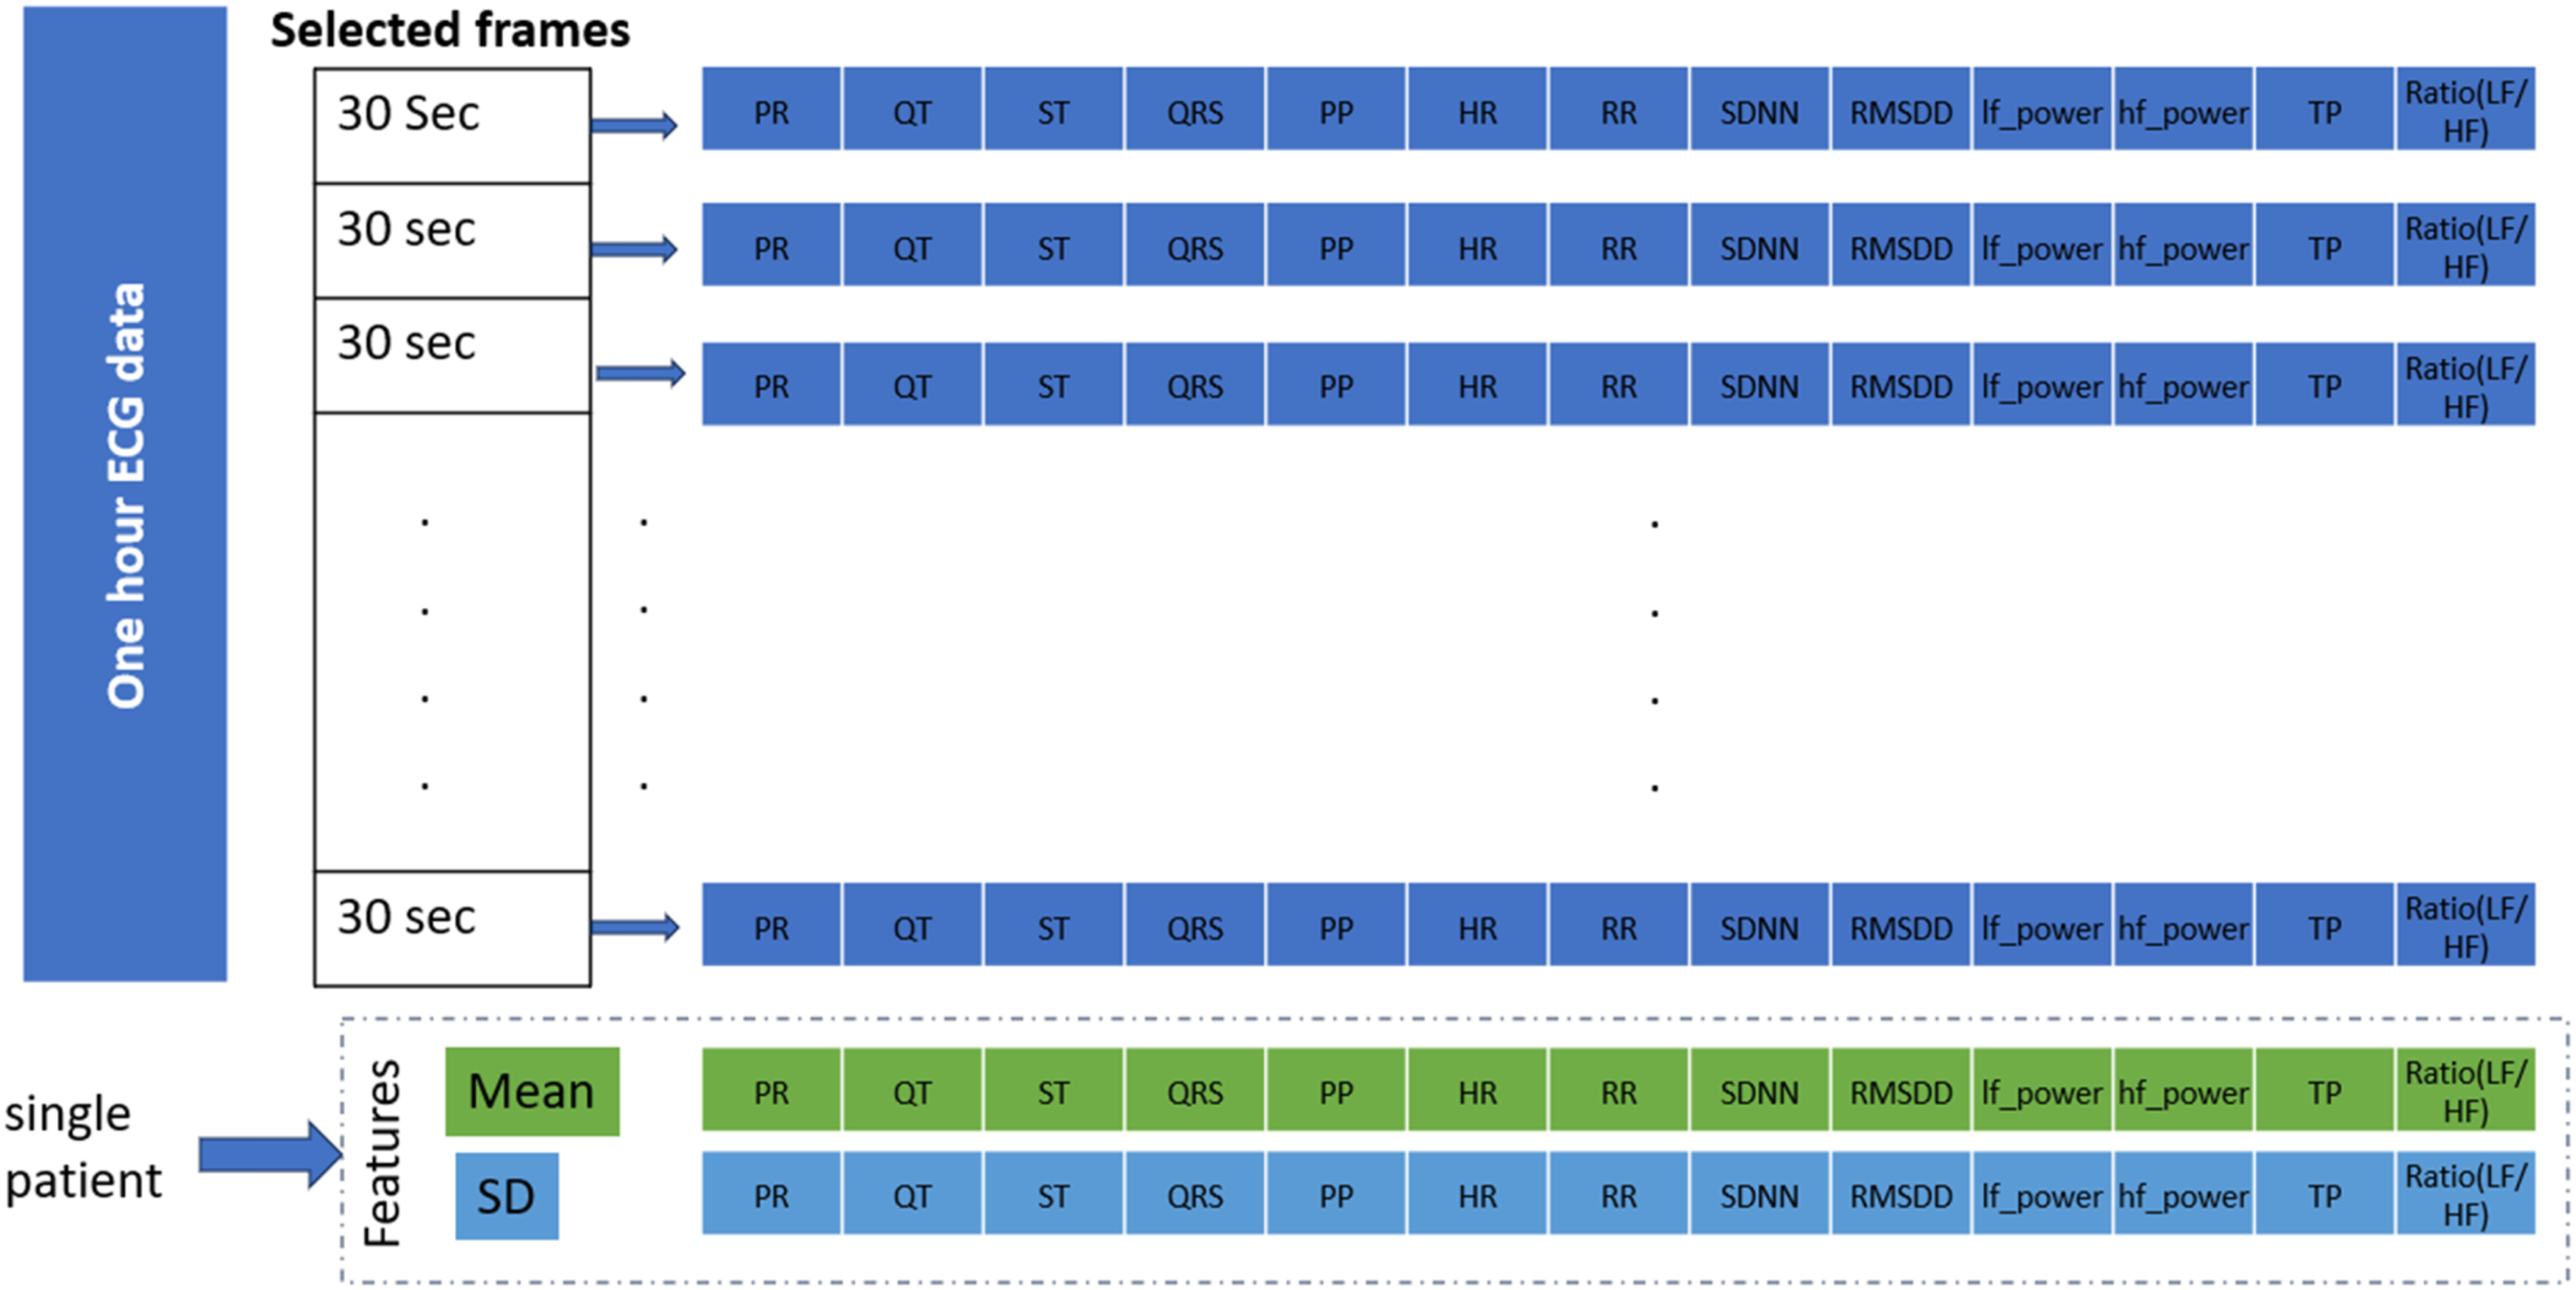
The first one-hour ECG data immediately after the patient fell asleep was taken for analysis. This was done to streamline the machine-based analysis without requiring the sleep labels. All the stages of NREM cover within 1 hour of the first sleep cycle, 45 which has been reported as suitable for cardiac analysis. 46 A window of 30 s duration was selected for the parameter’s extraction from the ECG signal. The 30-s ECG data is considered for the calculation of parameters because it provides a long enough time window to capture important information about the heart’s electrical activity, while still being practical for clinical use. Analyzing a short-term ECG signal, typically less than 60 s, is effective in finding the optimal length and number of segments for analysis.47,48
After segmentation, baseline wandering, and power-line noise were suppressed using a 0.5-45 Hz bandpass filter. Noisy segments having movement artifacts or loss of signal recording were removed from the analysis using manual inspection, as shown in Figure 1. Figure 1(b) – (d) shows examples of signals that were found to be unsuitable because of the presence of noise and artifacts. In (b), although the R peaks are visible, the signal is highly noisy, making it challenging to accurately identify and analyze other critical components such as the P, Q, S, and T peaks. This noise can interfere with precise annotations and potentially lead to unreliable parameter extraction. Figure 1(c) exhibits pronounced movement artifacts, resulting in abrupt, large amplitude deflections unrelated to cardiac activity, which significantly distort the ECG signal and make it difficult to accurately identify the morphology of the P, Q, R, S, and T peaks. Additionally, there are intervals of signal loss in Figure 1(c), further complicating the identification process and disrupting the continuity of the ECG recording. In (d), the ECG signal shows irregularities and high levels of noise throughout the recording, making it difficult to consistently identify and annotate the P, Q, R, S, and T peaks. Accepted and rejected frames: (a) accepted segment (b-d) rejected segments.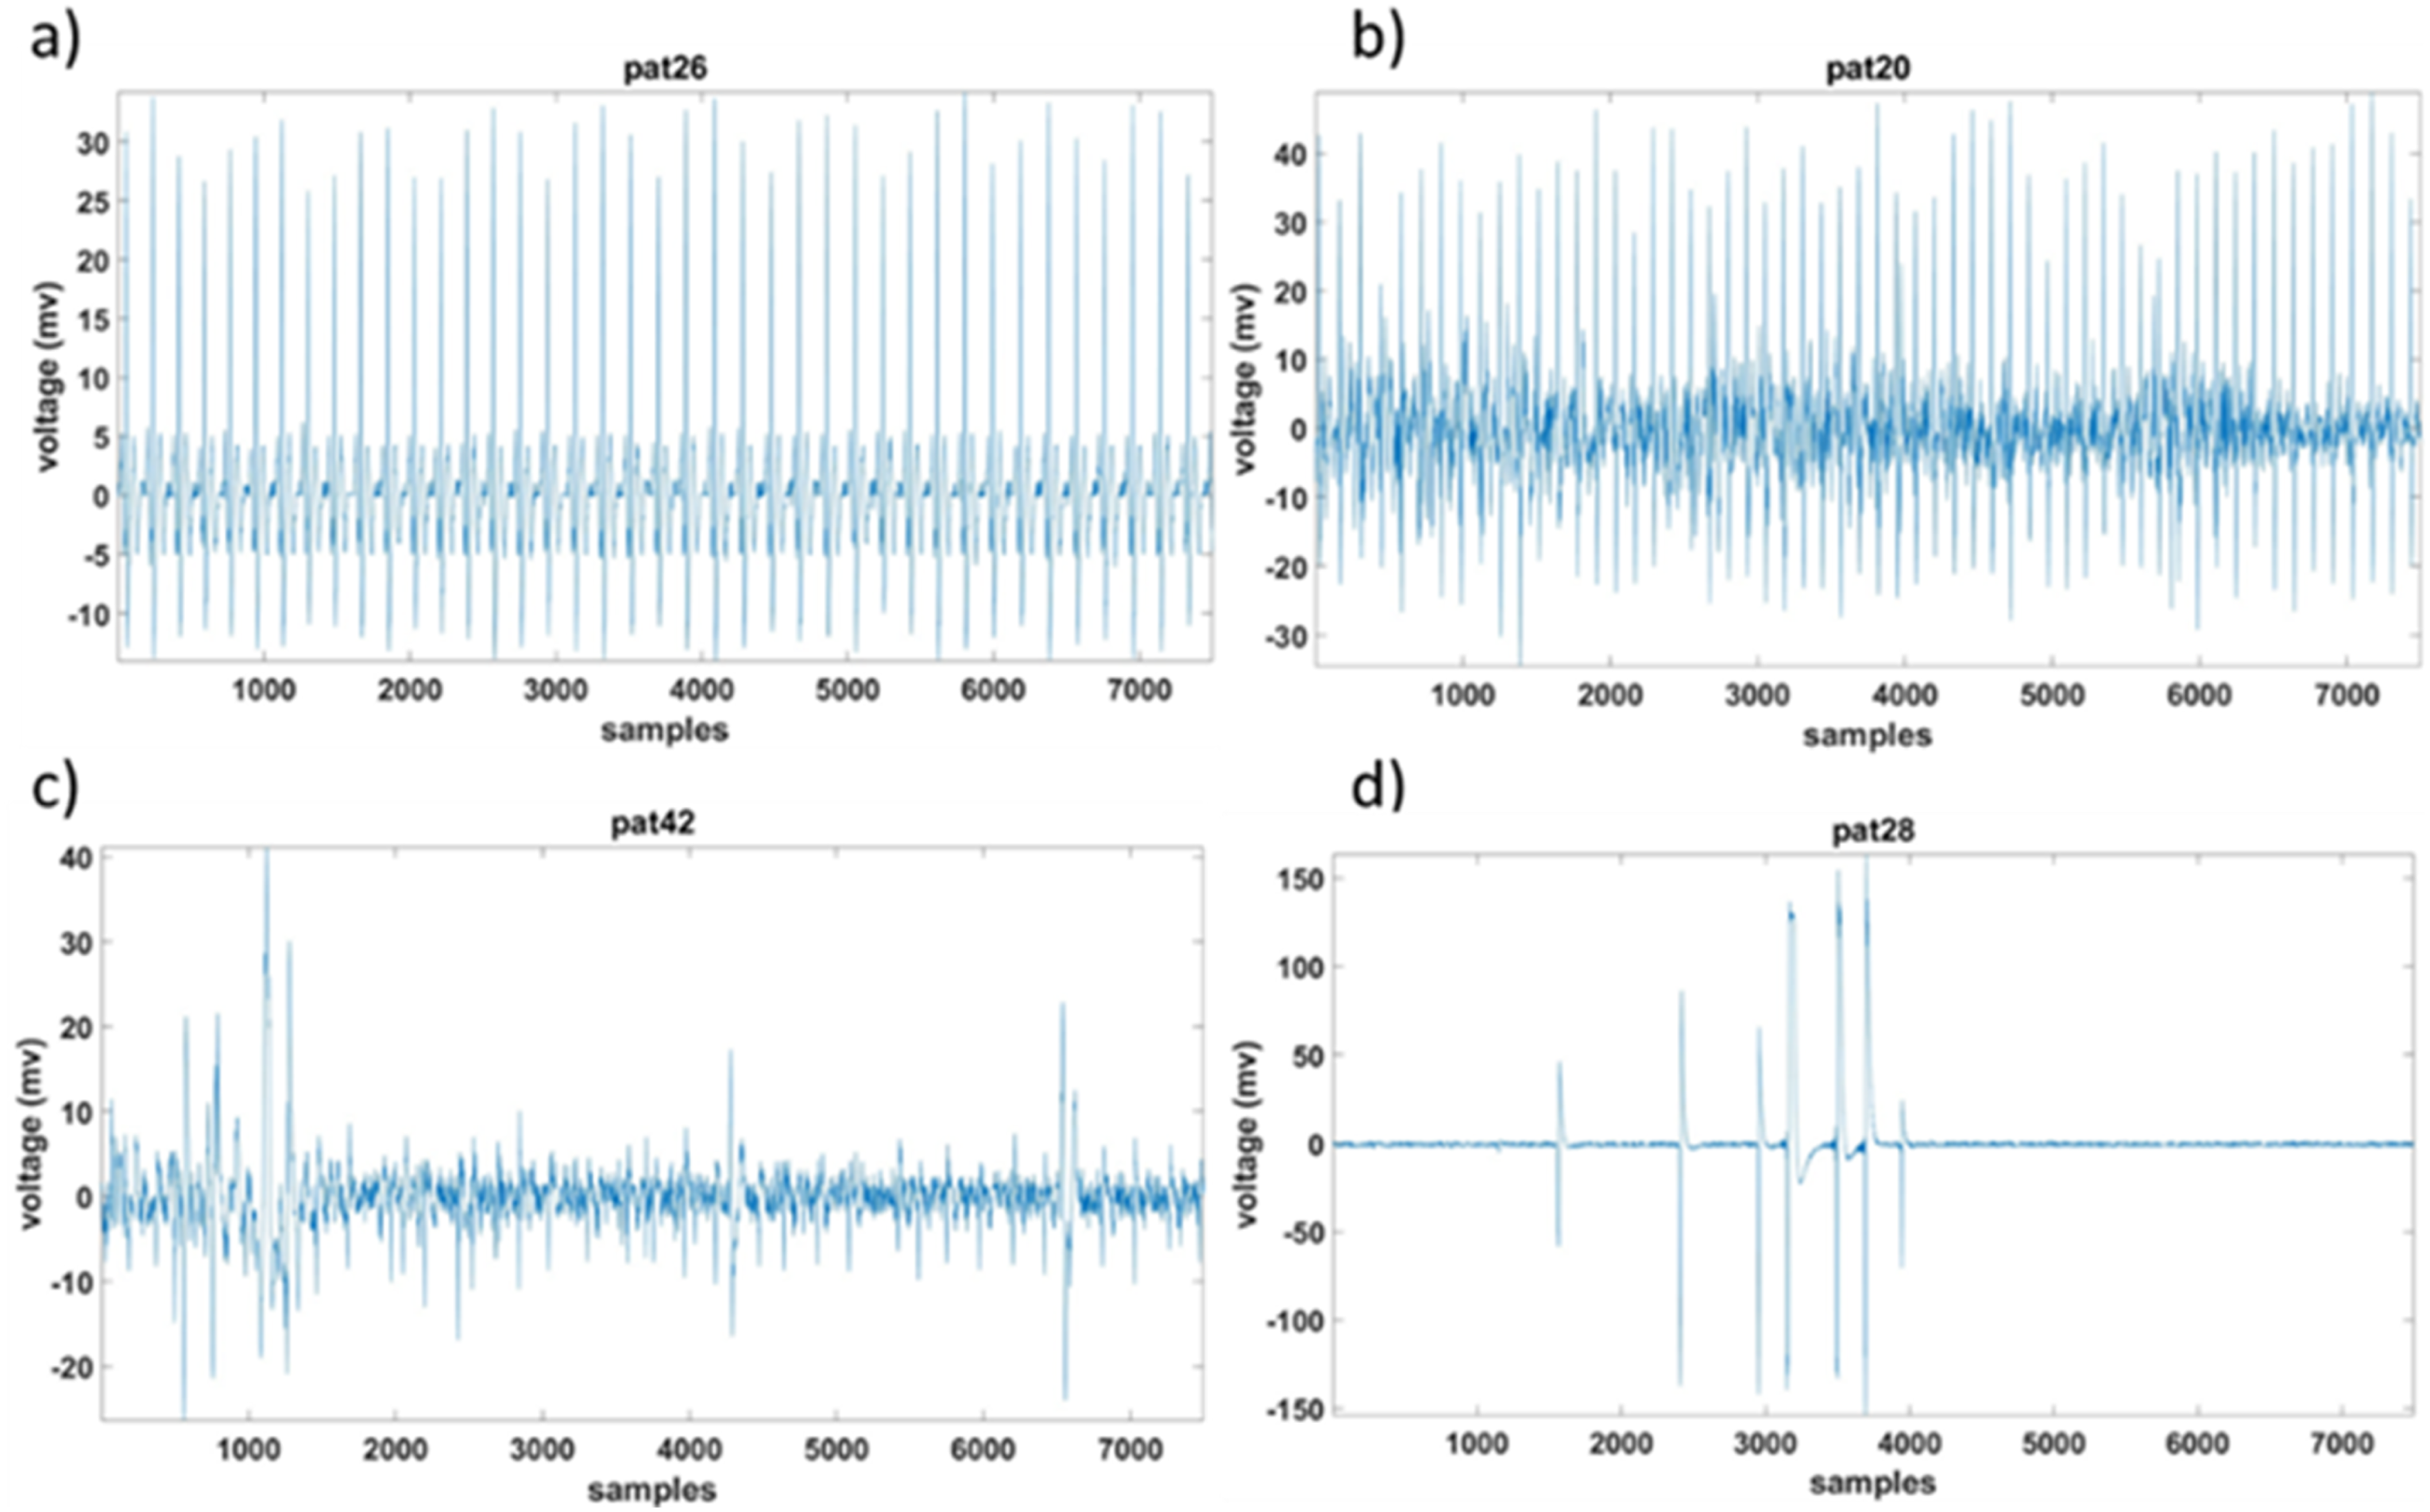
Feature extraction
Pan–Tompkins algorithm
49
was used to identify the QRS complex while ECGdeli
50
was used to identify the P and T. The six different intervals (PR, QT, ST, QRS, PP, and RR) were calculated further. The ECG wave with the segments is shown in Figure 2. Morphological features of an example ECG signal.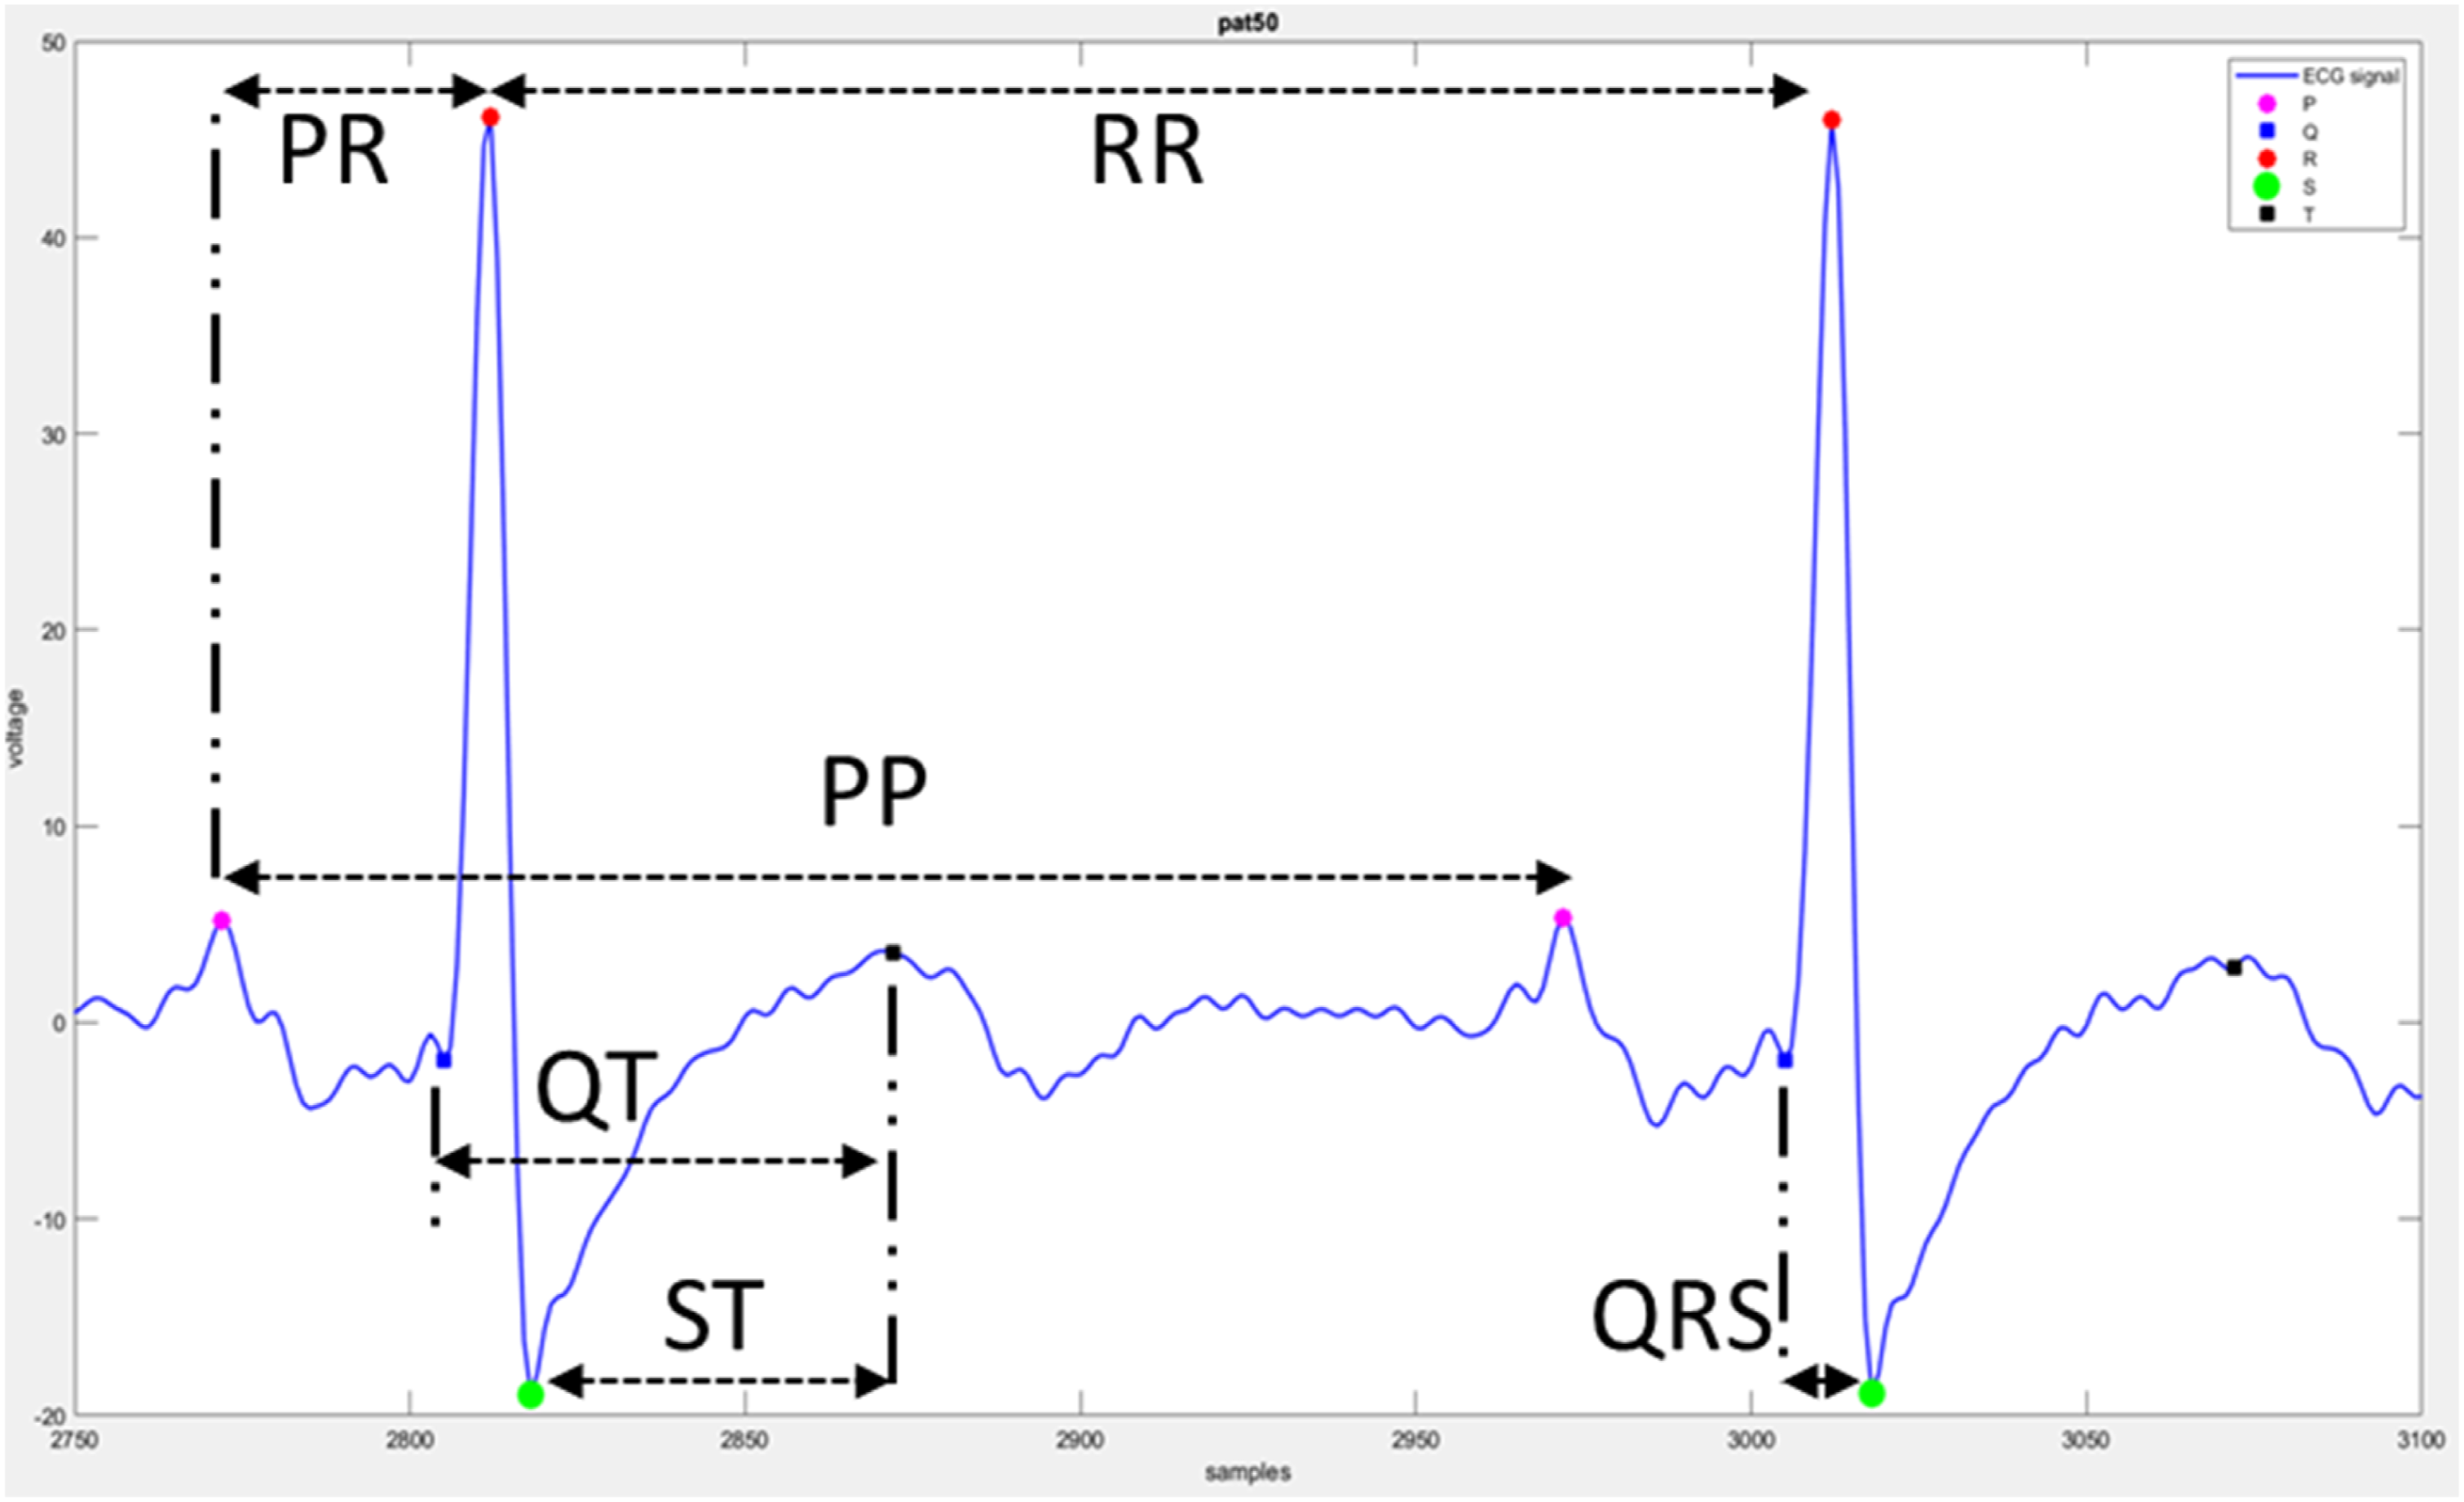
Equations and definitions of parameters calculated from ECG segments.
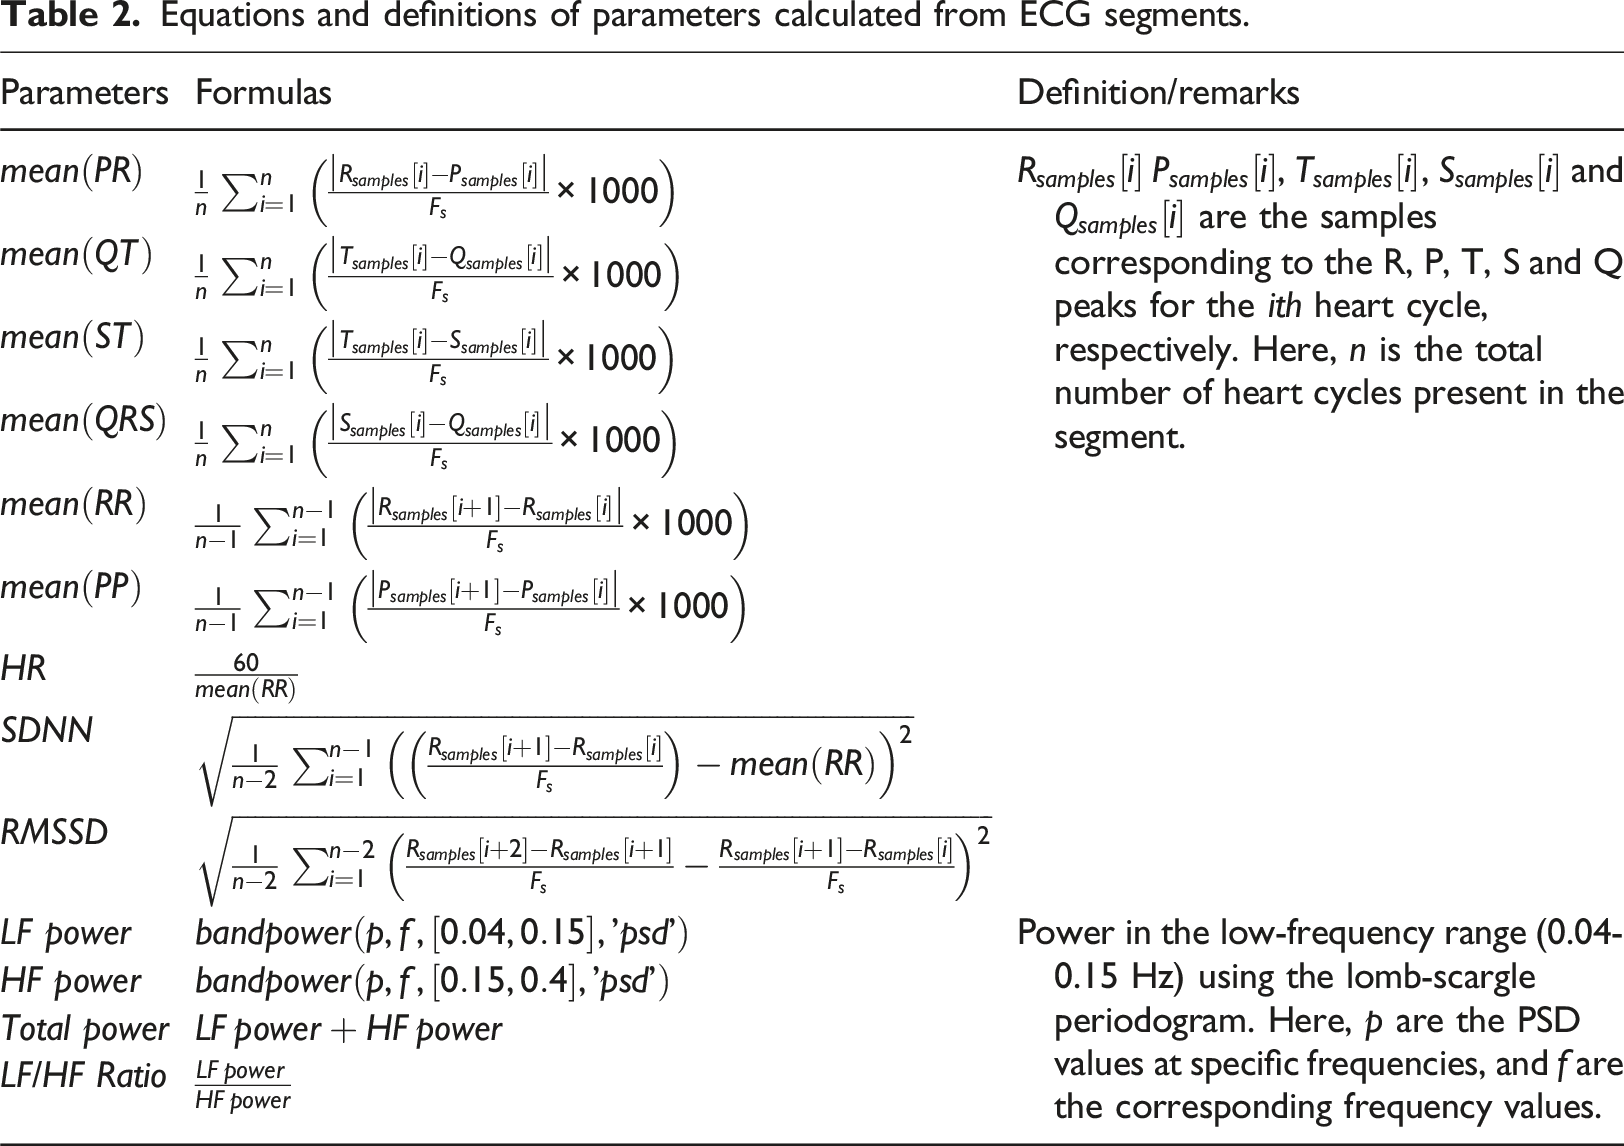
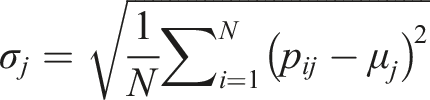
The mean ( Feature extraction of 1-h ECG data.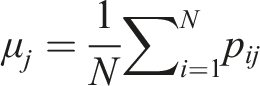
Feature selection
A ReliefF algorithm 52 was employed to rank the features within the dataset. To obtain the most appropriate number of features, the highest-ranked feature was the input to a support-vector machine (SVM) and its performance was obtained. This was repeated by incrementally adding the next ranked feature and repeated for all 26 features. The feature set with the highest accuracy was selected.
Classification
The ECG recordings of OSA patients were classified into two classes: with MDD (OSAD+) and with no MDD (OSAD-). An SVM classifier with an RBF kernel was employed for classification. Hyperparameters C and gamma were optimized using a grid search approach, exploring values from 2−1 to 27 for C and 2−3 to 24 for gamma, as these parameters have a strong influence on the performance of the classifiers.37,53 A leave-one-out (LOO) cross-validation method was used to evaluate the model’s performance. An incremental feature inclusion strategy was applied, progressively including top-ranked features and performing a grid search for each subset. This process identified the optimal feature set and hyperparameters, yielding the best-performing SVM model for the classification task. The model was evaluated based on different parameters such as accuracy, sensitivity, specificity, precision, NPV, F1, positive Likelihood Ratio (LR+) and negative Likelihood Ratio (LR-) calculated based on True Positive (TP), True Negative (TN), False Positive (FP) and Falise Negative (FN).
Once the optimum feature set was obtained, five other classifiers, namely: (i) XGBoost, (ii) KNN, (iii) Logistic Regression, (iv) Random Forest, and (v) Decision Tree, were also tested to determine which classifier could provide the best result.


Results
Summary of ECG segments analyzed for OSAD+ and OSAD- groups.
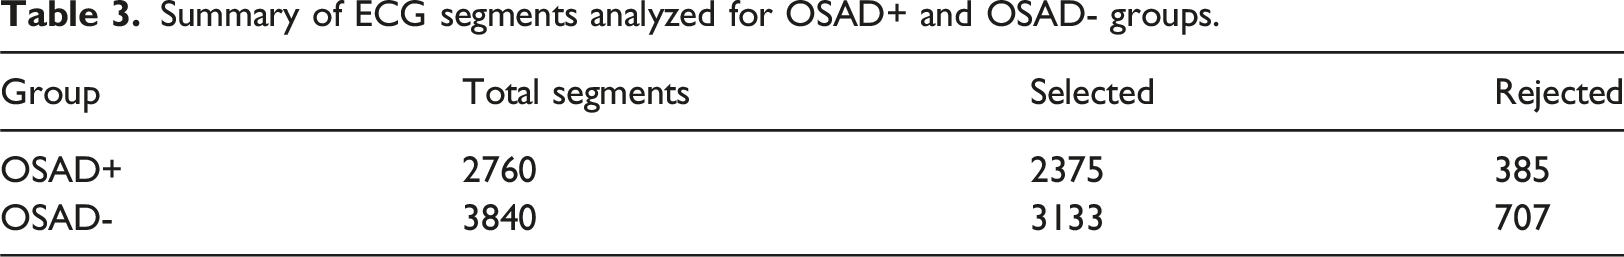
For the OSAD + group, out of 2760 total segments (from 23 subjects), 2375 segments were selected and 385 segments were rejected. For the OSAD- group, out of 3840 total segments (from 32 subjects), 3133 segments were selected, and 707 segments were rejected. These exclusions indicate that 13.94% of the segments in the OSAD + group and 18.41% of the segments in the OSAD- group were rejected.
The performance of the SVM model for screening MDD patients within the OSA cohort, i.e., OSAD+, is shown in Figure 4. When top-ranked features were introduced cumulatively to the model. The bar plot illustrates the classification accuracy achieved with cumulative top-ranked features ranging from 1 to 26. Each bar represents the accuracy of the SVM model using an increasing number of features, starting from the top-ranked feature and progressively adding more. Classification accuracy of the SVM model with cumulative top-ranked features.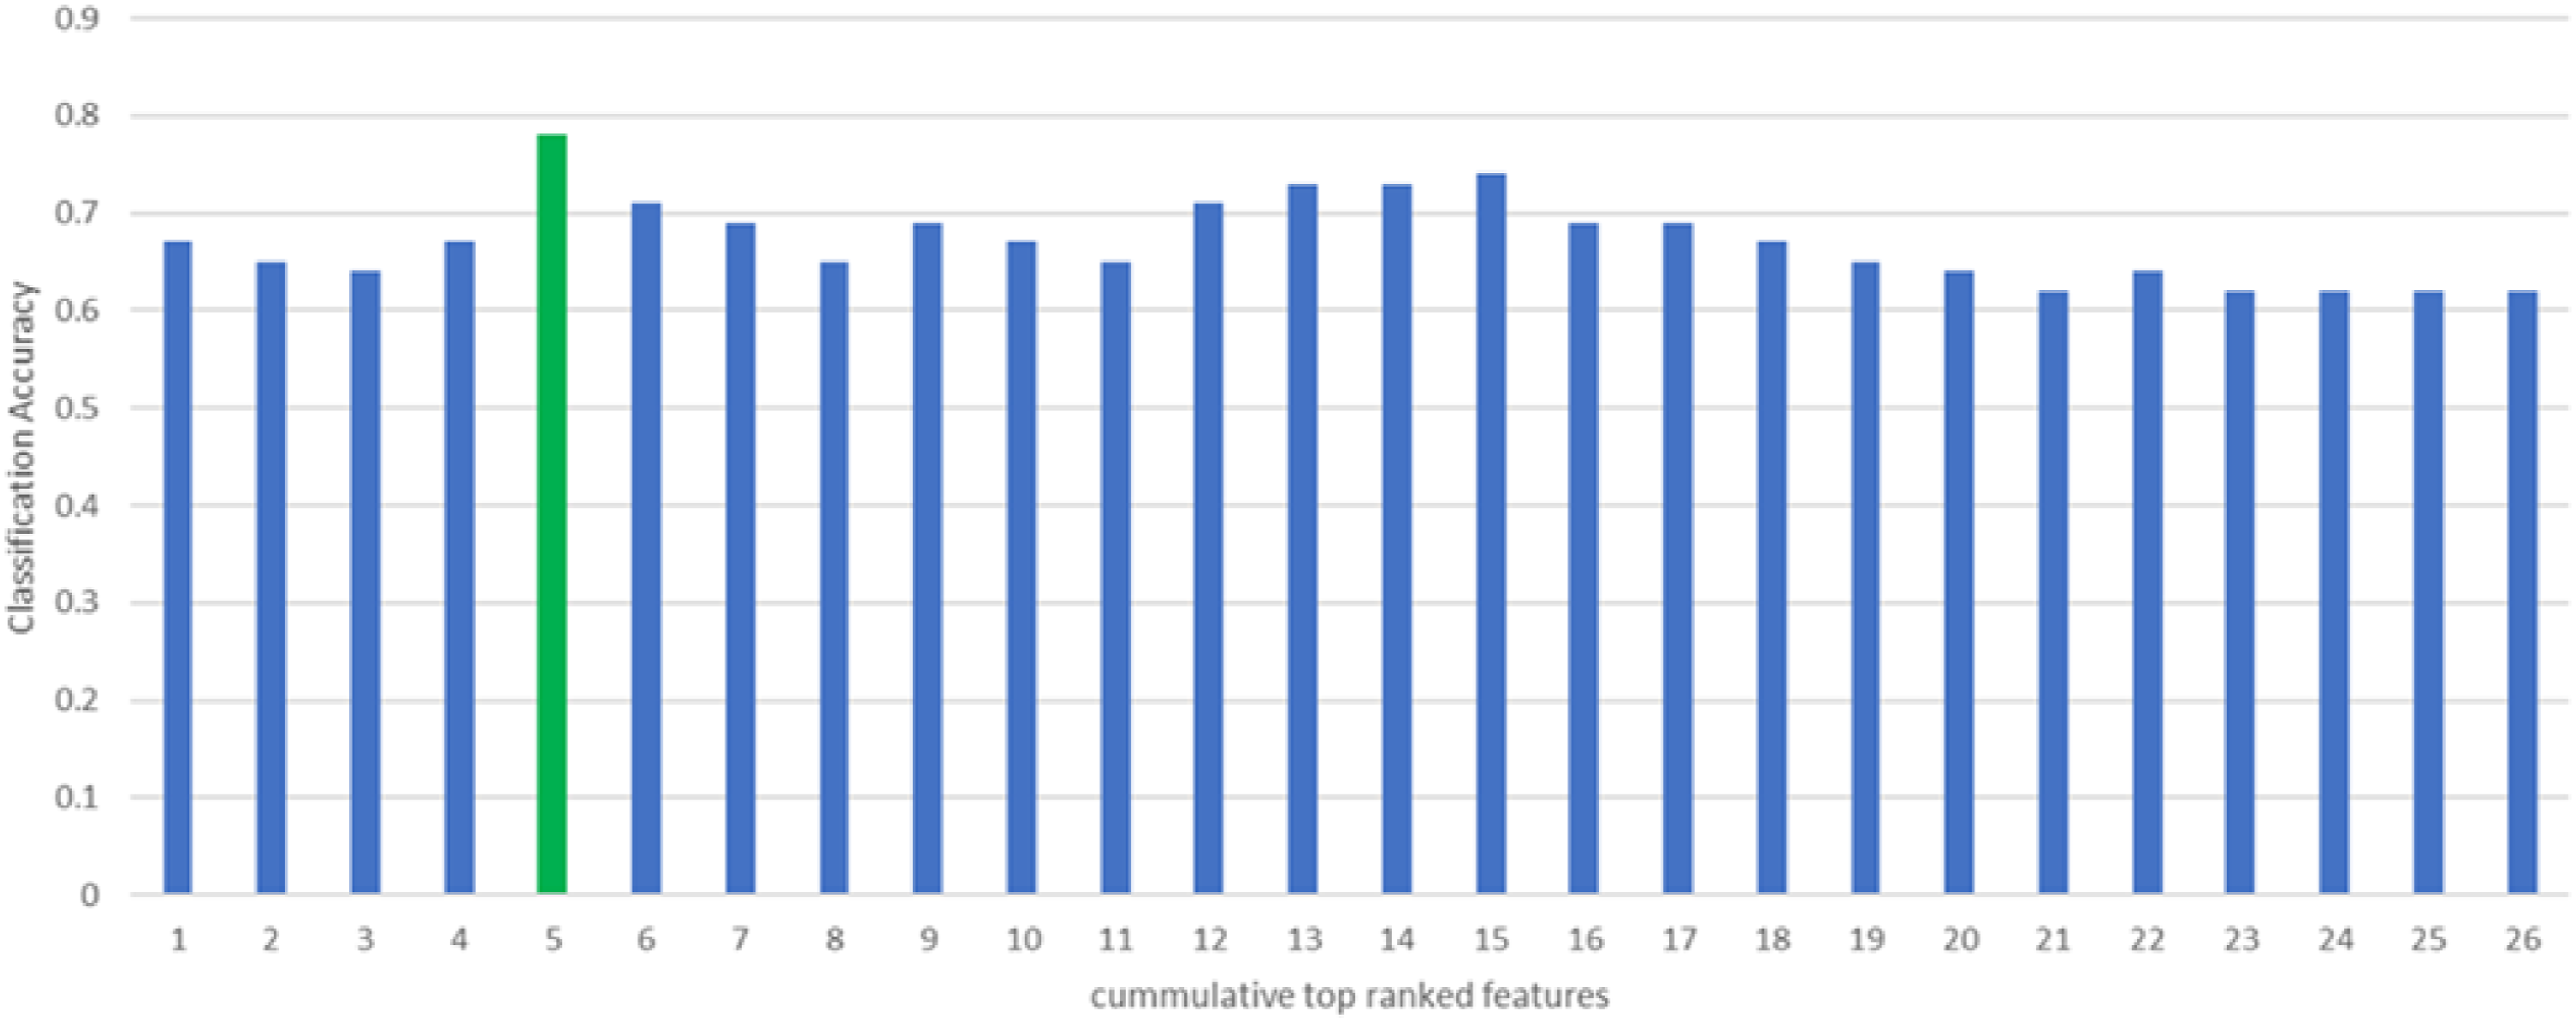
The highest classification accuracy of 0.78 is marked by a green bar, which corresponds to the inclusion of the top 5 features. For the top-ranked 5 features, the best parameters identified were C = 1 and gamma = 0.25. Including more features beyond this point does not lead to a significant improvement in accuracy; in fact, the accuracy tends to stabilize or even decrease slightly with additional features. This trend suggests that while the top 5 features provide the most relevant information for classification, adding more features may introduce noise or redundancy. This observation emphasizes that a smaller, well-chosen subset of features can lead to better classification outcomes compared to using a larger set of features indiscriminately.
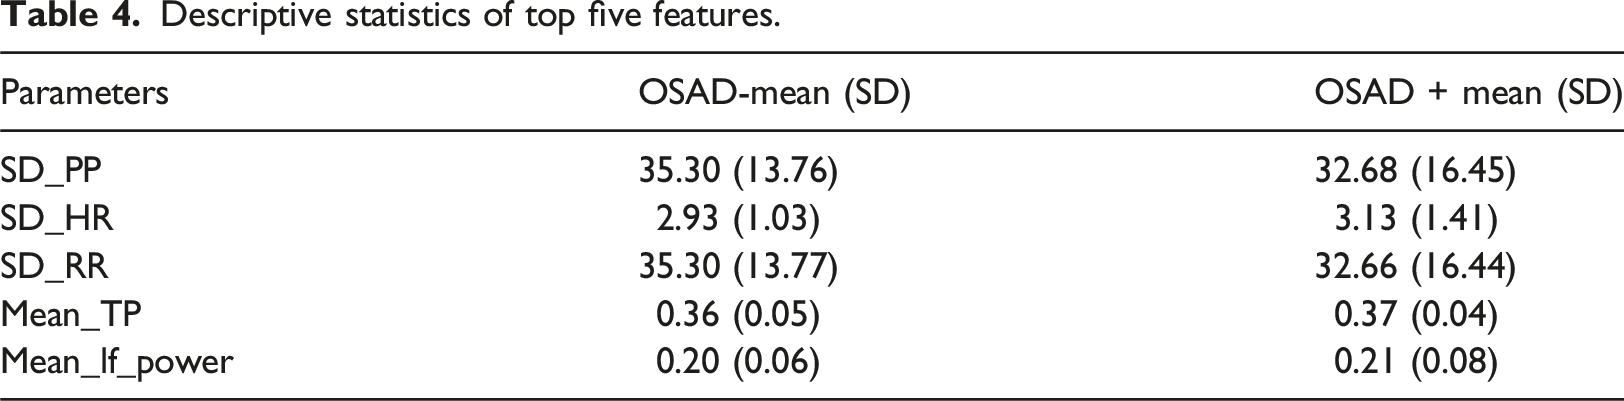
Descriptive statistics of top five features.
Performance metrics of various classifiers using the optimal feature set.

From Table 5, it is evident that the SVM model outperformed the other classifiers across all performance metrics. The best SVM model from grid-search resulted in 78.18% accuracy, 73.91% sensitivity, 81.25% specificity, and 73.91% precision. Figure 5 shows the corresponding confusion matrix for differentiating between the two groups. Confusion matrix for differentiating between OSAD- (OSA without MDD) and OSAD+ (OSA with MDD).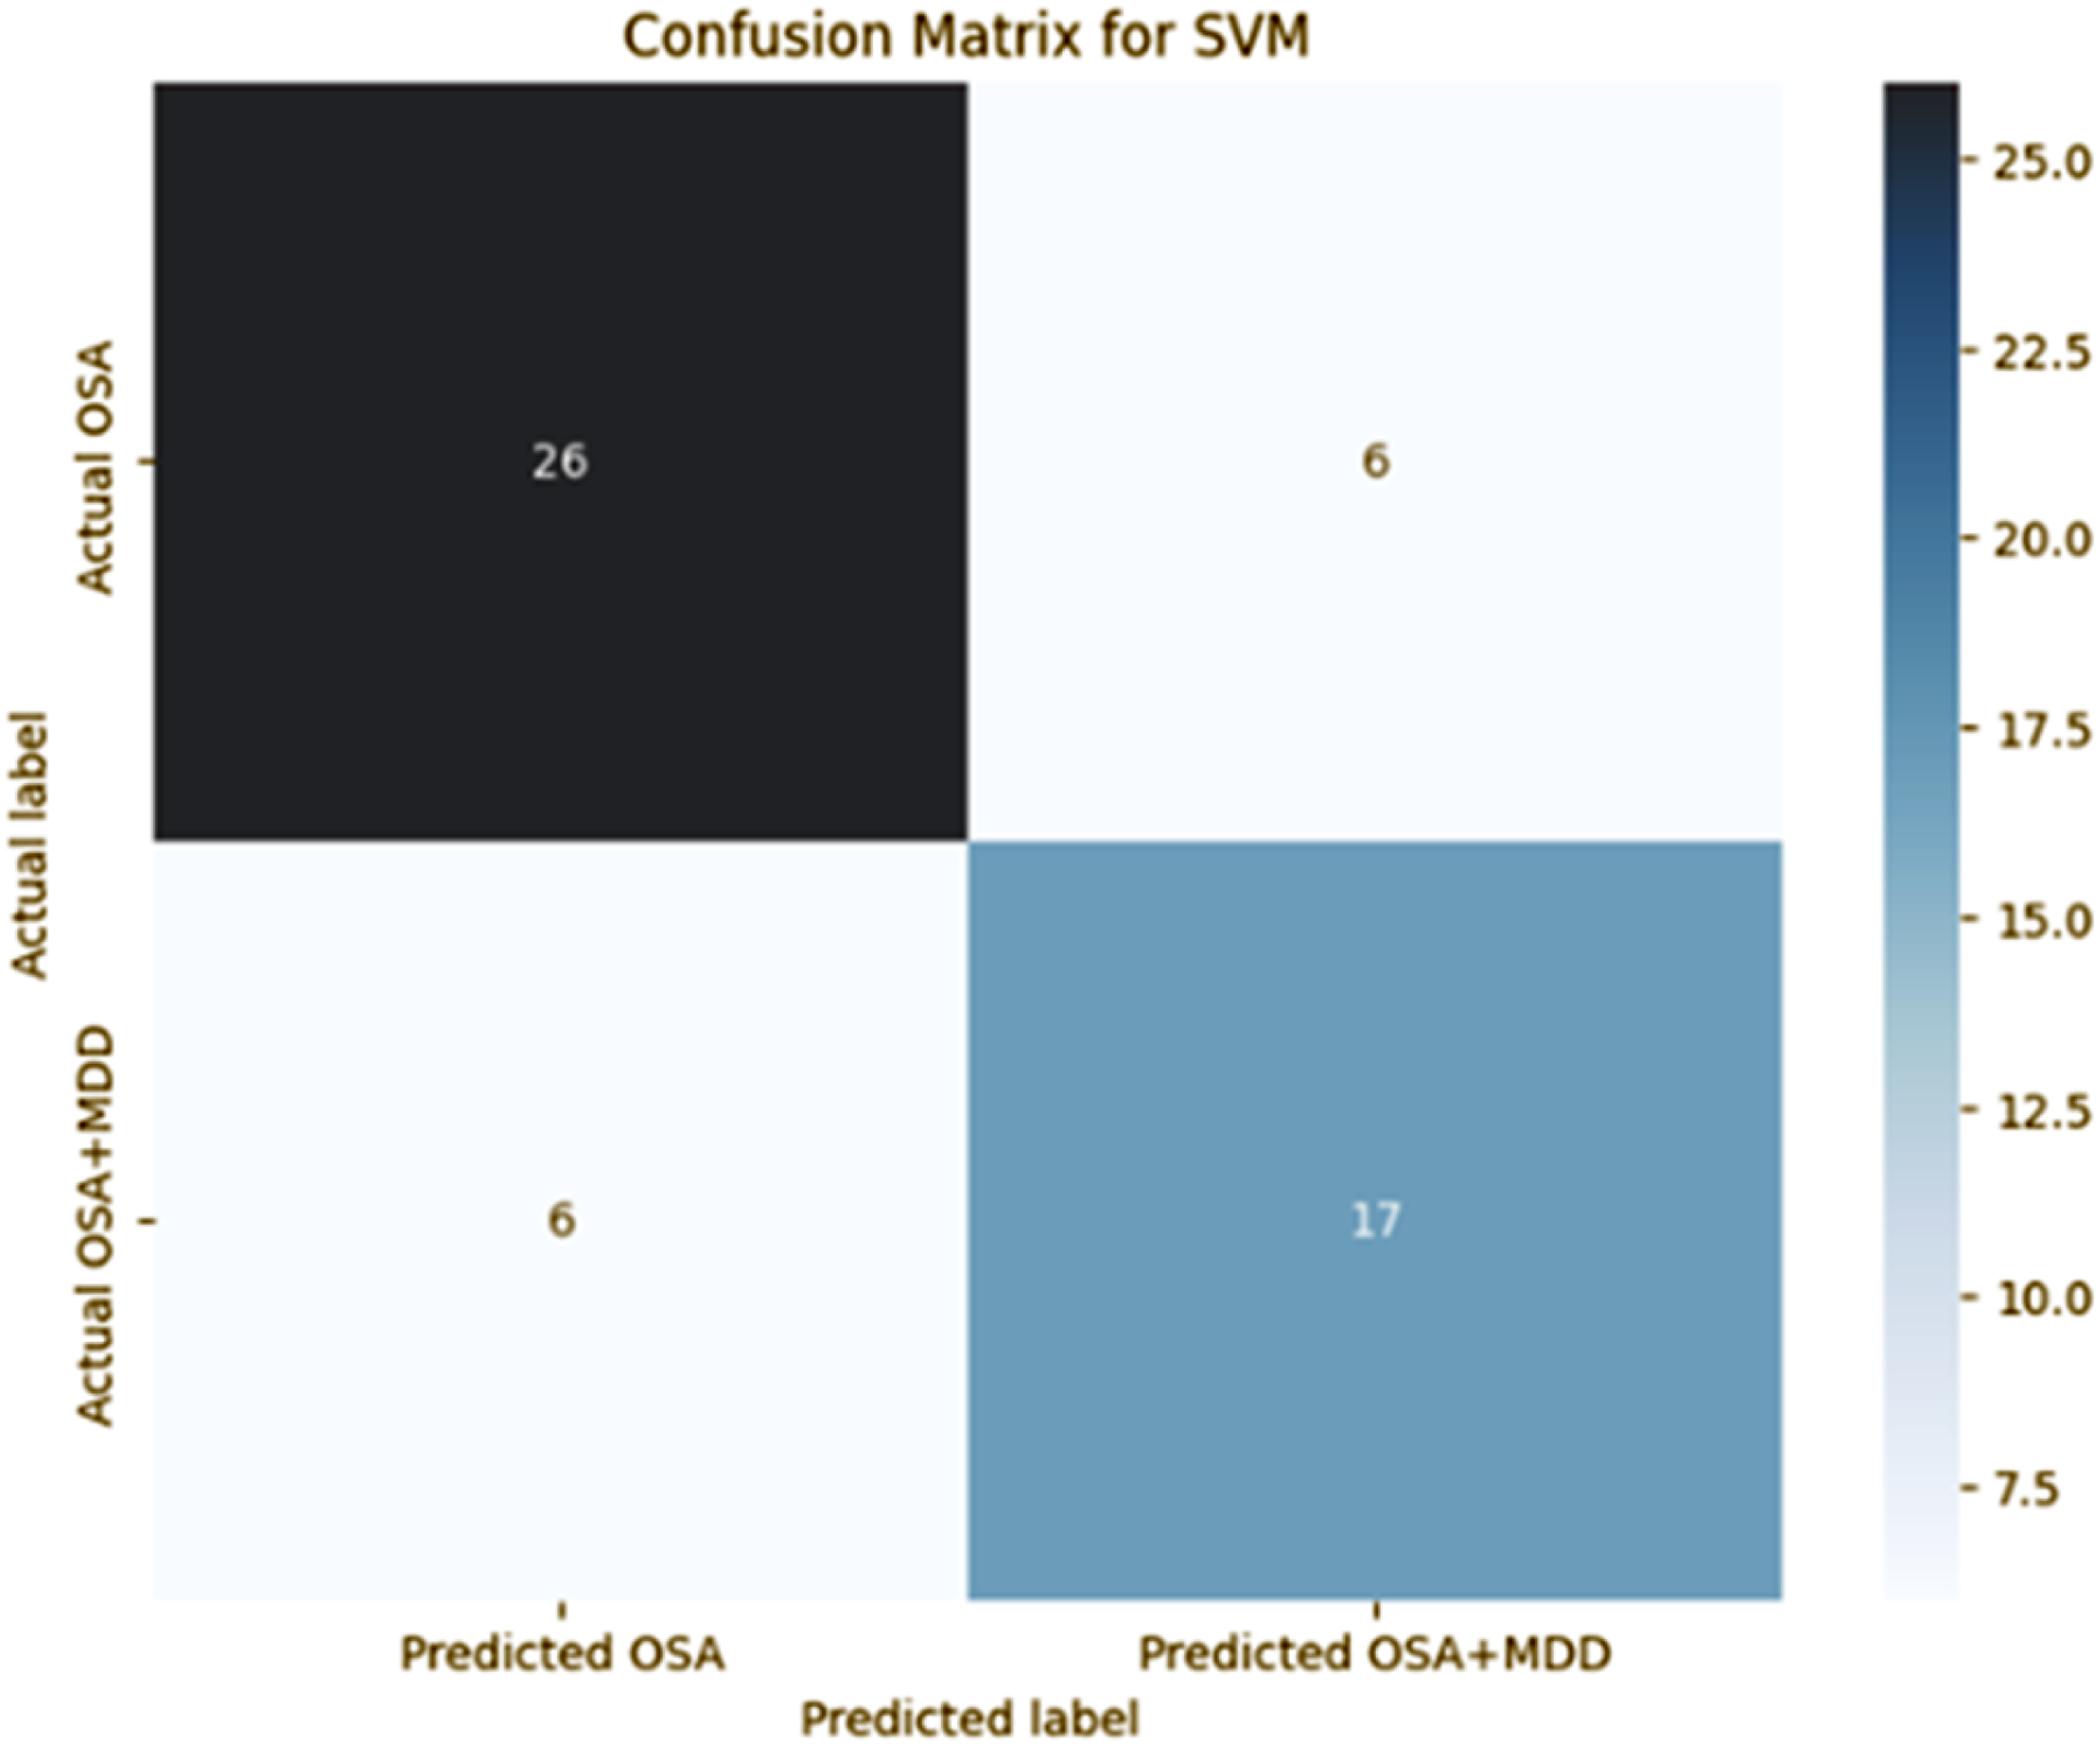
Discussion
The prevalence of MDD in the OSA population is estimated to be between 20-30%, with shared symptoms such as fatigue, sleep disturbances, and cognitive impairments.36,54,55 These commonalities often lead to the underdiagnosis of MDD in OSA patients, resulting in inadequate treatment and poorer health outcomes. Thus, there is a pressing need to screen for MDD in patients with OSA due to the high prevalence and overlapping symptoms of both conditions. Early screening for MDD in OSA patients is crucial, 56 as addressing both conditions simultaneously is essential for comprehensive care and improved patient outcomes. 57
In this study, we applied single-lead ECG to screen for MDD within an OSA patient group, expanding on previous research that focused on using ECG to differentiate OSA patients from healthy individuals. In addition, while earlier studies have examined OSA and MDD separately, this is the first to explore their coexistence using single-lead ECG, offering a more accessible and efficient screening tool.
Heart Rate Variability (HRV) analysis indicates the changes in autonomic function and is an indicator of OSA. OSA patients typically exhibit increased sympathetic activity and reduced parasympathetic modulation during apneic events, which can be captured through HRV metrics such as SDNN, LF/HF ratio, RMSSD, and entropy-based features like Approximate Entropy (ApEn) and Sample Entropy (SampEn). HRV analysis is also a well-established method for identifying autonomic dysfunction in MDD patients, with key features such as SDNN, RMSSD, LF/HF ratio, and HF power indicating reduced parasympathetic activity and increased sympathetic dominance. Leveraging this knowledge, we explored both HRV and interval-based features to develop a model capable of classifying ECG recordings of OSA patients into two categories: those with MDD (OSAD+) and those without MDD (OSAD-). This approach incorporates the known autonomic disturbances in both OSA and MDD, providing a comprehensive foundation for our classification model.
Current state of art for ECG analysis for detecting OSA and MDD
The use of ECG for detecting OSA has been proposed to reduce the burden of investigating patients in sleep clinics. Varon et al. 29 employed 80 single-lead ECG recordings to detect sleep apnea, with 70 sourced from the publicly available Apnea-ECG database and 10 obtained from the Sleep Laboratory of the University Hospital Leuven in Belgium. Zarei et al. 37 used 95 ECG recordings for obstructive sleep apnea detection, comprising 70 from the Apnea-ECG database and 25 from the UCD database. Atri et al., Li et al., and Mashrur et al.38–40 each used 70 ECG recordings from the Apnea-ECG database for OSA detection. Urtnasan et al. 41 utilized PSG data from 82 participants for the detection of OSA events and normal events.
Song et al. 58 used a discriminative hidden Markov model (HMM) to detect OSA and achieved an accuracy of 97.1%. Yücelbaş et al. 26 considered 16 ECG morphological features to identify sleep parameters and their accuracy was 78%. Yang et al. 28 implemented a one-dimensional squeeze-and-excitation (SE) residual group network, achieving an accuracy of 90.3% for per-segment detection in the Apnea-ECG database. Varon et al. 29 utilized 4 features from ECG recordings and employed a least-squares SVM (RBF kernel), achieving an accuracy of about 85% for per-segment OSA detection. Zarei et al. 27 utilized 108 entropy-based and non-linear features from wavelet transform coefficients, and OSA detection accuracies were 94.63% and 95.71% using SVM (RBF kernel) for per-minute and participant-based classifications, respectively. Atri et al. 38 extracted spectrum and bi-spectrum features from HRV and EDR signals, utilizing an SVM classifier to achieve an accuracy of 95.57%. Li et al. 39 employed a deep neural network and HMM model for OSA detection, attaining an accuracy of 85%. Convolutional Neural Network (CNN) and Long Short-Term Memory (LSTM) Network were used by Zarei et al. 27 The authors achieved an accuracy of 97.21% for the Apnea-ECG database and 95.82% for the UCD database. These studies have shown that there are significant differences between ECG of people with and without OSA and have also developed the baseline to facilitate the ECG analysis as an alternative to traditional sleep studies. Previous studies have demonstrated significant differences in ECG signals between individuals with OSA and healthy controls, identifying specific ECG markers such as variations in heart rate variability (HRV), changes in R-R intervals, and altered autonomic function indicative of OSA.
Kobayashi et al. 32 employed 23 participants (16 healthy and 7 psychiatric patients) to develop a Mental Disorder Screening System using an SVM model from single-lead electrocardiography, achieving a sensitivity of 71.4% and specificity of 93.8%. Khandoker et al. 21 used 61 participants (32 patients with MDD; 16 of whom had suicidal ideation) to predict depressed patients with suicidal ideation from ECG recordings, obtaining 94.83% accuracy in predicting MDD subjects with suicidal ideation. Byun et al. 33 employed a sample size of 78 individuals, consisting of 37 patients diagnosed with MDD and 41 healthy controls, to detect MDD using linear and nonlinear heart rate variability analysis, achieving 74.4% accuracy, 73% sensitivity, and 75.6% specificity with two optimal features selected by SVM-RFE. Tasci et al. 31 used 198 participants (62 bipolar, 17 depressions, 119 schizophrenia) for automatic psychiatric disorders classification using ECG signals. The lead-by-lead accuracy range of the proposed model using the ANN classifier was from 73.67% to 89.19%. Khare et al. 30 used 233 subjects taken from two publicly available datasets with the ECGPsychNet model for the automatic detection of psychiatric disorders (schizophrenia, bipolar disorder, and depression) using ECG signals. The developed ECGPsychNet obtained the highest classification accuracy of 98.15%. These studies have demonstrated the potential of employing ECG for the identification of mental disorders.
The association between OSA and MDD is known,2–4 and a number of self-presented symptoms by the patients of both categories such as fatigue, sleepiness during the day, poor concentration, and anxiety are often similar. It has also been found that individuals concurrently afflicted with OSA and MDD exhibit heightened susceptibility to cardiovascular disease. 35 However, no study has yet been reported that has attempted to use only ECG to detect comorbidity of MDD from the OSA cohort.
Our work in relation to state-of-the-art
In this study, we used single-lead ECG data of 55 participants (23 OSAS+ and 32 OSAS-) to create an SVM-based model to detect depression in OSA. After identifying the 5 highest ranked ECG features were: (i) SD-HR, (ii) SD-PP, (iii) SD-RR, (iv) Mean-TP, and (v) Mean-LF-Power. With an accuracy of 78.18%, sensitivity of 73.91%, and specificity of 81.25%, these findings indicate the potential for utilizing this method to screen OSA patients for the detection of MDD. Single-lead ECG can be easily recorded using standard Holter monitors and thus can be conducted in the homes of the patients without requiring access to sleep clinics. The current method for detecting MDD in OSA individuals requires the use of sleep clinics and PSG and no method uses only ECG for this purpose. Ours is the first study that reports the use of only ECG for this aim and the performance is moderate.
The major limitation of this study is that it is based on the data collected in a single clinic. The dataset is relatively small which was obtained by a cross-sectional study, and hence factors such as the effect of ethnicity and demographics could not be investigated. Further, the dataset does not have information such as diet, alcohol consumption, and exercise, which could help improve the accuracy of such a model. Another limitation of this work is that the detection of the noisy segments was done manually. It is essential to automate the detection of noisy segments for this approach to be suitable for computerized analysis. One of the factors that may influence the ECG is the medications taken by the individuals such as selective serotonin reuptake inhibitors (SSRIs) which are known to lead to QT prolongation potentially. 59 However, the database does not provide this information, which is a limitation of this study. Yet another limitation of this work is that the assessment of the patients was not done by cardiologists, thus the pathophysiology underpinning the differences between the two groups cannot be explored.
Conclusion
In this study, we have developed and tested an ECG-based system that can identify MDD patients in a cohort of people with OSA. We have identified the five most relevant ECG parameters, and our system’s performance includes an accuracy of 78.18%, sensitivity of 73.91%, specificity of 81.25%, and precision of 73.91%. This model has the potential to be used for screening MDD patients among OSA patients based solely on using their single-lead ECG which makes it suitable for being used in the homes of the patients.
Footnotes
Author contributions
VS- data analysis and first draft; QN- result analysis and editing; NP- data analysis; GO- data analysis; AK- data management and editing; PM- editing; DP- editing; DK- project planning and editing.
Declaration of conflicting interests
The author(s) declared no potential conflicts of interest with respect to the research, authorship, and/or publication of this article.
Funding
The author(s) disclosed receipt of the following financial support for the research, authorship, and/or publication of this article: The work has been supported in part by PhD scholarship received by Vikash Shaw and Guilherme Oliveira, a grant from Khalifa University (8474000376 (KAU-KU-2021-02 awarded to Ahsan Khandoker)), and a grant from ICMR Delhi, India (5/3/8/34/ITR-F/2020-ITR 1).
Ethical statement
Data availability statement
The de-identified data will be made available on request to the corresponding author.