
Abstract
Introduction
Coronavirus Disease 2019 (COVID-19) has caused untold suffering and hardship around the world over the past 2 years. It has led to millions of deaths and left hundreds of millions of people with permanent medical complications. Moreover, it continues to have a massive economic impact and has been the cause of much social disruption and unrest. Millions of enterprises are on the brink of collapse, and nearly 1.76 billion of the global workforce are struggling to make ends meet. 1 Moreover, worldwide poverty and undernourishment levels are at unprecedented highs. 2
Never before have so many of the world’s researchers focused so urgently on a single topic.3,4 Together, they have made extraordinary progress in tackling COVID-19, most notably through the development of numerous effective vaccines and drugs. Among the various techniques currently available for COVID-19 diagnosis, rapid antigen/antibody tests, immunoenzymatic serological tests, and RT-PCR-based molecular tests are the most commonly used. However, radiological investigations, such as chest X-rays (CXRs) and computed tomography (CT), have also proven to be effective in diagnosing COVID-19 pneumonia. 5
The deep learning field has undergone remarkable development in recent years and now routinely deployed for many applications and services. Convolutional neural networks (CNNs), in particular, have achieved great success in performing the classification and segmentation of all kinds of medical images, including magnetic resonance imaging (MRI), 6 microscopy, 7 CT, 8 ultrasound, 9 X-ray, 10 and mammography. 11 Many methods based on deep transfer learning have been proposed for the detection of lung diseases from CXRs. For example, Hashmi et al. 12 proposed a weighted classifier method for pneumonia detection with the achieved classifier accuracy of 98.43% and the area under the receiver operating characteristic (AU-ROC) score of 99.76 when applied to a pneumonia dataset consisting of 5836 images from the Guangzhou women and children’s medical center. Pham 13 used an ImageNet model to detect COVID-19 in CXRs and showed that the performance obtained using a transfer learning approach was at least as good as that obtained by training the model from scratch. Ibrahim et al. 14 proposed the pretrained AlexNet model to classify COVID-19 with non-COVID thoracic pathologies and healthy examples based on CXRs obtained from different sources with achieved accuracies above 91% on different classification tasks. Jain et al. 15 conducted experiments with three deep learning models (i.e., InceptionV3, Xception and ResNeXt) on 6342 CXR scans that were collected from Kaggle repository with the accuracy of three models above 93%. Zhang et al. 16 achieved a sensitivity of 71.70% and AUC of 83.61% on the X-COVID dataset using a confidence-aware anomaly detection model trained with the X-VIRAL dataset. Celik 17 achieved an 99.84% accuracy in multiclass classification using CovidDWNet + GB trained on different datasets containing CT images. Moreover, Duong et al. 18 investigated the detection performance of ResNet50 and achieved an accuracy and precision of around 91.93 and 92.3%, respectively, together with a recall of 0.952 and F1-Score of 0.938 on different CXRs sources.
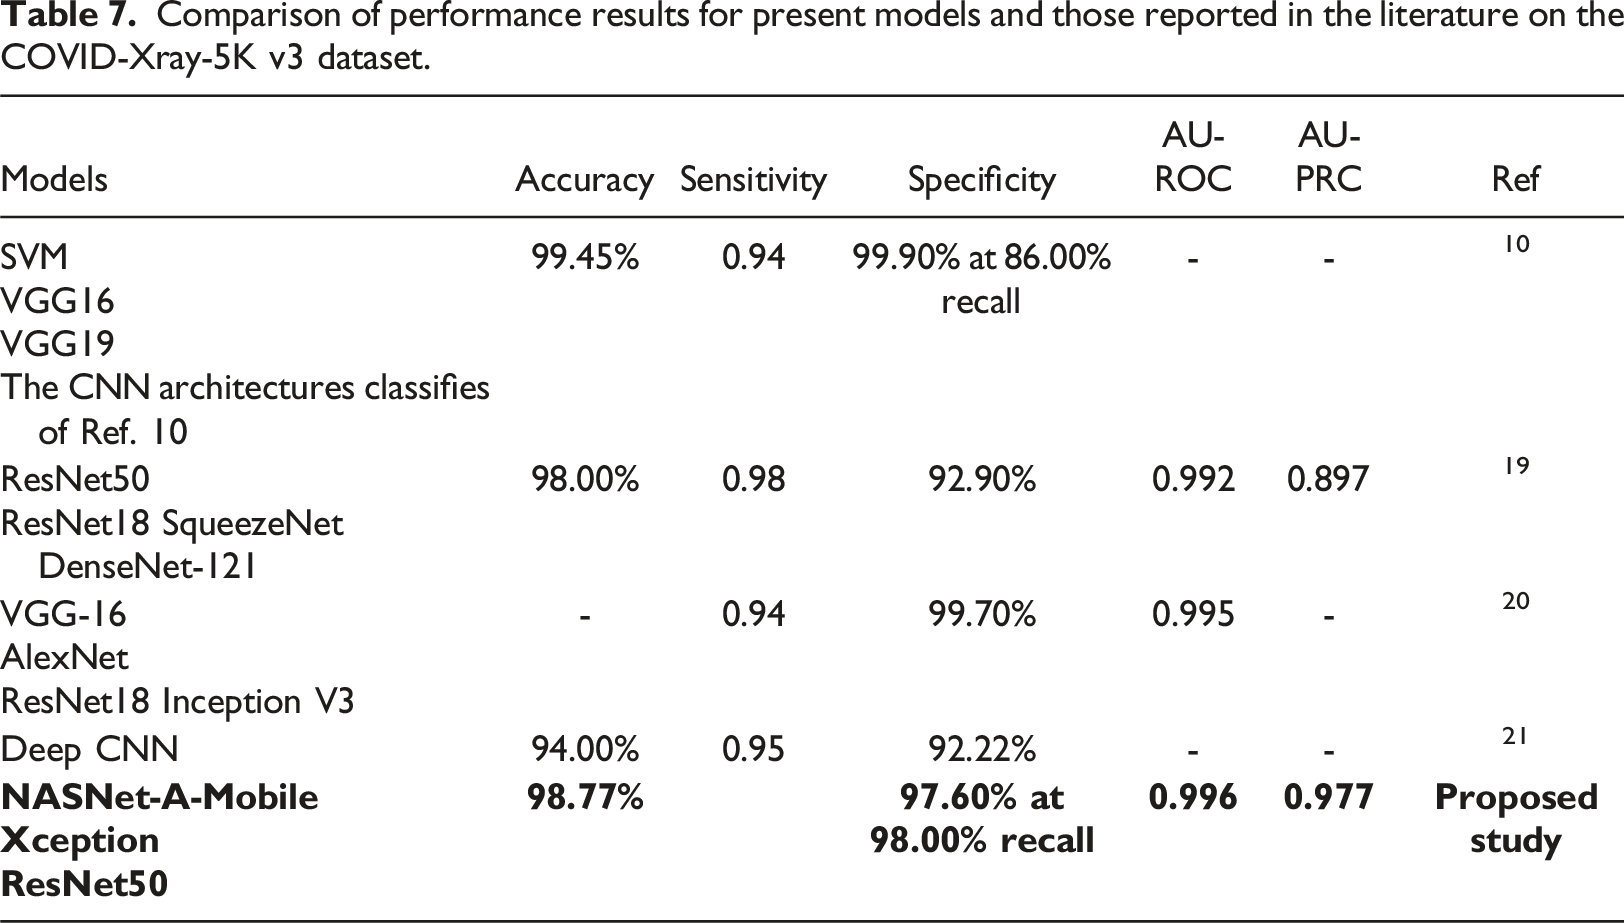
The present study proposes a robust pipeline for the training and evaluation of deep learning models to detect COVID-19 in posterior-anterior CXRs. Each stage of the proposed pipeline is individually investigated and optimized. The feasibility of the pipeline is demonstrated by performing COVID-19 binary classification on the COVID-XRay-5K v3 dataset provided by Minaee et al. 19 Three pre-trained models (ResNet50, NASNet-A-Mobile and Xception) are repurposed for this task with the help of transfer learning. The proposed pipeline incorporates several key strategies for mitigating the effects of dataset imbalance, including (1) using the area under precision-recall curve (AU-PRC) as the primary training metric, (2) performing hyperparameter tuning with k-fold cross-validation and Bayesian optimization, (3) adopting early stopping during model training, and (4) performing threshold moving. The performance of the trained models is evaluated on a control group and compared with that of several other models reported in the literature for the same COVID-XRay-5K v3 dataset. For example, Naviwala et al. 20 achieved an AU-ROC score of up to 0.995 while Sadeghi et al. 21 obtained a maximum accuracy of 98.32% and a 98.82% recall at 95.26% specificity. In addition, Kumar et al. 10 achieved an accuracy of 98.25% and an 86% recall at 99.9% specificity.
Materials and methodology
Figure 1 shows the training and evaluation pipeline proposed in the present study. As shown, the pipeline consists of four main stages, where each stage serves as a foundation for the next. In the first stage, data splitting is used to prepare a well-organized, stratified-split dataset, and an augmentation technique is employed to ensure that the trained models are robust to overfitting. A hyperparameter tuning process, involving k-fold cross-validation and Bayesian optimization, is then applied to tune the hyperparameters of each of the selected models in such a way as to optimize the training performance. In the third stage, the models are trained using these optimized hyperparameters, together with early stopping and threshold moving methods to obtain well-trained models without overfitting. Finally, the performance of the trained models is evaluated on a control group and compared with that of previous models reported in the literature. Experimental pipeline for training and evaluating the proposed models.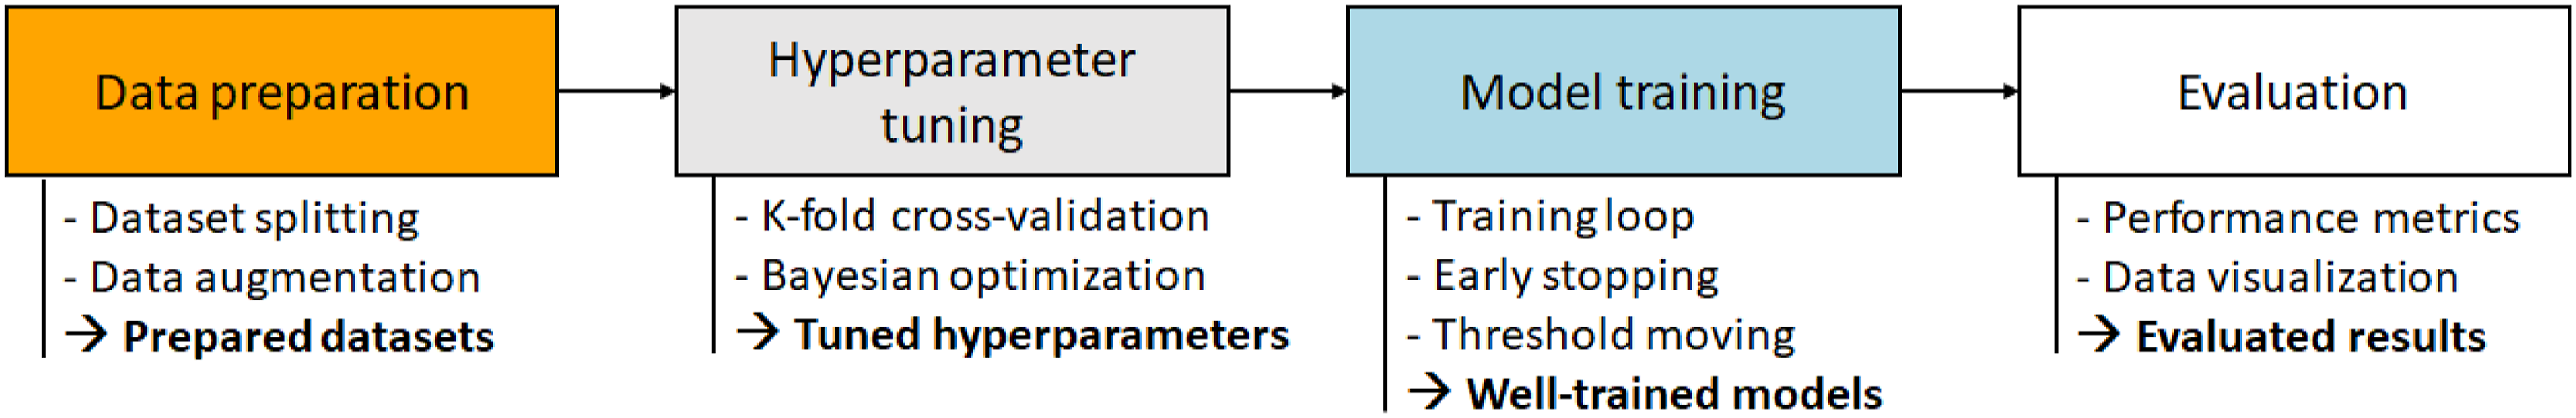
Data preparation
The present study used the COVID-XRay-5K v3 dataset
19
for training and evaluation purposes. Figure 2 presents some typical CXR images within the dataset. 5000 COVID-19 negative images were uniformly sampled from CheXpert dataset.
22
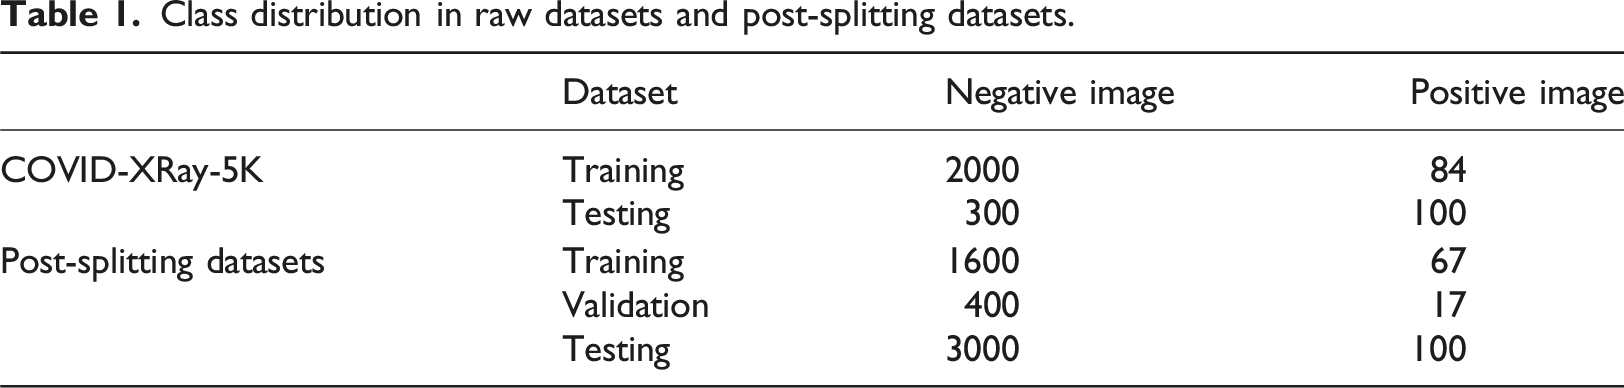
184 COVID-19 positive images were additionally extracted where these images showed clear evidence of COVID-19 and were annotated with labels accordingly by a board-certified radiologist. The detail description of dataset is shown in Table 1. The extracted images were divided into a training set consisting of 2000 negative images and 84 positive images and a testing set containing 3000 negative images and 100 positive images. This dataset suffered an imbalance problem with an average negative-to-positive sample ratio of approximately 27:1. The training dataset described above was further split into two subsets: a smaller training set and a validation set. As also shown in Table. 1, the splitting procedure was implemented in a stratified manner (optimally preserving a 2000:84 negative-positive ratio), with a training:validation split ratio of 80%:20%. Representative CXR images extracted from COVID-XRay-5K v3 dataset. Class distribution in raw datasets and post-splitting datasets.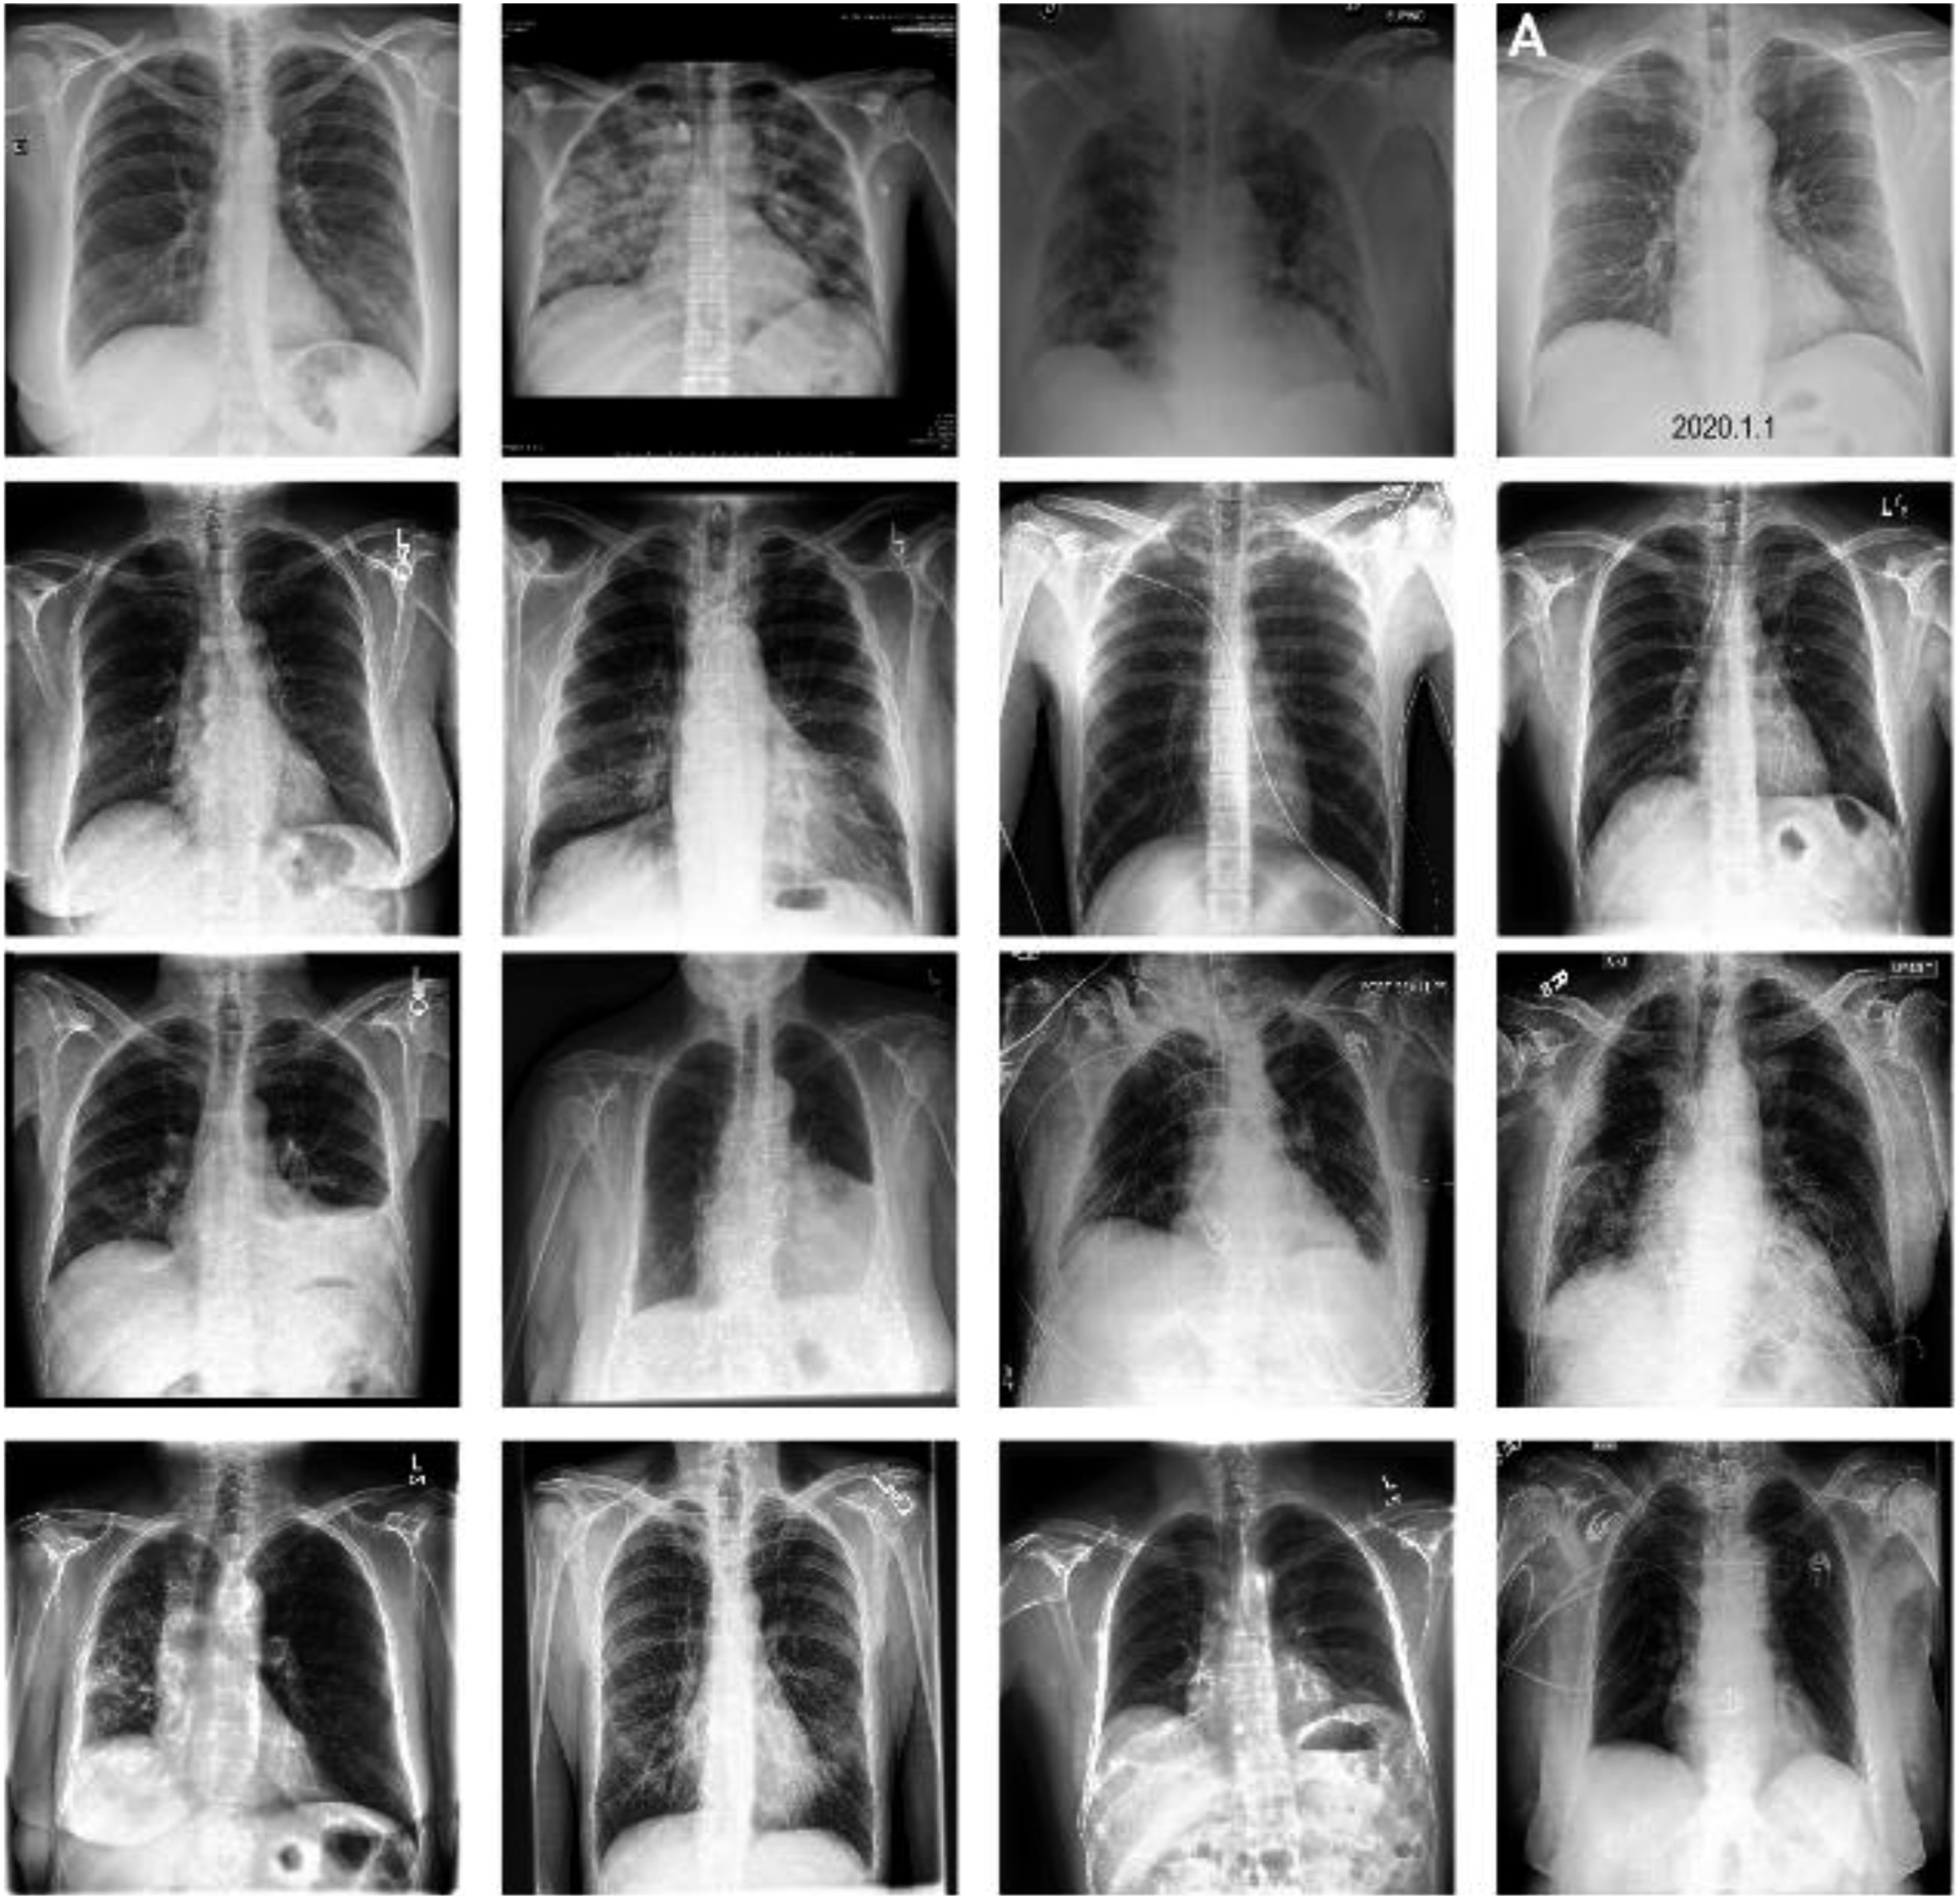
In the first stage of the proposed pipeline (see Figure 1), data augmentation was performed to avoid overfitting and improve the generalization of the models to new data. As shown in Figure 3, all of the images were initially resized to 256 × 256 pixels. Thereafter, the training images were processed by 224 × 224 random cropping, random rotation in range [−10°, +10°] and random horizontal flips to mimic the variations naturally occurring in practical CXR scenarios. By contrast, the images in the validation set and test set were processed only by 224 × 224 center cropping to ensure identical augmented outputs between different runs, and accordingly, consistent validation results. A normalization process was applied to each image based on the custom mean and standard deviation values derived from the original dataset
19
, that is, Data augmentation process.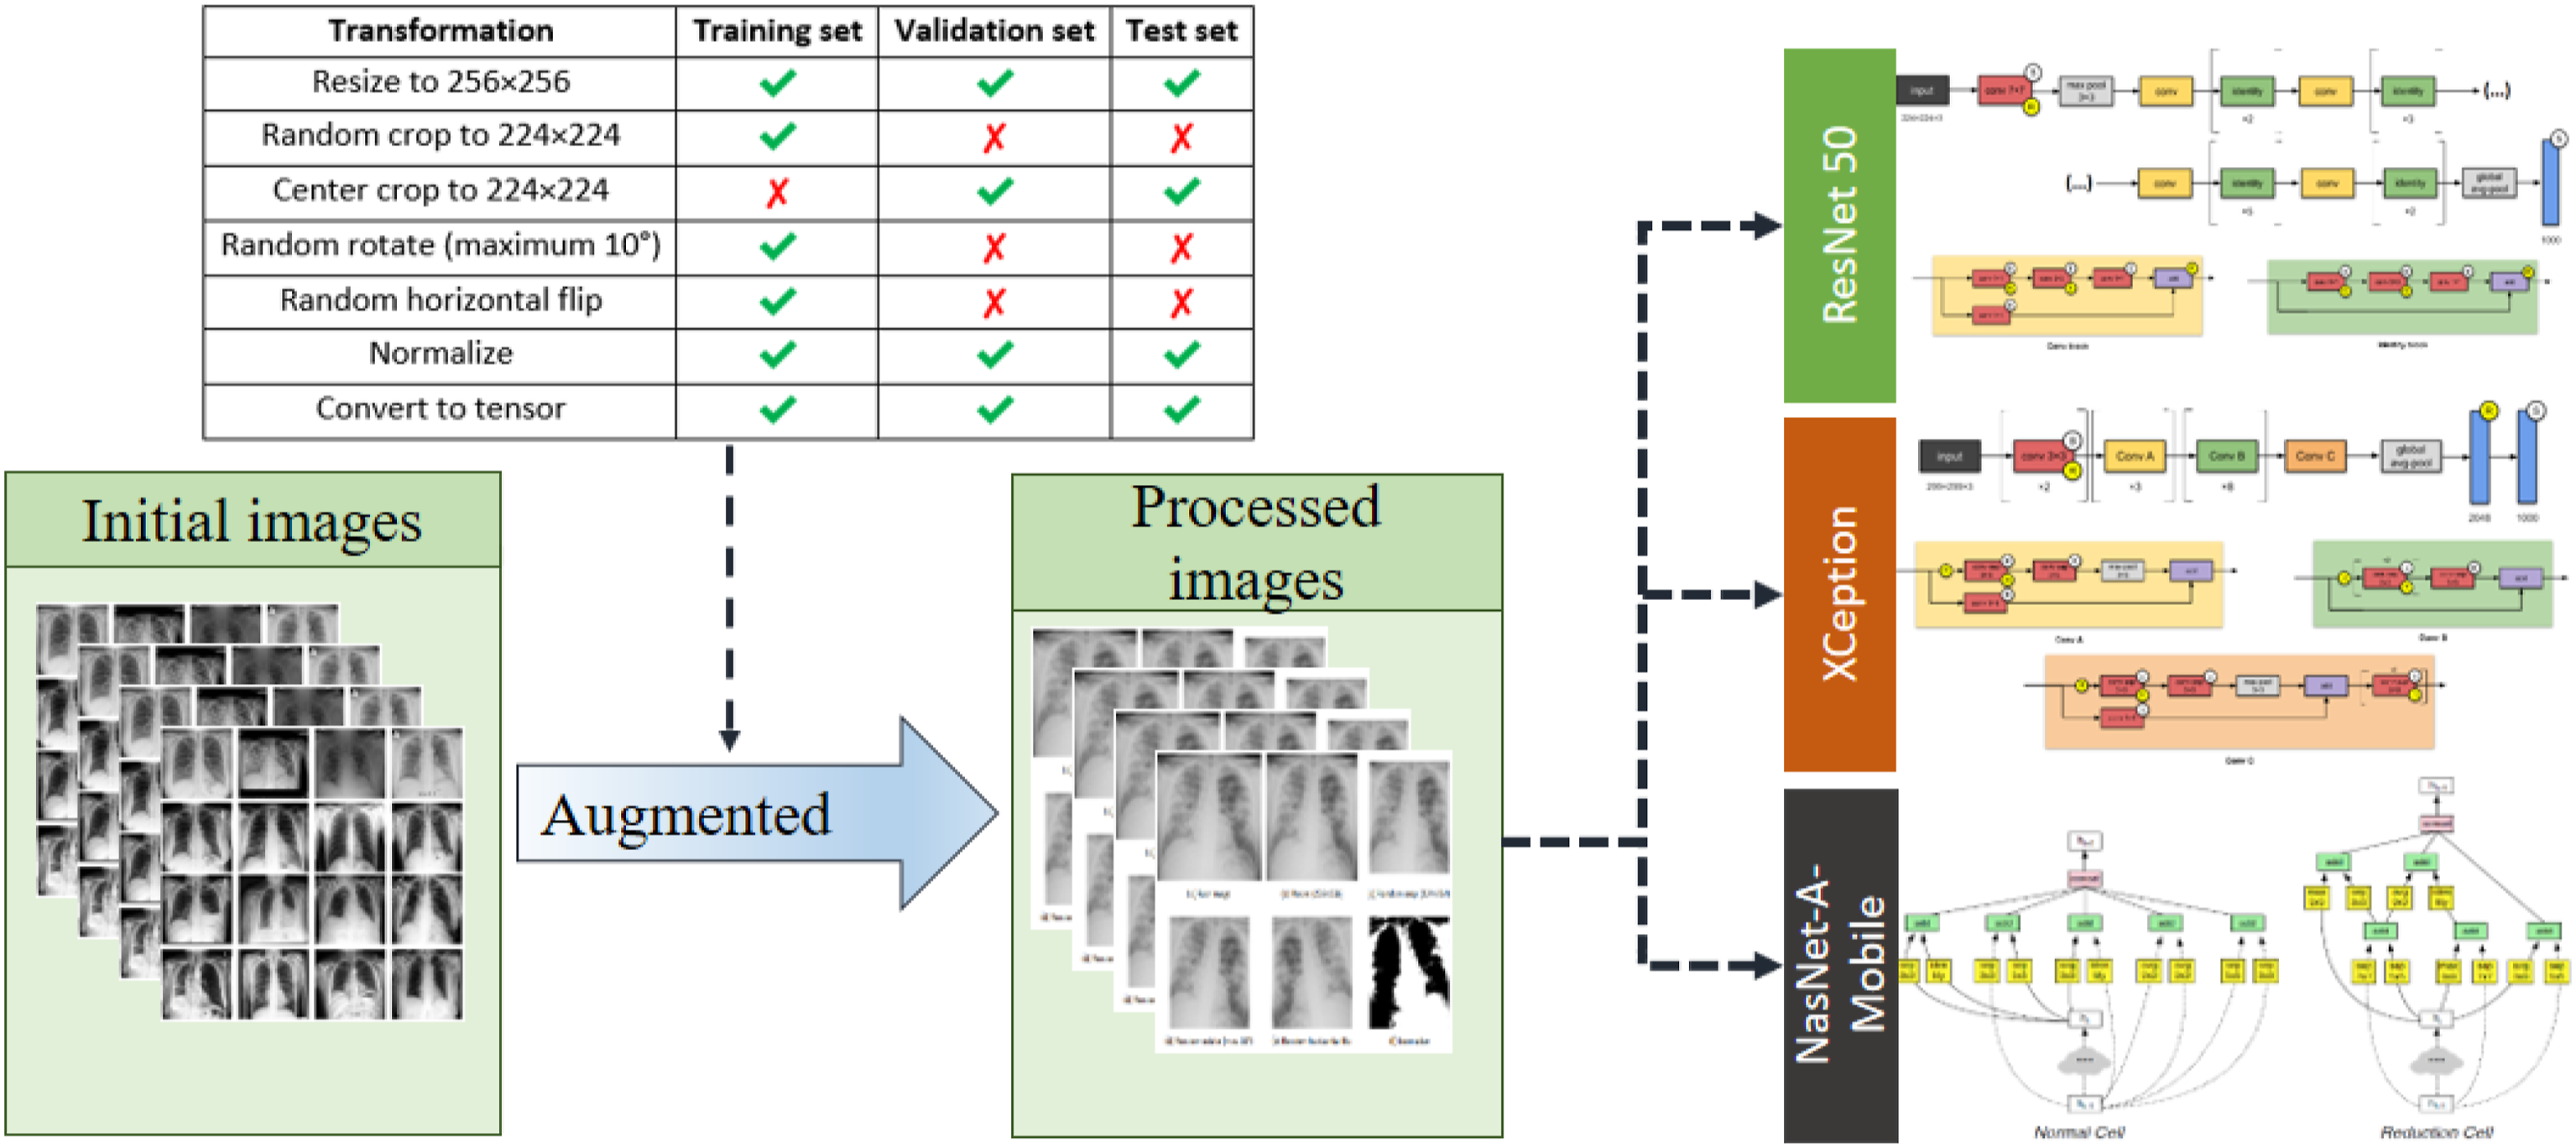
The models selected in the present study (two moderate-sized models ResNet50 23 and Xception, 24 less than 30M parameters each, and a small-sized model NASNet-A-Mobile, 25 with less than 6M parameters) were deliberately chosen based on their competitive evaluation scores within the relative size range. All of these models have been pre-trained and benchmarked on ImageNet. 26
Hyperparameters
The optimal set of training hyperparameters for each model was determined through Bayesian optimization 27 and k-fold cross-validation, respectively. It is noted that these steps require five additional non-tunable hyperparameters, namely the number of epochs, the number of folds, the number of trials, the configurations of the Bayesian utility function (kappa and xi), and the pbounds. The cross-entropy function and area under the precision-recall curve (AU-PRC) were chosen as the loss function and primary evaluation metric, respectively, for both hyperparameter tuning and training.
Performance evaluation metrics
The area under the precision recall curve (AU-PRC) was selected as the primary metric to be optimized on account of its exceptional advantages of overcoming imbalanced datasets and being independent of the threshold.28,29 It is noted that the AU-PRC was used as the primary training metric to pick the best weights for the proposed models in training process and tried the different thresholds to achieve the higher performance. Moreover, the hyperparameters for each model was optimized by using Bayesian optimization. So that the class weighting or sampling technique was not applied in this study. The original training set was divided into training and validation set for training process and keep the original testing set unchanged (see Table 1).
The confusion matrix is a table summarizing the number of true positives (TP), false positives (FP), false negatives (FN), and true negatives (TN) for a particular model when comparing the groundtruth labels and the corresponding predictions in the sample space.
Five metrics can be derived from the confusion matrix, namely:


It is worth noting that when the decision threshold is shifted, all four numbers of TP, FP, TN, FN might vary. Thus, the metrics in equations (1), (2), (3), (4) and (5) are subject to change in a threshold-moving problem.
Experimental setup
Hyperparameter tuning
The hyperparameter tuning process was implemented as a loop of two black-box functions connected end-to-end, namely model evaluation with k-fold cross-validation and global optimization with Bayesian optimization (see Figure 4). The loop was repeated iteratively until the desired score was obtained, at which point the current values of the model hyperparameters were harvested as the tuning output. Schematic illustration of hyperparameter tuning process. Two evaluation models namely model evaluation and global optimization were employed for getting optimization hyper parameters.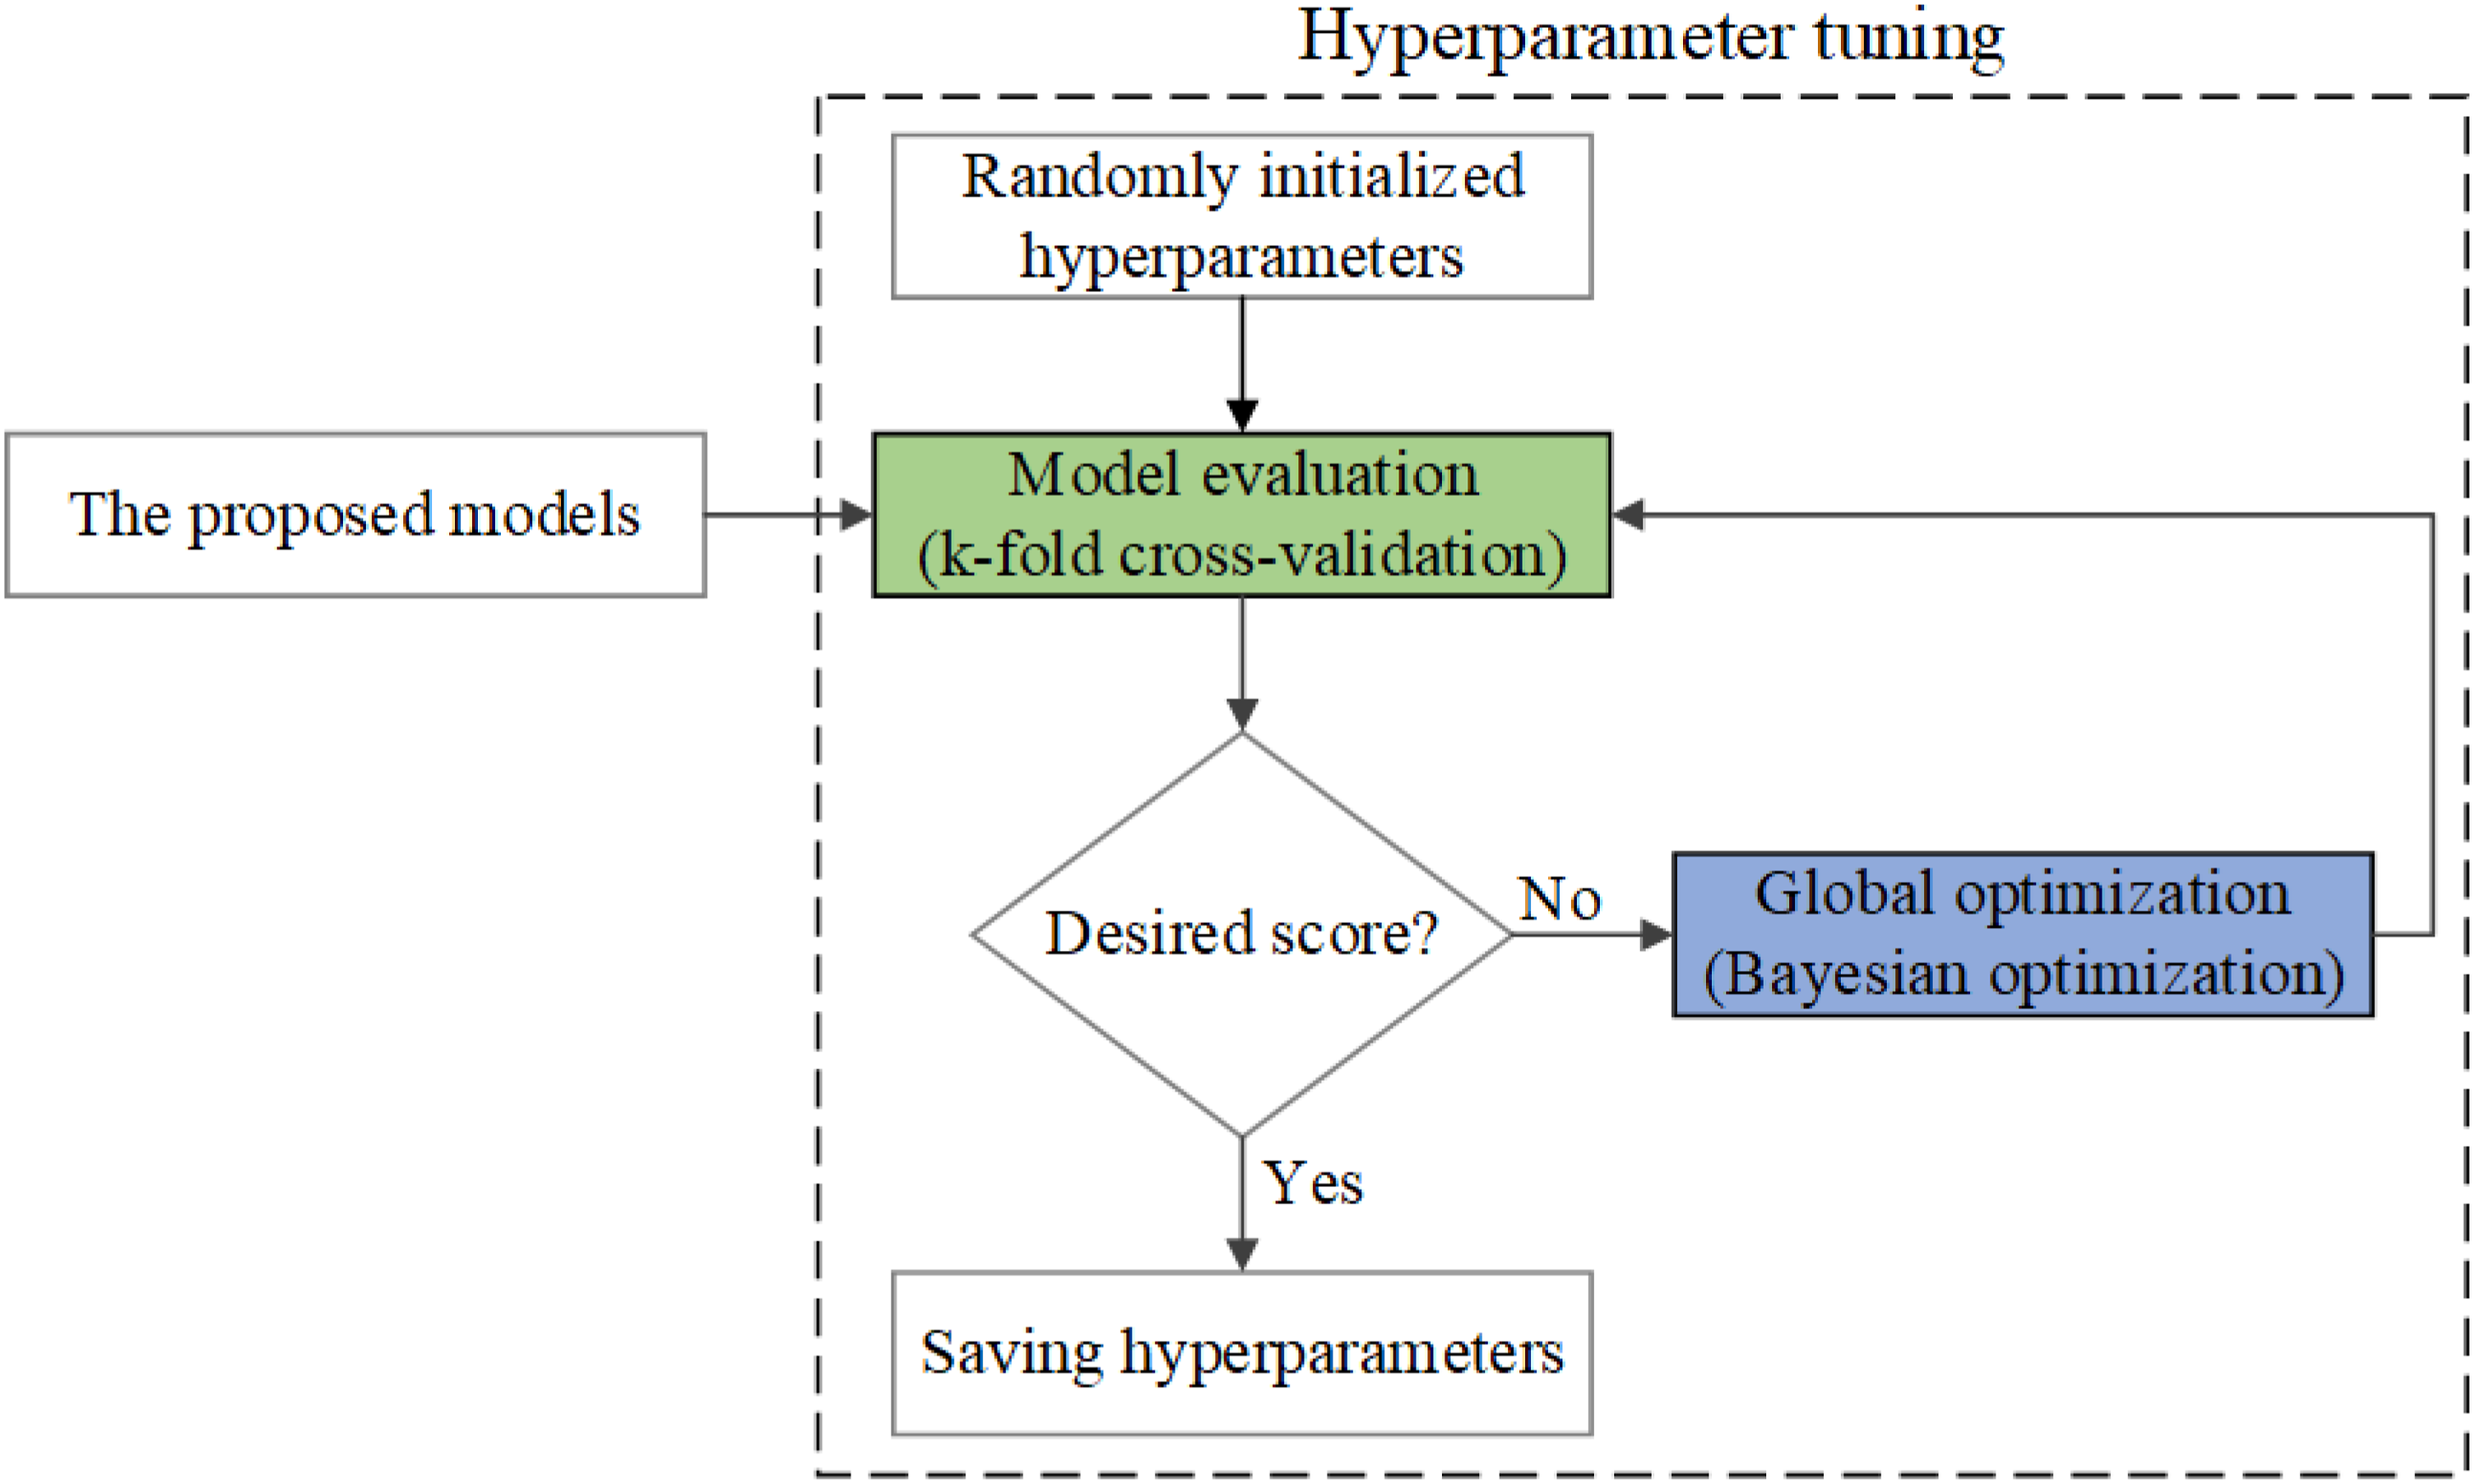
Tunable hyperparameters and their bounds.
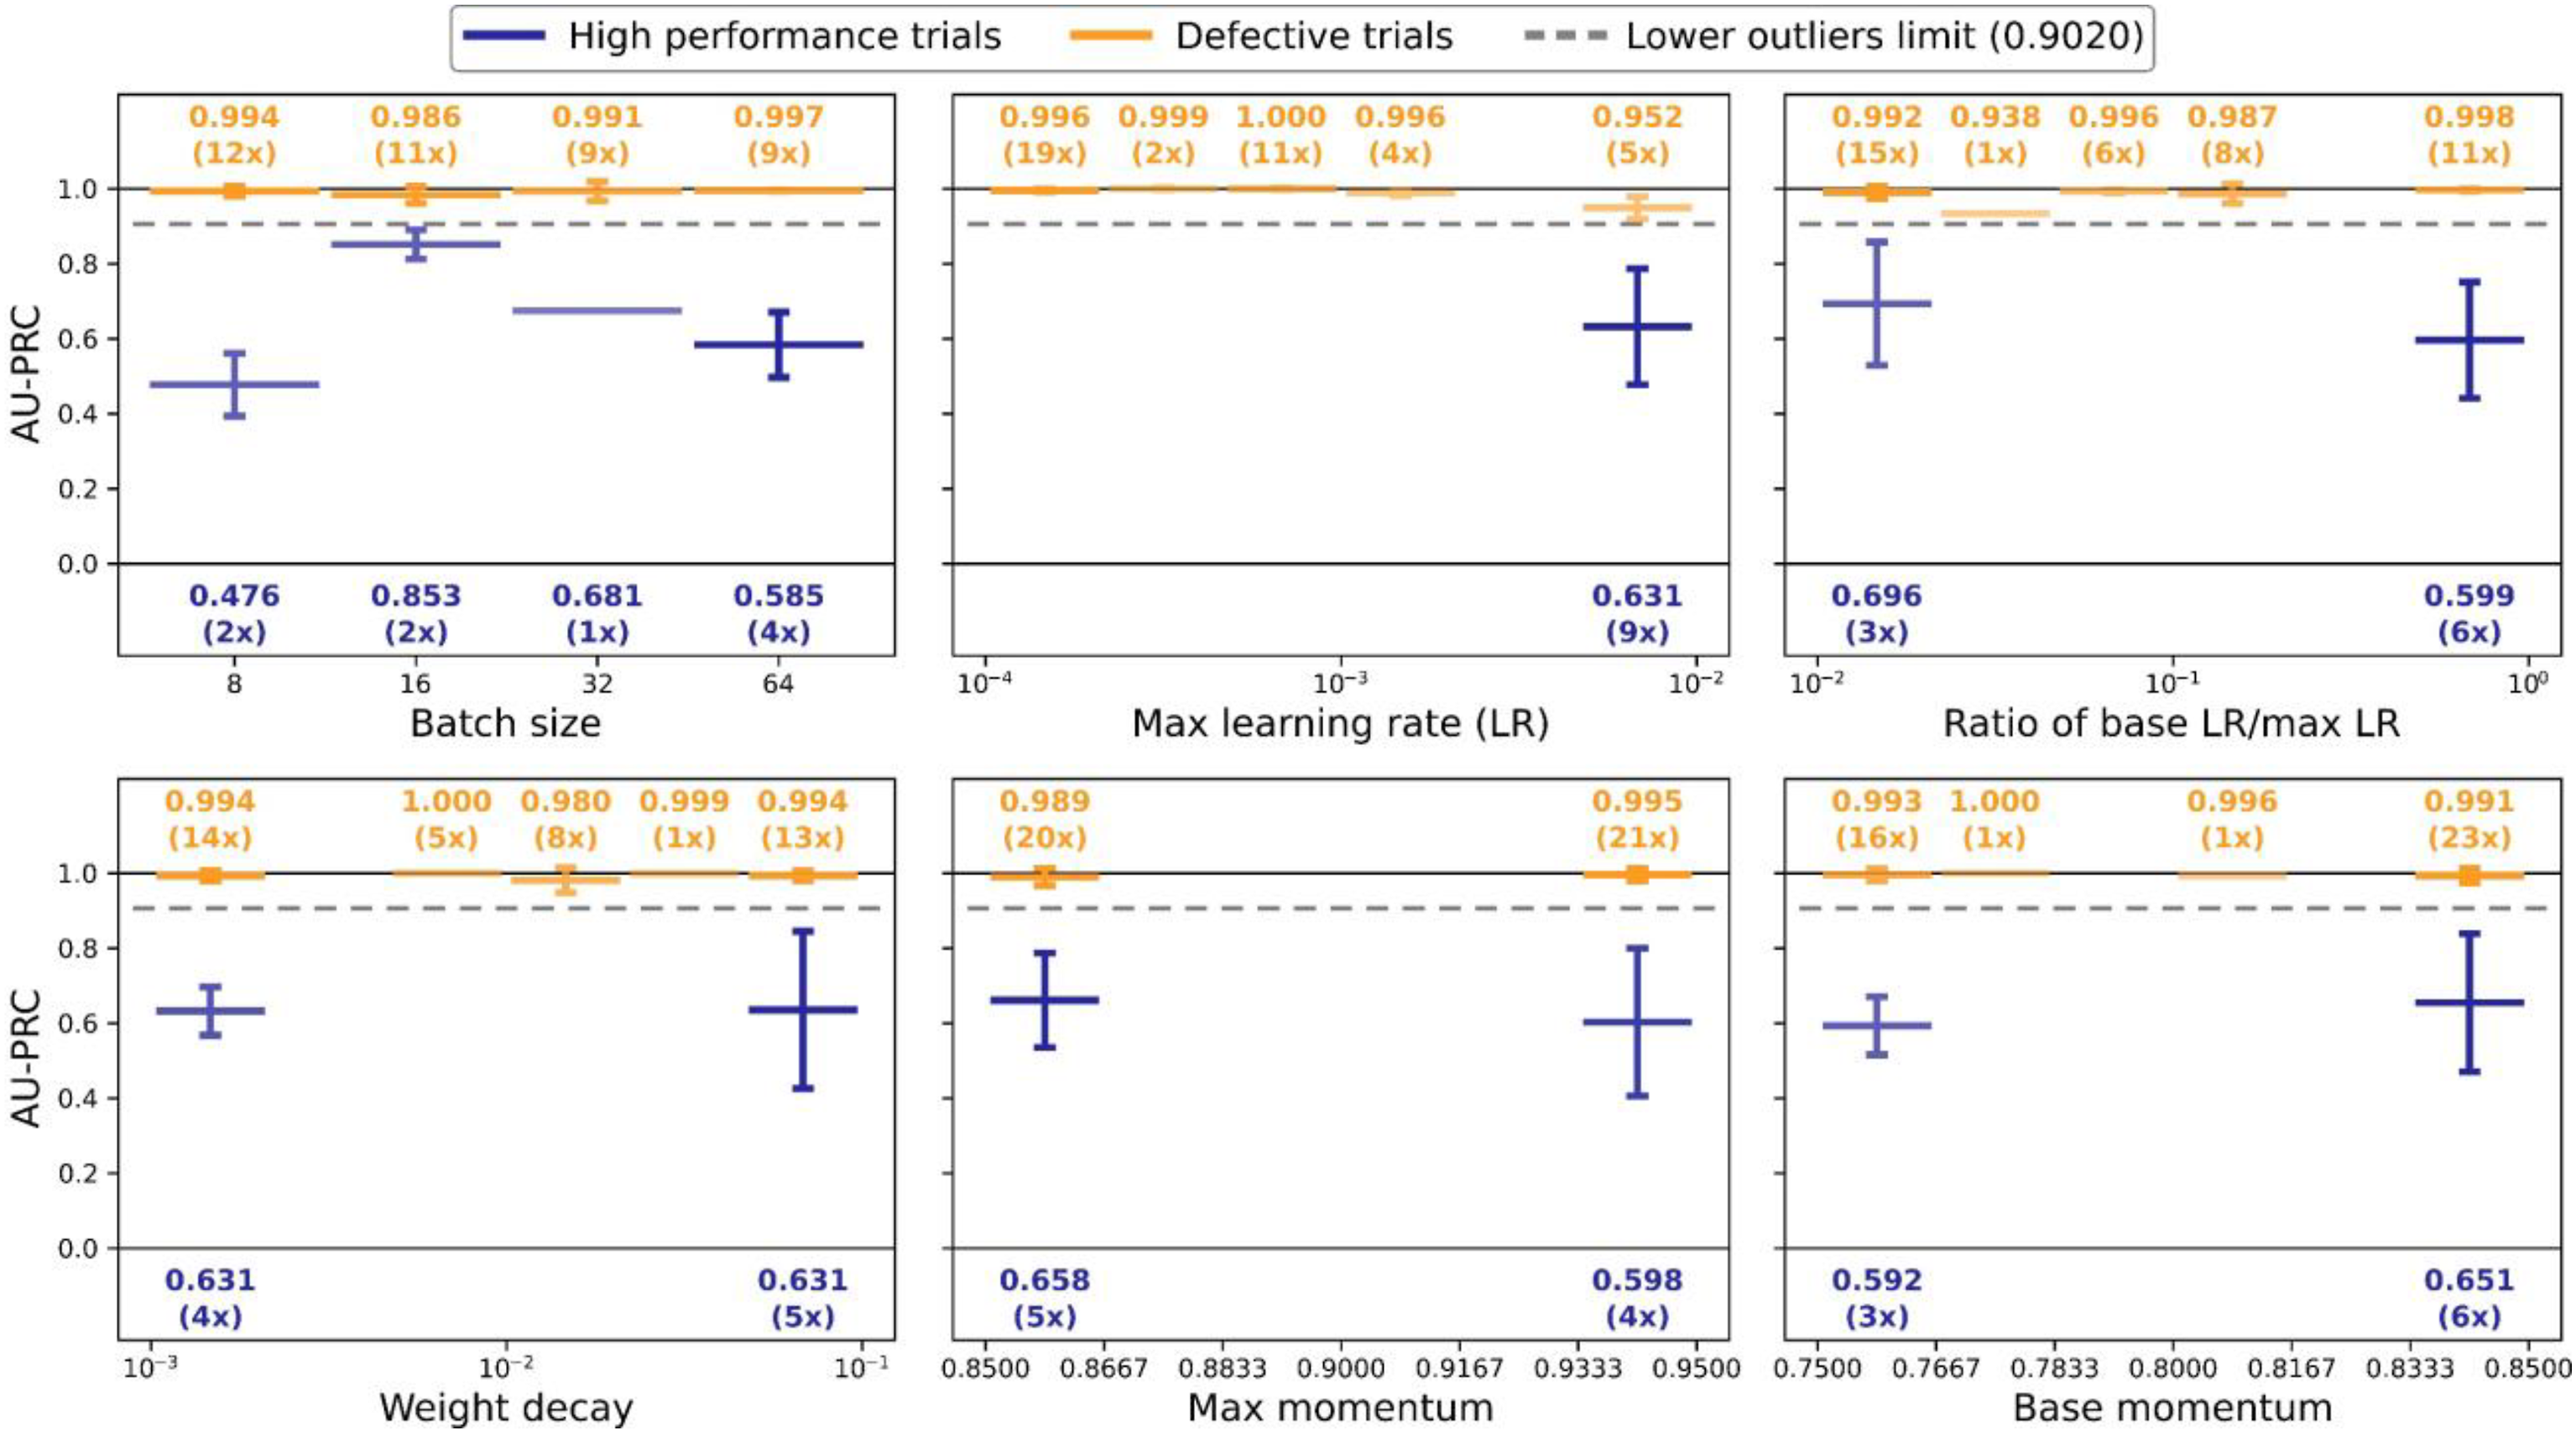
After performing Bayesian optimization for 50 runs (trials), the target scores and equivalent sets of hyperparameters were retrieved. In theory, the easiest approach for selecting the optimal set of hyperparameters is simply to choose the parameter set which returns the highest score. However, such an approach works optimally only if the objective function is deterministic. That is, stochasticity of the objective function may well misguide the choice of the best solution. In the present study, two phenomena were observed during the Bayesian optimization process (see Figure 5). Firstly, the AU-PRC scores of the early trials were significantly lower than those of the later trials, and secondly, the query points were distributed unevenly in the variable space, forming several clusters in some ranges and gaps in the others, making it difficult to pinpoint where the actual optimum lay. Example of defective trials when running Bayesian optimization to find the optimal weight decay value.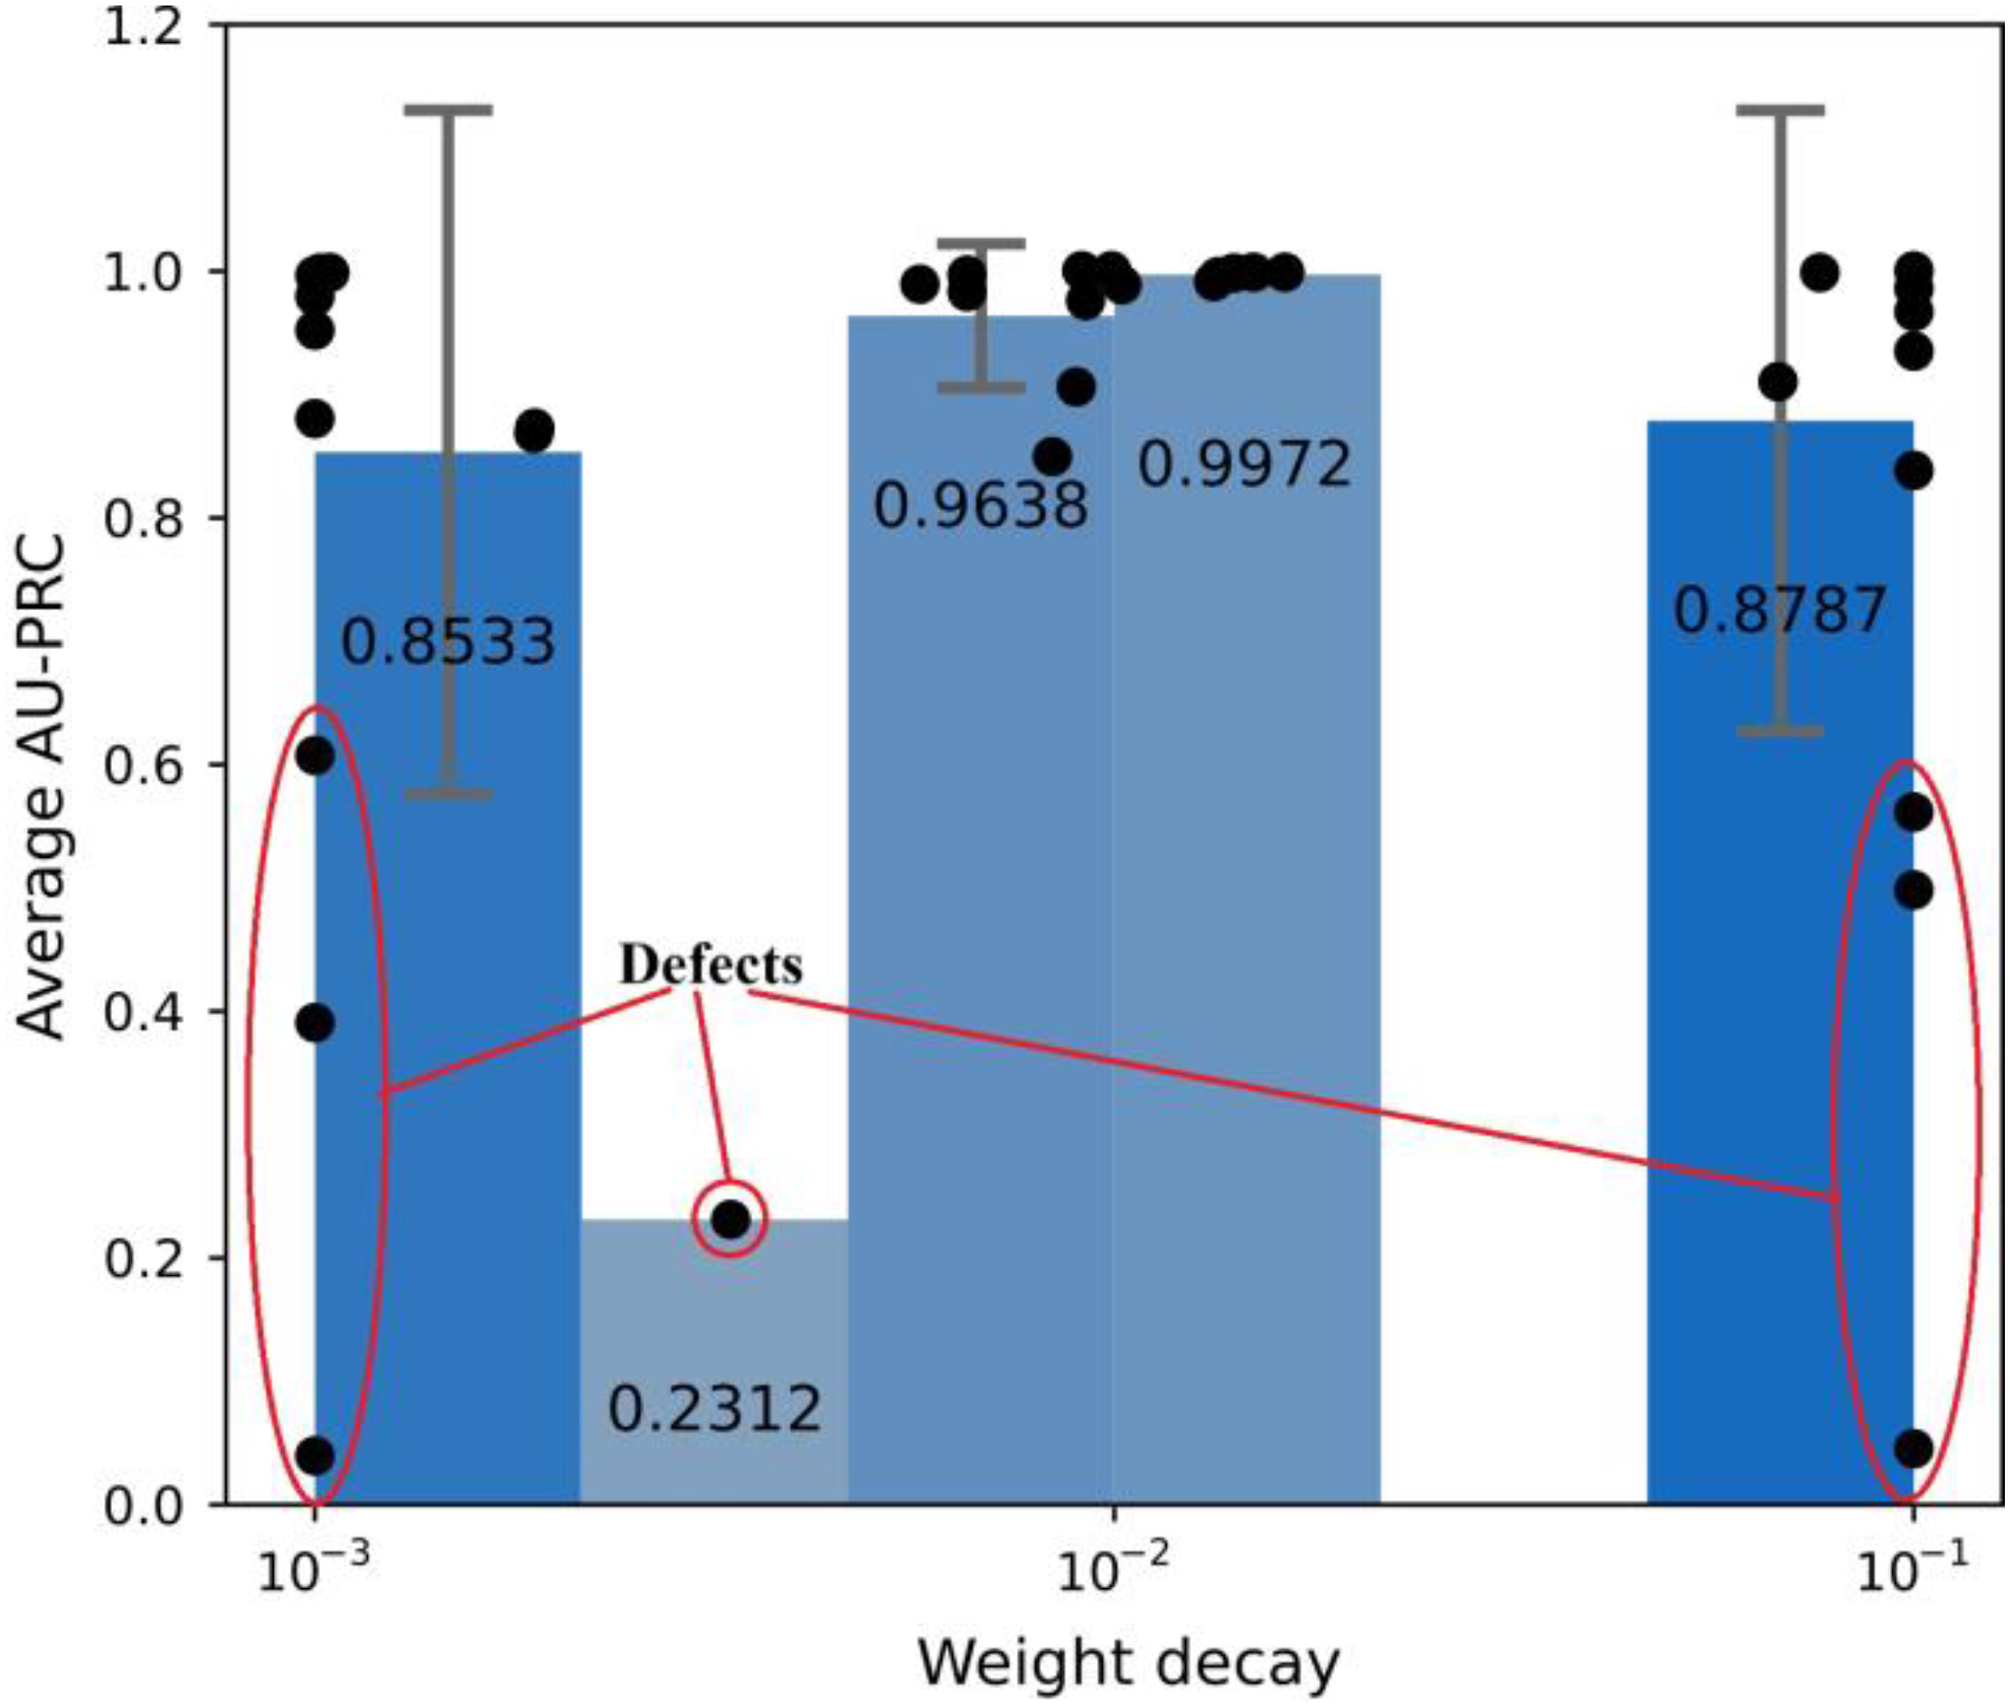
Two strategies were employed to investigate the origins of these phenomena further. In the first strategy, the defective trials were separated from the high-performance trials to determine which of the hyperparameters were responsible for weighing down the score in the early trials. In particular, using the target score, a separating limit was determined based on the box plot policy of categorizing outliers, with the use of quartile (Q) ranges. Any trials with a score lower than this limit were considered to be defective. The lower outlier limit (OL) was calculated as
Model training and evaluation
The hyperparameter values selected for each model were used to configure the corresponding training loop, where this loop included an SGD optimizer and a cyclic LR scheduler (see Figure 6). In the training process, the training set was used to gradually improve the predictive ability of the model, while the validation set was used firstly to evaluate the degree of overfitting and to flag early stopping. Schematic illustration of training loop.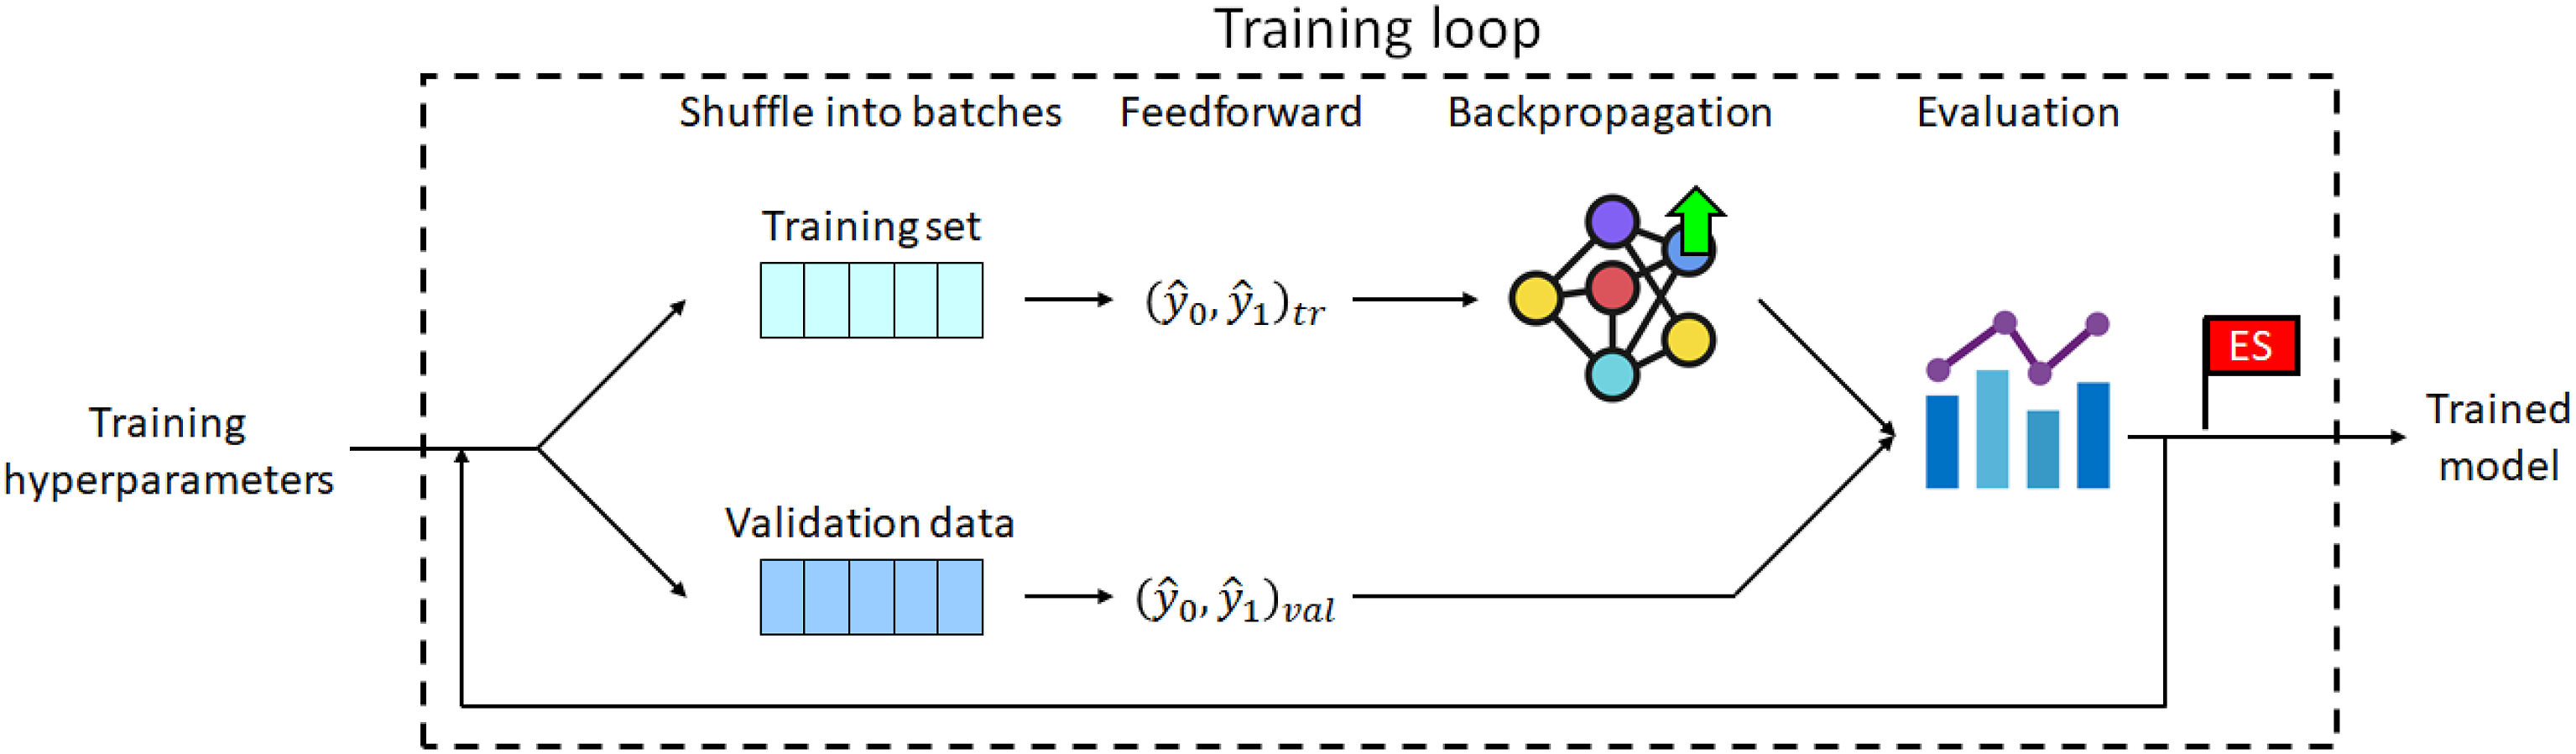
Once the best model had been identified based on its AU-PRC score, it underwent further tuning by adjusting the decision threshold. Then, the tuning process was performed using the F1-score metric since it is threshold-dependent but unbiased with dataset imbalance. Furthermore, it is based on the precision and recall metrics, and can thus be easily mapped and visualized onto the same space as the PR curve. For each type of model, five candidates were trained on the training set and then evaluated on the validation set. The best candidate was then loaded from its saved parameters and used to perform a single feedforward pass through all of the samples in the test set.
Results and discussion
Hyperparameter tuning
In this study, all experiments were conducted on the platform Google Colaboratory, or Colab for short. In each Colab instance, PyTorch and various libraries (support for training and evaluation process) run directly in the browser, and receive free access to a Linux operating system virtual machine from Google with Intel Xeon processor with 2.2 GHz, an NVIDIA Tesla T4 with 16 GB.
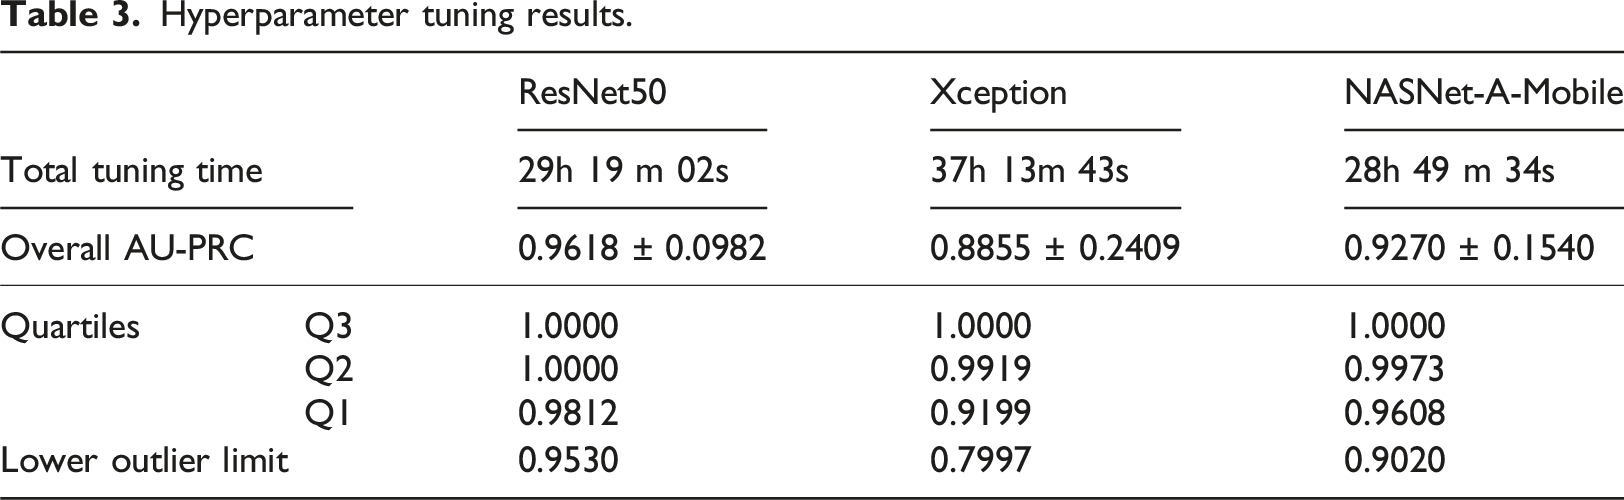
Hyperparameter tuning results.
Hyperparameter tuning results for NASNet-A-Mobile model.
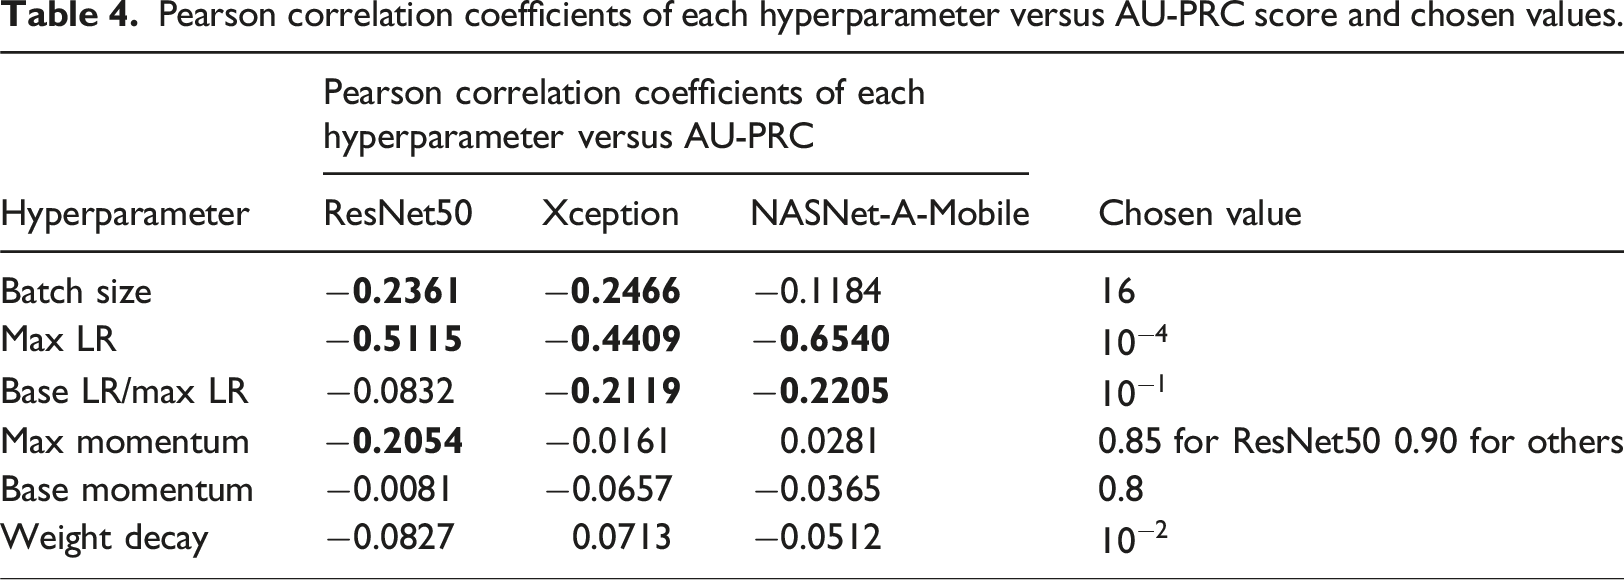
Pearson correlation coefficients of each hyperparameter versus AU-PRC score and chosen values.
Model training and evaluation
The chosen hyperparameter values were used to train the five candidates for each type of model. For illustration purposes, Figure 8 shows the training and validation results obtained for one of the NASNet-A-Mobile candidates. In this case, the predictive ability of the model peaked at epoch 5 and the training process was stopped after 41 epochs. Model training performance of NASNet-A-Mobile candidate.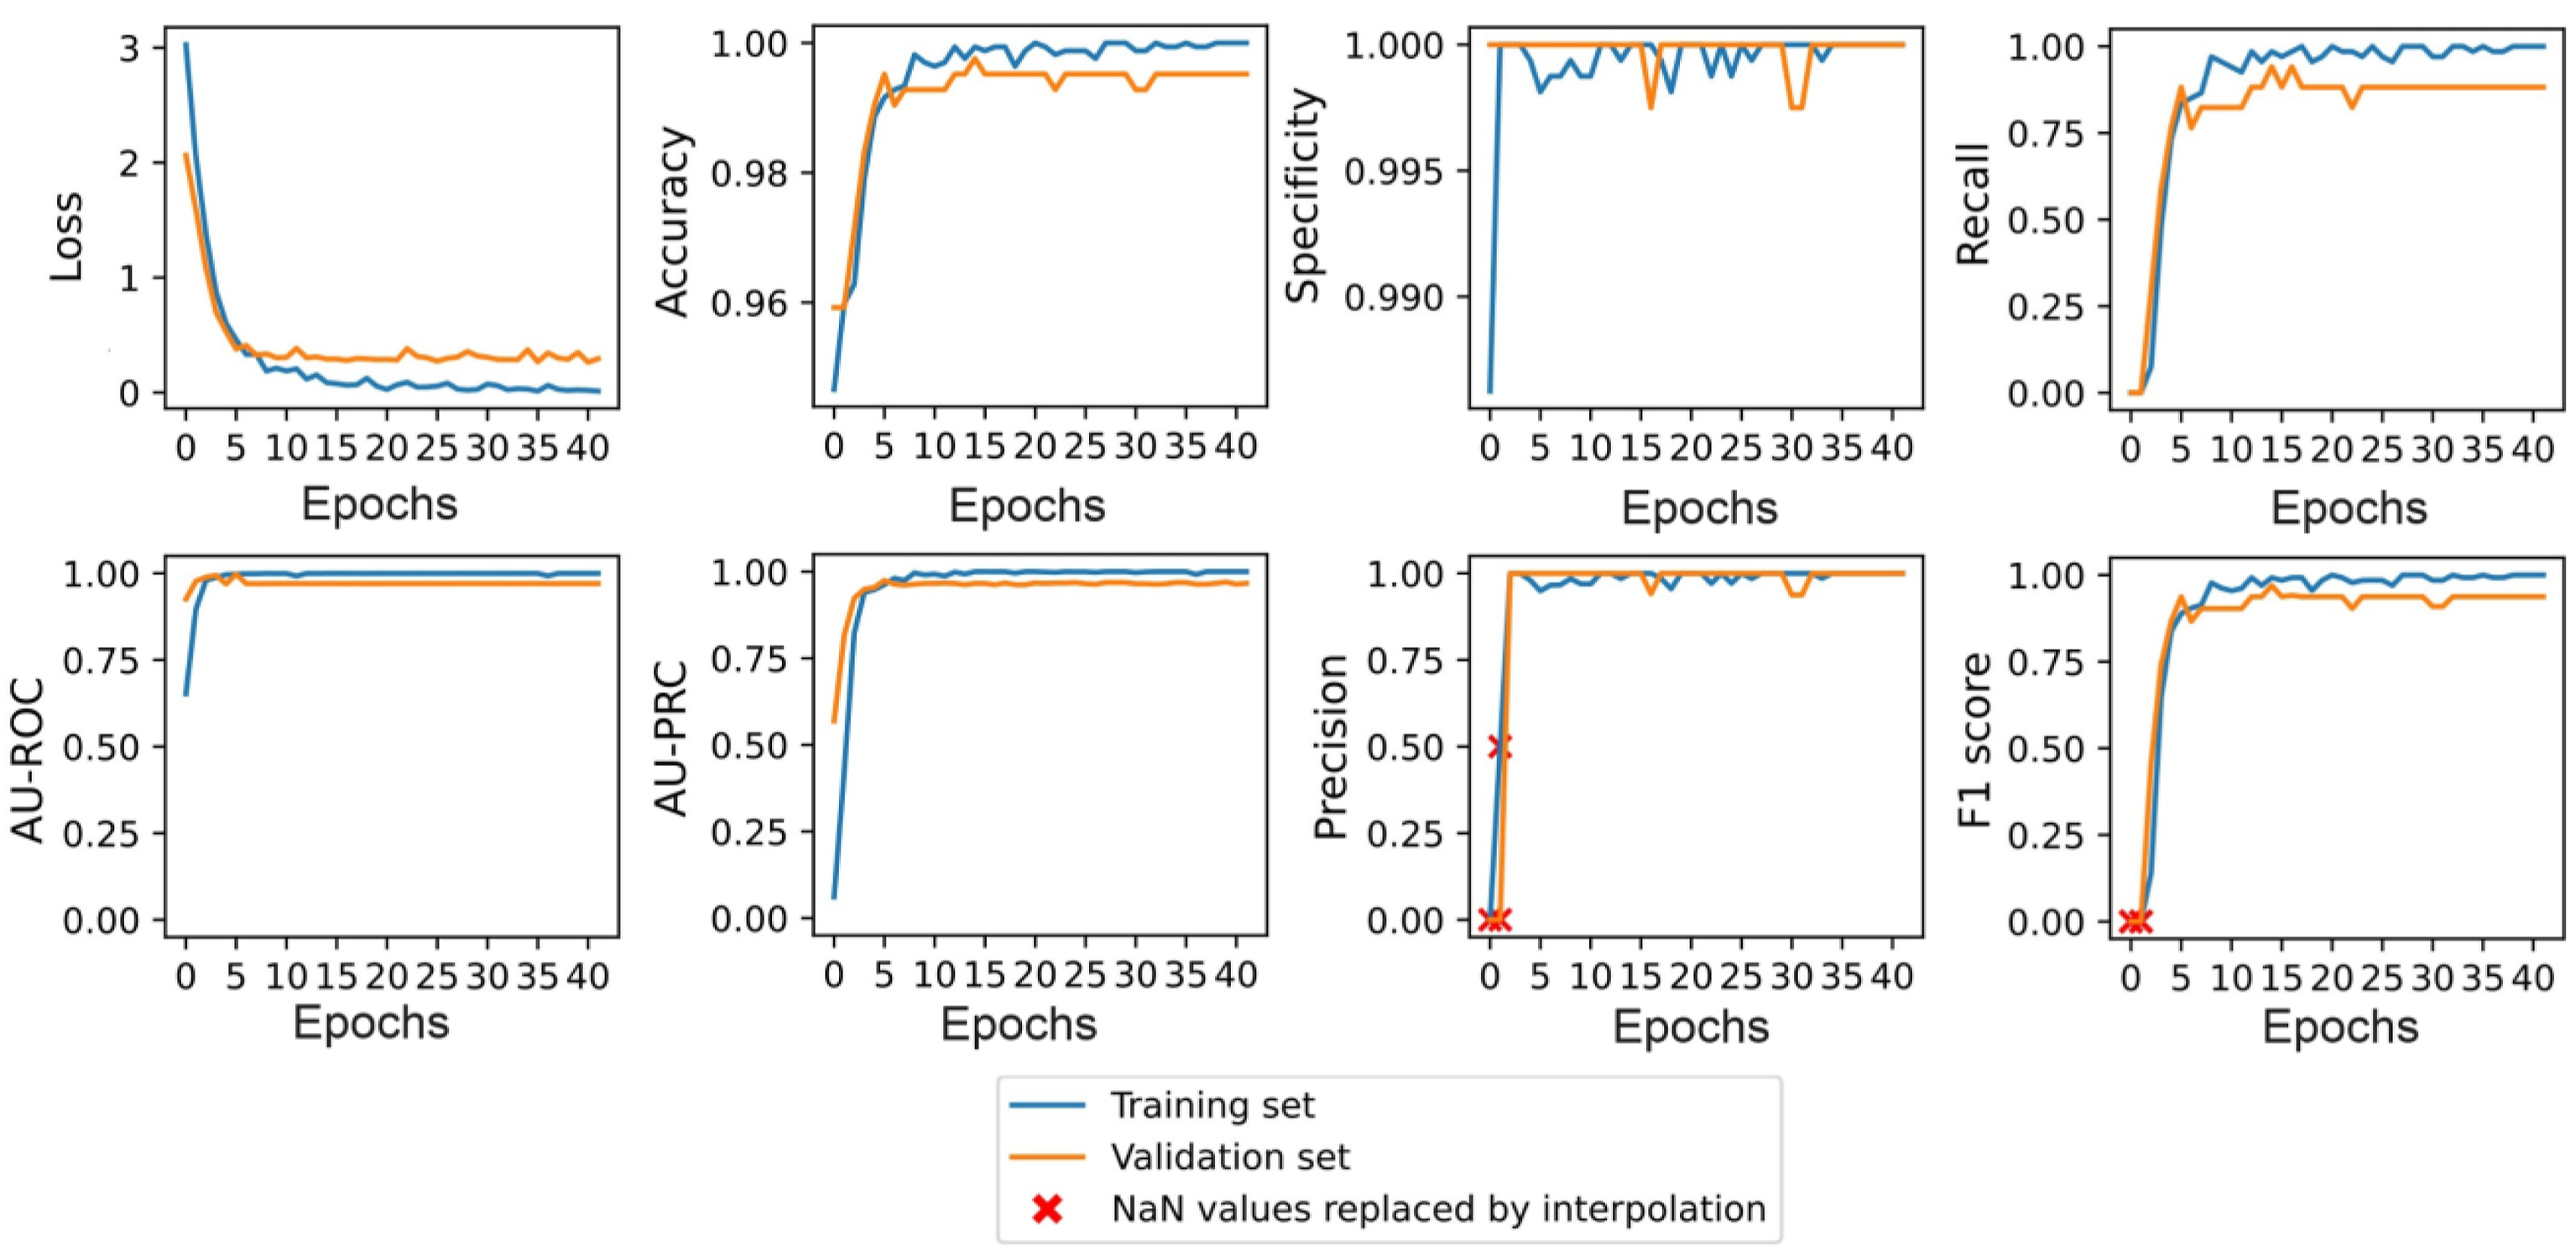
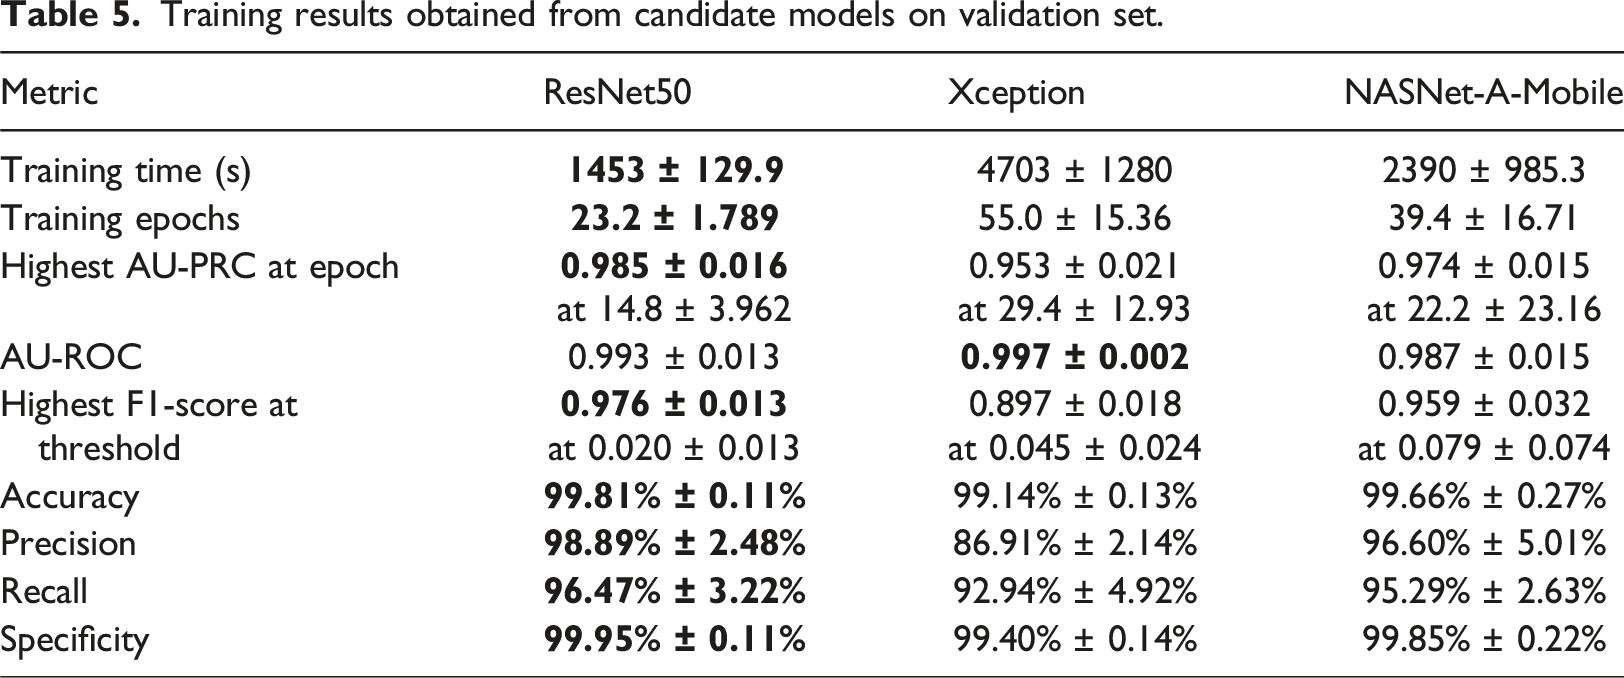
Training results obtained from candidate models on validation set.
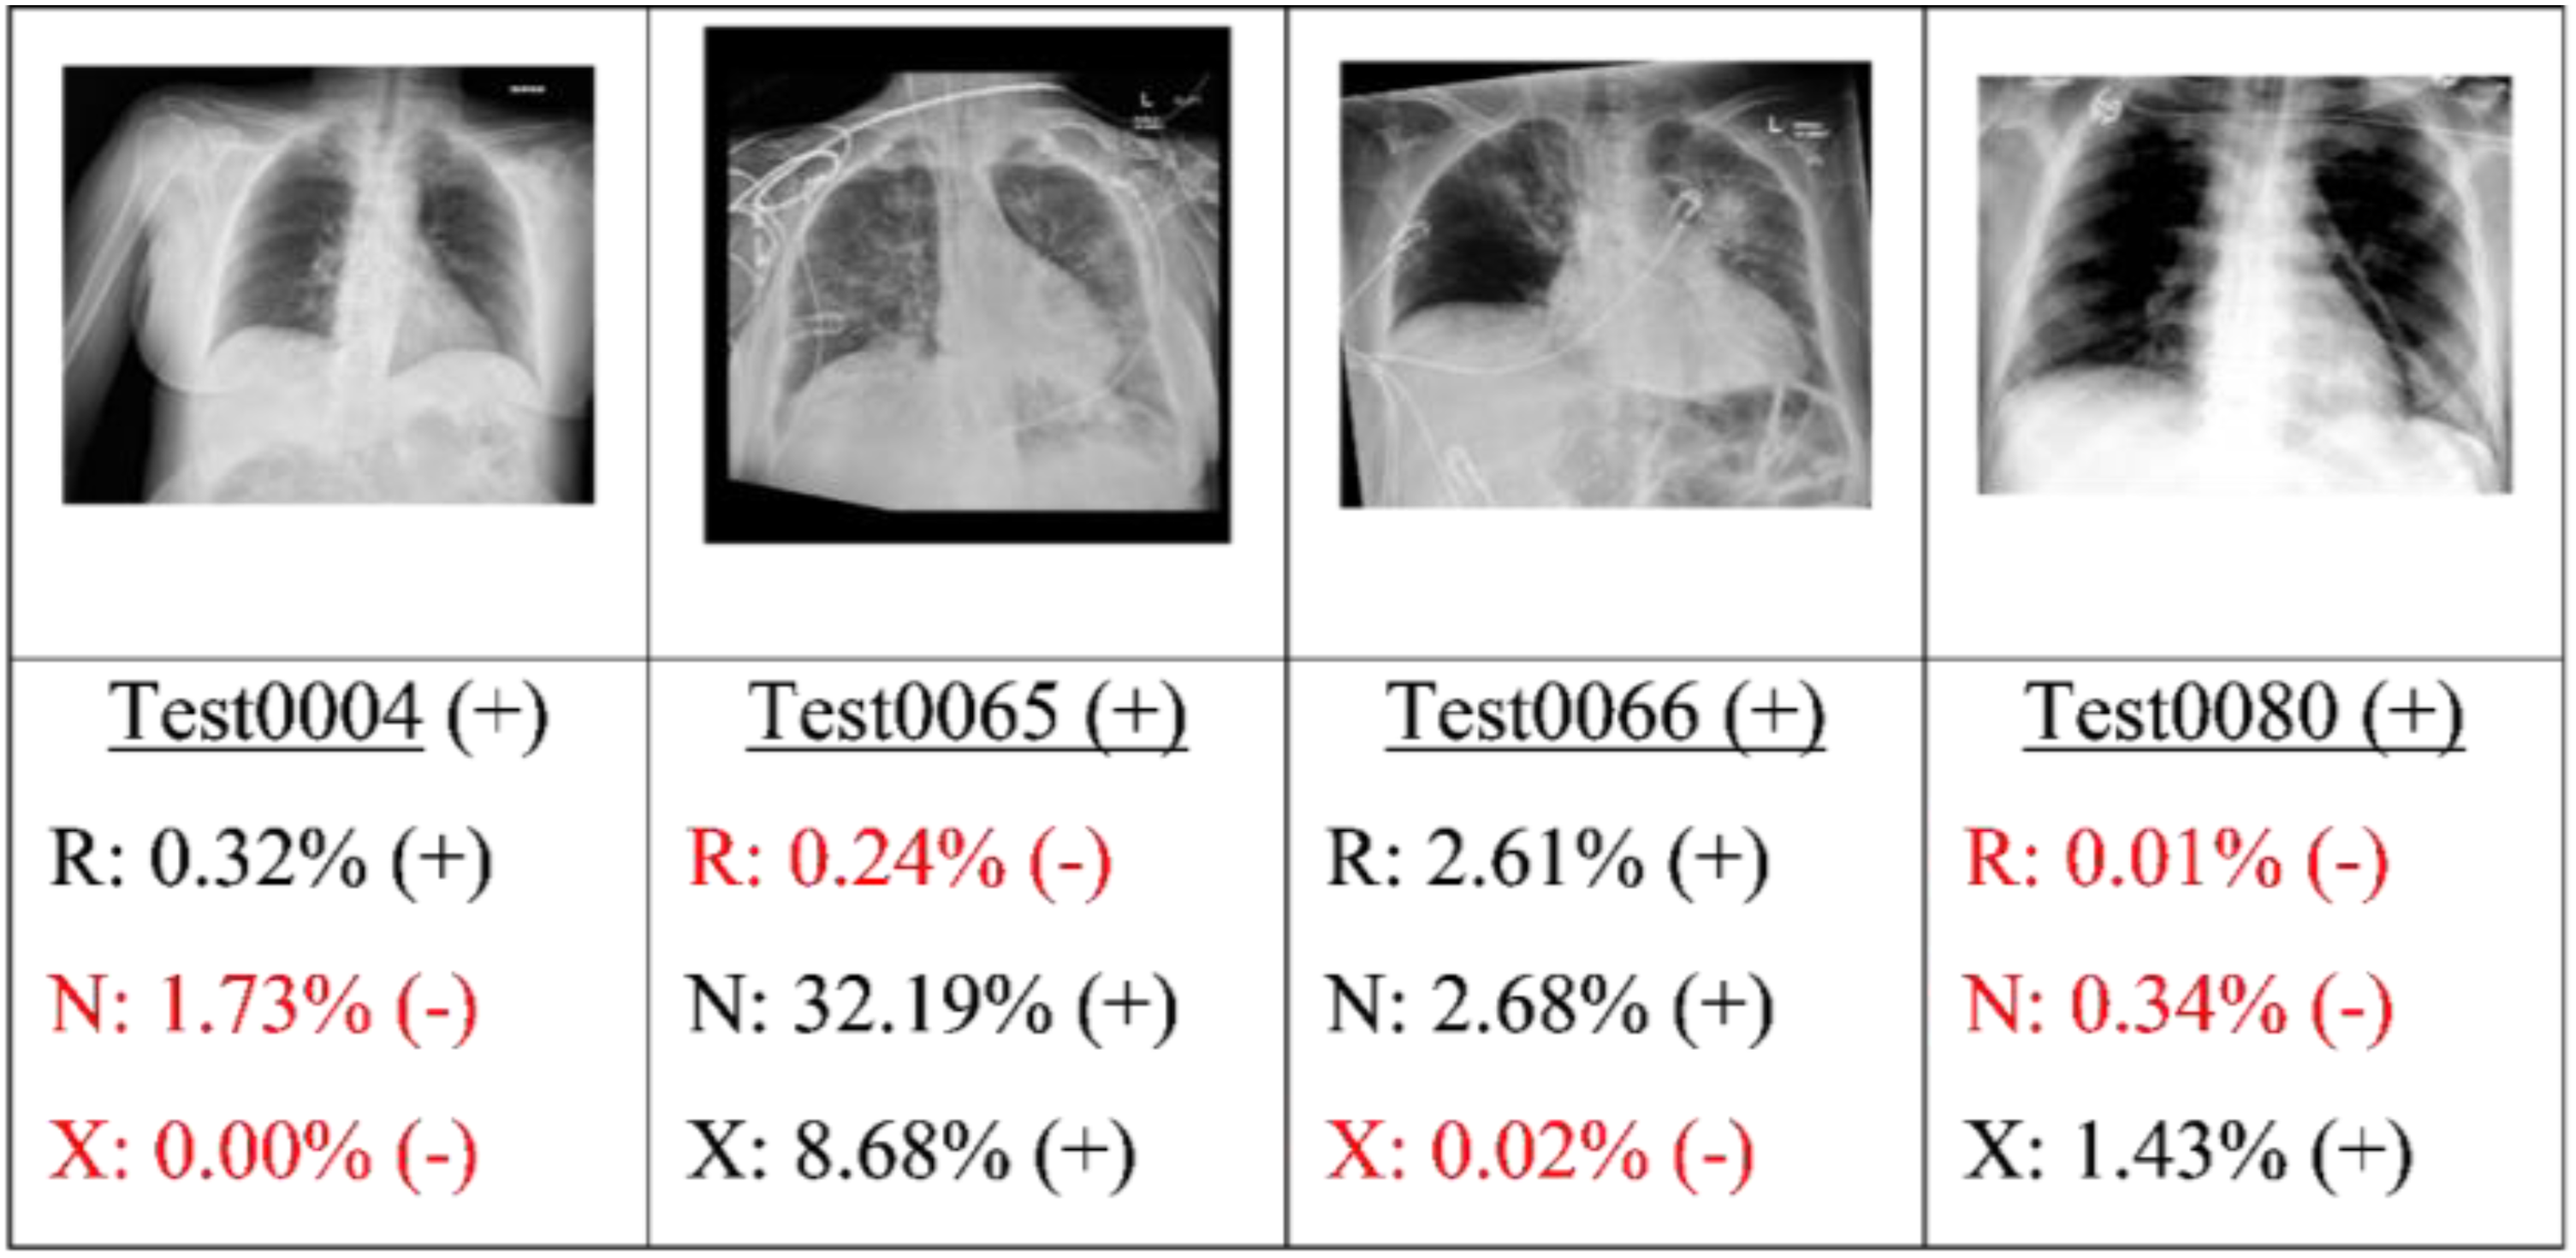
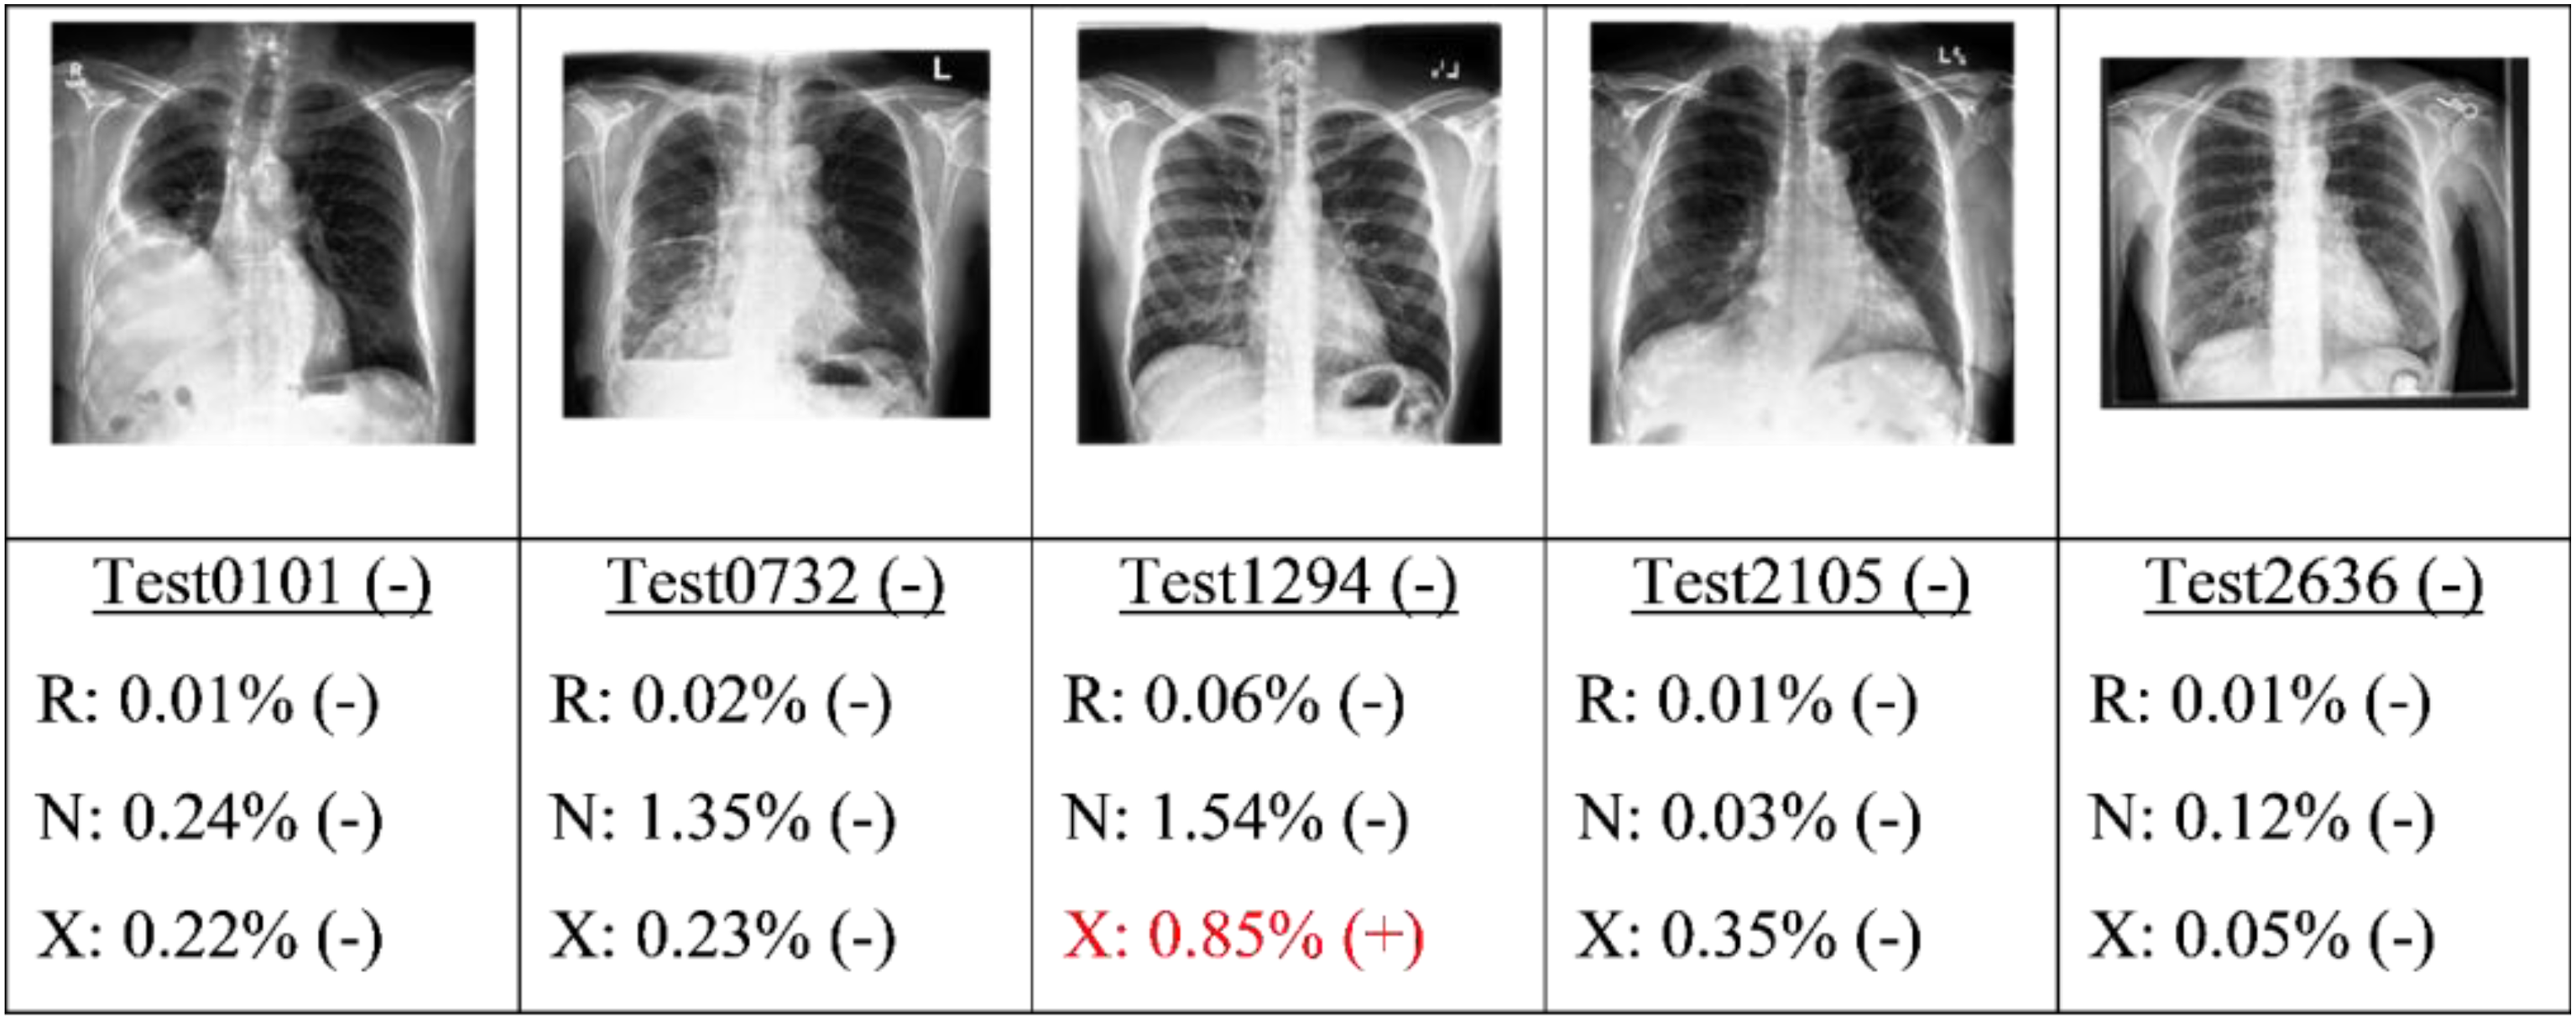
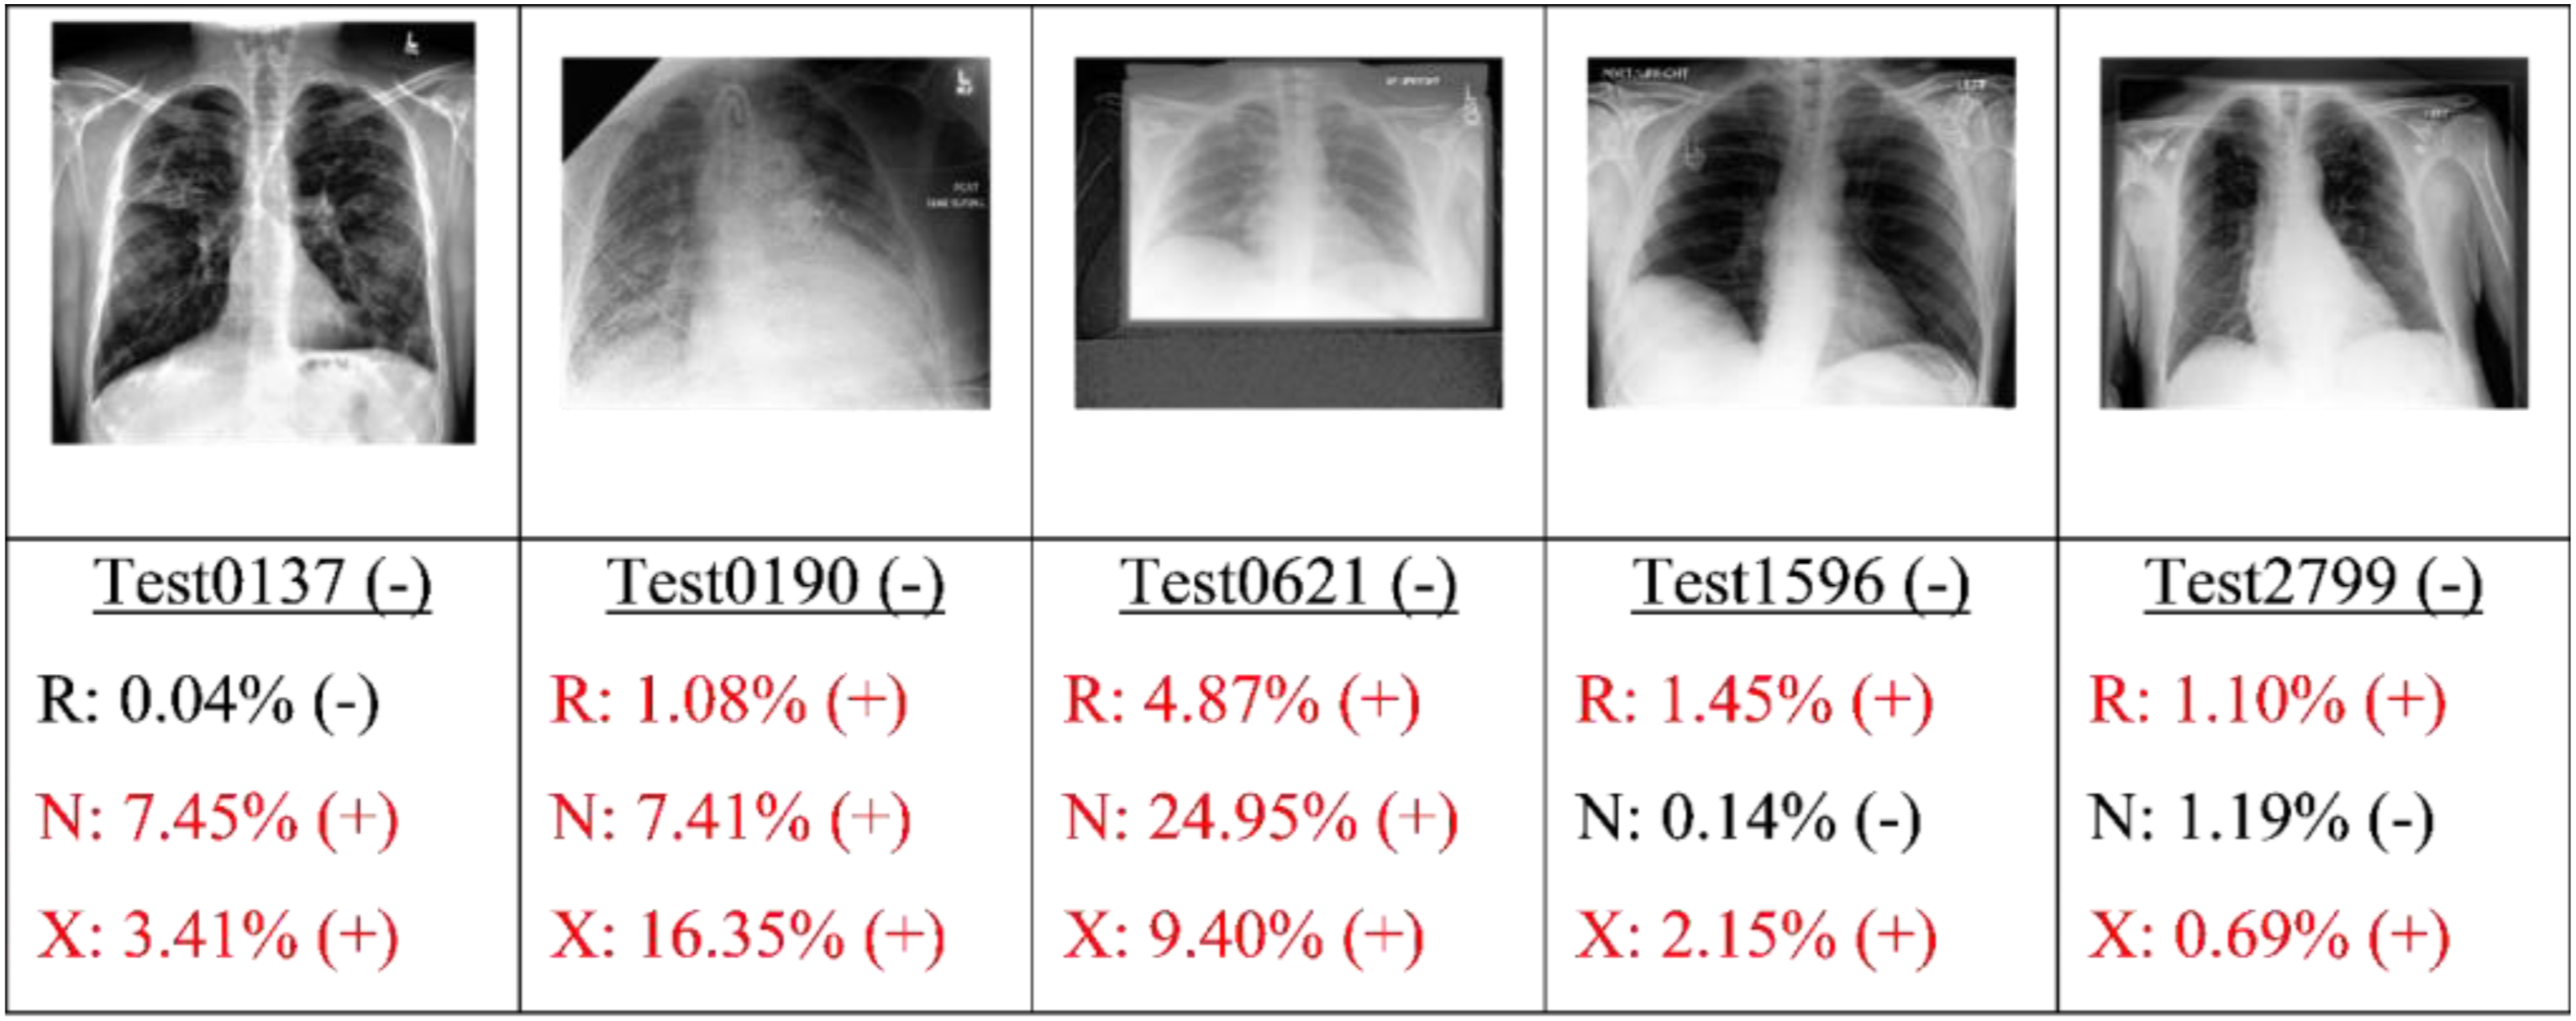
Finally, the best candidate of each type of model (as determined by the highest AU-PRC score) was applied to the test set. Figures 9, 10, 11 and 12 present some typical classification results obtained for different CXR images in the dataset. Note that for convenience, the positive and negative COVID labels and predictions are denoted as (+) and (−), respectively, while the ResNet50, NASNet-A-Mobile and Xception models are denoted simply as R, N and X respectively. In addition, false predictions are marked in red. It is noted that decision thresholds equivalent to 98% recall (to be listed in Table 5) were used in every case. True positives classification results obtained for different CXR images in the dataset (5 random examples). False Negatives classification results obtained for different CXR images in the dataset (all four examples). True Negatives classification results obtained for different CXR images in the dataset (5 random examples). False Positives classification results obtained for different CXR images in the dataset (5 random examples).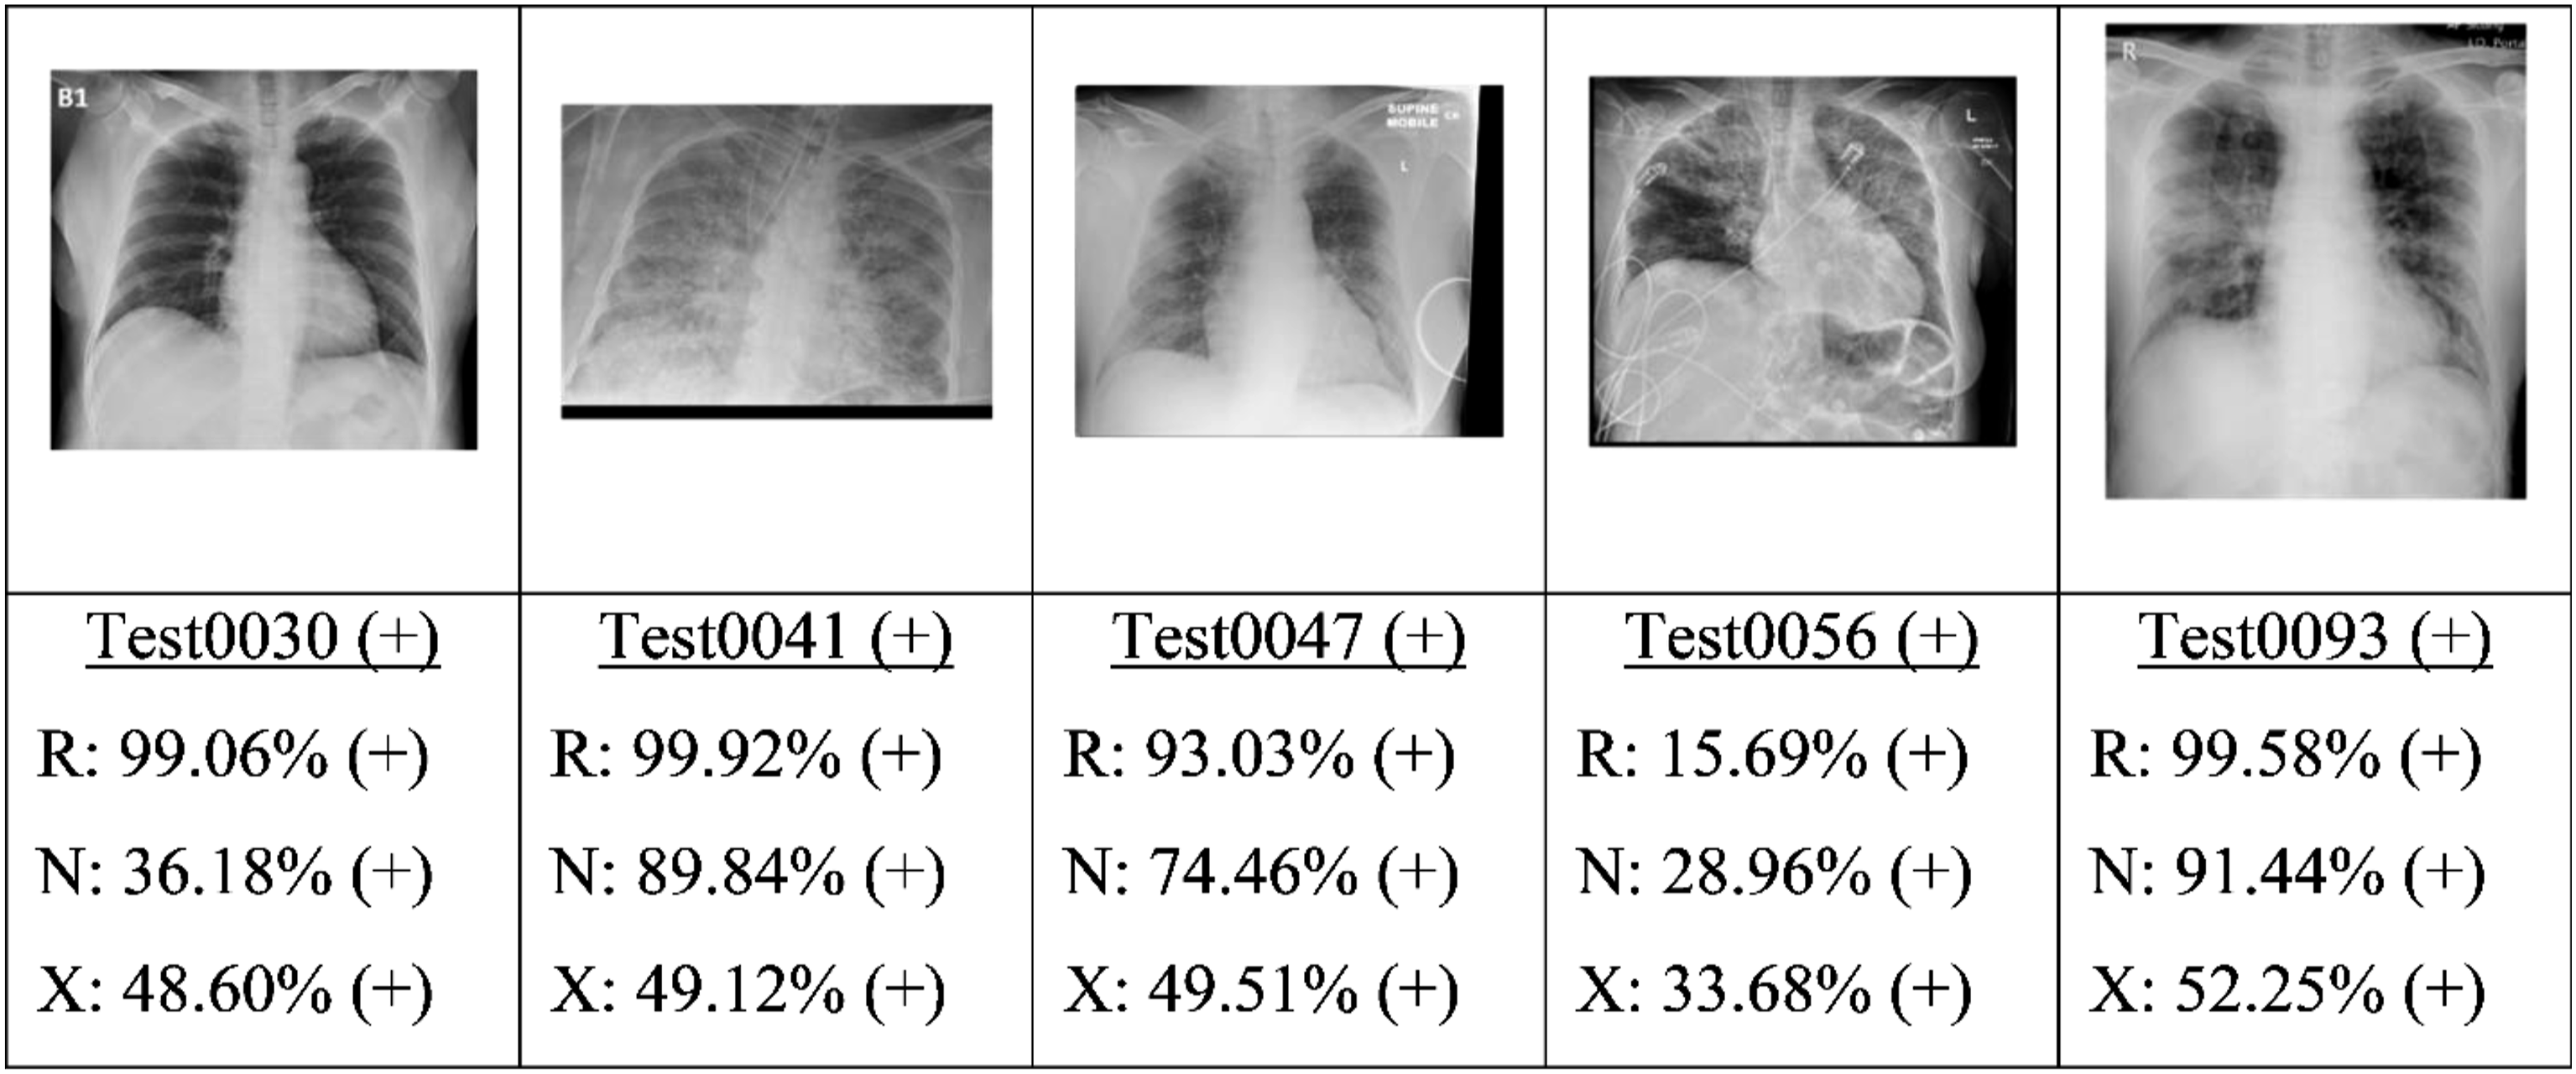
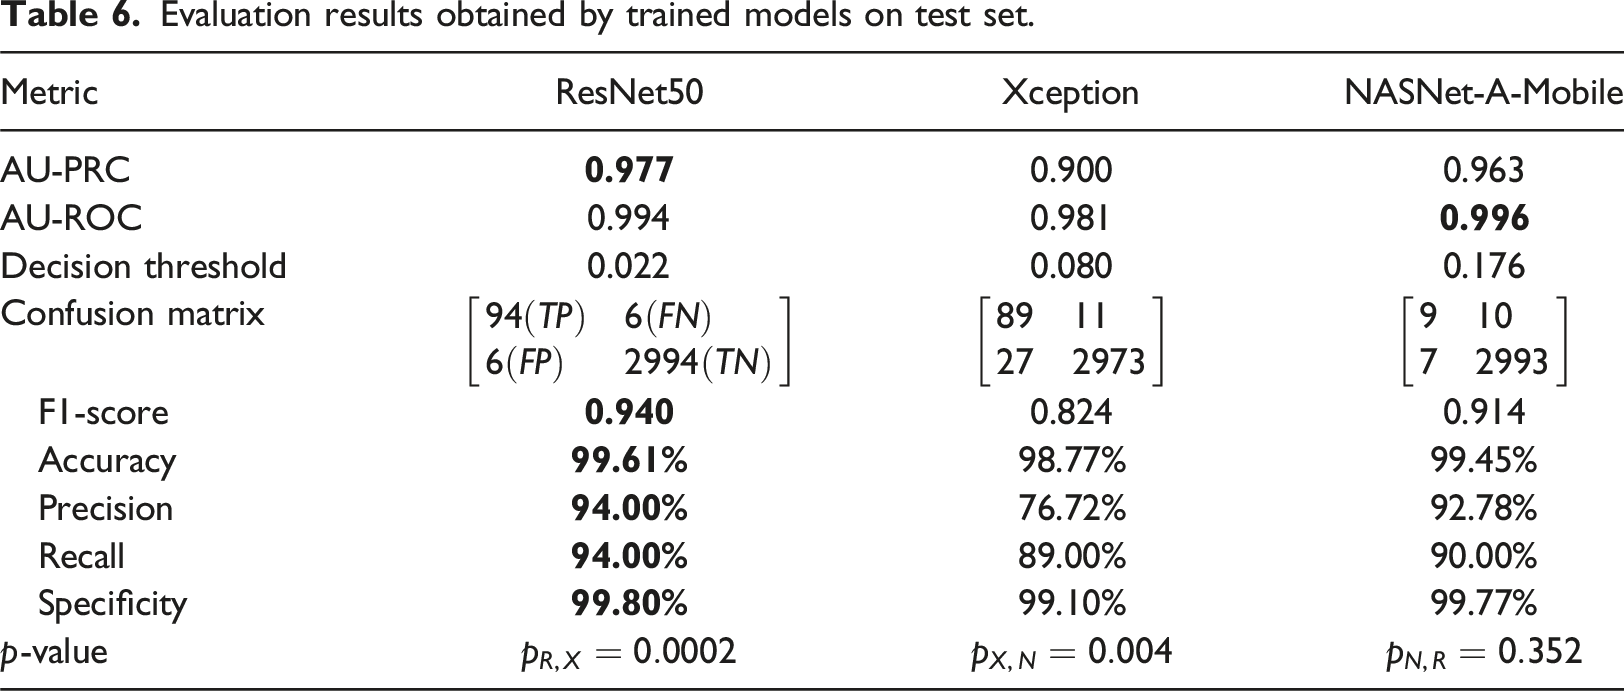
Evaluation results obtained by trained models on test set.
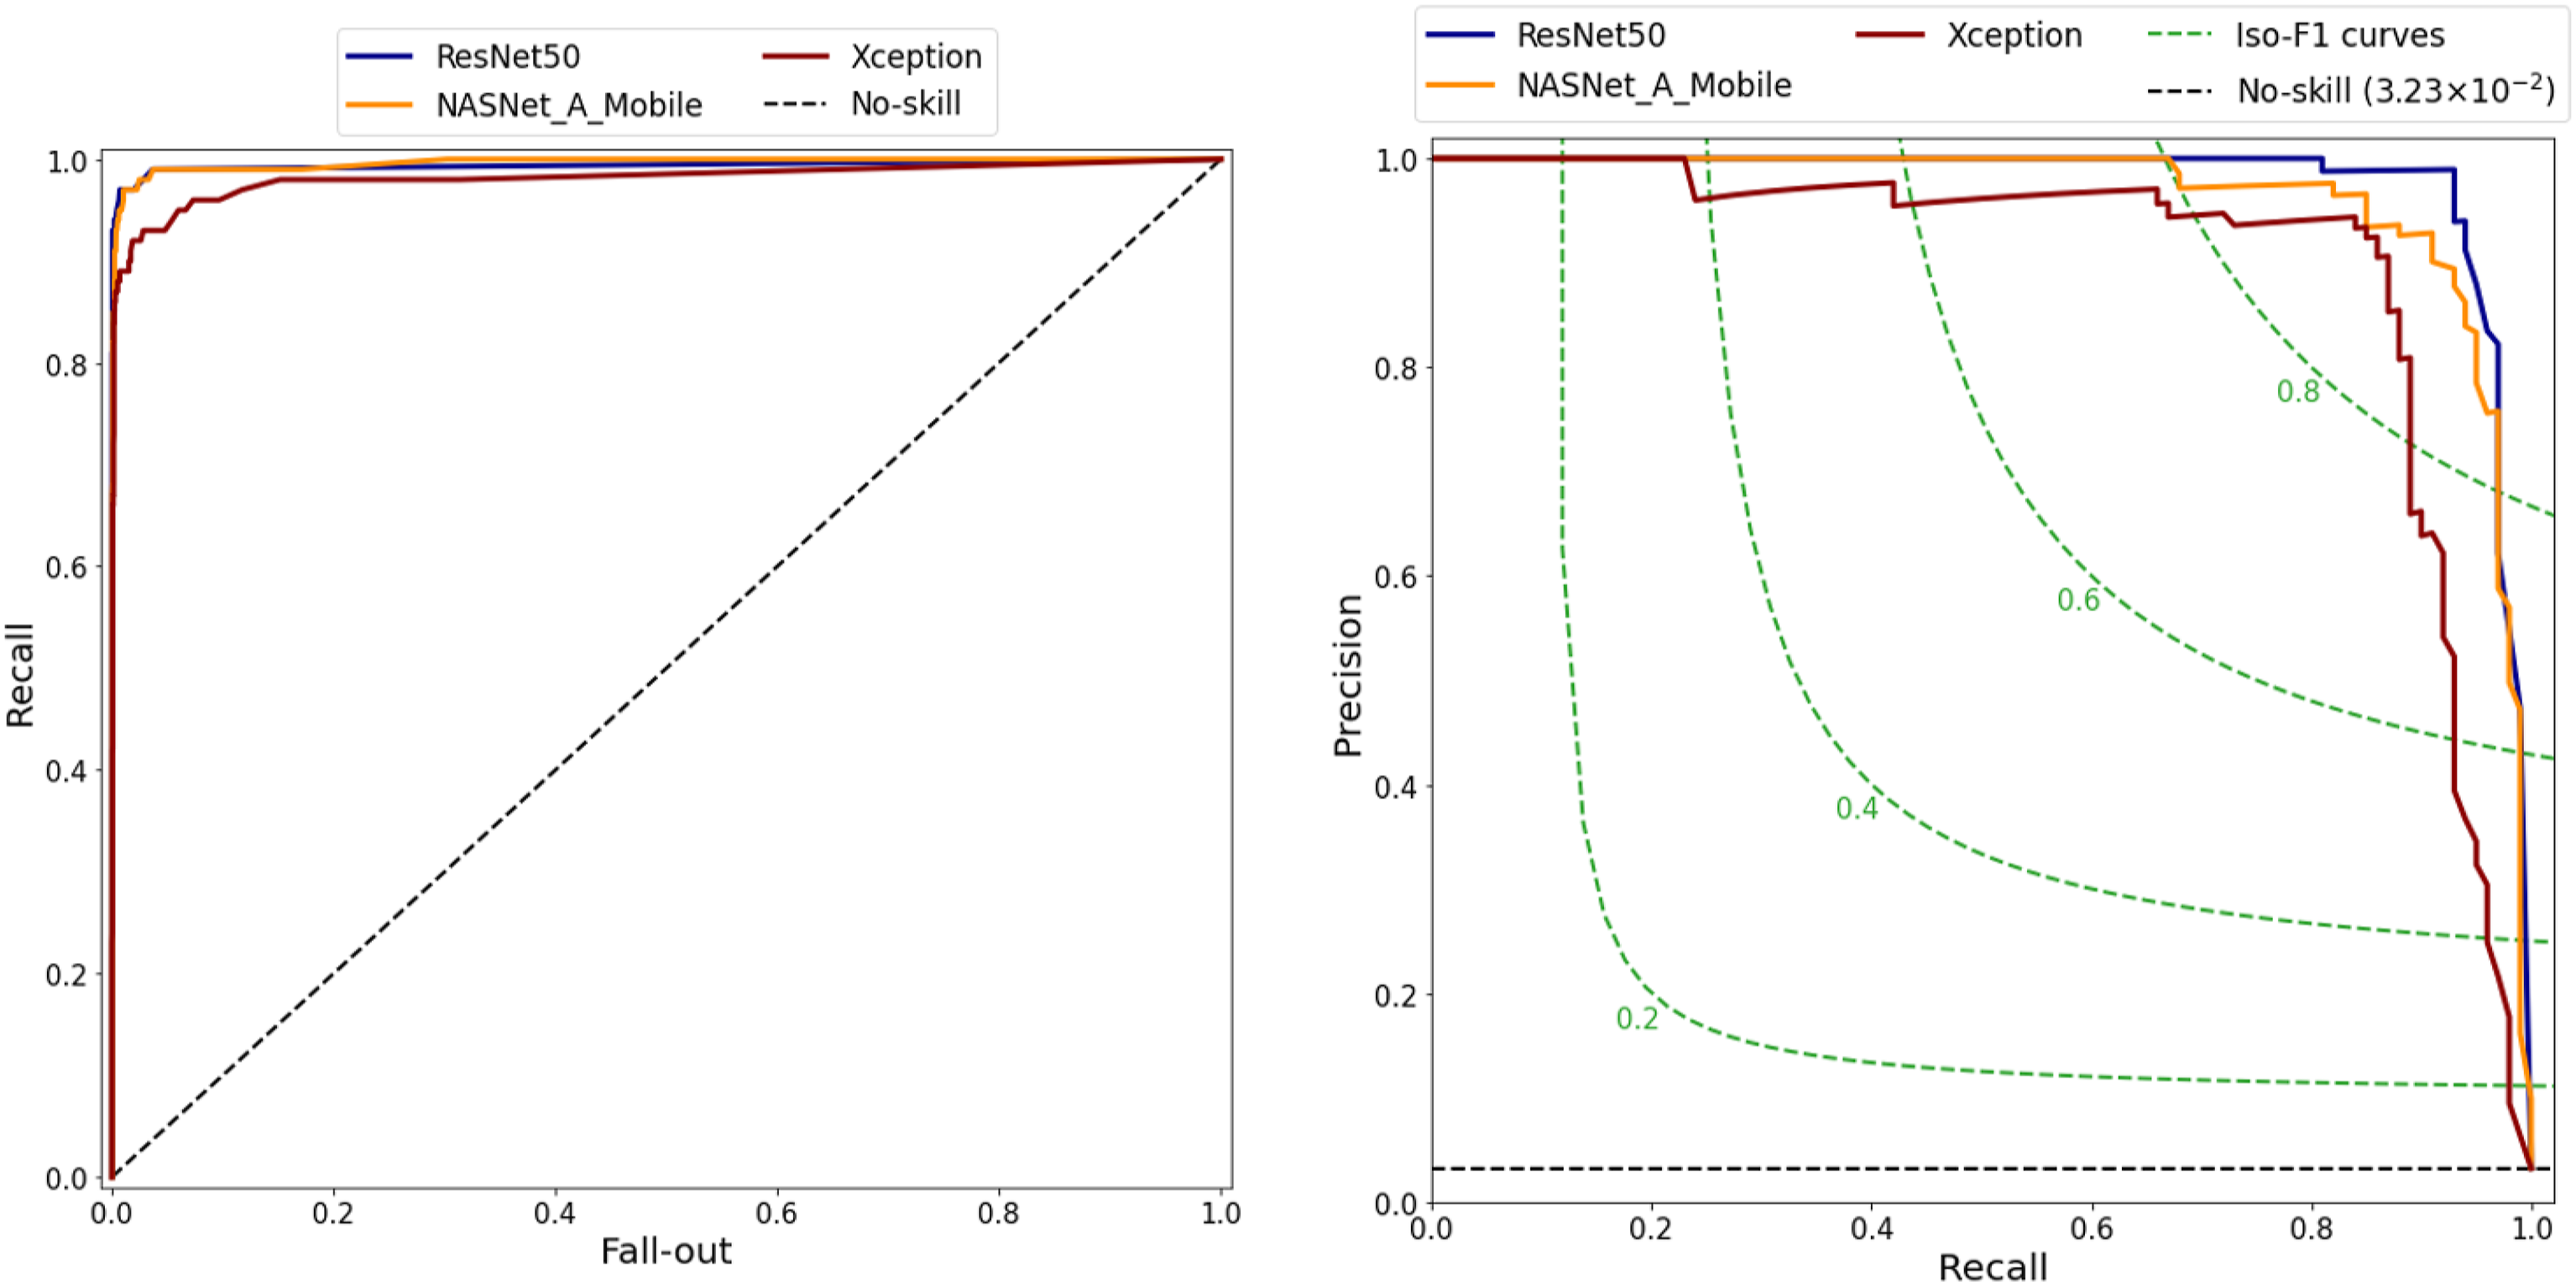
ROC and PR curves of three models.
Comparison of performance results for present models and those reported in the literature on the COVID-Xray-5K v3 dataset.
Beside advantages, the proposed study with several limitations needs to be acknowledged. Firstly, there are different COVID-19 datasets from medical institutions with different quality images that cause a correction in the performance of the proposed models. Ibrahim et al. 14 and Duong et al. 18 showed that the achieved accuracies of their models were quite different when their proposed classifiers were evaluated by the different CXR datasets from other medical institutions. Secondly, the COVID-Xray-5K v3 dataset suffered an imbalance problem with an average negative-to-positive sample ratio of approximately 27:1. To overcome this limitation, the proposed study tried to find the appropriate evaluation metrics to store the best weights of the present models for the dataset. Finally, the proposed study focused on three models (i.e., ResNet50, Xception and NASNet-A-Mobile) and some methods for finding the optimal values of hyperparameters. In the future, more classification models are employed for the purpose of comparison and optimization process.
Conclusion
This study has presented a robust pipeline for the development of well-trained models for the detection of COVID-19 from CXRs. The pipeline takes specific account of two of the most common problems affecting the deep learning processing of medical images, namely dataset imbalance and threshold moving. The feasibility of the proposed pipeline has been demonstrated using three models (ResNet50, Xception and NASNet-A-Mobile). The performance of the three models has been evaluated and analyzed on the COVID-Xray-5K v3 dataset. The results have shown that the ResNet50, NASNet-A-Mobile and Xception models achieve AU-PRC scores of 0.977, 0.963 and 0.900, respectively, and AU-ROC scores of 0.994, 0.996 and 0.981. Furthermore, at a 98.00% recall, the three models achieve high specificities of 97.53%, 97.60% and 86.00%, respectively. Notably, the predictive performance of the three models is at least as good as that of five other models reported in the literature.
Footnotes
Declaration of conflicting interests
The author(s) declared no potential conflicts of interest with respect to the research, authorship, and/or publication of this article.
Funding
The author(s) disclosed receipt of the following financial support for the research, authorship, and/or publication of this article: This work was supported by the Vietnam National University Ho Chi Minh City (VNUHCM) under Grant No. DS2023-28-02.
Code availability
Ethical statement
Based on the COVID-XRay-5K v3 dataset published online for academic community, there is no cause for concern regarding ethical considerations in this study.
Data availability statement
Data underlying the results presented in this paper are publicly available on Github repository [![]() ] from.
19
] from.
19