
Abstract
Keywords
Introduction
The Organization for Economic Co-operation and Development (OECD) counted the number of people who underwent CT and MRI examinations in its member countries from 2010 to 2019, and the data showed that the number of people generally increased.1,2 The increase in the number of imaging examinations represents an increased need to interpret images, which leads radiologists to spend more time interpreting medical images and writing medical imaging reports. 3 Previous research indicated that the number of images radiologists needed to interpret per minute each day increased from 2.9 in 1999 to 16.1 in 2010. 4 Radiologists are overloaded with increasing hours and stress. Eye fatigue is a serious problem for radiologists, who spend considerable time observing images; these features may cause burnout and misjudgment of images, thereby affecting the quality of medical imaging reports. 5 With the increasing number of patients and medical images, writing medical imaging reports has become a time-consuming and repetitive task.
Writing medical imaging reports is a challenging, tedious and difficult task for both experienced and inexperienced radiologists. In addition, medical imaging reports should serve as a bridge for communication between physicians and patients. Patients have the right to know how their physical status is presented in medical images. During the long waiting process, patients are anxious and impatient about receiving their imaging results.6,7 If automation is used to assist physicians in writing medical imaging reports, it would not only reduce the time physicians spend writing but also simplify complicated procedures, reduce burnout, and even improve productivity. For patients, automation can also shorten the time needed to obtain examination results and reduce the anxiety caused by waiting. Automated reporting can also reduce errors caused by human negligence and increase the quality of diagnosis so that physicians have more time to care for patients. 8
According to one study, automated medical imaging reporting can be performed through a combination of radiological information systems, picture archiving and communication systems, and voice recognition. 9 Jing et al. 10 proposed using machine learning to learn image features of chest X-ray images and text descriptions from collected unstructured reports. The learned text descriptions were obtained from unstructured reports, which are prone to inconsistencies; in contrast, in structured reports, the content is more clearly presented and easier to read and understand, thereby improving communication. Qu et al. 11 developed an image recognition-based structured report generation system that uses machine learning to analyze lesion location and size in gastrointestinal endoscopy images in real time to identify gastrointestinal-related diseases. Using a medical dictionary, the corresponding descriptions are generated and filled into a structured template that meets the clinical requirements. Tanida et al. 12 suggested a method for generating radiology reports that is guided by specific regions. This method involves using object detection to directly extract visual features from defined anatomical areas. These features are then utilized to create detailed, anatomy-specific sentences that describe any identified pathologies, contributing to the completion of the final report.
After reviewing automated medical imaging reports in the current literature, three directions for improvement were identified in this study: richness of information, flexibility of information, and comprehension of information. In terms of richness, more data from digital imaging and communications in medicine (DICOM) were added. Flexibility and comprehension were achieved using different versions of the reporting template. The unstructured version provides more clinically meaningful explanations for patients or users who are not familiar with the contents of the images. If this information can be supplemented, physicians may achieve a more efficient and stronger consensus with patients when interpreting images and conditions. The image features extracted by computer-aided diagnosis (CAD) were combined with the standard lexicons defined in reporting and data systems (RADSs) to describe medical image features. Finally, all the information was analyzed and presented within the metadata framework to automatically generate complete medical image reports.
Materials and methods
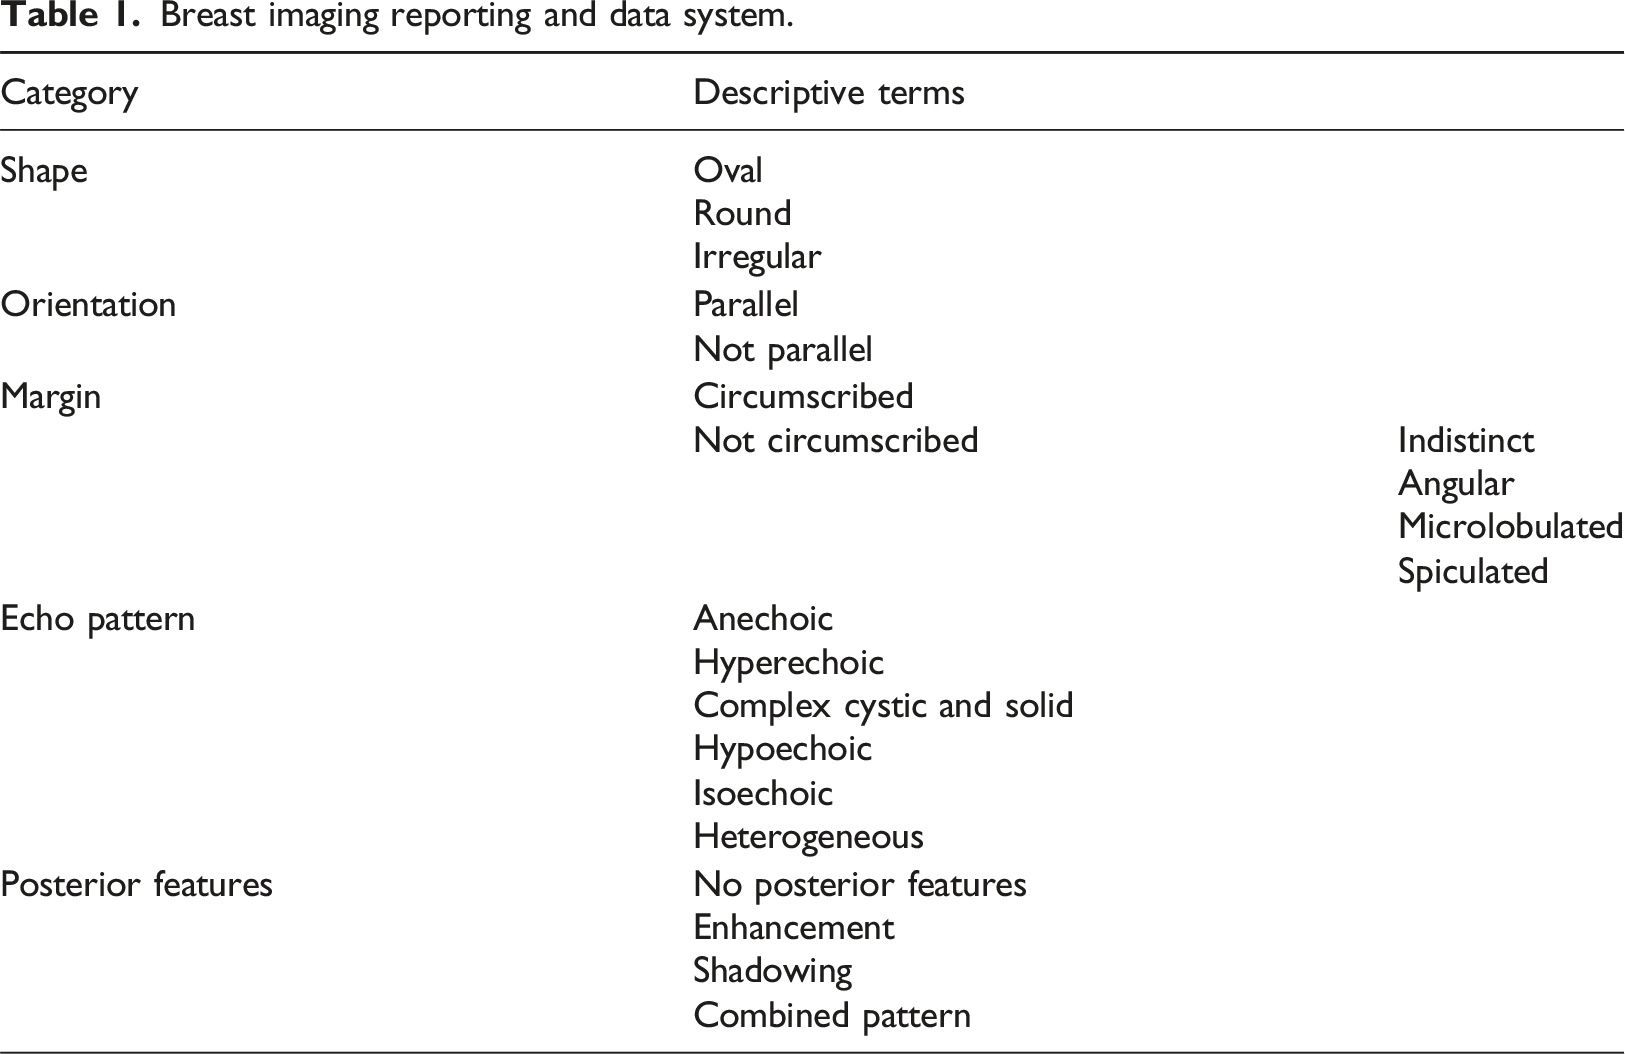
As shown in Figure 1, three information sources were considered. DICOM tags contain information about the image examination procedure. The Python library pydicom was used to read DICOM tags. After providing the path of a DICOM file, any tags in the file can be accessed using its DICOM tag number in a tuple form, such as (group, element). For breast ultrasound, the American College of Radiology (ACR) defines the standard lexicon for describing tumor findings as the breast imaging reporting and data system (BI-RADS) lexicon. The lexicon can be used as the classification labels in CAD systems to generate descriptor models. The quantitative features used in the literature were used to generate BI-RADS descriptors with machine learning classifiers.
13
For information combination, a systematic medical image interpretation template (MIIT) was designed using metadata theory.14,15 In practical use, the combined image information was automatically extracted and added to the MIIT to form a medical imaging report to be confirmed by physicians. All necessary operations related to string handling and file input/output were performed using Python. Specifically, the regular expressions library helped in formatting sentences to a specific form. Flow chart of the proposed automated imaging report.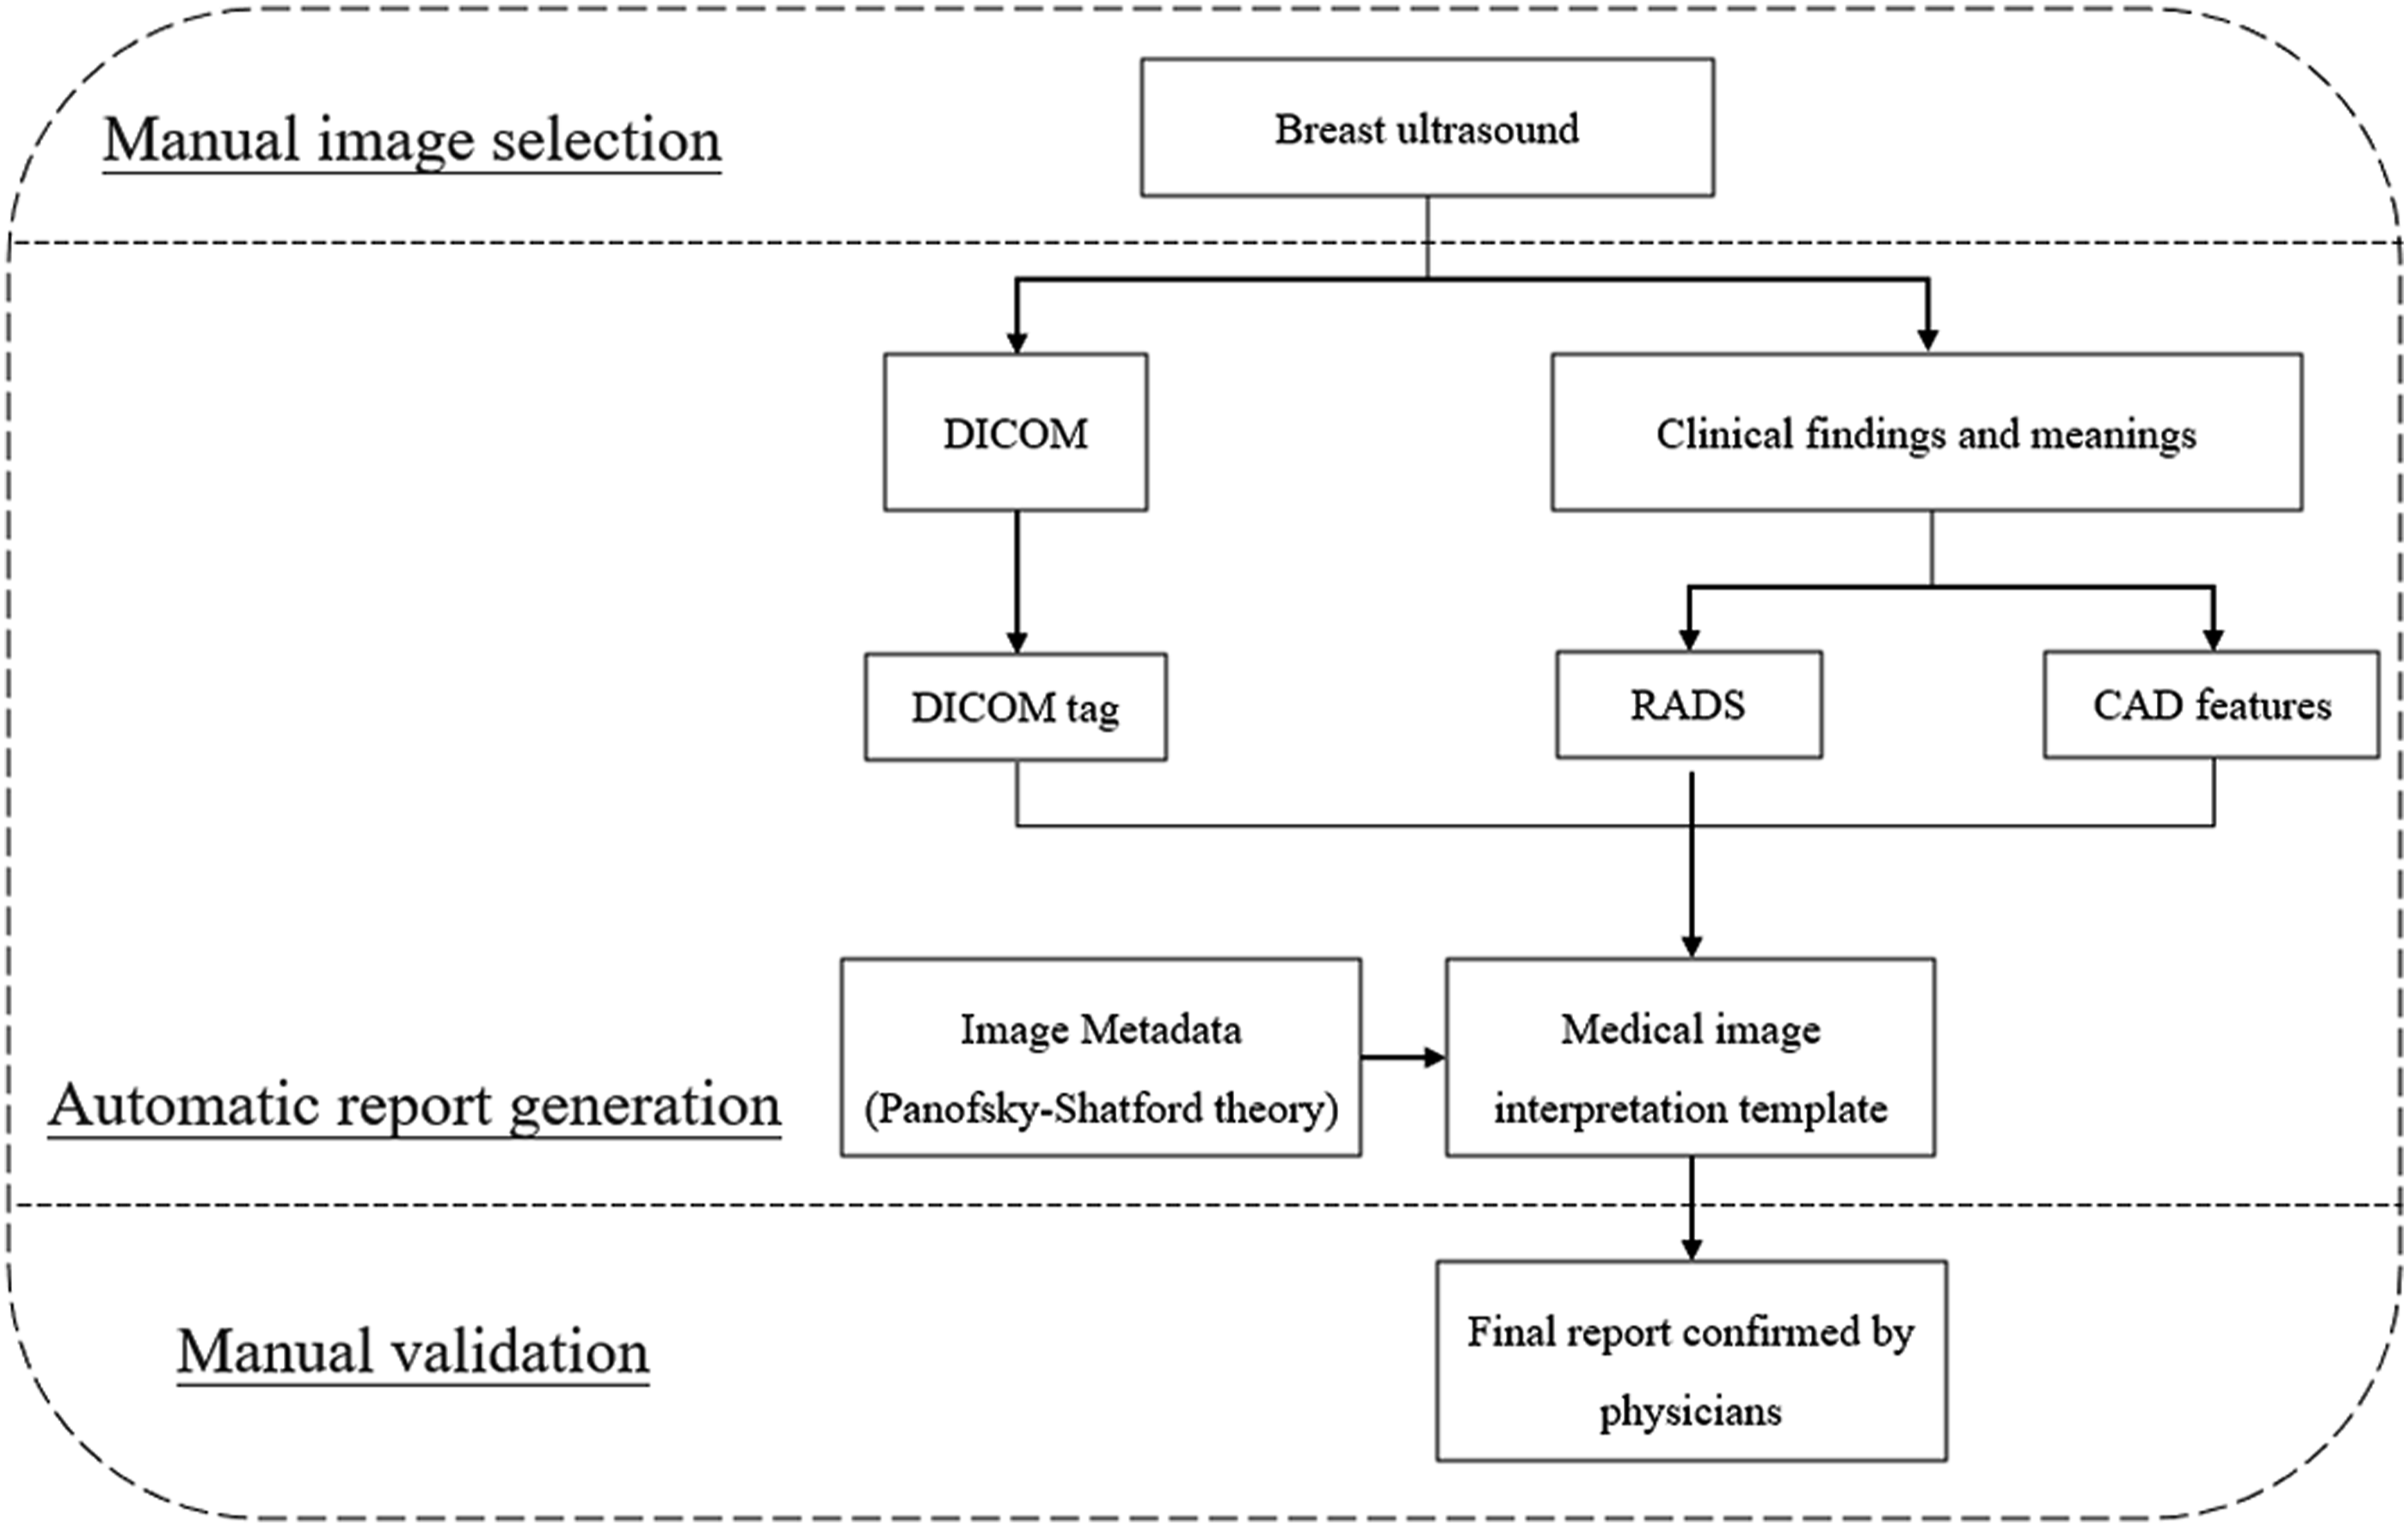
Breast ultrasound
Radiation-free, low-cost breast ultrasound provides real-time imaging with high accuracy and high sensitivity.
16
Studies have also shown that breast ultrasound can be used to distinguish benign lesions from malignant tumors.
17
Breast ultrasound can focus on local tissues with high resolution and thus provide detailed information on various characteristics, including shape, orientation, internal structure, and margins of lesions, from multiple aspects. Fat-dominated or dense breasts can be screened using breast ultrasound.
18
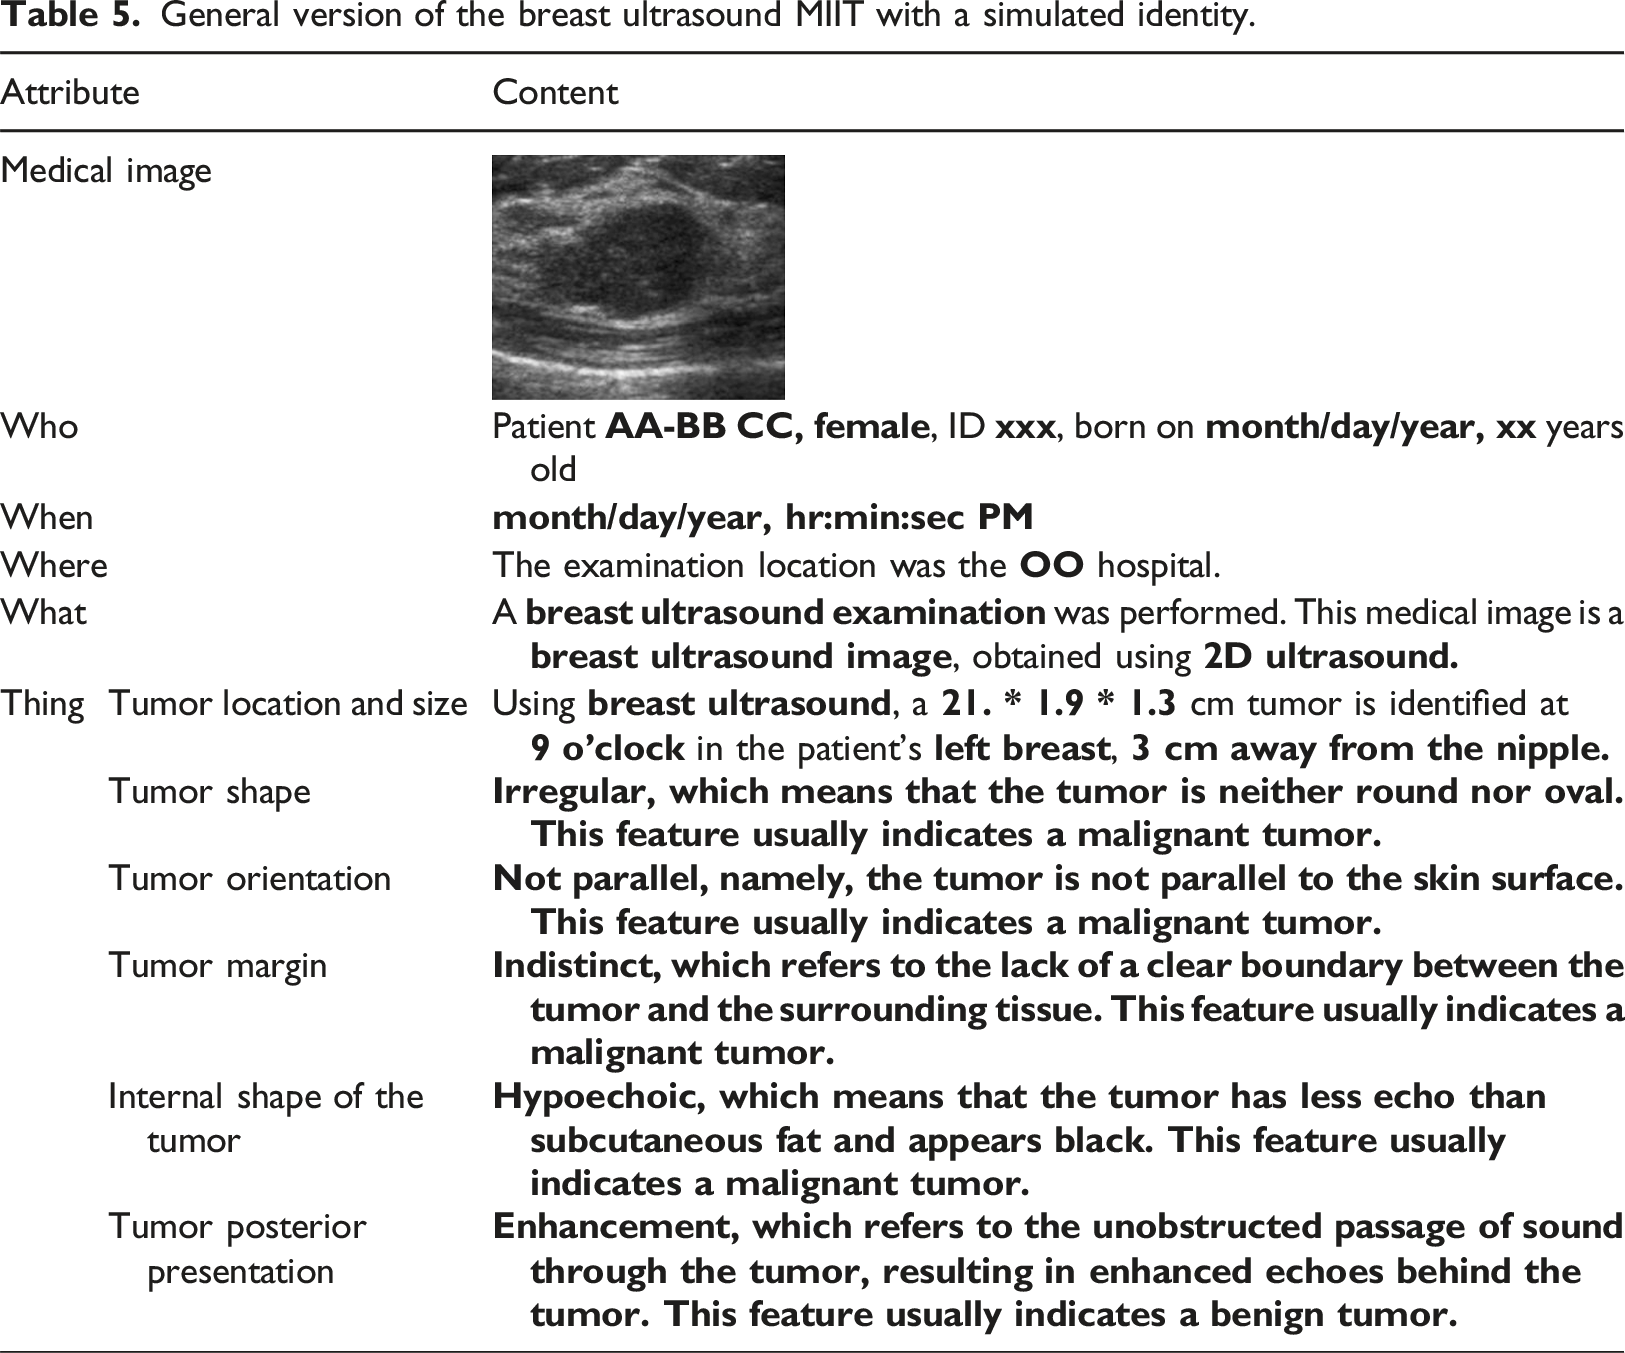
An example of a breast ultrasound image is shown in Figure 2.
19
This dataset is licensed under a CC0 1.0 Universal (CC0 1.0) Public Domain Dedication license. A breast ultrasound image.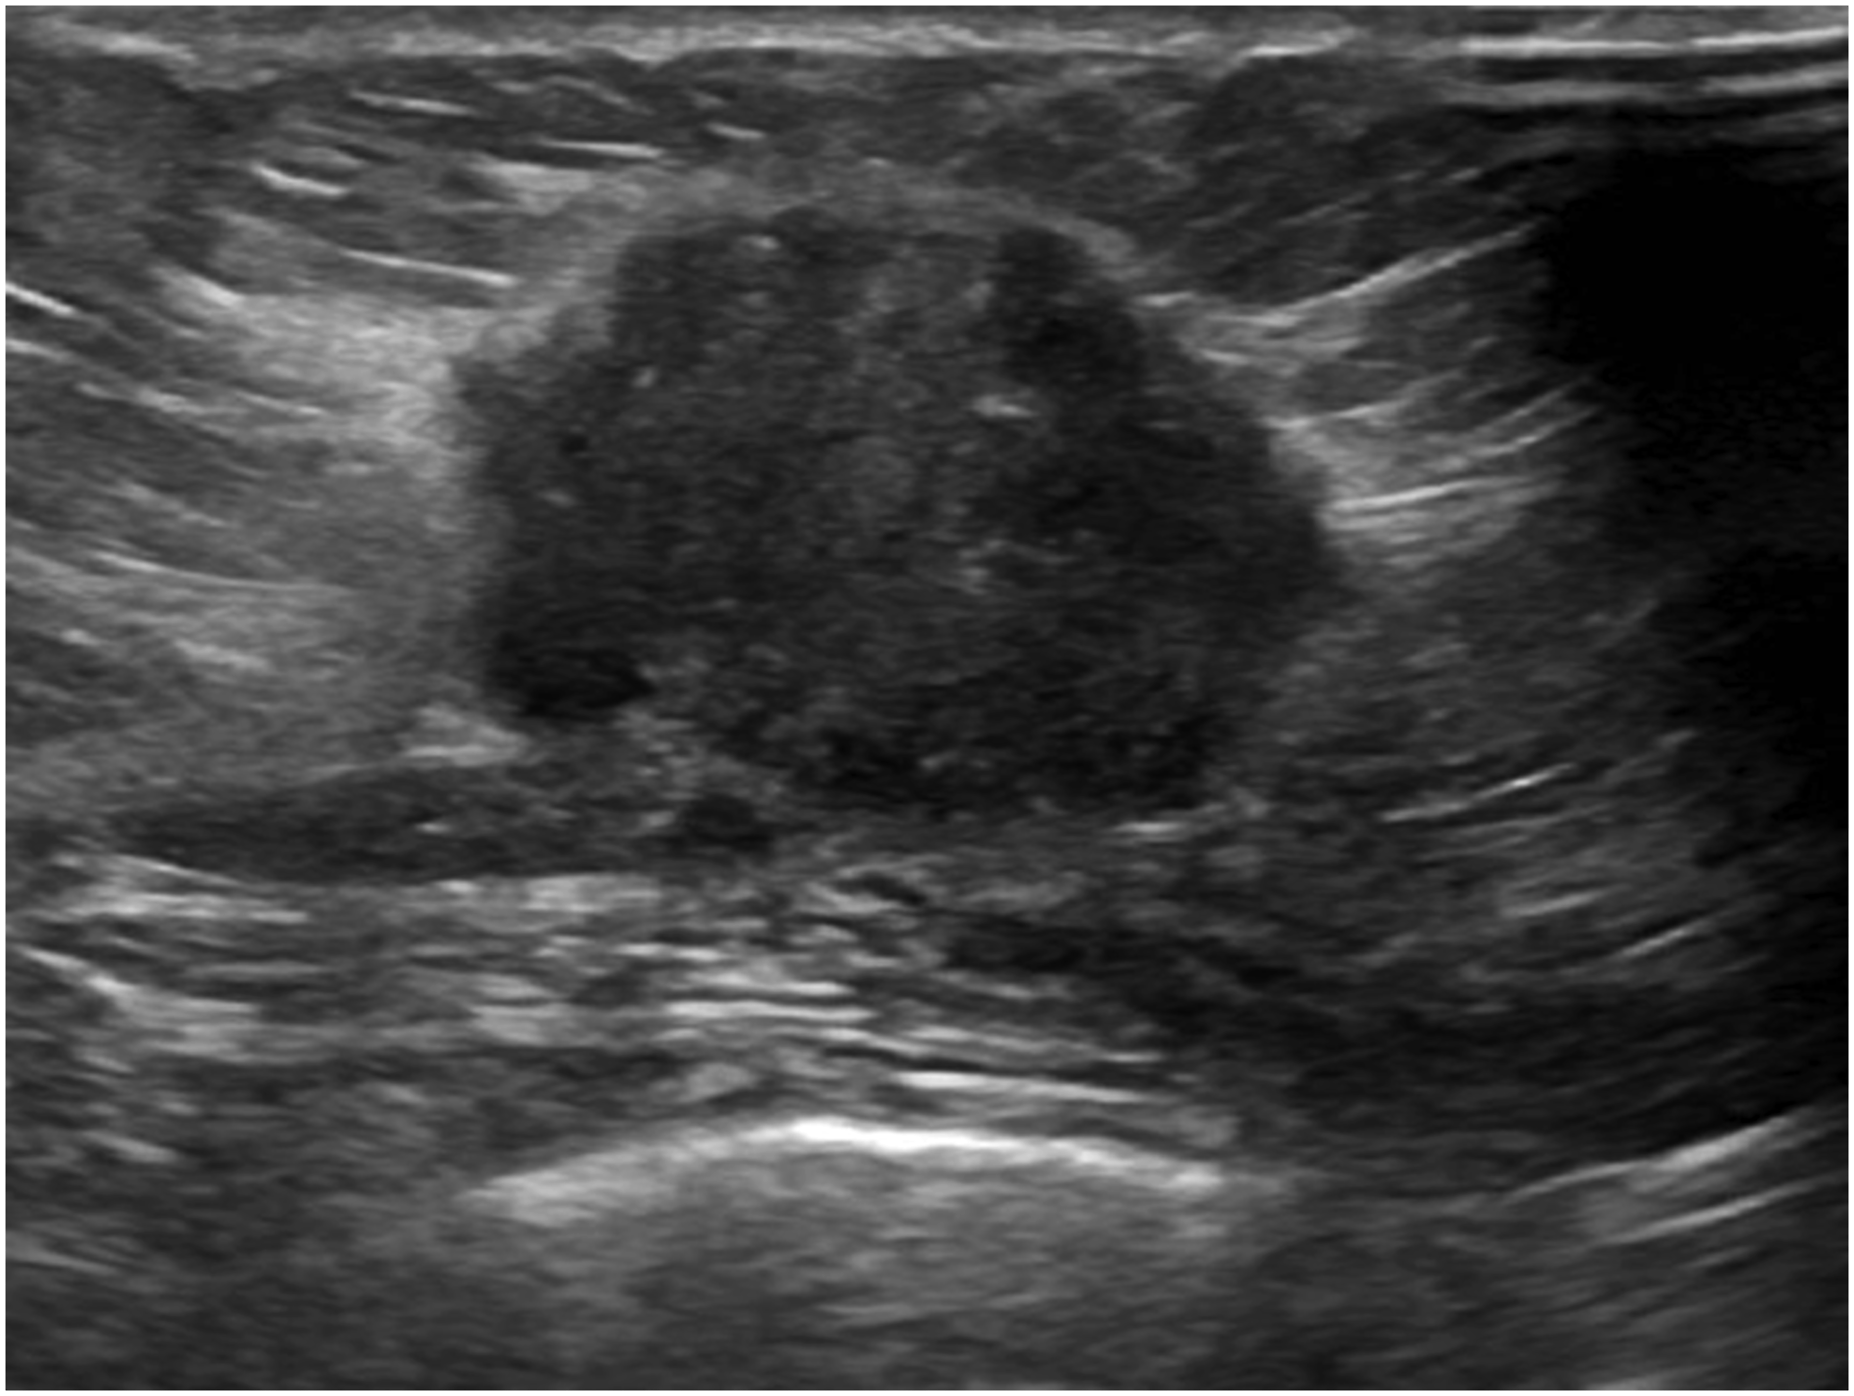
Medical image interpretation template (MIIT)
DICOM tag
The American College of Radiology and the National Electrical Manufacturers Association (NEMA) established DICOM as a storage and communication standard that can be commonly used and shared between various medical imaging equipment. 20 DICOM was initially mainly used in radiology, supporting images such as CT, MRI and ultrasound, and was gradually adopted by other professional departments, including ophthalmology, dentistry, surgery, pathology and cardiology. DICOM contains rich metadata, including image attributes such as image resolution and patient information, modality information, and hospital information.
In DICOM, metadata are called information object definitions (IODs) and are used to describe the uses of attributes and to regulate attributes. The IOD of an imaging modality can be a composite of more than two entities, such as the patient IOD, study IOD, equipment IOD, and image IOD. An attribute is a data element identified by a tag. An attribute is a pair of four-digit hexadecimal symbols, the first of which is the group number and the second of which is the element label. Taking the patient’s age as an example, the DICOM tag is (0010, 1010). The values of attributes can be characters, strings, or integers, and their data types and formats are specified using value representation (VR). Taking the date as an example, the VR name is DA. The format is YYYYMMDD, where YYYY represents the year, MM represents the month, and DD represents the day; and it is expressed in eps. The date of November 28, 2021, is represented as “DA: ‘20211128’” according to the VR specifications. In the experiment, the extracted DICOM information included the patient’s name (0010, 0010), identity number (0010, 0020), birth date (0010, 0030), sex (0010, 0040), age (0010, 1010), study date (0008, 0020) and study description (0008, 1030).
RADSs
Breast imaging reporting and data system.
CAD features
With the development of image processing and artificial intelligence, an increasing number of CAD systems have proposed various image features and classification methods.13,21,22 Common clinical applications are lesion detection, malignancy evaluation, and disease prediction. Moon et al. used machine learning to link quantitative features and BI-RADS descriptors to construct a malignancy evaluation model. 13 Based on this linking, morphological properties can be calculated, and lesions can be classified as round or irregular. The variation around a lesion boundary can be quantified with statistical metrics. Finally, for texture features or BI-RADS features, the likelihood of a tumor being malignant is estimated as a probability. Both prediction based on imaging findings and identification of malignancy are helpful for automatically providing more details about the clinical meaning of MIITs.
Image metadata
Metadata are used to describe the data. In medical imaging reports, image metadata can be used to not only completely describe the image content in detail but also present it in a systematic manner. To analyze image metadata and attribute items, researchers have proposed different theoretical frameworks for use in various fields. 23 The first is Erwin Panofsky’s iconography theory. 24 Erwin Panofsky analyzed Renaissance art by describing the artwork content and then exploring its inner meanings. The first level, preiconography, focuses on identification from an objective point of view. People recognize the lines, shapes, colors, characters, objects or actions in images according to their first intuition, which is the basic level of description. 25 The second level is iconography. Image analysis requires domain knowledge to further understand the underlying story and the specific events in images.25–27 The final level is iconographical interpretation. Based on the image elements and structures of preiconology and iconography, interpretation focuses on the meaning symbolized by images on the cognitive and spiritual levels.25,27 Iconography theory can provide clear hierarchical meanings and can be used to interpret images systematically. Thus, it has been extended to various fields as the theoretical basis for interpreting images.
Panofsky–Shatford facet matrix.
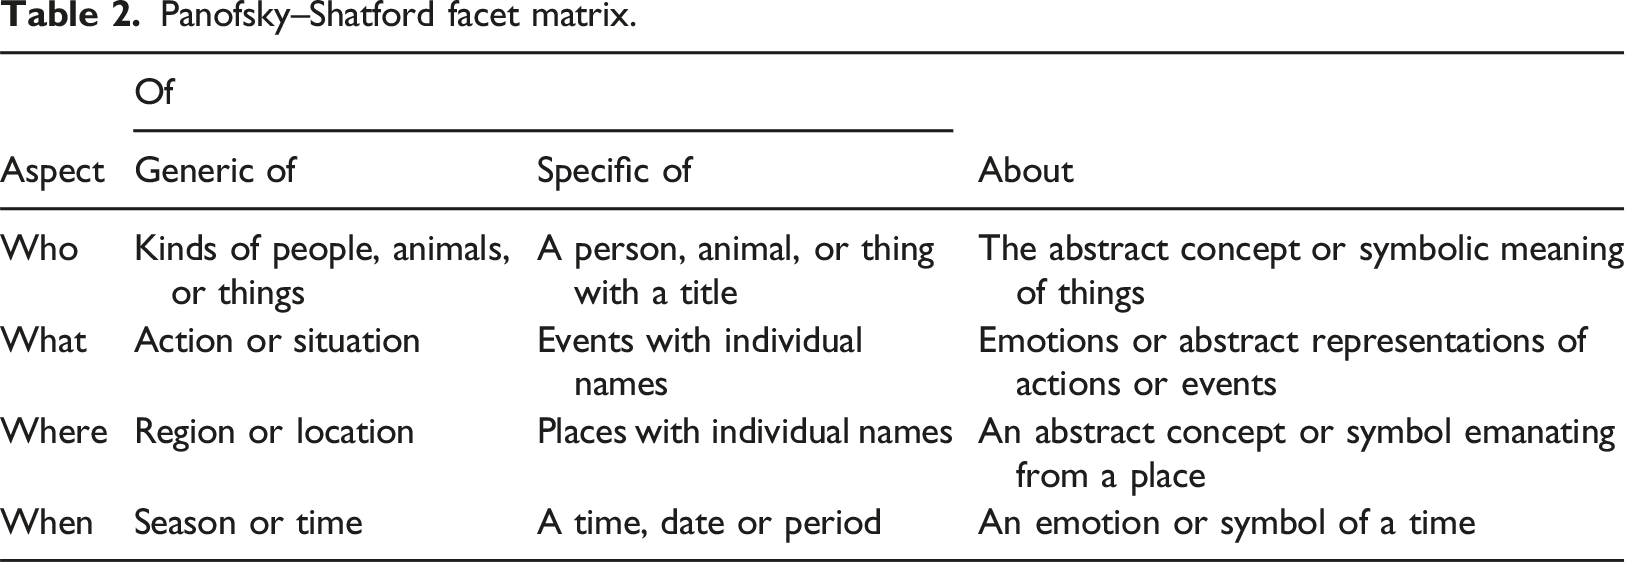
This study used Panofsky–Shatford’s image analysis theory for the design of an MIIT. The four-level division of who, what, when, and where enables a more comprehensive analysis of medical images. In terms of medical images, the lesions in the images are “things,” which are the focus of the description. Consequently, the “thing” contained in “who” in Panofsky–Shatford’s image theory is isolated to emphasize its importance. Finally, the order of who, when, where, what, and thing is used as the presentation arrangement. This MIIT can provide more detailed information and effectively promote communication between physicians and patients. Because a good imaging report must be highly readable, a questionnaire survey was performed to determine the quality of the MIIT.
Questionnaire survey
To clarify whether the MIIT can properly describe and convey the content of images, in this study, we conducted relevant assessments using a questionnaire. A general version is used as an example for implementation. The questionnaire was designed with reference to the Bristol Radiology Report Assessment Tool (BRRAT), which is a scale designed to assess the quality of radiological imaging reports. 28 The scale measures mainly the applicability with respect to the structure and content of radiology imaging reports, not the accuracy or related interpretation of the reported output results. The proposed questionnaire can be a pilot test providing preliminary data on questionnaire reliability and validity. The present information on pilot testing demonstrates a rigorous approach to developing research tools and enhances the credibility of the study design.
The questionnaire content.
The test objects included the general public on Facebook, Instagram and other social platforms, and a Google form was used to collect answers online. The appropriateness of the questionnaire was effectively established using a pretest before the formal test. The questionnaire was revised according to the results of the pretest. In the questionnaire survey, the inclusion criteria were individuals aged 18 and above, and the exclusion criteria were individuals under the age of 18. Only respondents who answered all the questions and agreed written informed consent were considered valid samples. This ensured the completeness and reliability of the data collected. The target sample size was 100 to provide sufficient statistical power to detect significant effects, assuming a medium effect size and a standard alpha level of 0.05. Similar studies in this field have utilized comparable sample sizes, indicating that 100 samples are a reasonable and accepted practice.
Statistical analysis
Exploratory factor analysis
Exploratory factor analysis is a statistical method that can be applied to analyze surveys and questionnaires. The internal structure and order of variables are explained, and common factors are deduced by removing redundant, irrelevant or vague factors; then, the relationship and validity of the structure between variables are explained.30,31 The Kaiser‒Meyer‒Olkin (KMO) test and Bartlett’s test of sphericity should be used first to determine whether collected samples are appropriate and relevant. 32 To evaluate the relevance between the variables in a sample, if Bartlett’s test of sphericity is significant (less than 0.05), then each variable in the sample has a linear correlation with other variables, which is sufficient for exploratory factor analysis.30,32
Construct validity measures the relationships between different specific variables and other variables and can be divided into convergent validity and discriminant validity. 33 Convergent validity means that the greater the correlation between a single variable (α) and other variables (β, γ, δ) is, the more closely the variables are related to each other. Discriminant validity means that the lower the correlation between a single variable (α) and other variables (β, γ, δ) is, the less there is any relationship between them. 34 Principal component analysis (PCA) can be used to extract common factors and test for convergent validity and discriminant validity. Factors with eigenvalues greater than 1.0 are recommended for retention. 35 To facilitate and simplify the interpretation of factors, the factors must be rotated, and varimax rotation is widely used. 32 Each variable must achieve moderate factor loadings of at least 0.40 before further factor naming. 30
Furthermore, reliability analysis tests whether there is consistency within the structure using the Cronbach’s alpha coefficient. 36 A coefficient greater than 0.7 was considered reliable in this study. The questionnaires, including the pretest and the formal test, underwent exploratory factor analysis (EFA) to evaluate the consistency and correlation of the questionnaires and determine whether they were valid and reliable.
Independent sample t test
An independent sample t test was used to evaluate the mean difference between two different groups. 37 In the experiment, an independent sample t test was used to test whether there were differences in the answers between subjects of different genders.
Results
Medical image interpretation template (MIIT)
Traditional breast ultrasound imaging reports.

General version of the breast ultrasound MIIT with a simulated identity.
Questionnaire results
A pretest was performed to revise the formal questionnaire based on an analysis of two dimensions: reporting quality (questions 6, 7, 9, 10, 11, and 12) and medical service (questions 1, 2, 3, 4, 5, and 8). Both items in the two dimensions had factor loadings greater than 0.5, indicating convergent validity. The overall Cronbach’s alpha was 0.915. The values indicated that the questionnaire was reliable. Given construct validity and reliability, formal testing was then performed.
A total of 100 valid questionnaire responses were obtained. The values of KMO and Bartlett’s test of sphericity were 0.910 and less than 0.001, respectively, which met the conditions for exploratory factor analysis. After PCA, two components with initial eigenvalues greater than 1.0 were retained. For the rotation sums of the squared loadings, the eigenvalue of the first component after rotation was 3.915, and the eigenvalue of the second component was 3.490. The explained variances were 32.626% and 29.083%, respectively. The two components together explained 61.709% of the variance. Hence, the two components of the formal questionnaire were extracted, which was consistent with the analysis results of the previous pretest.
The rotation component matrix showed that the factor loadings of each item in the reporting quality dimension and the medical service dimension were greater than 0.5, indicating convergent validity. In addition, when the items under the reporting quality dimension were assigned to the medical service dimension, the factor loadings of each item were all less than 0.5. Similarly, when the items under the medical service dimension were assigned to the report quality dimension, the factor loadings of each item were less than 0.5. Hence, the formal questionnaire also had discriminant validity. The Cronbach’s alpha values of the reporting quality dimension and the medical service dimension were 0.854 and 0.877, respectively. The overall Cronbach’s alpha was 0.916, indicating that the formal questionnaire was reliable.
Regarding agreement, the average agreement degree of the reporting quality dimension was 4.48, with a standard deviation of 0.476. Of the individual population, males accounted for 32%, and females accounted for 68%. According to the independent sample t test, the overall agreement coefficient was 0.374, indicating no significant difference between the sexes. For different ages, the statistical value was 0.632, indicating no significant difference among different ages in terms of overall agreement. Finally, the test value for different educational backgrounds was 0.262, indicating no significant difference in overall agreement among different educational backgrounds.
Discussion
The MIIT pays great attention to the needs of nonmedical professionals to promote communication between physicians and patients, facilitating shared decision-making. That is, patients and physicians need to share information with each other to reach mutual consensus and jointly make final medical decisions. 38 DuBenske et al. summarized three major elements of shared decision-making, namely, patient education and information transfer, interpersonal communication between physicians and patients, and a decision-making framework. 39 When physicians transmit medical information to patients or provide health education, they should use neutral terms, nonprofessional medical terms, or auxiliary tools such as videos and manuals to improve patients’ understanding of the disease. 39 In addition, in terms of decision-making, physicians must also guide patients to discuss and communicate in a timely manner and take the opportunity to understand patients’ personal preferences, culture, values or ethnic characteristics, which indirectly affect the relevant choices made by patients. 40
Cooper et al. suggested that the practice of shared decision-making in the field of radiology can be divided into four stages: access, comprehension, appraisal and application. 41 In the first stage, obstacles that prevent patients from knowing the results of their medical images should not be present, and different access channels, such as traditional paper, email, and cloud, should be provided. The main goal of the second stage is to understand the content of medical imaging reports, present the difficult medical terms appearing in medical imaging reports in a relatively popular narrative form, or use auxiliary tools to add annotations, illustrations or embedding hyperlinks to improve patients’ understanding of their health and increase patient participation in decision-making. In the third stage, the patient evaluates the relevant medical knowledge and information obtained. If the patient still cannot fully understand the disease, he or she can consult a physician in a timely manner so that he or she can accurately grasp the disease diagnosis and prognosis. In the fourth stage, physicians assist patients by making relevant recommendations to help patients make final medical decisions. Next, the role of MIIT in the four stages of shared decision-making is reviewed. The MIIT can be used to assist in obtaining medical imaging reports in the first stage. Using automatic generation, patients can obtain reports immediately. According to the analysis results of the questionnaire, the MIIT can be used in the second stage of shared decision-making. The average agreement in the report quality dimension was 4.48, showing that most people think that the MIIT can describe medical terms, medical abbreviations, and the process of medical imaging examination with popular narratives. Furthermore, the average agreement in the medical service dimension was 4.34. A structured arrangement with an unstructured narrative that indicates whether the image features are benign or malignant findings enables patients to better understand their physical conditions, which is also consistent with the third stage of shared decision-making. In addition, no significant differences in MIIT scores were noted based on gender, age and education. Finally, most people preferred that hospitals use MIIT during the examination procedure.
The motivation for this study arises from both physicians’ and patients’ needs. According to the survey results, the MIIT ensures that patients can fully realize their health status and participate in the decision-making process concerning their treatment plans. For physicians, several respondents indicated that automated imaging reporting systems could analyze diagnostic images accurately and efficiently. In the medical environment where time is often essential, efficiency is crucial. Templates also help standardize reports for various diagnoses and imaging modalities in a consistently understandable manner, ensuring that key information is clearly highlighted to aid in clinical decision-making. The methodology proposed in this study represents the first of its kind aimed specifically at generating clinical imaging reports; it explores the concept of using intelligent, structured communication to achieve shared decision-making with patients. As such, enhancing the interaction between health care providers and patients by making complex medical information more understandable and actionable is a novel approach.
Limitations
One limitation of this study is that the questionnaire utilized has not been validated in the literature. Additional studies are needed to evaluate the reliability of the questionnaires. This evaluation includes a more comprehensive expert review to assess the questionnaire’s content validity, enhancing the breadth and relevance of its items. Furthermore, by comparing them with established standards or reviewed assessment tools, the correlation and consistency of the questionnaire outcomes can be examined, thereby evaluating its criterion validity. Another limitation of this research is that feedback was collected primarily from patients or the general public, with minimal input from physicians. To create a more comprehensive and objective set of recommendations for future studies, it will be crucial to include a more diverse group of participants. This would mean actively seeking and integrating advice and feedback from a wider array of health care providers, including doctors with various specializations and years of experience. By doing so, future research can ensure that the proposed methods not only resonate with patient needs and preferences but also are feasible and practical from a clinical standpoint, thereby enhancing the overall quality and acceptance of the health care services provided.
Conclusion
This study highlighted the challenges posed by the increased workload due to nonstandardized reporting formats, making these reports less effective as communication tools. The objective was to enhance doctor‒patient communication through the production of automated imaging reports that are both informative and comprehensible. MIIT employs the image analysis theories of Panofsky and Shatford, focusing on image metadata to assess DICOM tag, RADS, and CAD features for automated report generation. Using a questionnaire survey aimed at evaluating the comprehensibility of image content, a high overall Cronbach’s alpha of 0.916 demonstrated the reliability of the results. MIIT effectively enhances the comprehensibility of medical images, addressing the need for standardized, easy-to-understand imaging reports and thereby potentially improving the quality of health care by optimizing medical communication.
Footnotes
Author contributions
Material preparation and data collection were performed by HRC under the supervision of CML; the data analysis was performed by HRC. CML checked all analysis code and the first draft of the manuscript.
Declaration of conflicting interests
The author(s) declared no potential conflicts of interest with respect to the research, authorship, and/or publication of this article.
Funding
The author(s) disclosed receipt of the following financial support for the research, authorship, and/or publication of this article: The authors would like to thank the National Science and Technology Council (NSTC 112-2622-E-004-001) for financially supporting this research.