
Abstract
Introduction
The World Health Organization defines diarrhea as it is the passing of at least three loose stools per 24 h and it primarily occurs after a bacterial, viral, or parasitic infection of the intestinal tract. 1 The commonest reported causative agents were Vibrio cholera, Escherichia coli, Salmonellae species, rotavirus, Giardia, Entamoeba, and the helminthes. 2 Diarrhea is a significant public health issue, being recognized as the second leading cause of mortality and morbidity among children under the age of five, especially in developing countries like Ethiopia.3,4 Globally, there are nearly 1.7 billion cases of childhood diarrheal disease and it kills around 443 832 children under 5 years every year,1,5 with Sub-Saharan Africa reporting the highest numbers.4,6 Based on the 2016 Ethiopian Demographic and Health Survey (EDHS) report, the prevalence of diarrhea among children under the age of five in Ethiopia was 12%. 7
According to the Integrated Global Plan of Action for the Prevention and Control of Pneumonia and Diarrhea, there is a standpoint to end up mortality caused by pneumonia and diarrhea by 2025 and it is encompassed both vital services and interventions to make a healthy environment, access to recognized and appropriate prevention and treatment measures, therefore the approach has aimed to decrease diarrhea mortality in children under-5 to <1 per 1000 live births. 8 Patients with diarrhea will have a numerous problems such as loss of appetite, weight loss, and growth failure. Moreover, diarrhea causes water and electrolyte deficits and dehydration is the fatal complication. 9 As a result diarrhea requires exigent and timely management to lessen its complications, it is better to recognize the predictors for crucial treatment and better patient’s outcomes. Therefore; effective and integrated intervention using scientific research is vital to tackle such fatal and devastating public health problem. Hence, advanced stastical studies on the predictors of diarrhea among under-5 children have paramount importance.
Currently, the healthcare sector produces huge data about patients and disease diagnosis, and when such data is well processed and analyzed with robust methods it provides important knowledge and strong evidence generation that can be used proficiently in decision-making, healthcare management, disease detection, and diagnosis. Moreover, previous studies have provided ample evidence on the socio-demographic and socio-economic related, maternal-related, environmental-related, and feeding-related factors associated with diarrhea using classical methods and traditional regression models.6,10–14 There was a lack of literature exploring the application of ML models for predictive purposes in this specific domain. The potential advantages of ML methods over the traditional models include their ability to handle complex nonlinear data, operate without preexisting assumptions, and capture intricate relationships among predictors.15,16 The ML modeling could inform the development and implementation of m-health applications and digital health systems targeting the prevention and management of the disease under study. Besides, ML algorithms offer several benefits for classification and prediction, such as automation, pattern recognition, adaptability, scalability, objectivity, handling non-linearity, feature selection, and generalization, making them powerful tools for addressing real-world problems and facilitating data-driven decision-making. 17 In this research, five advanced ML techniques such as support vector machine, RF, Gaussian naives Bayes, logistic regression, and decision tree were employed to predict the occurrence of diarrhea using demographic health survey data. The study aimed to predict diarrhea episodes and identify its predictors using state-of-the-art ML models. The findings will provide evidence for policymakers to design evidence-based programs and integrated interventions that target the prevention of diarrhea and safeguard the health of vulnerable subgroups, particularly among under-5 children in Ethiopia.
Methods
Data source
A nationally representative cross-sectional 2016 Ethiopian Demographic and Health Surveys (EDHS) were conducted and the data were obtained through a formal written request to the DHS program website (https://www.dhsprogram.com/). 18 As a member of the global demographic and health surveys program, Ethiopia participated in the EDHS 2016 for the fourth time, which was conducted using a cross-sectional study design from January 18 to June 27, 2016. This countrywide representative household survey used a multi-stage stratified sampling technique,19,20 based on the 2007 census of Ethiopia to recruit respondents from 624 clusters spread throughout nine regions and two administrative cities (187 urban and 437 rural). The unit of analysis was under-5 children with a total sample size of 10,006 chosen from 645 clusters in Ethiopia. The participant was all reproductive women who had at least one under five age child proceeding to the survey. A total of 10,006 under-5 children would make up the sample size for this study. Since the EDHS data contains several missing values for outcome variables, a total weighted of 9501 under-5 children were included and we have analyzed 29 different features in the final analysis. After performing a statistical test (such as Little’s test), we determined that the missing data was completely at random. As a result, we decided to handle the missing data through two approaches: For the outcome variable, we opted to manage the missing data by deleting those observations and for the missing independent variables, we chose to impute the values.
Population of the study
All children aged under-5 years in Ethiopia were the source populations for this study, whereas all children aged under-5 years in the selected enumeration areas (EAs) and whose diarrhea status recorded were the study populations.
Eligibility criteria
Those under-5 years old children who had a complete data on the 2016 EDHS data set were included for the current study, but children having a missing value exceeded 30% were excluded from this study.
Sampling procedures
The sampling procedure for the EDHS involved two stages (multi-stage) sampling techniques. In the first stage, a stratified sample of 645 enumeration areas (202 in urban areas) was selected using a probability proportional to size method. Within each stratum, a predetermined number of enumeration areas were independently selected based on their size. A listing procedure was then carried out in the selected enumeration areas to list all households. In the second stage, a fixed number of households were selected from each selected enumeration area using equal probability systematic sampling. More detailed information on the sampling procedure can be found in the EDHS reports available on the Measure DHS website (https://www.dhsprogram.com/) for each specific survey. 18 Sample in this study were selected children who had recorded data on diarrhea reports, resulting in a total sample size of 9501 after accounting for their respective weights.
Study variables and measurements
Outcome variable
This study has considered the children recode or kid’s record (KR file) from 2016 EDHS dataset. 20 The dependent variable is “a child had diarrhea or not prior to 2 weeks of the survey”, which was measured as a binary outcome as absence of diarrhea (coded as 0) or presence of diarrhea (coded as 1).
Independent variables
Age Group: Current age of child is re-coded in to five categories with values of “0” for <6 months, “1” for 6–12 months, “2” for 13–23 months, “3” for 24–35 months, “4” for 36–47 months, and “4” for 48–59 months”. 6 Anemia: recoded in two categories with a value of “0” for non-anemic, “1” for anemic using WHO defined hemoglobin levels less than 11 g/dl. Wealth Index: The datasets contained wealth index that was created using principal components analysis coded as “poorest”, “poorer”, “Middle”, “Richer”, and “Richest in the EDHS data set·” For this study we recoded it in to three categories as “poor” (includes the poorest and the poorer categories), “middle”, and “rich” (includes the richer and the richest categories). 21 Occupation: Re-coded in two categories with a value of “0” for not working, and “1” for working. Media exposure: A composite variable obtained by combining whether a respondent reads newspaper/magazine, listen to radio, and watch television with a value of “0” if women were not exposed to at least one of the three media, and “1” if a woman has access/exposure to at least one of the three media. Educational status: this is the minimum educational level a woman achieved and coded into four groups with a value of “0” for no education, “1” for primary education, and “2” for secondary and “3” for higher educational level.21,22 Source of drinking water: By using the DHS guide it was recoded into two categories as “unprotected” and “protected source”.18,21,23 Family size: Recoded in to two categories as 1–4, and greater than or equal 5. 22 The altitude of the cluster categorized as high and low altitude using 2500 m as reference. 21 Type of place of residence: The variable place of residence recorded as rural and urban in the dataset was used without change. Type of toilet facility: using the DHS guide following the WHO/UNICEF Joint Monitoring Programmed on Water and Sanitation guidelines it was recoded in two categories as improved if flush - to somewhere else, pit latrine - without slab/open pit, bucket toilet, and hanging toilet/latrine and unimproved if flush - to piped sewer system, flush - to septic tank, flush - to pit latrine, flush - don’t know where, pit latrine - ventilated improved pit, and pit latrine - with slab.18,23,24 Regarding stunting and wasting we have compute and classify based on a height/age Z-score < − 2SD, and a weight/height Z-score <− 2SD were considered to be stunted and wasted respectively. 25 Distance to health facility were recoded as long if it takes greater than 30 min and not long if it takes less than 30 min from the place of residence to the nearby health facility. 21 The selection of these predictors was based on information from available literature on the thematic area.6,11,26–28
Data preprocessing and analytic strategies
Before constructing a prediction model, it is crucial to preprocess raw data for analysis to enhance the model’s ability to make accurate predictions. Data preprocessing encompasses various techniques, including data cleaning, feature engineering, dimensionality reduction, and data splitting.
29
To ensure the representativeness of the data and obtain reliable estimates with increased precision, reduced standard error, and to account for unequal selection probabilities resulting from the sampling design, the data underwent weighting before statistical analysis. Continuous data was categorized using the binning discretization method. Additionally, descriptive statistics were conducted on the background characteristics of the participants to provide a comprehensive overview of the EDHS data set sample. The specific methodology employed in this study is presented in Figure 1. Study workflow diagram.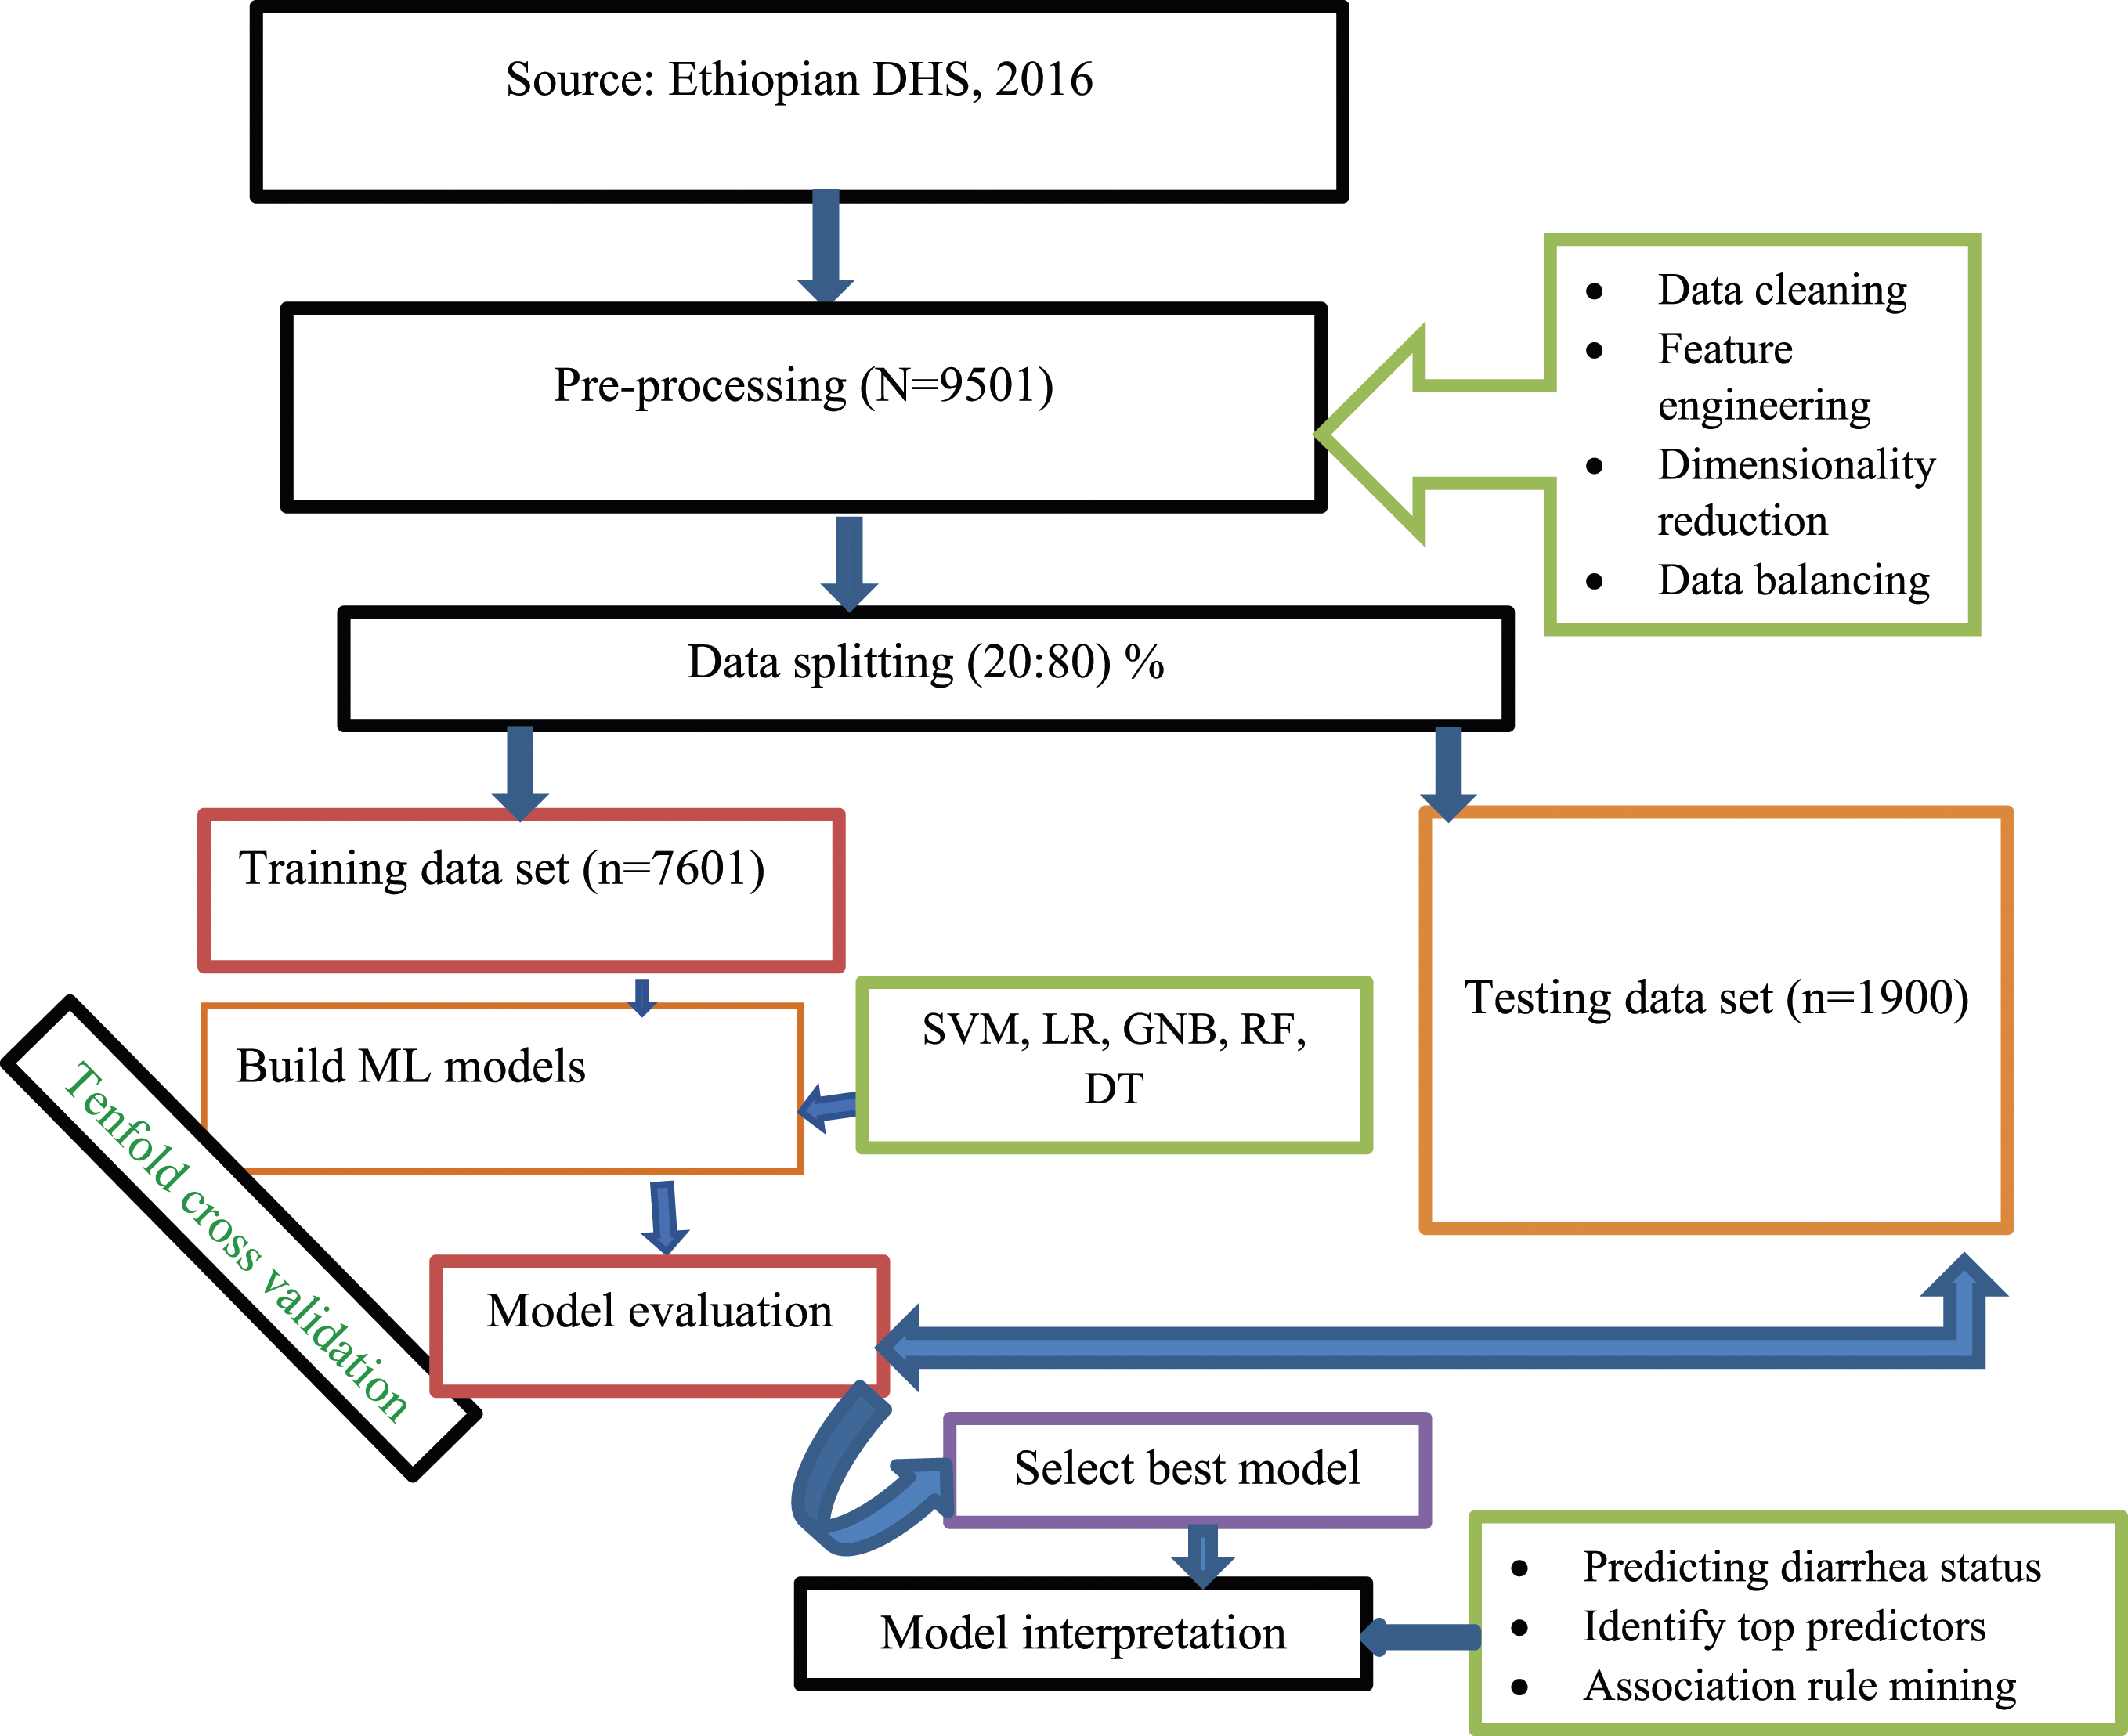
Data cleaning
The initial stage of data preprocessing involves data cleaning, which includes the identification and removal of outliers, handling missing values, and addressing imbalanced categories in the outcome variable. We explored different approaches for managing missing data in ML, such as deletion, imputation, model-based imputation, and leveraging domain-specific knowledge. Taking into account factors such as the nature of missingness, the amount of missing data, assumptions, and the ML algorithm employed, we decided to handle missing values in our dataset using complete case deletion. This approach was chosen due to a large proportion (exceeding 30%) of missing values that were completely random. 30 To identify outliers, we utilized various visualization techniques, including scatter plots, box plots, and histograms. These methods allowed us to identify data points that significantly deviated from the overall pattern. Furthermore, we assessed multicollinearity by examining the correlation matrix, considering a correlation value above 0.8 between two variables as indicative of high correlation. 31
Data balancing
Addressing imbalanced data is another important aspect of data cleaning. Imbalanced data, where one class is significantly underrepresented, poses a challenge in ML as it can result in reduced classification accuracy, especially for instances belonging to the minority class. ML models trained on imbalanced data are typically biased toward the majority class and fail to predict cases that are rare/minority class. 32 To overcome this issue, researchers have developed various techniques. In this study, we employed four balancing methods 33 : under-sampling, over-sampling, adaptive synthetic sampling (ADASYN), and synthetic minority oversampling technique (SMOTE). Initially, we trained our chosen ML algorithms using the Imbalanced data. Subsequently, we explored different methods such as under-sampling, over-sampling, ADASYN, and SMOTE to balance the data for training the models. The selection of these techniques was depends on nature of the class imbalance, computational efficiency, domain knowledge, sensitivity to outliers, and model complexity. We then evaluated the performance of the models by comparing accuracy and AUC metrics. In cases where one algorithm demonstrated higher accuracy but lower AUC compared to another, we considered the AUC value for Imbalanced data and the accuracy value for balanced data. Accuracy is a suitable metric for balanced classes, while AUC is valuable for imbalanced datasets or when the relative cost of false positives and false negatives is unknown. It is recommended to consider both accuracy and AUC, along with other relevant metrics, to gain a comprehensive understanding of the model’s performance and make informed comparisons between different ML algorithms. Considering these factors, the SMOTE balancing technique exhibited superior performance in balancing our data and improving model prediction accuracy.
Feature engineering
Feature engineering involves transforming raw data into more suitable features for predictive models. In this study, categorical variables were converted into numeric values using one-hot coding, and label encoding was used to assign unique numbers to each category of variables. Dimensionality reduction techniques were applied to reduce the number of input variables, aiming to create a simpler and more effective predictive model for new data. 34
There are two approaches to dimension reduction: feature selection and feature extraction, with the latter being more appropriate for image processing. 34 Feature selection involves choosing the most relevant independent variables that have the greatest impact on predicting the target variable. In our dataset, feature selection is the appropriate method. Various well-known feature selection methods were explored, including Lasso, PCA, wrapper methods (such as forward selection, backward elimination, and recursive feature elimination), correlation-based feature selection, and chi-square test. Their performance was compared using evaluation metrics such as accuracy, sensitivity (recall), specificity, F1 score, and area under the curve (AUC). 35 Based on this analysis, Boruta was identified as the most effective feature selection method. Boruta is a wrapper-based technique that utilizes the RF classifier algorithm, known for its unbiased and consistent performance in selecting key variables.36,37 Combining Boruta with the RF classifier offers several advantages, including enhanced feature selection, robustness against noise and irrelevant features, reduced bias in feature importance, and improved interpretability. This combination refines the feature selection process, resulting in improved model performance, reduced over fitting, and increased interpretability. However, there are challenges and limitations associated with their use such as computationally intensive, especially for large datasets or high-dimensional feature spaces, less intuitive and transparent, struggle with complex, non-linear relationships between input features, and not scale well to extremely large or high-dimensional datasets, which were overcome using techniques such as L1 or L2 regularization, cross-validation, maintaining an independent test set, parallel processing, analyzing feature importance stability across multiple runs or subsets, recursive feature elimination, balancing false positives and false negatives, and conducting principal component analysis. 38
For data splitting, an 80/20 split method was employed, where 80% of the samples (7601 respondent data) were used for training and the remaining 20% (1900 samples) were used for testing the model. However, for model training, a tenfold cross-validation method was utilized, as it avoids excessive data wastage, which is advantageous when the sample size is small. 39
Model selection and development
After splitting the data into training and testing sets, we proceeded to select suitable models for training. Since the target variable involved classification, specifically binary classification for diarrhea status (child has diarrhea or no diarrhea), we chose five state-of-the-art ML algorithms to assess their predictive capabilities. These algorithms were selected based on previous research utilizing ML techniques for classification tasks on EDHS data.15,40–42 Moreover, the selection of these algorithms were depend on their scalability, interpretability, features number, computational efficiency, data characteristics, type of problem, robustness to noise/outlier, accuracy, bias-variance trade off, and domain expertise. In this study, we utilized the scikit-learn version 1.3.2 packages in Python, implemented within Jupyter Notebook, to employ ML algorithms. The descriptions of the five algorithms are as follows:
Support vector machine (SVM)
Support vector machine (SVM) is a set of supervised learning methods used for classification, regression, and outlier detection. SVMs are preferred when dealing with high-dimensional spaces, robustness to outliers, nonlinearity, margin maximization, memory efficiency, and small to medium-sized datasets are important considerations for the problem at hand. 43 However, SVMs may have limitations in terms of scalability to large datasets and computational efficiency, especially when using non-linear kernels. 44 Besides, SVMs may not perform well when the dataset is imbalanced, or when the classes are overlapping and not well-separated.
Gaussian Naïve Bayes (GNB)
Gaussian Naïve Bayes (GNB) is an algorithms built based on Bayes theorem which has two basic assumptions. 45 The first one is every pair of features should be independent of each other and the second assumption is the feature must have an equal contribution to the outcome prediction. GNB is preferred when efficiency, simplicity, handling continuous features, small training sets, text classification, and the feature independence assumption are important considerations for the problem at hand. 46 However, GNB may not perform well in cases where the two assumptions are severely violated. It may struggle with datasets where the features have strong dependencies or when the decision boundary is complex.44,45
Decision tree (DT)
A DT is a non-parametric technique that classifies a data set based on the problem’s predictive structure. DT is highly interpretable, efficiently capture nonlinear relationships, handle both categorical and numerical features, relatively robust to outliers and noisy data, handle missing values by utilizing surrogate splits or imputation techniques, and can handle large datasets efficiently. 47 For this study, because of these advantages we have employed DT algorithm to predict the status of diarrhea among under-5 children in Ethiopia. However, DT also has limitations such as prone to over fitting, struggle with capturing certain complex relationships that require more sophisticated algorithms, and can be sensitive to small changes in the data, leading to different tree structures. 44
Logistic regression (LR)
Logistic regression (LR) is a supervised ML algorithm used to solve classification issues. It is a parametric method that assumes a Bernoulli distribution of the target variable and the independence of the observations. 43
Random forest (RF)
Random forest (RF) is a supervised ML that can be used for classification, regression, and dimension reduction purposes. It is a versatile algorithm used for huge amounts of data and overcoming noise. RF uses an error-minimizing technique to select the variables to split into groups. RF are preferred when improved predictive performance, reduced bias, reduction of variance, robustness to noise and outliers, feature importance, and handling high-dimensional data are important considerations for the problem at hand.48,49 However, RF has some limitations such as a black-box model, making it less interpretable or more difficult to interpret compared to individual DT; the ensemble nature of RF makes it challenging to trace the decision-making process. Besides, RF may not perform well on datasets with strong linear relationships.44,45
Model training and evaluation
Once splitting the data into training and testing sets, we selected suitable models for training, focusing on classifiers appropriate for the categorical target variable. The dataset involved binary classification for diarrhea, so we utilized five ML algorithms: LR, RF, SVM, GNB, and DT classifiers.
Once the models were selected, we trained them using both balanced and imbalanced data. Then best predictive model was chosen and trained using balanced training data for the final prediction on unseen test data. To assess the performance of the final model, we used a confusion matrix and receiver operating characteristic (ROC) curve, employing metrics such as accuracy, sensitivity/recall, specificity, F1 weighted score, and area under the curve (AUC). AUC was considered the primary performance metric as it provides an overall evaluation of the model’s performance at various classification thresholds. The confusion matrix allowed us to extract one-dimensional performance metrics, including True Positive (TP), True Negative (TN), False Positive (FP), and False Negative (FN). 32 Moreover, median percent error and measure of bias were estimated.
Accuracy: The proportion of correctly classified instances over the total number of instances. It is appropriate when the classes are balanced, misclassification costs are symmetric, and there is no significant class imbalance.
Precision: The proportion of true positive predictions over the total number of positive predictions. It indicates the model’s ability to correctly identify positive instances.
Recall (Sensitivity or True Positive Rate): The proportion of true positive predictions over the total number of actual positive instances. It measures the model’s ability to capture positive instances. Recall is particularly useful in imbalanced class settings, where the cost of missing positive instances is high and in applications where early detection or risk mitigation is critical. 50
F1 weighted Score: The harmonic mean of precision and recall. The F1 weighted score is particularly useful in imbalanced class settings, where precision and recall need to be considered equally, and in situations where a trade-off between precision and recall is important.
Specificity (True Negative Rate): The proportion of true negative predictions over the total number of actual negative instances. It measures the model’s ability to correctly identify negative instances. Specificity is particularly useful in imbalanced class settings, where the cost of false positive errors is high and in applications where risk mitigation or minimizing false positive rates is critical.
ROC Curve (Receiver Operating Characteristic Curve): A graphical representation of the trade-off between true positive rate and false positive rate at various classification thresholds. The ROC curve is particularly useful in imbalanced class scenarios, for threshold selection, and for comparing models. Its threshold insensitivity and visual representation make it a valuable tool for evaluating the overall performance of classification models. 51
The Area under the ROC Curve (AUC-ROC) is commonly used as a metric to assess the model’s discriminative power.
Confusion Matrix: A tabular representation that shows the counts of true positives, true negatives, false positives, and false negatives. It provides a detailed breakdown of the model’s performance. The confusion matrix is particularly useful for understanding error types, analyzing performance on imbalanced classes, conducting error analysis, comparing models, and assessing the impact of threshold selection.
Ultimately, the choice of evaluation metric should be driven by the specific context requirements, trade-off between different evaluation metrics, benchmark and standard on the same field, model interpretability, problem type, data characteristics, and goals of the task at hand. Therefore, it’s crucial to carefully evaluate and select the metrics that best align with the problem type, data characteristics, and objectives to effectively assess the model’s performance.52–54
In addition to the standard metrics, tenfold cross-validation techniques were employed to further evaluate the model’s performance. Tenfold cross-validation involves dividing the data into ten subsets and training and evaluating the model ten times, each time using a different combination of nine subsets for training and one subset for evaluation. 55 The research also carried out a comprehensive examination of hyper parameters with the aim of enhancing and optimizing the model’s performance. Various methods such as grid search, random search, and Bayesian optimization were systematically employed to discover the most effective hyper parameter configurations. The choice of these methods is depend on various factors such as the size of the search space, the available computational resources, and the desired balance between exploration and exploitation. Grid search is a simple and exhaustive method but can be computationally expensive. Random search is less intensive but may require more iteration. Bayesian optimization is efficient and effective for complex search spaces but may require additional setup and computational resources. Suitability of each tuning method also depends on the specific ML algorithm being used and the characteristics of the dataset. Experimentation and evaluation of different methods on the validation set is recommended to identify the most effective approach for hyper parameter tuning. 56 Therefore, the authors tried all techniques considering their advantages to select the best tuning technique based on their performance metrics. Additionally, to enhance the precision and reliability of the model used in this study, calibration was conducted. By fine-tuning the model through calibration, its ability to accurately predict the desired outcome was significantly improved.
Model interpretability
Researchers have emphasized the potential of combining SHAP (SHapley Additive exPlanations) values and association rule mining for various purposes.57,58 Association rule mining is suitable for uncovering hidden patterns and connections in the data, while SHAP analysis is more appropriate for understanding how different features impact on the model predictions and a widely used method in ML for interpreting predictions and understanding feature importance.57,59 To gain a comprehensive understanding of the data and analyze factors influencing diarrhea prediction, we employed multiple techniques. Firstly, we calculated average SHAP values to assess the overall impact of each feature on the model’s predictions, providing insights into the relative importance of variables. It assigns a numerical value, known as a SHAP value, to each feature, indicating its contribution to predictions. Positive values signify positive contributions, negative values indicate the opposite, and the magnitude represents the strength of influence. SHAP analysis enhances transparency and interpretability, offering a global perspective on feature importance and explaining individual predictions.60–62 Following that, we utilized a waterfall plot to visually represent the cumulative effects of these variables, highlighting their contributions to the overall prediction. 63
Association rule mining
In this study, we utilized association rule analysis with the Apriori algorithm in R software to identify specific predictor variables associated with diarrhea. The aim of this analysis was to uncover connections between categorical attributes and diarrhea among under-5 children in Ethiopia, as ML algorithms do not inherently reveal the strength of associations with diarrhea for different categories. By examining frequently occurring patterns and identifying dependencies among attributes, our goal was to understand the relationships between different attributes and their level of confidence in predicting diarrhea. To achieve this, we employed If/Then statements to reveal these associations. 64 The If/Then association rule is a pair of attributes (X, Y) expressed as X->Y, where X is the antecedent and Y is the consequent. This rule signifies that if X happens, then Y would also happen. The relationship between X and Y attributes can be categorized based on the lift value. A lift value of 1 indicates an uncorrelated rule, meaning that X and Y appearing at the same time belong to independent random events and have no special significance. If the lift value is less than 1, it indicates a negative correlation rule, where the occurrence of X reduces the occurrence of Y. On the other hand, if the lift value is greater than 1, it indicates a positive correlation rule, where the occurrence of X promotes the occurrence of Y. 65
Statistical analysis used in this study
In this study we have employed a range of statistical analysis techniques to gain insights from their data and develop effective models. Exploratory data analysis, such as examining descriptive statistics and visualizing data patterns, is typically the first step to understand the characteristics of the dataset. Regression analysis is commonly used to model the relationship between variables, while classification techniques are applied to categorize data into different groups. Model evaluation metrics, like accuracy, AUC, and F1-score, are crucial for assessing the performance of the developed machine learning models; while techniques like cross-validation help estimate the model’s generalization ability. Additionally, SHap analysis and association rule mining technique were employed. By integrating these diverse statistical analysis approaches, researchers can extract meaningful insights, build robust machine learning models, and draw reliable conclusions from their studies.
Results
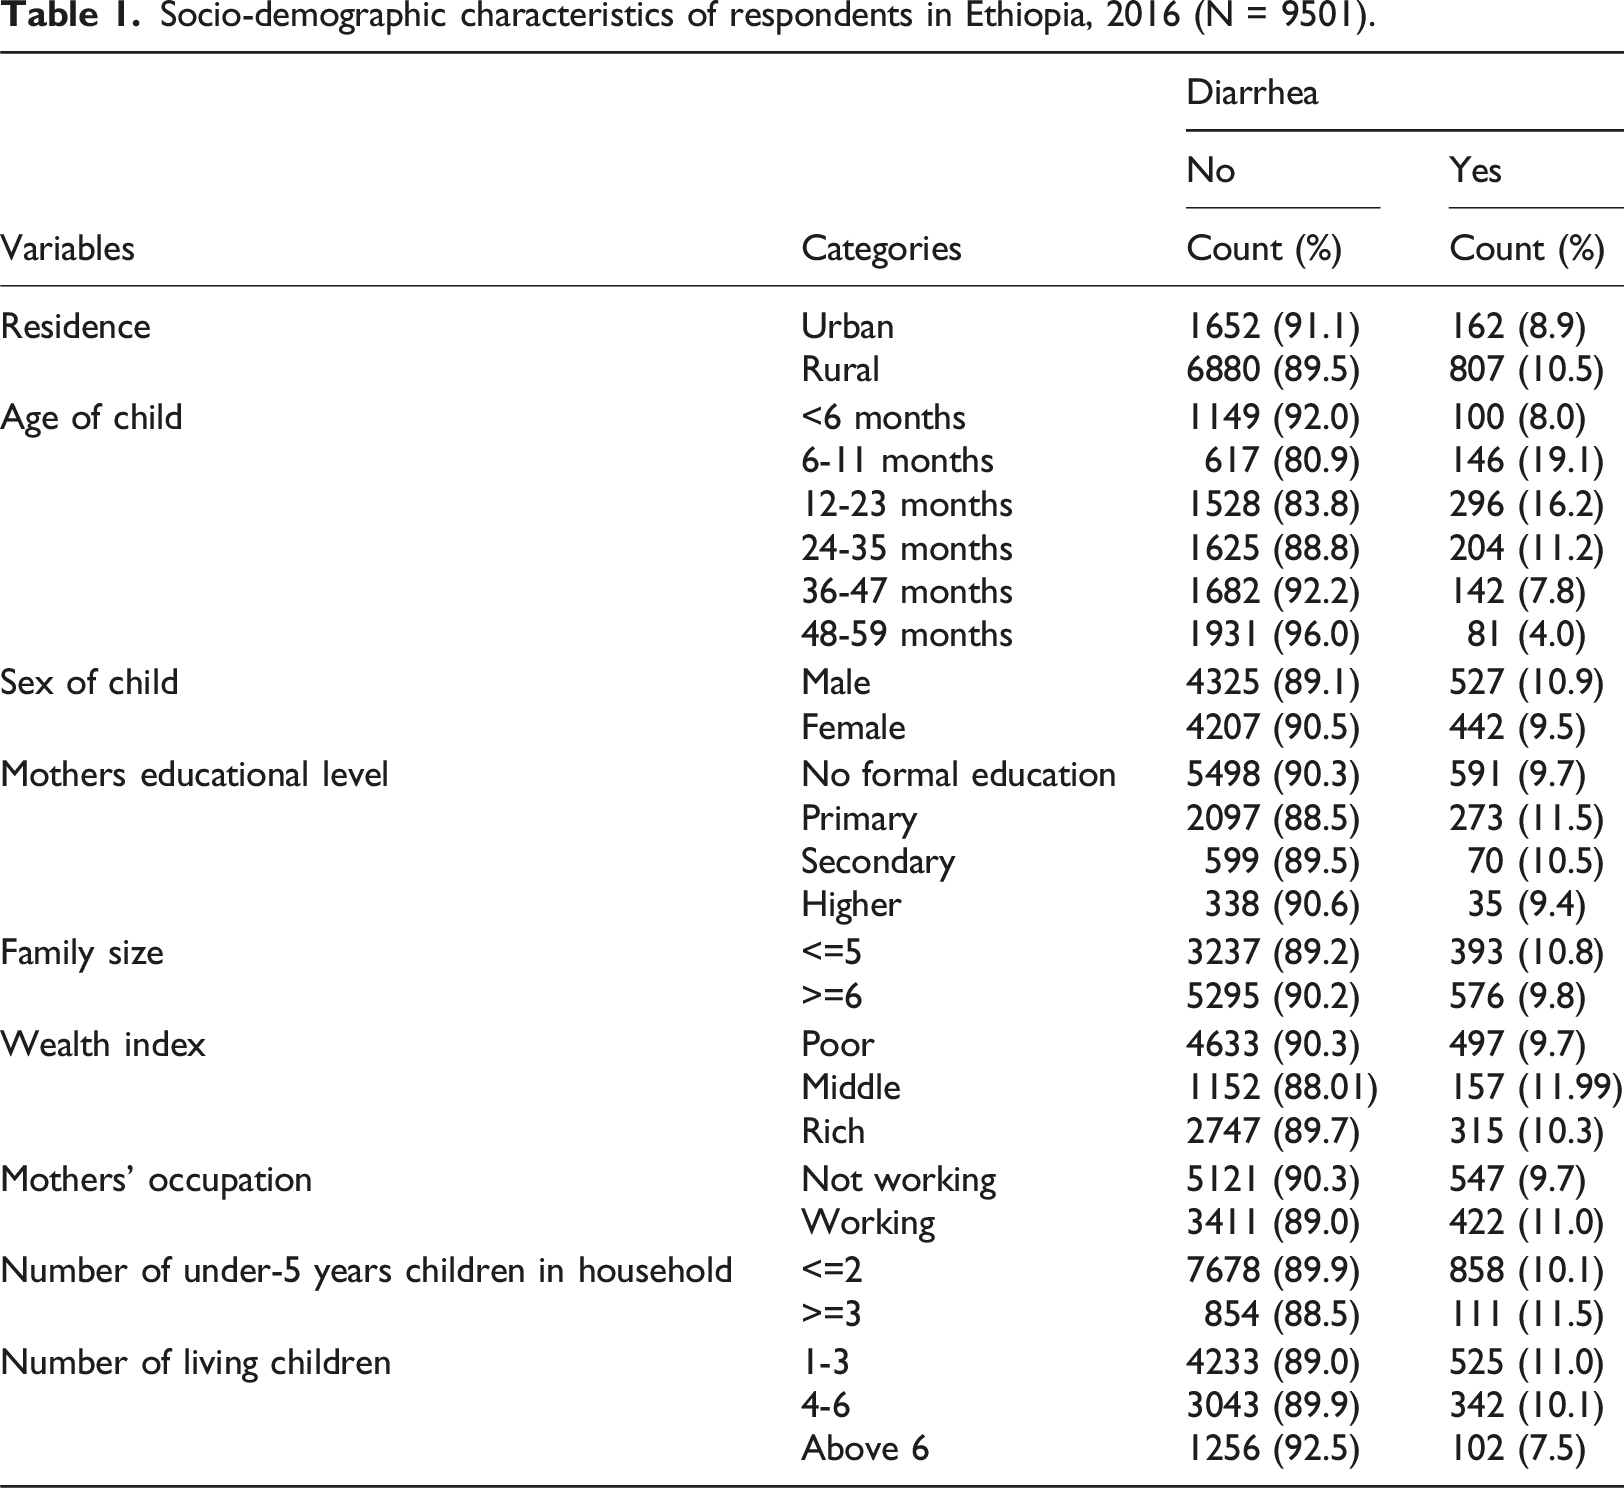
Socio-demographic characteristics of study participants
Socio-demographic characteristics of respondents in Ethiopia, 2016 (N = 9501).
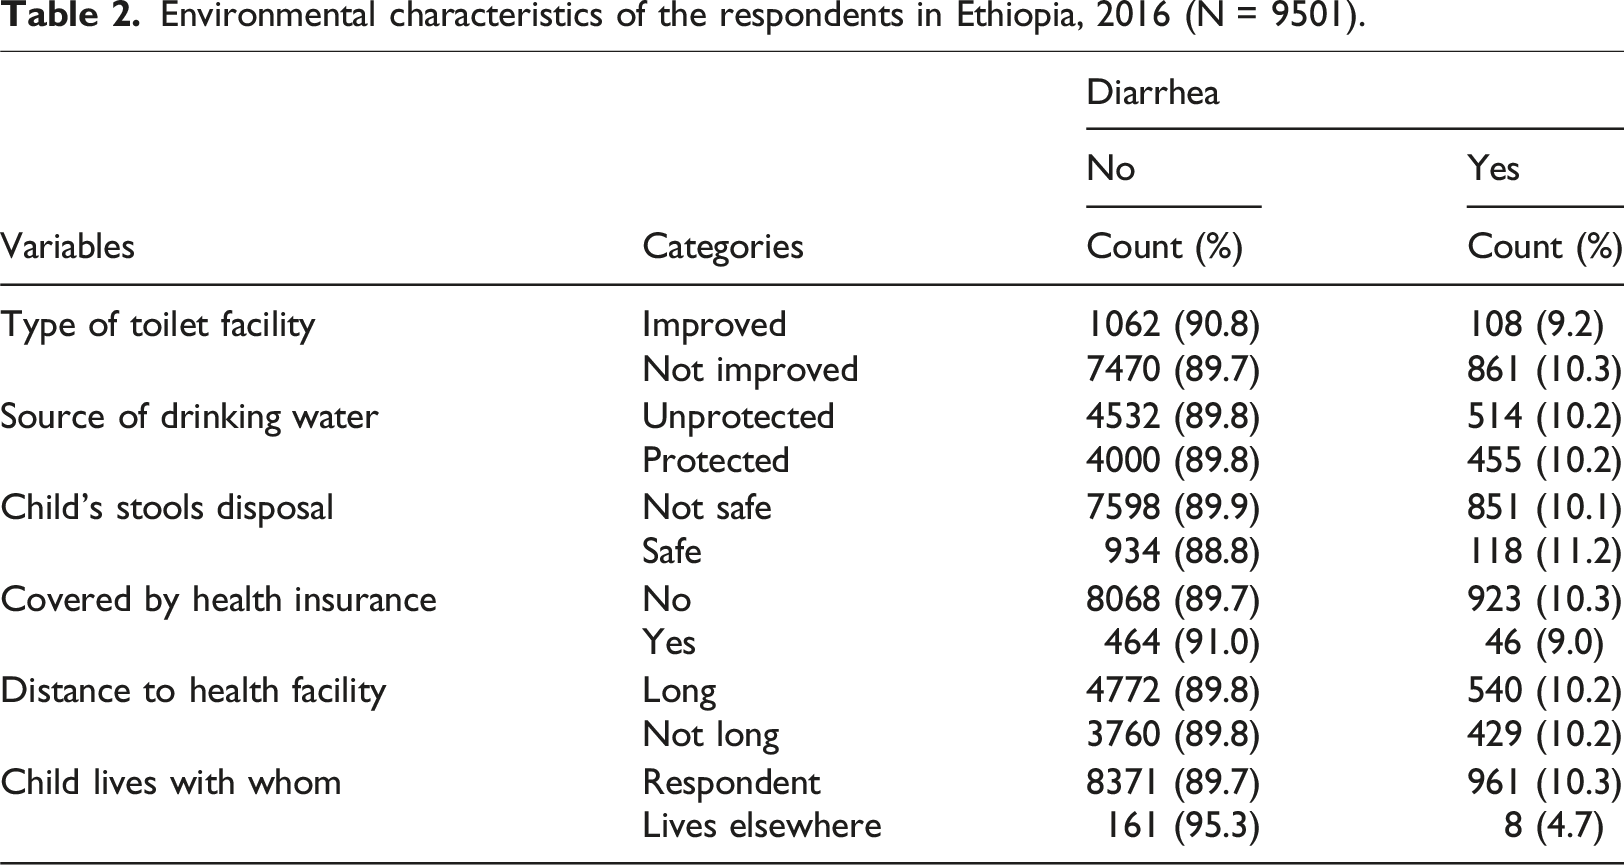
Environmental characteristics of respondents
Environmental characteristics of the respondents in Ethiopia, 2016 (N = 9501).
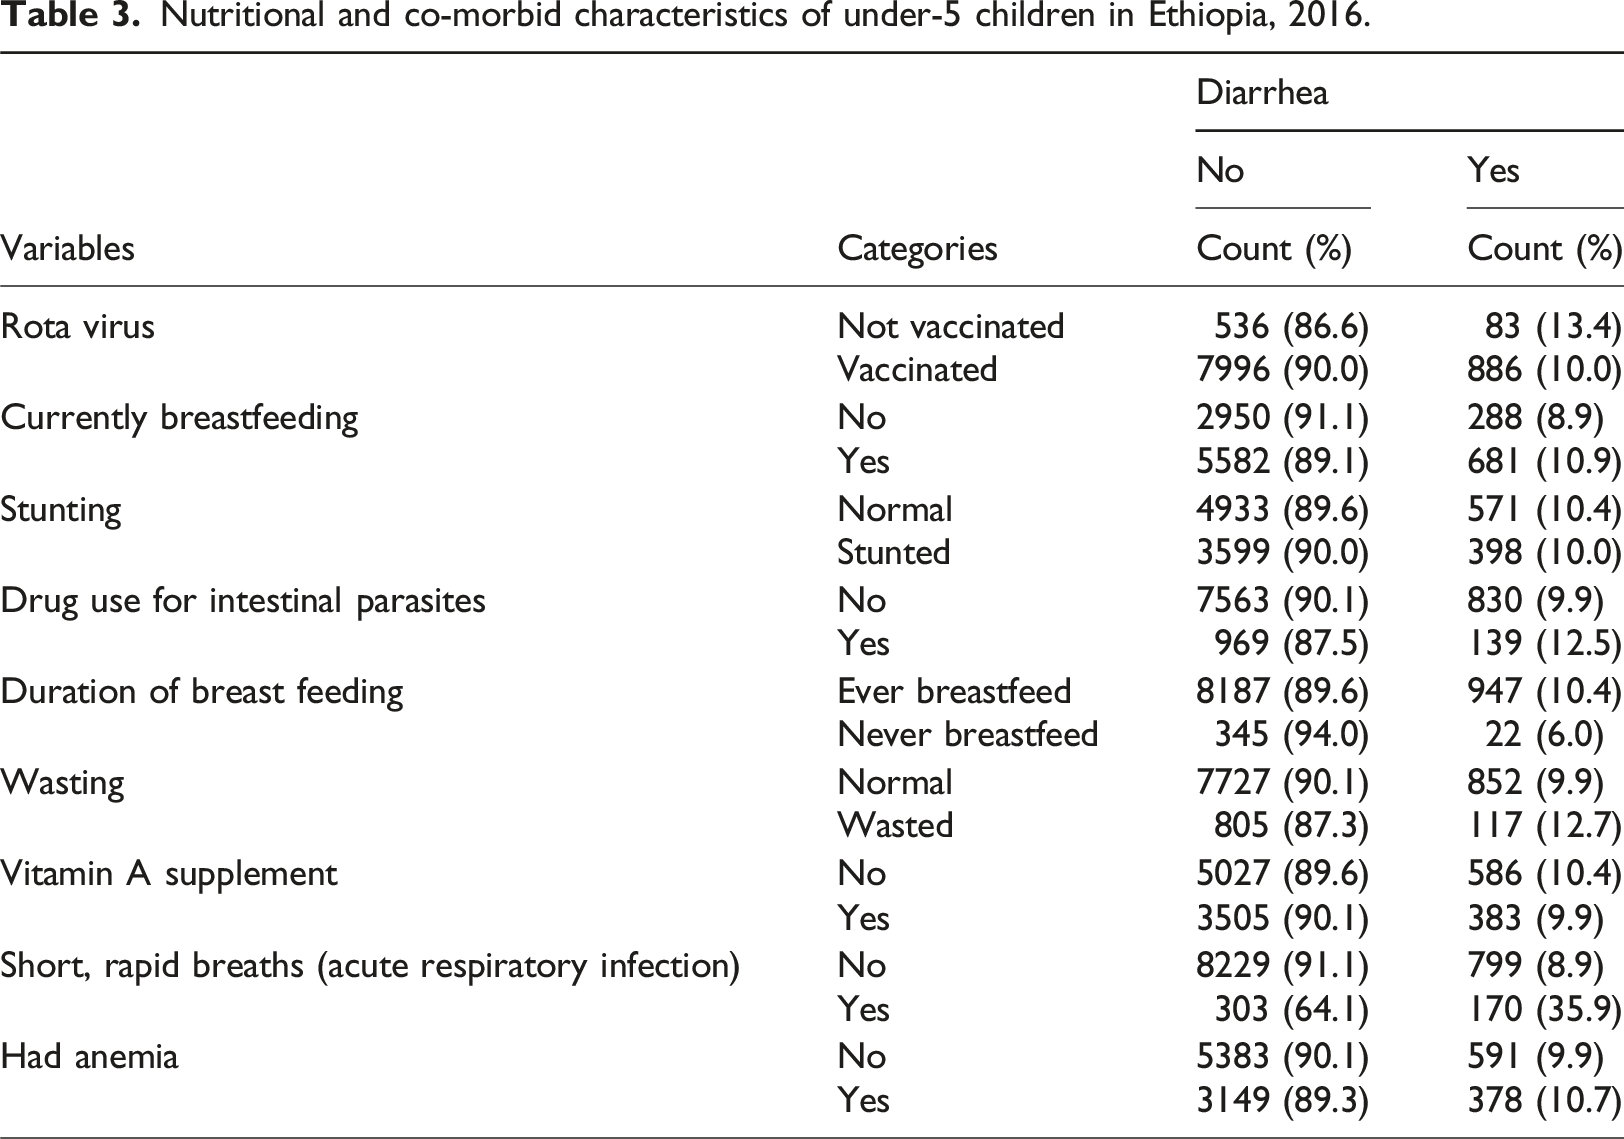
Nutritional and co-morbid characteristics among under-5 children
Nutritional and co-morbid characteristics of under-5 children in Ethiopia, 2016.
Prevalence of diarrhea among under-5 children in Ethiopia
From a total of 9501 under-5 children were included in the analysis, the prevalence of diarrhea prior to 2 weeks of the 2016 survey was found to be 969 (10.2%) (Figure 2). Prevalence of diarrhea among under-5 children in Ethiopia in 2016 using Imbalanced data set (a) and balanced data with SMOTE techniques (b).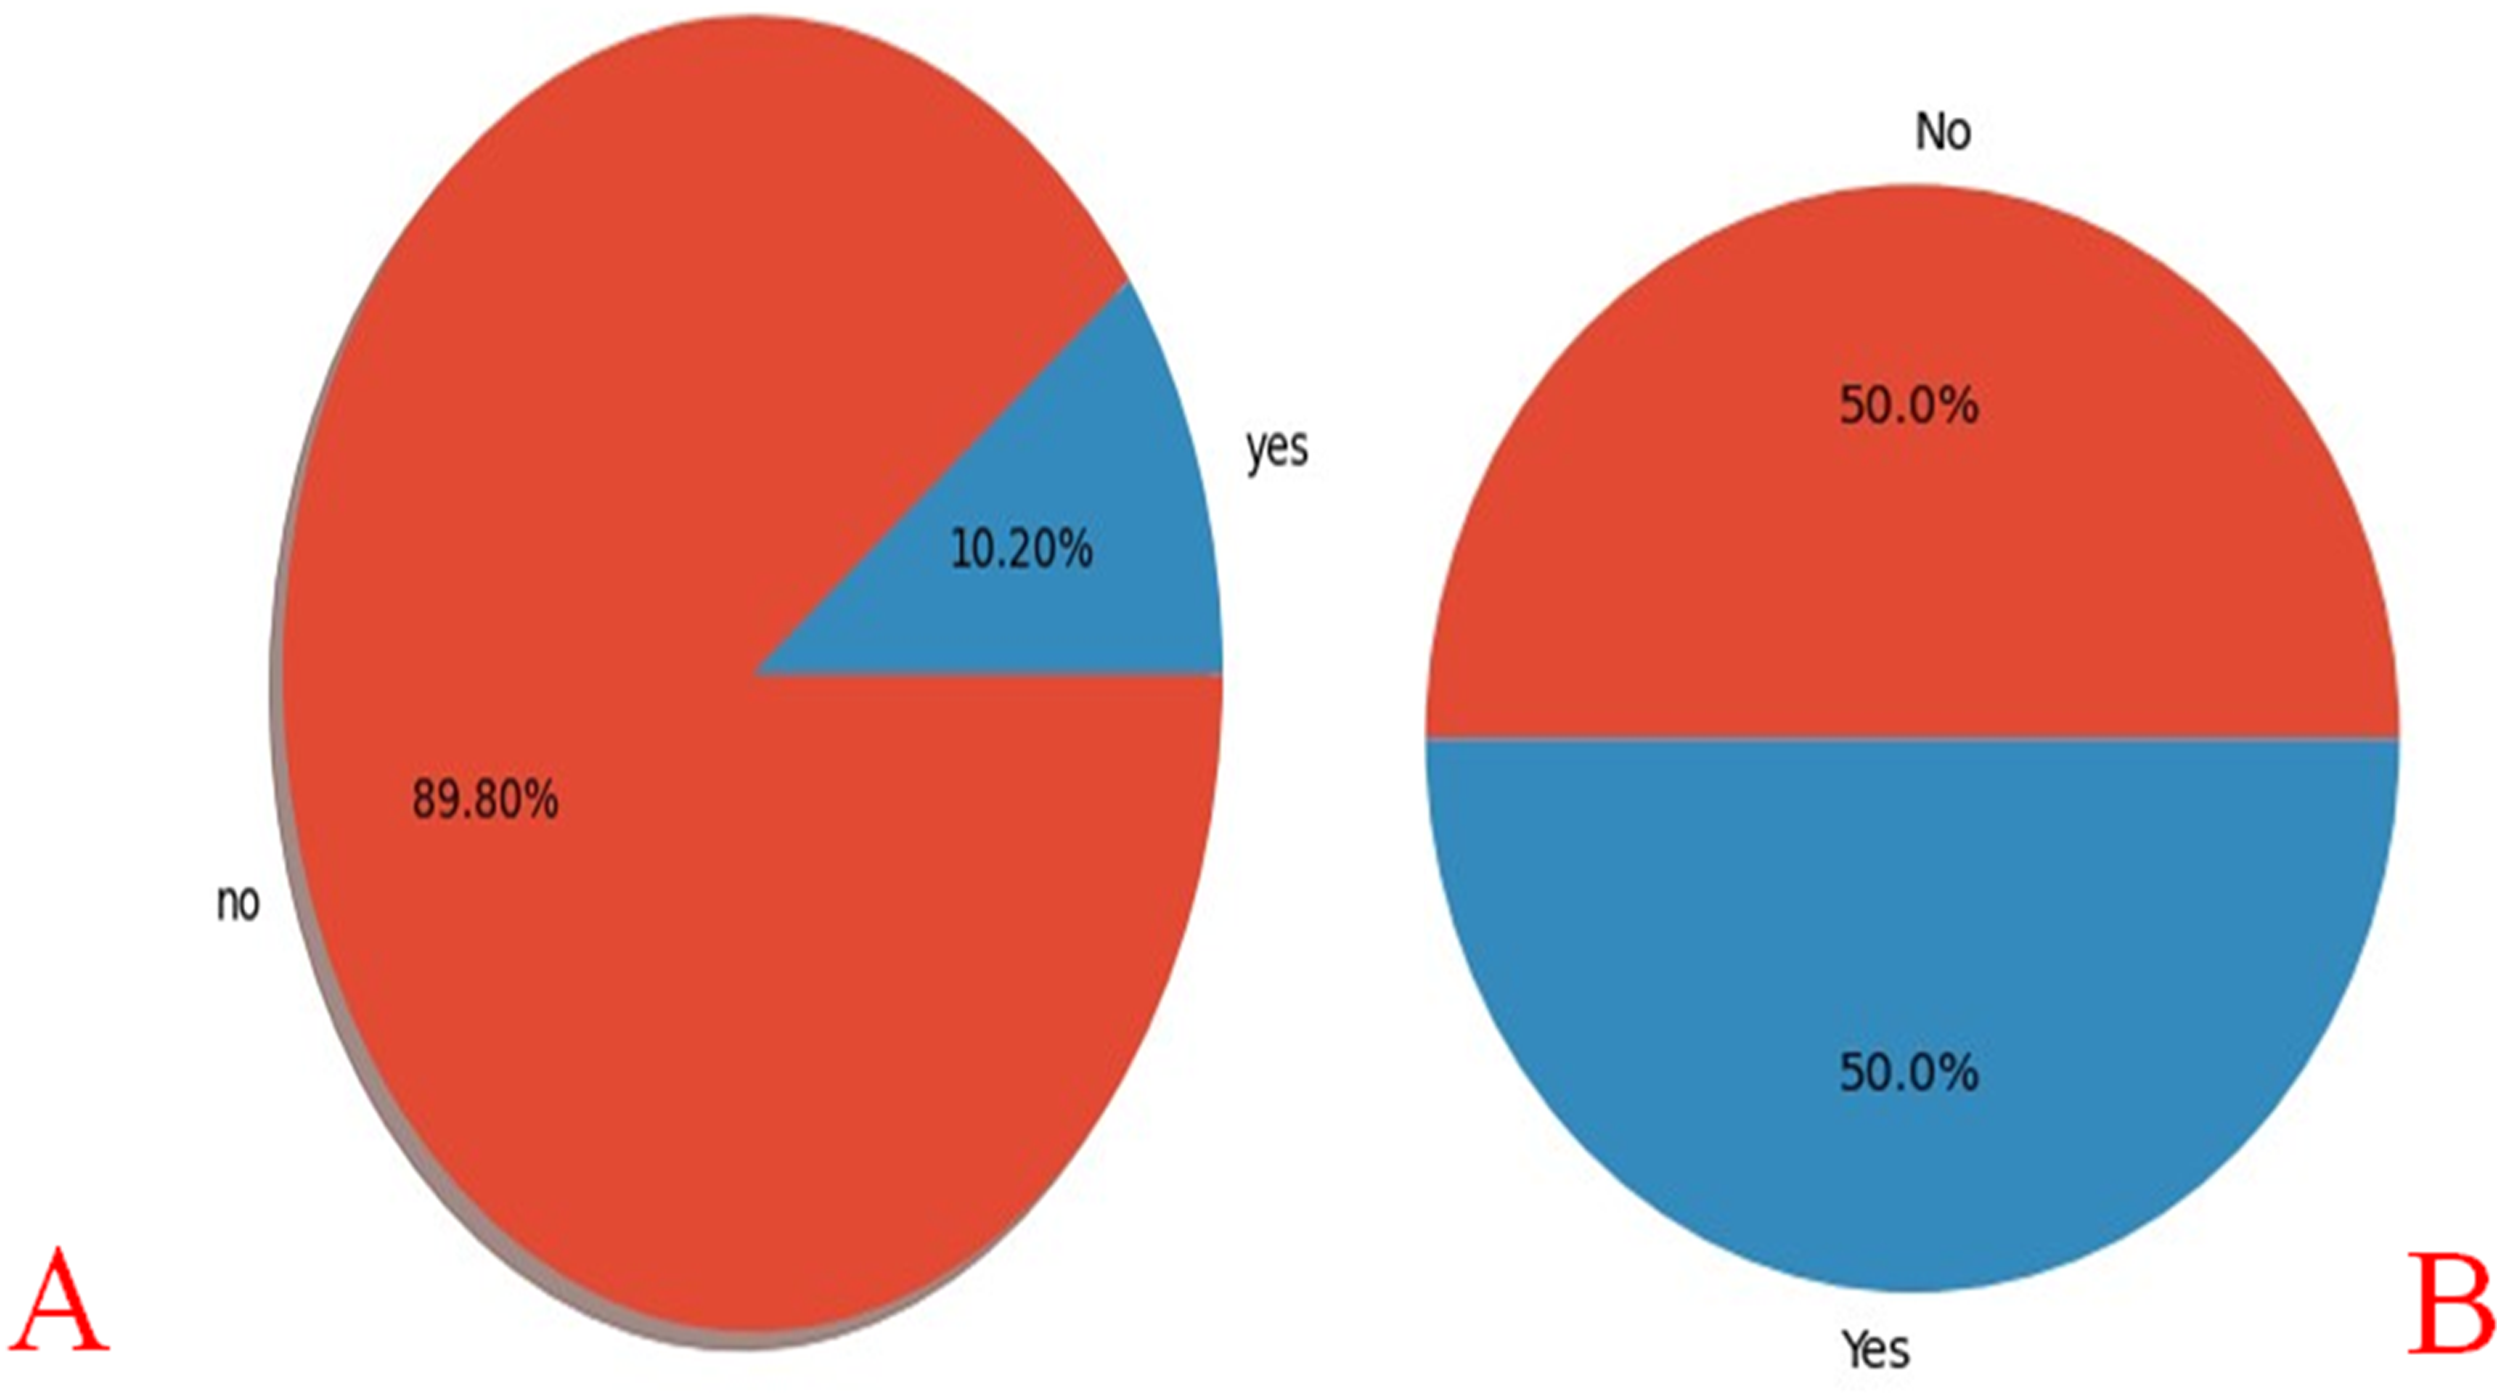
Machine learning analysis of diarrhea among under-5 children
Feature selection
Figure 3 showcases the Boruta algorithm graph, visually indicating the significance of variables important for model prediction. Important variables are highlighted in a prominent green color, while unimportant variables are displayed in red. Yellow indicates tentative variables that require further investigation to fully understand their impact on the model’s predictions. Feature selection using Boruta algorithm method.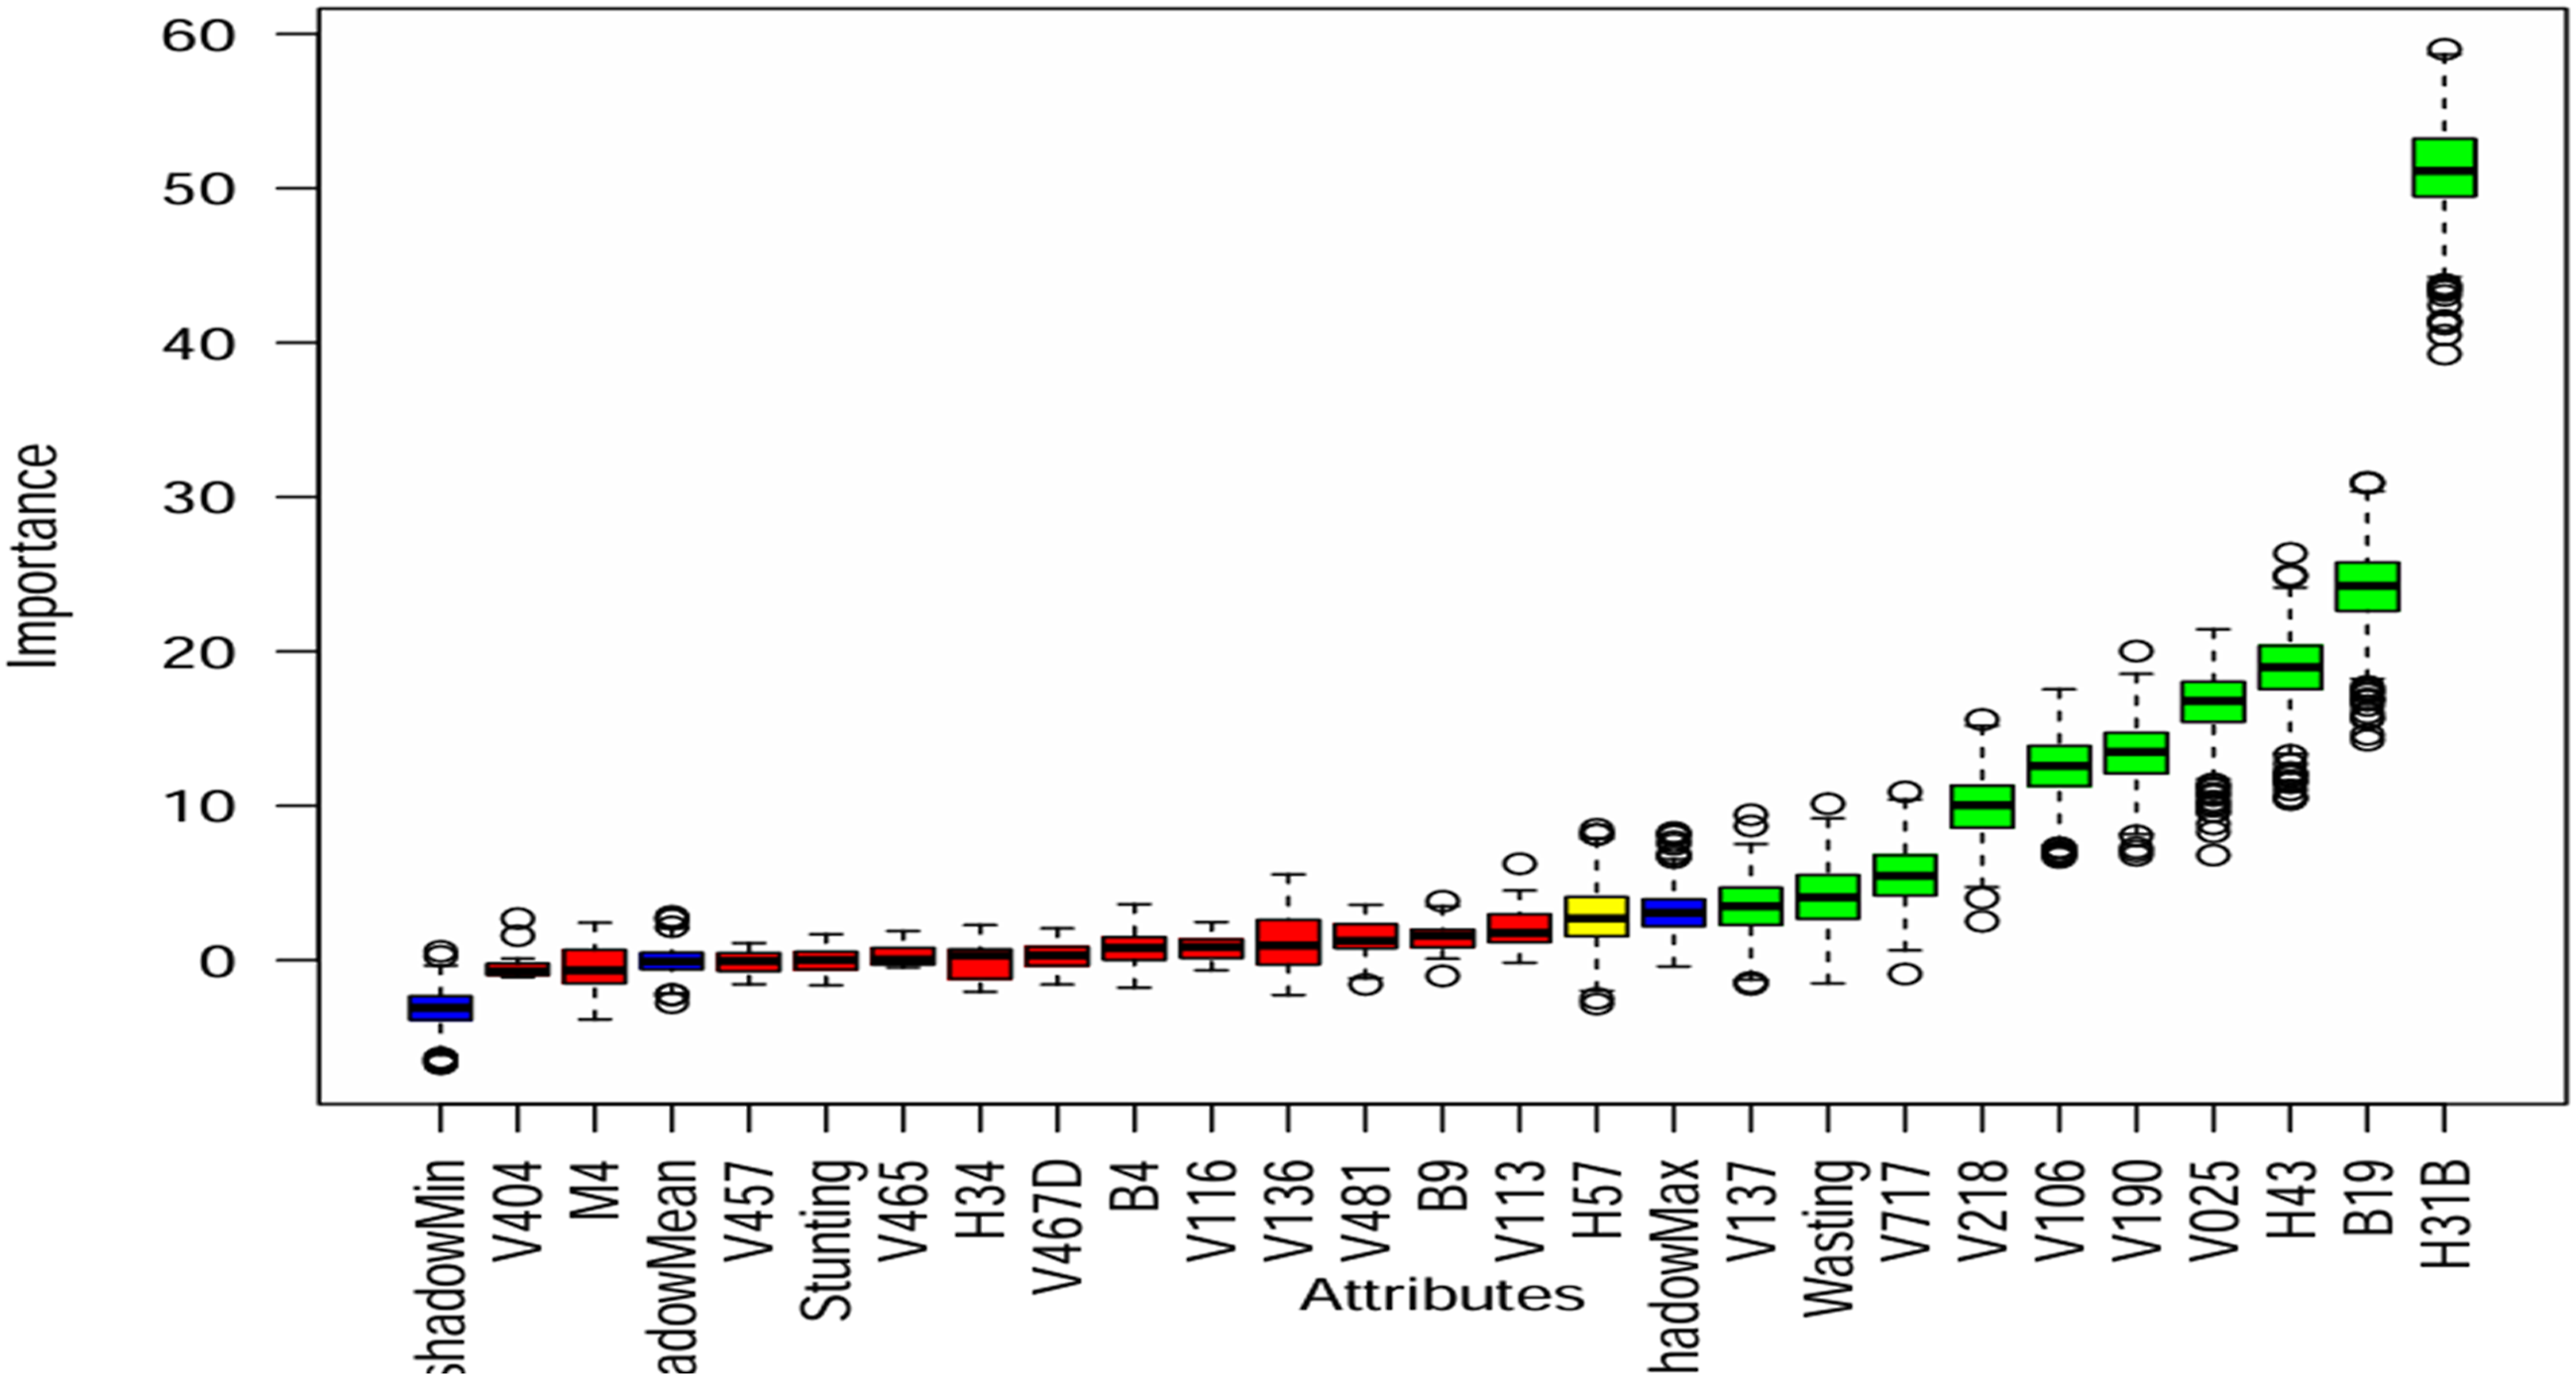
During our analysis, we excluded 13 variables that were deemed unimportant by the Boruta algorithm. Additionally, we considered a Rota vaccination as a tentative variable. As a result, we selected the variables identified as important by the Boruta algorithm to predict the diarrhea status. Using this approach, a total of eleven variables out of the initial twenty-four were chosen as the top important features for constructing the model. This allowed us to gain valuable insights into the underlying patterns in the data using association rule mining.
Data balancing
Comparison of imbalanced data handling techniques using accuracy and AUC values.
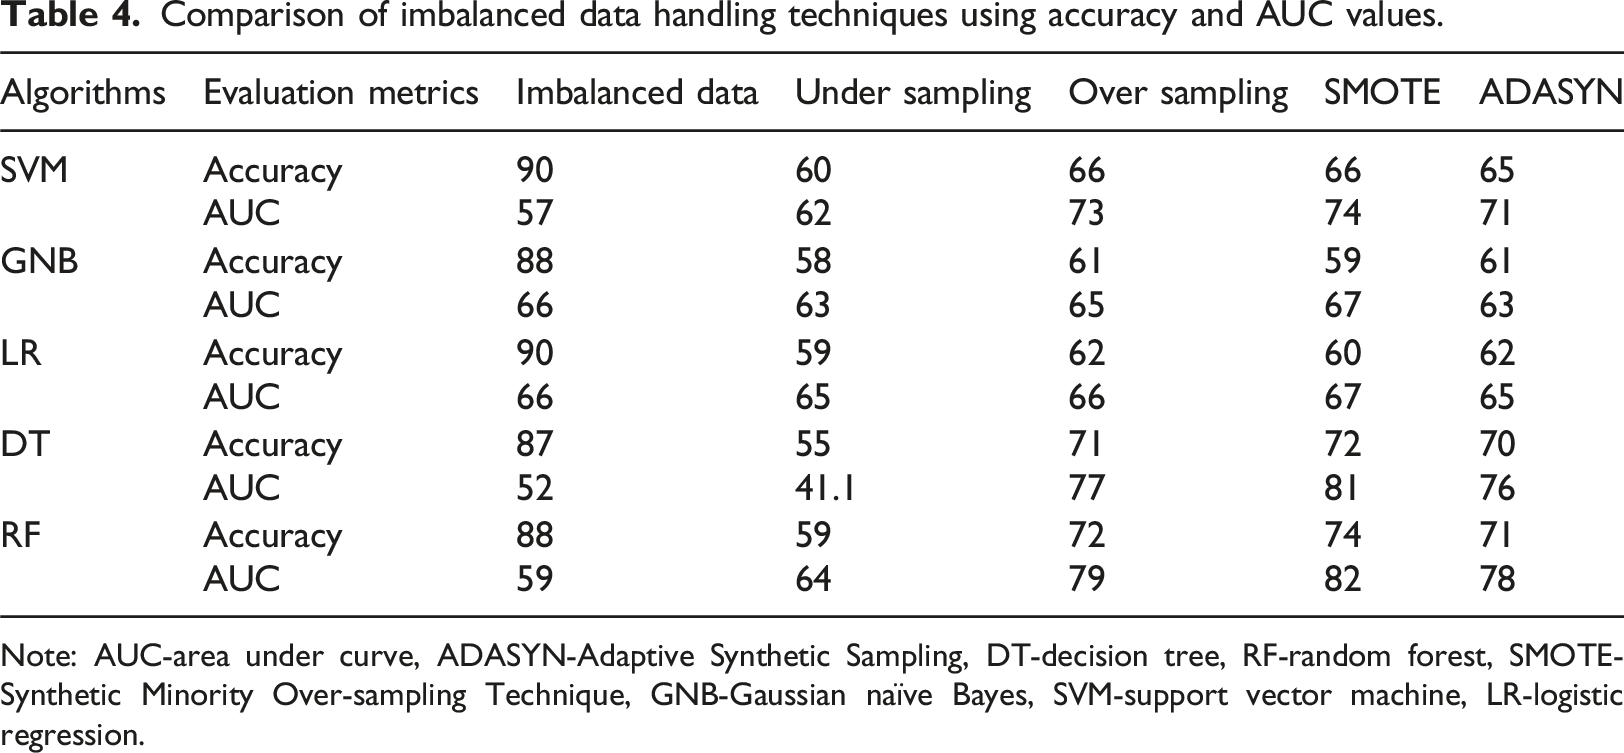
Note: AUC-area under curve, ADASYN-Adaptive Synthetic Sampling, DT-decision tree, RF-random forest, SMOTE-Synthetic Minority Over-sampling Technique, GNB-Gaussian naïve Bayes, SVM-support vector machine, LR-logistic regression.
Model development and performance evaluation metrics of ML algorithms
To assess and compare the performance of the algorithms in predicting diarrhea among children under the age of 5 in Ethiopia, various metrics such as accuracy, precision, recall, F1 score, and AUC value were utilized. These metrics provided insights into the algorithms’ overall correctness, their ability to predict positive and negative instances accurately, and their discriminative power. The researchers conducted a thorough evaluation using these performance metrics to determine the effectiveness of the algorithms. Among the three tuning techniques evaluated, grid search emerged as the best, achieving the highest precision, recall, and F1 score. Based on the evaluation metrics, the RF classifier was identified as the top ML algorithm for classifying the diarrhea status (Figure 4). Performance evaluation metrics of the selected algorithm after data balancing and grid search tuning.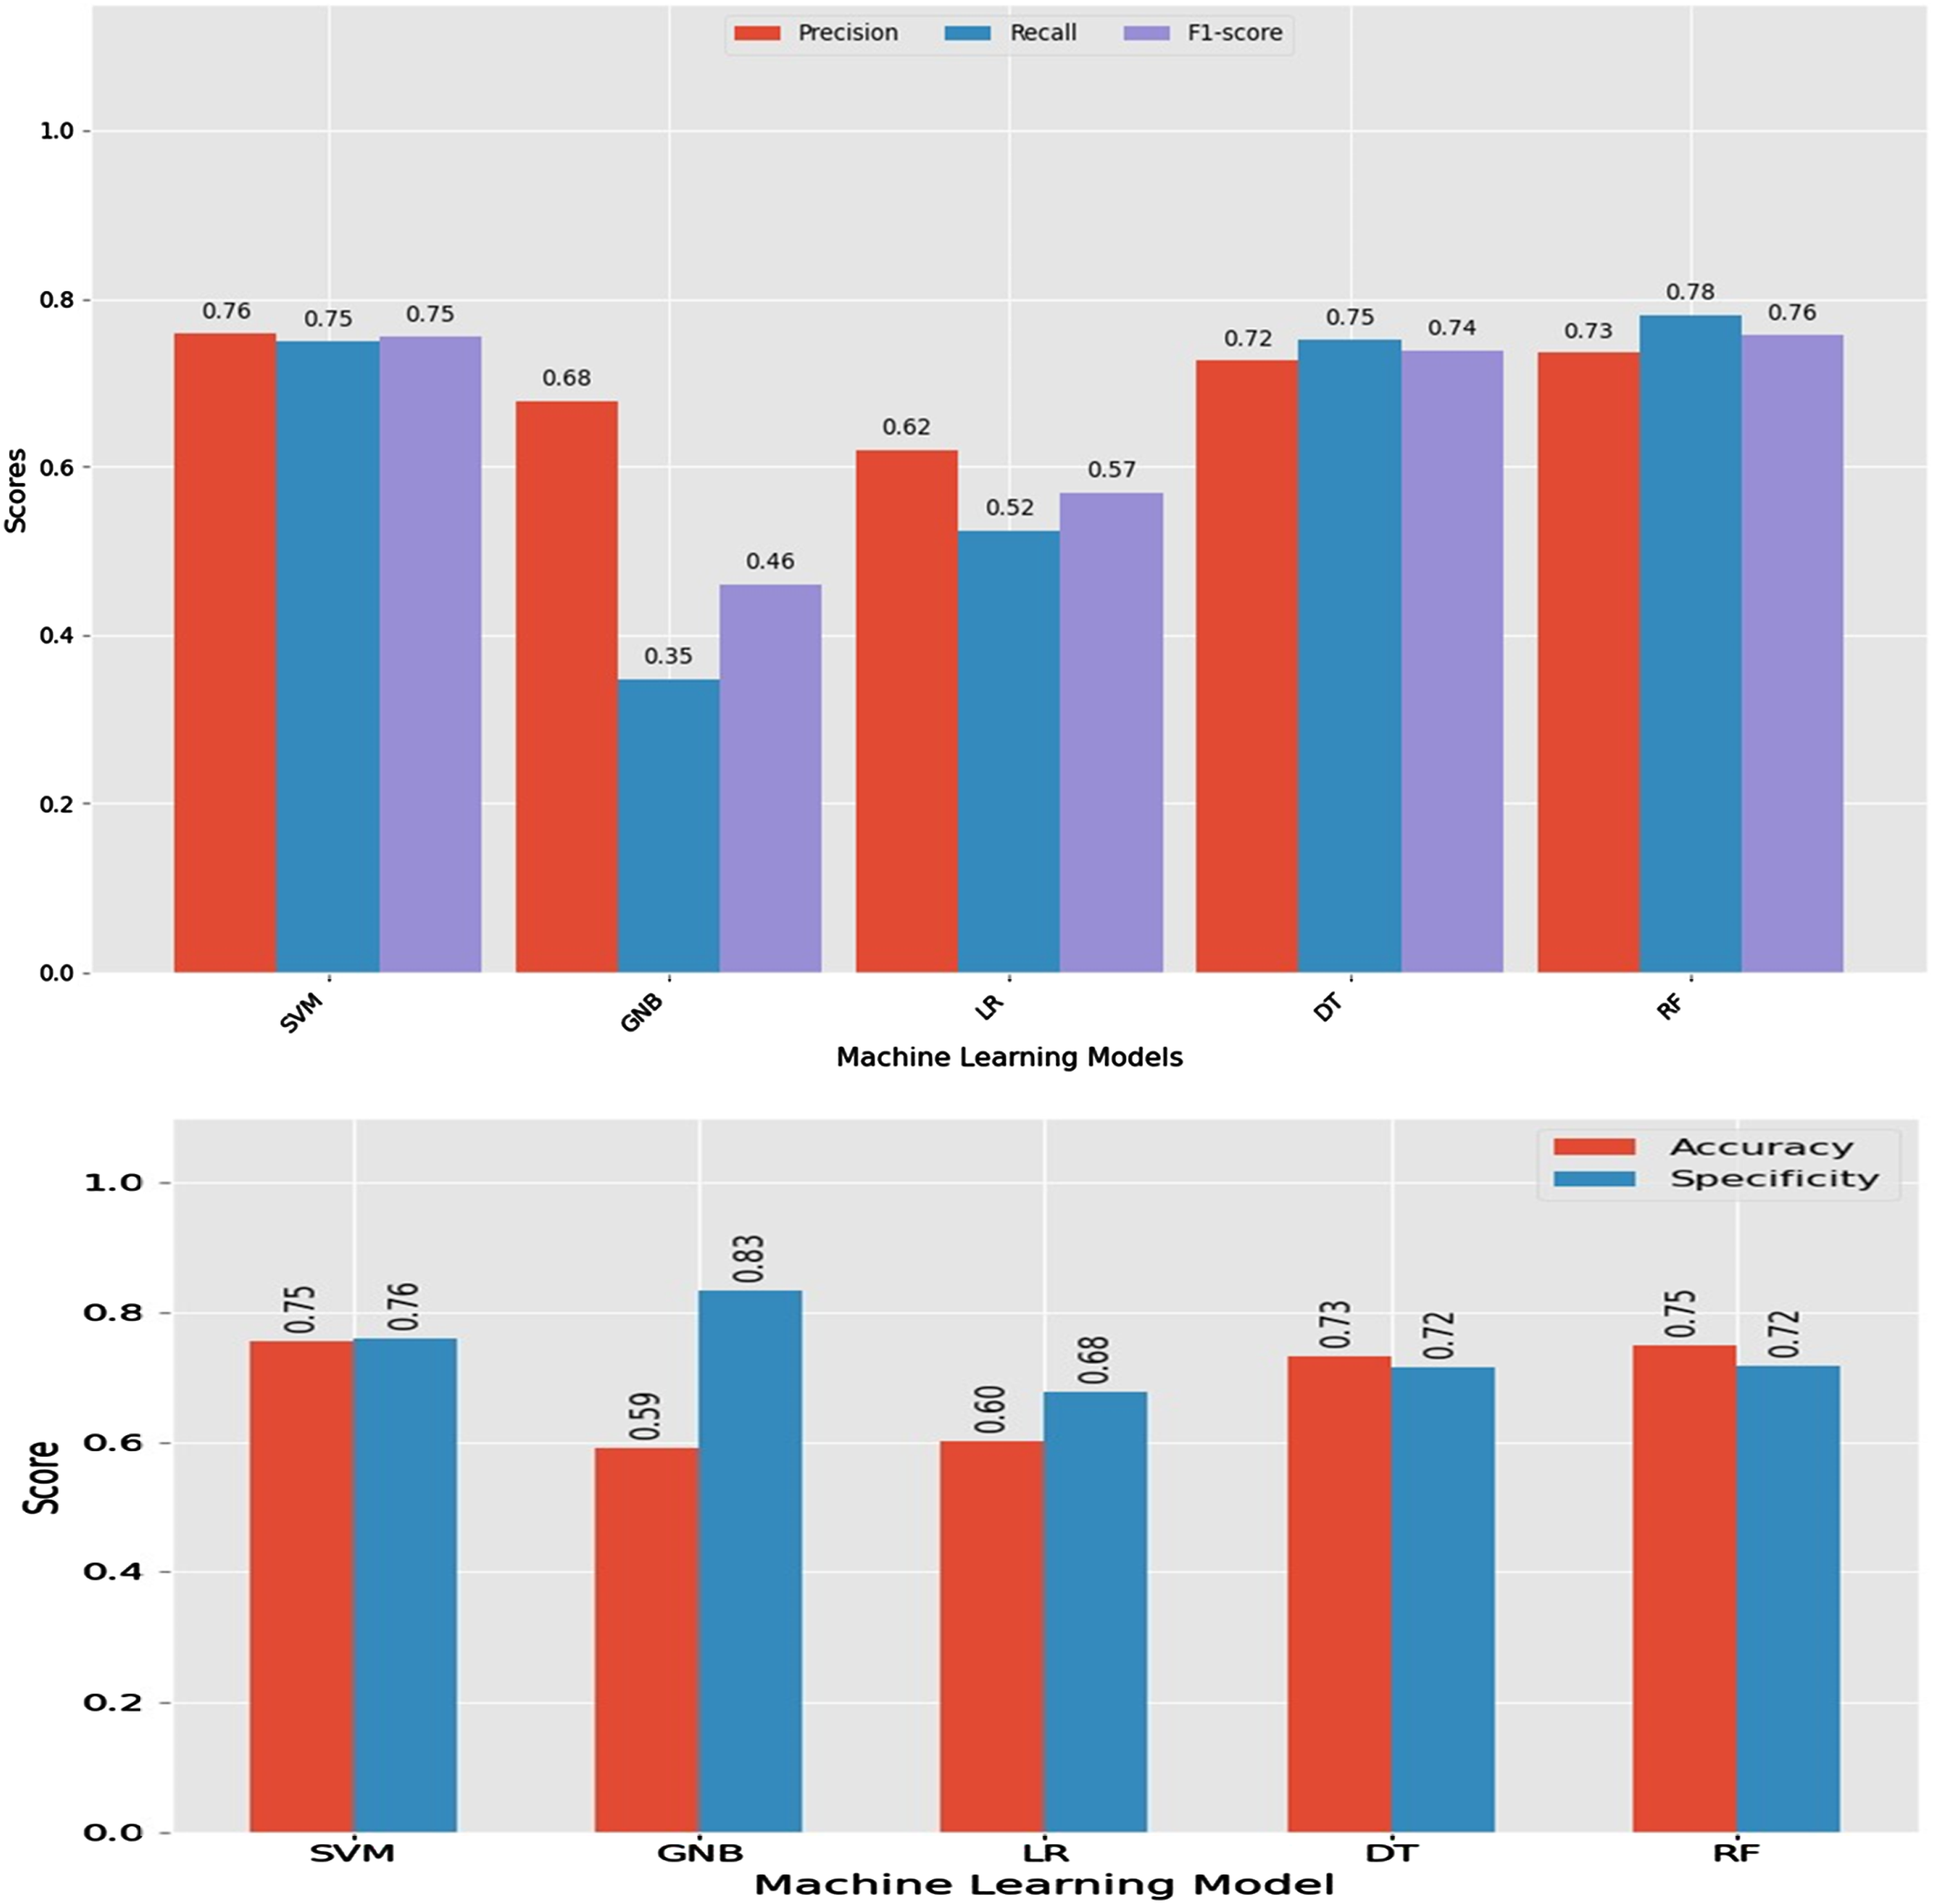
Accuracy and AUC value of ML algorithms using three hyper parameter tuning techniques.
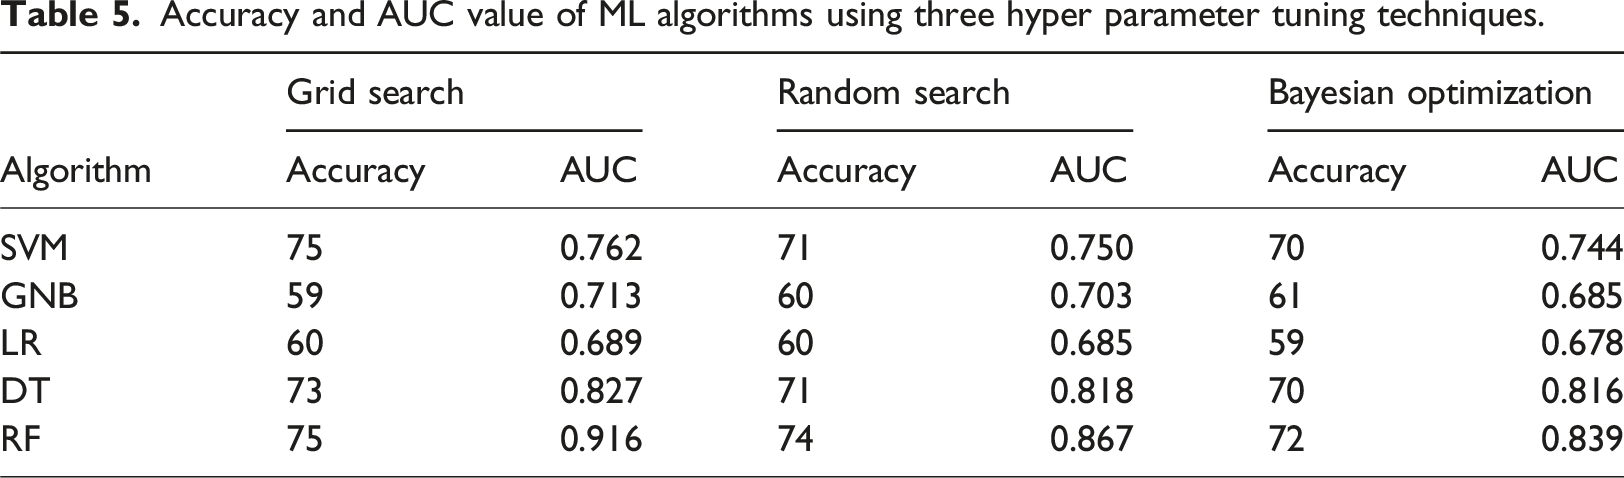
Figure 5 displays the ROC curve analysis of ML algorithms before and after hyper parameter tuning. The data was balanced using the SMOTE data balancing technique, and additional optimization was performed through hyper parameter tuning. ROC curve analysis of machine learning algorithms of SMOTE balanced data before tuning (a), and after hyper parameter tuning (b).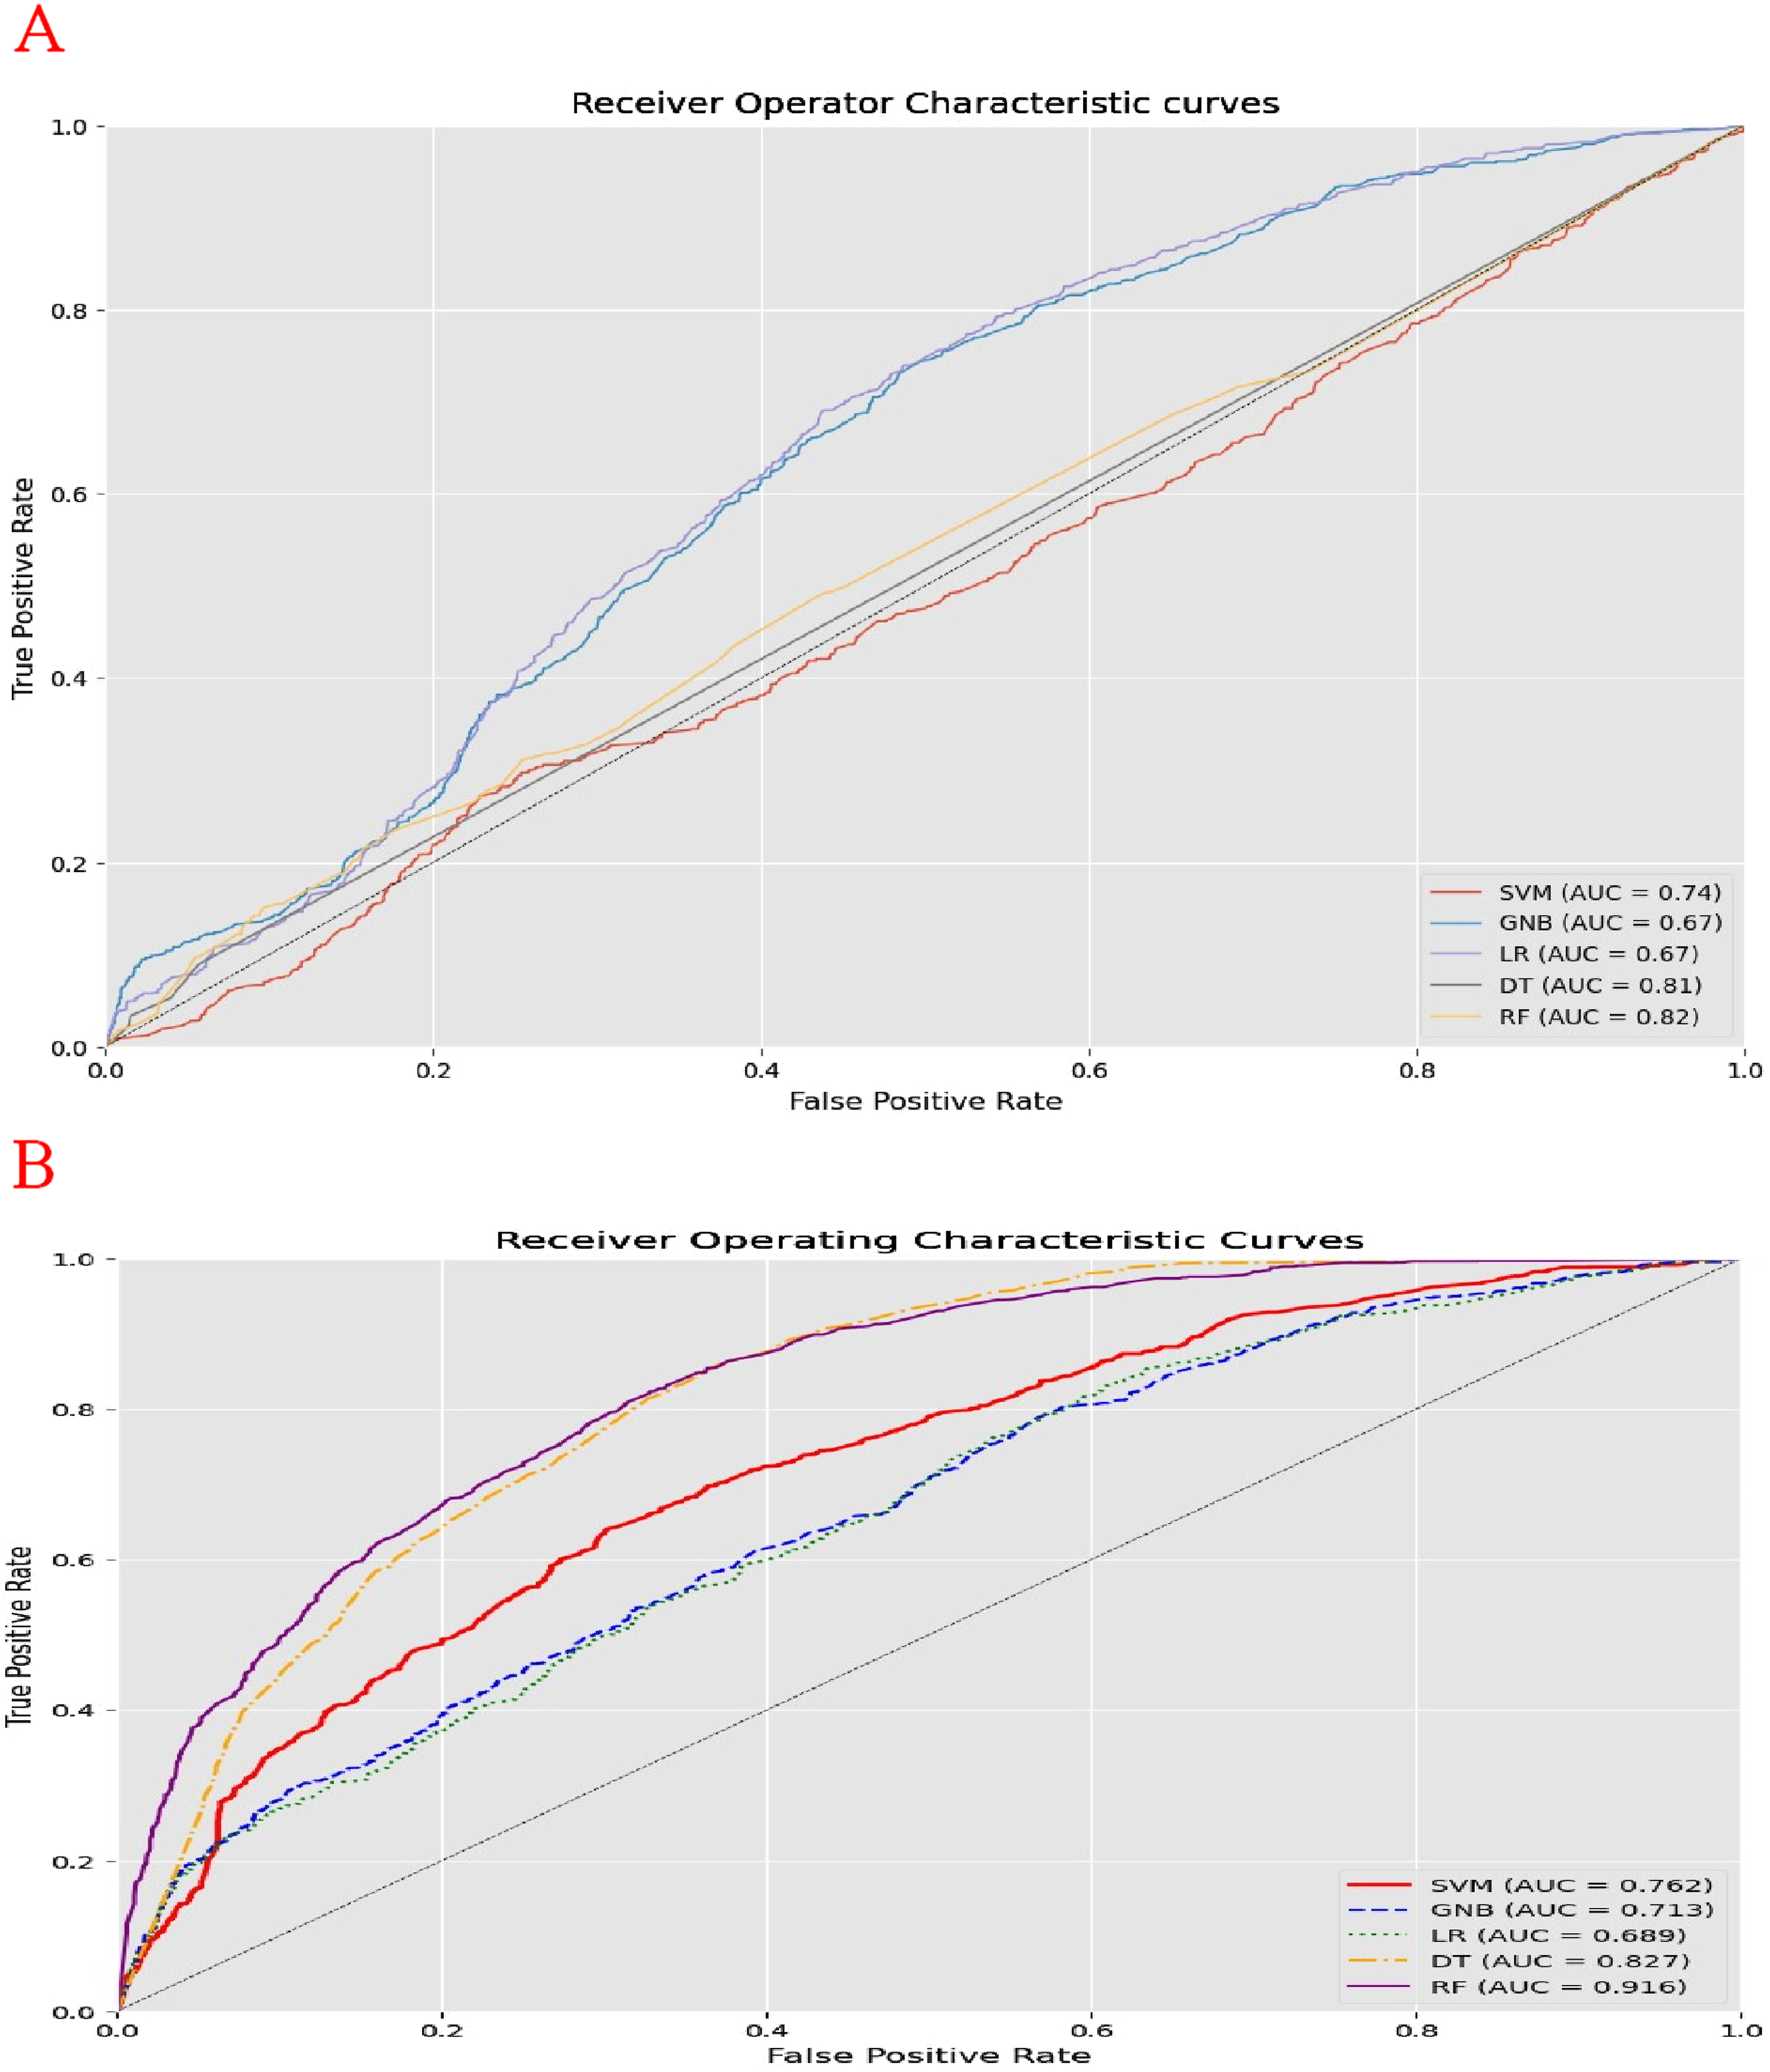
Model interpretability
SHAP value interpretation
Based on the findings presented in Figure 6, the mean SHAP value analysis provided valuable insights into the relative importance of different features in the classification model. Factors such as child age, acute respiratory infection, number of living children, and drug use for intestinal parasites were identified as highly influential, significantly impacting the model’s predictions. On the other hand, all the other features as indicated by their low mean SHAP values contributes less to the model’s decision-making process and have limited importance in predicting the outcome. A mean SHAP value report.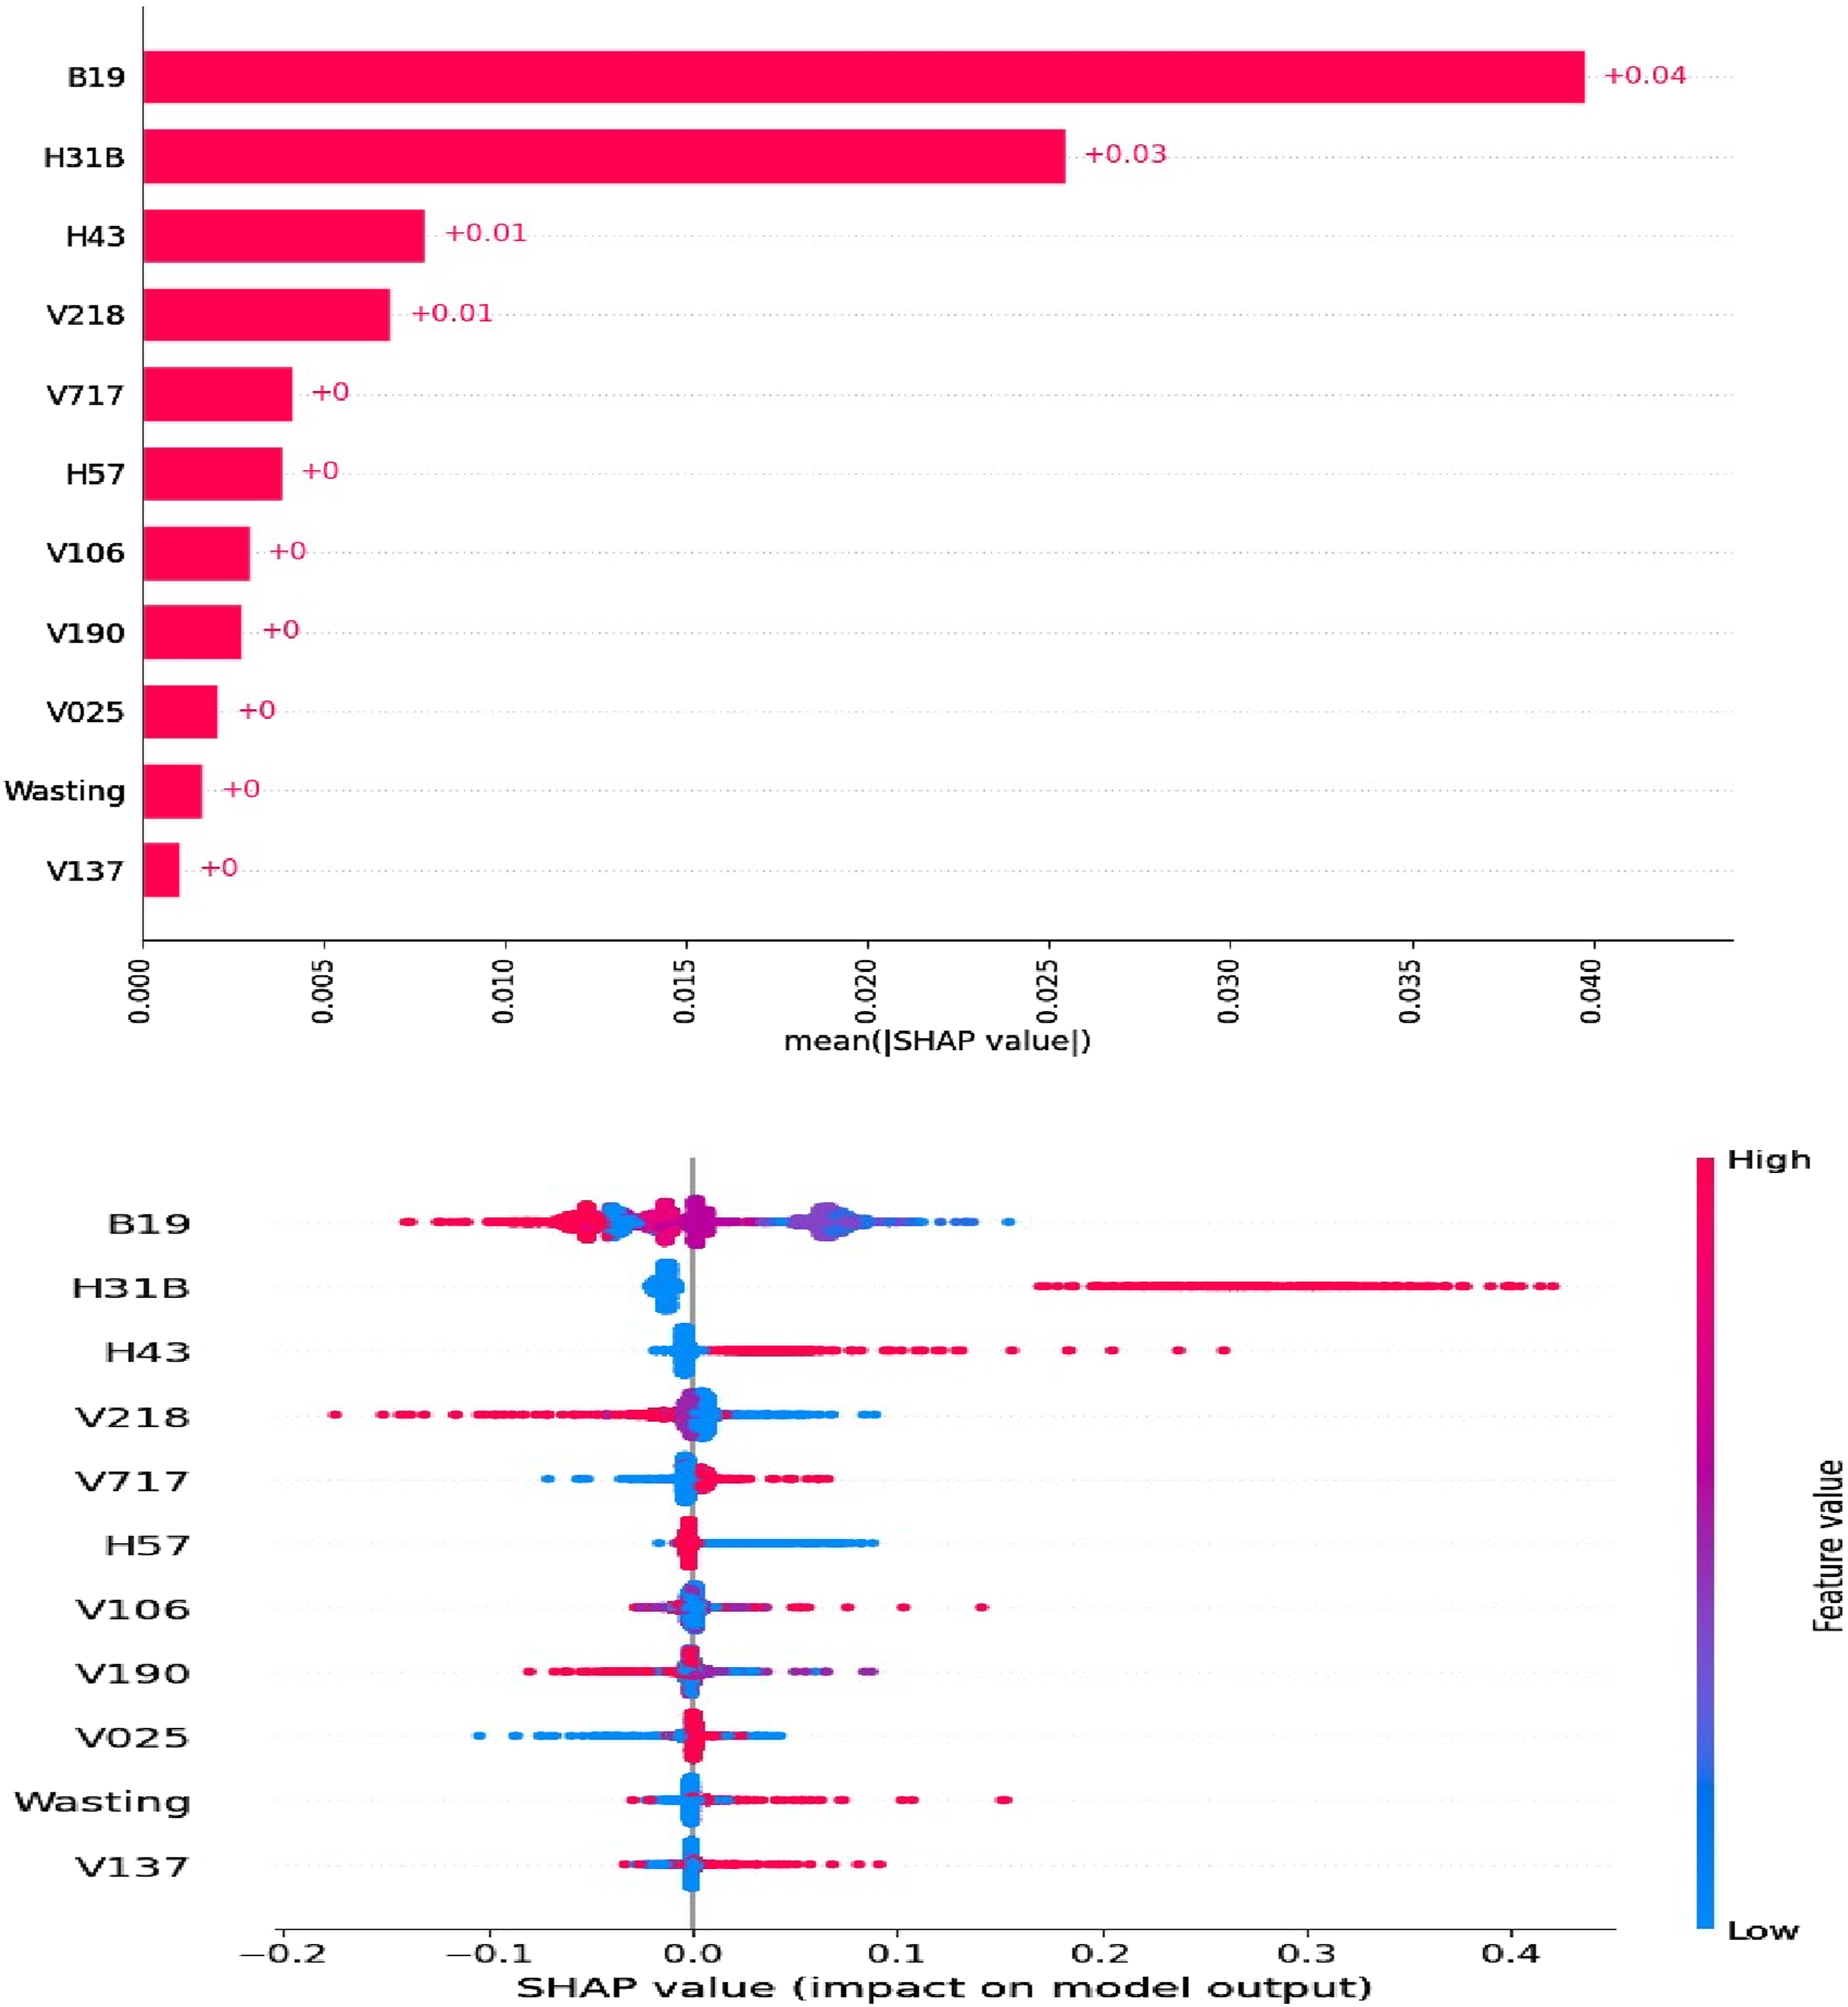
Figure 7, the waterfall plot, revealed the hierarchical importance of features in predicting the target variable. The plot highlighted that region had the child age has positive impact on the prediction, followed by wealth index and residence. Higher values of these features tended to increase the predicted outcome. Waterfall plot.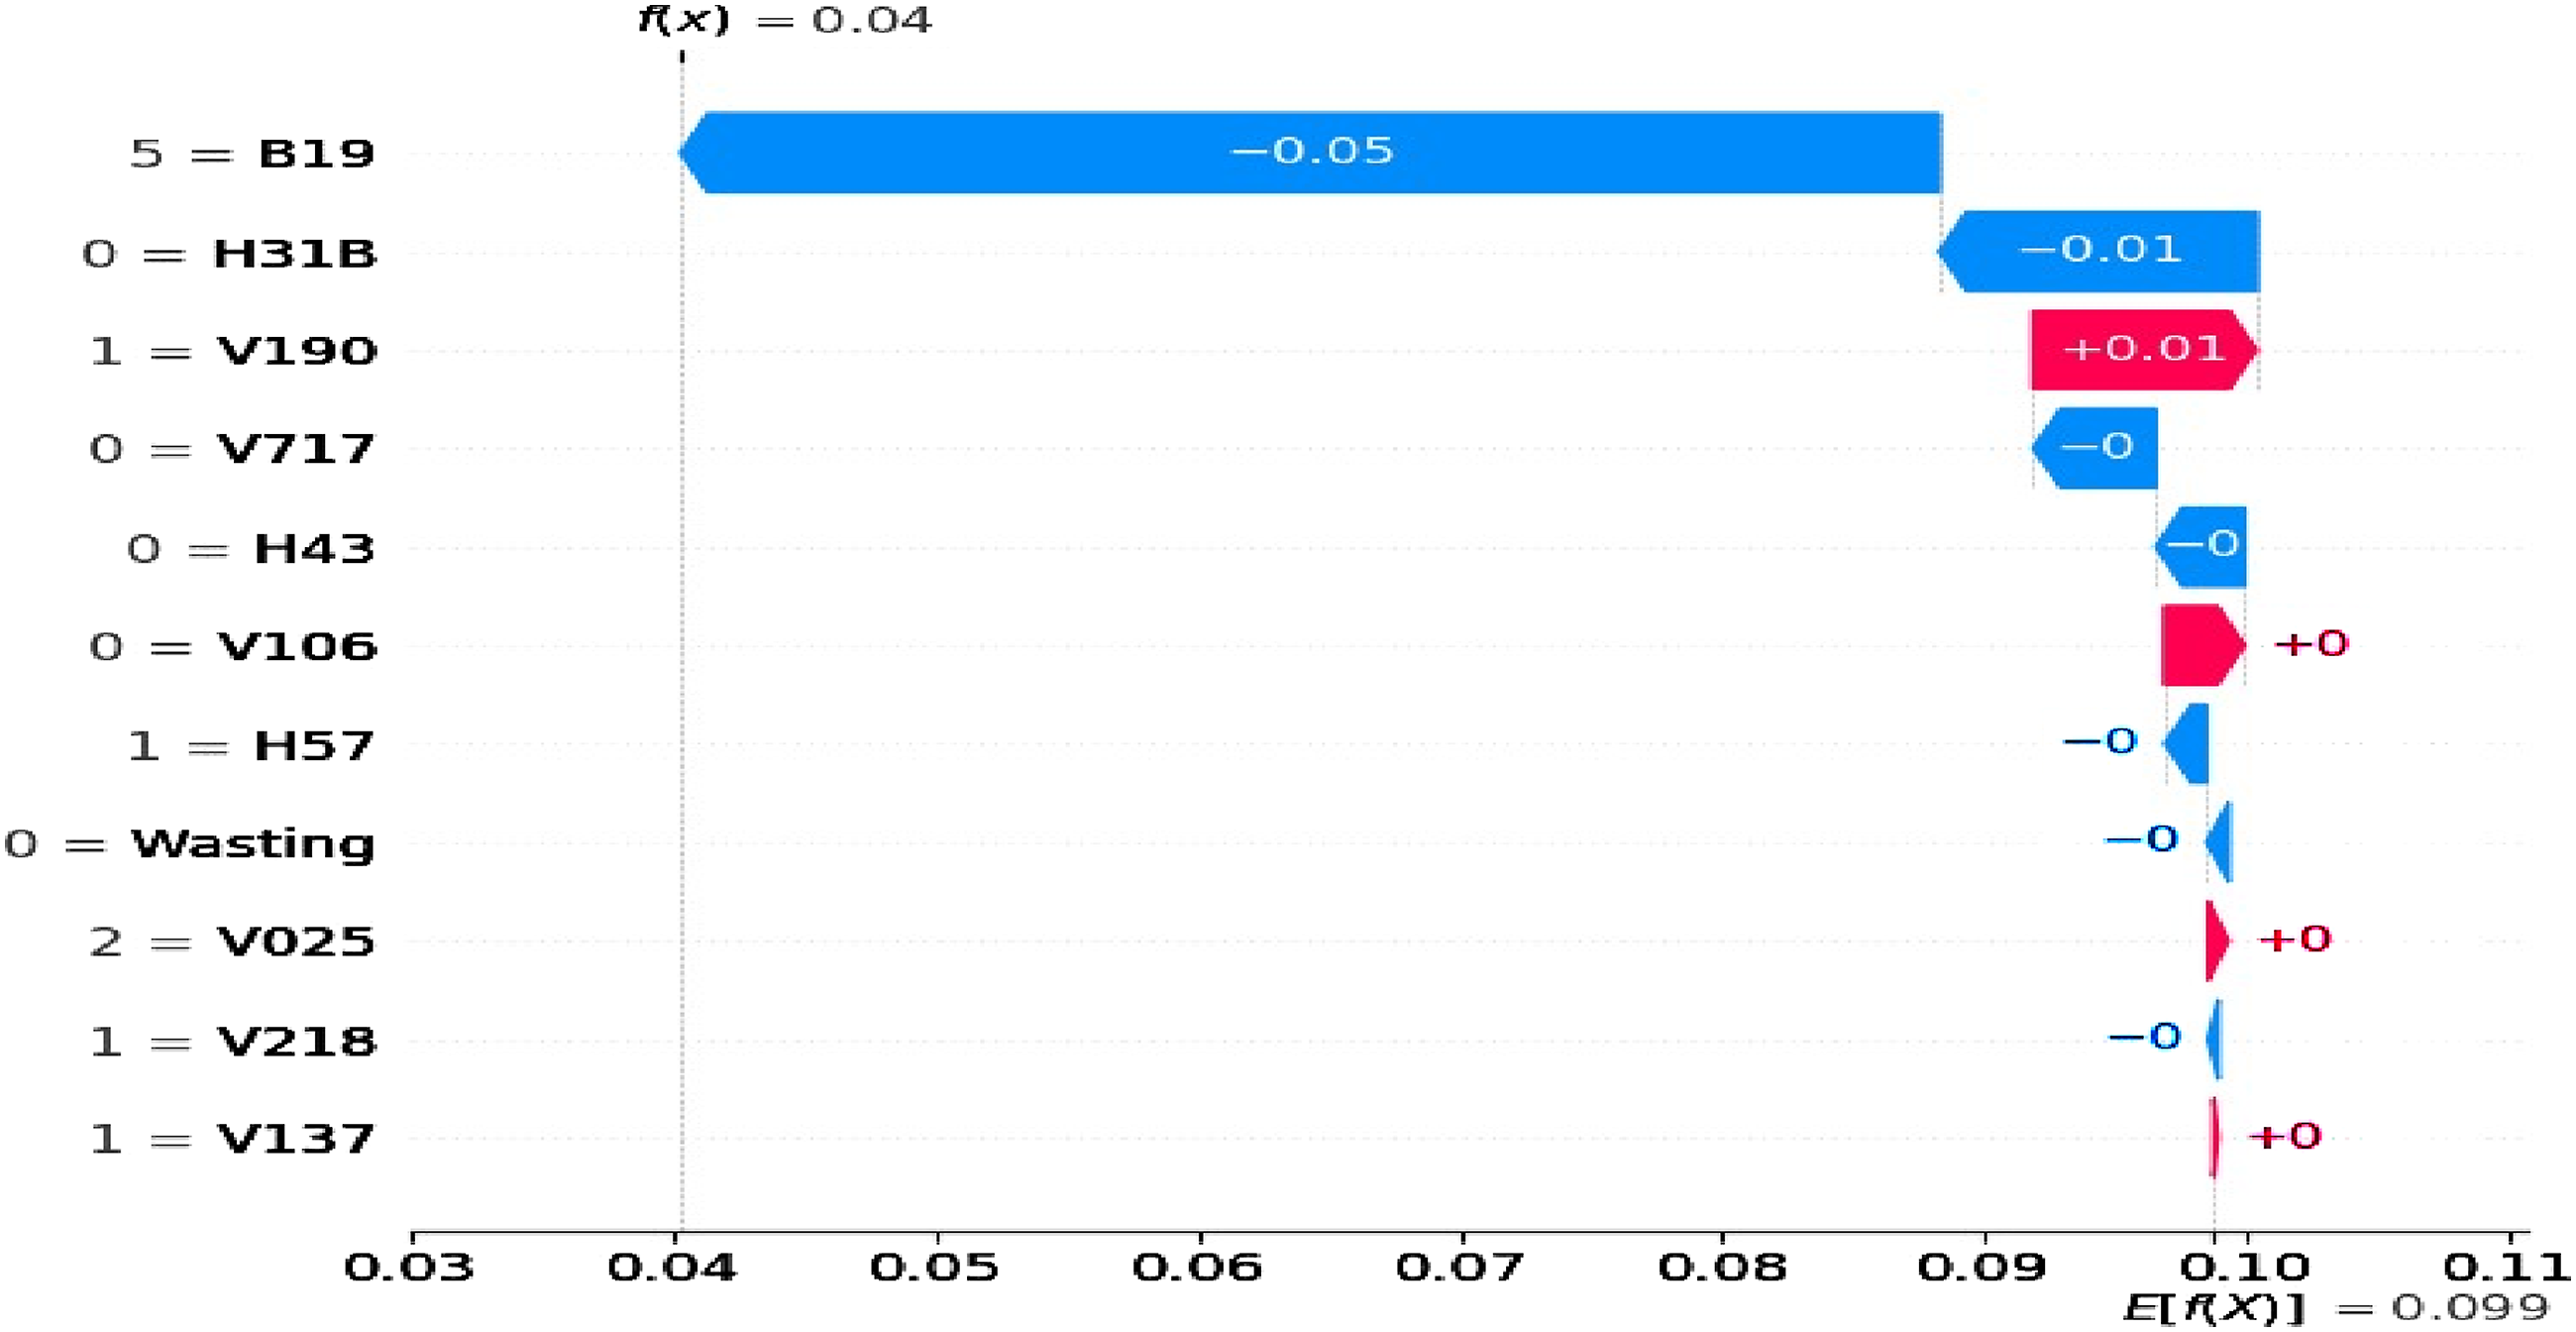
In the SHAP summary plot, the colors represent the magnitude and direction of the feature’s impact on the model’s output. The “hot” colors, such as red, indicate that the feature has a strong positive influence on the model’s prediction, meaning that higher values of that feature are associated with a higher predicted value. Conversely, the “cool” colors, such as blue, suggest that the feature has a strong negative influence, where higher values of the feature are associated with a lower predicted value.
The intensity of the color represents the magnitude of the feature’s impact. Darker shades of red or blue indicate a stronger positive or negative influence, respectively, while lighter shades represent a weaker impact.
Association rule result
Through the utilization of the Apriori algorithm, our study identified influential association rules based on lift values and confidence. These rules provided valuable insights into the probability of diarrhea among under-5 children in Ethiopia. Factors such as wealth index, number of living children, occupation, source of drinking water, drug use for parasite, age of child, wasting, and educational status consistently appeared in these association rules, indicating their strong association with diarrhea likelihood. These factors significantly influence the probability of diarrhea and should be considered in initiatives aimed at enhancing child health in the region. A total of 58 rules were generated, and the top seven association rules are presented below:
Rule 1: If children between 6 to 23 months old, wasted, belonging to households with 4 to 6 living children, using an unimproved source of drinking water, and with mothers having no education, the probability of diarrhea is 91.7% (lift value = 2.3).
Rule 2: If children from households with a poor wealth index, aged 6 to 23 months, not taking medication for intestinal parasites, having fewer than two living children, and wasted, the probability of diarrhea occurrence is 90.9% (lift = 2.3).
Rule 3: If children aged 6 to 23 months, not taking medication for intestinal parasites, and having fewer than two living children, the probability of diarrhea occurrence is 87% (lift = 2.2).
Rule 4: If children whose mothers have no education, aged between 6 to 23 months, wasted, experiencing acute respiratory infection, and using an unprotected source of drinking water, the probability of diarrhea occurrence is 86.7% (lift = 2.2).
Rule 5: If children from parents with a poor wealth index, aged between 6 to 23 months, wasted, experiencing acute respiratory infection, and using an unprotected source of drinking water, the probability of diarrhea occurrence is 86.7% (lift = 2.2).
Rule 6: If a child whose mothers has no education, with a poor wealth index, and wasted the probability of diarrhea is 83.3% (lift = 2.1).
Rule 7: If children from rural areas, not vaccinated against Rota, from families with a poor wealth index, and having more than three under-5 children, the probability of diarrhea is 82.8% (lift = 1.9).
Discussion
The aim of this study was to develop and compare the most effective ML algorithm for predicting diarrhea in children under the age of 5 in Ethiopia. By utilizing robust data science techniques, this research contributes to the advancement of knowledge in diarrhea prediction. These findings have the potential to pave the way for the development of automated screening tools, aid policymakers in making informed decisions, facilitate the design of suitable interventions, and provide decision support systems to healthcare providers for diagnosing and managing diarrhea effectively. The current study showed that 10.2% of children had experienced diarrhea within 2 weeks prior to the 2016 EDHS survey. The finding was in line with a meta-analysis conducted in Africa, which showed that 10.3% of under-5 children had diarrhea. 66 In contrast, the present finding was lower than the previous traditional logistic regression approach studies conducted in Ethiopia,14,67–69 Cameroon (23.8%), 70 and Yemen (29.07%). 71 This could be environmental and infrastructure discrepancy across countries.26,68 Moreover, the national immunization coverage has been increased from 24% to 44%, which plays a vital role in diarrhea prevention and reduce the incidence of the diarrheal disease. 72
Five supervised ML algorithms were applied to predict diarrheal status among under-five children using socio-demographic, environmental, nutrition, and other comorbid related data set of 2016 EDHS. To increase model prediction accuracy and generalizability, the above models were chosen to advance and confirm the best predictive model using the significant predictor variables. To maximize the predictive accuracy of the final model, data balancing techniques were employed. After evaluating the performance metrics of the balanced data, the RF model exhibited the best overall performance with an evaluation metrics of accuracy (93.2%) and AUC (91.6%). The use of RF classifier for predicting diarrhea has implications by providing accurate predictive models, insights into risk factors and mechanisms, identification of vulnerable subgroups, and the potential for integrating ML into healthcare systems. These implications pave the way for targeted interventions, personalized healthcare approaches, and improved health outcomes for children affected diarrhea. Despite there was a disparity in the value of performance evaluation metrics, the current metrics performance was supported by a studies conducted so far in Japan in 2019 73 and Afghanistan in 2021. 74 The possible justification could be the variation in size of data set and the number of attributes used in predicting the best model since the size of the data set and number of predictors has its own impact on model prediction and performance evaluation metrics values. 75
The analysis of the mean SHAP value report and waterfall plot yielded valuable insights into the importance of different factors in a classification model for predicting diarrhea status. Features such as residence, educational status, child’s age, mother’s occupation, Rota vaccination status, and wealth index were identified as highly influential, significantly affecting the model’s predictions. These findings provide guidance for targeted interventions and policy decisions, contributing to improved health and well-being of under-5 children in Ethiopia. By validating existing knowledge and evaluating model effectiveness, these insights enable more accurate and impactful interventions for the health of children in the region.
Regarding this study, the RF model identified several significant predictors for diarrhea among under-5 children. The top important predictors includes place of residence, wasting, mother’s occupation, mother’s educational status, number of living children, age of child, and mother’s wealth index and drug use for intestinal parasite were found to be predictors of diarrhea.
Another aim of this study was to identify the top predictors of diarrhea among under-5 children. To accomplish this, the author utilized the Boruta algorithm to select important features. Out of a total of 24 features included based on the literature; the study identified 11 predictors as important feature to predict diarrhea. This suggests that ML models may uncover new variables or insights not captured by conventional regression models, which could be valuable for policy decision-making and clinical practices.
The other aim of the study was to use association rule mining with the a priori algorithm to identify patterns and associations between independent predictors and the outcome variable. We have selected the top seven rules generated by the best model which has most frequently association with a high probability of diarrhea.
This association rule mining revealed that residence was found to be significant predictors of diarrhea among under-5 children. Accordingly, children residing in rural areas were more likely to experienced diarrhea compared to the urban areas. This finding was similar with studies conducted in different localities of Ethiopia and Zambia.14,27,68,69 This may perhaps due to rural residents have less access to clean water, poor sanitation, and low level of hygienic practice for their child nurturing.
Another important predictor identified was child age. Children whose age is greater than 6 months are high risk for diarrhea compared to child aged less than 6 months. This finding is consistent with previous studies done in Ethiopia.14,76,77 This might be due to the initiation of contaminated weaning foods, risk of ingesting contaminated materials, and loss of inborn immunity or maternal antibodies increases the occurrence of diarrhea.
The rule mining identified that mother’s education was a highly significant to predict diarrhea. Accordingly, children whose mothers were not attending formal education were increased the risk of diarrhea compared to those children whose mother were attending formal education. This is similar with conducted studies in Ethiopia 77 and Nigeria. 78 This could be due to educated mothers have an awareness regarding the principle of hygiene, feeding and weaning practices, and an educated mothers are more conscious about their children life and keep their children safety as much as possible.
The current study the higher odd of diarrhea was seen among children whose mothers are currently working compared to those children whose mothers do not work currently. This is consistent with studies conducted in Ethiopia and sub-Saharan Africa.79–81 This might be due to the fact that mothers might not have enough time to provide quality care and implement the principle of hygienic practice for their children.
The present study also showed that wealth index is a noteworthy predictor of diarrhea. Children whose families with a poor wealth index had higher risk of diarrhea compared to children from families with rich wealth index. This finding is congruent with studies done in India, 82 Sub-Saharan Africa, 79 and Kenya. 83 This might be due to poor wealth index families cannot afford to buy supplies to keep the personal hygiene of their children and they are mostly practiced or use poor sanitation sources and unimproved water source.
This study also stated that the number of living children in the household predicts the diarrheal status of children as it was found that families who had two or more children were more likely to experienced diarrhea than those who had less than two children. This result was consistent with a studies done in Northeast Ethiopia and Western Ethiopia.12,84 This might be the fact that, the mothers or caregivers might not be proficient to deliver a balanced diet, quality sanitation service, and early medical care when getting sick when the number of children increased. Besides, there might be cross infection when a one siblings getting sick within the same household then the other child might be easily susceptible for diarrhea.
Moreover, the RF classifier identified wasting is an important predictor of diarrhea. This result was consistent with a previous studies in India, 85 Indonesia, 86 and Southern Ethiopia. 13 This could be due to undernutrition reduced the immune system of the child that leads to easily vulnerable for diarrheal diseases.
ML methods play a crucial role in predicting factors that affect population health, including diarrhea among children under the age of 5. This enables informed policy decisions, early detection, targeted prevention strategies, personalized interventions, and efficient resource allocation.87,88 The study’s practical significance lies in its ability to improve health outcomes by addressing diarrhea’s impact on individuals, families, and the healthcare system in Ethiopia. It introduces innovative perspectives, identifies key risk factors, develops accurate prediction models, and proposes personalized interventions. These contributions provide valuable information for policymakers and program planners, guiding the design of focused interventions to reduce mortality and enhance the health of children under 5 in Ethiopia.
Strength and limitations of the study
The study incorporates five supervised ML classification algorithms used nationwide representative data sets, providing a comprehensive and robust analysis of the predictive capabilities of different algorithms in order to reveals hidden patterns and relationships in the data that may not be easily identifiable through traditional statistical methods. This deepens the understanding of the factors influencing diarrhea among under-5 children in Ethiopia.
Despite its strength, this study has its own limitations. The limitation is that due to limited ML model research, the discussion was done compared with the articles done by using the traditional logistic regression model. Since some attributes (i.e. diarrhea status of the children during the survey) were self-reported, there were chances of recall bias. Moreover, variables like hand washing practice, home-based water treatment, and maternal diarrheal history were not collected and included in the analysis despite it was an important predictor for the outcome variable.
Moreover, the challenges of applying continuous-data methods or ML algorithms to discrete variables are the limitation of our study. Therefore, adapting ML algorithms and developing new methods to handle discrete variables effectively is an active area of research in the field. We acknowledge that our findings may not fully reflect the most up-to-date situation.
Moreover, the findings may not be applicable to other populations or age groups, as our focus was specifically on under-5 children in Ethiopia. Hence, future research should explore diarrhea classification and prediction in diverse demographic groups. Besides, biases or limitations could arise from the feature selection method, only DHS data set used, and limited algorithms included. Therefore, it would be valuable for future research to explore the classification and prediction of diarrhea using many more algorithms, feature selection methods and multiple data sources to address these limitations and to investigate additional areas that can enhance our understanding of diarrhea in this population, ultimately guiding more effective interventions and making strong evidence based decisions.
Implication of the study
Our study can have a significant impact on addressing diarrhea in developing countries. It can enable early detection and diagnosis by analyzing diarrhea-related data, facilitate remote monitoring and telemedicine to overcome healthcare access limitations, optimize treatment strategies based on patient data, aid in public health planning and resource allocation, recommend personalized interventions, and support data-driven research and policy development. However, successful implementation requires addressing challenges such as data availability, healthcare infrastructure, ethical considerations, and model biases. With proper attention to these challenges, the current study can improve the health of children in developing countries.
By utilizing the identified potential factors as indicators, policymakers and healthcare providers can develop interventions that cater to the specific needs of different subgroups in the population. This targeted approach has the potential to improve the health of children and mitigate the impact of diarrhea, particularly in resource-constrained areas. Furthermore, it aligns with the reduction plan of the Millennium Development Goal of under-five mortality.
Here is a more concise draft section on the “Implications of Predicting Diarrhea using ML for Digital Health and M-Health”:
Implications for digital health and M-health
The ability to accurately predict diarrheal episodes using our ML models has important implications for digital health and mobile health (m-health) technologies. Key applications include:
Integration into m-health apps and wearable: Our predictive factors, such as demographics and environmental conditions, can enable personalized risk assessments and early warning alerts to empower users in preventive care and self-management.
Incorporation into clinical decision-support: Digital health platforms can aggregate diverse data sources to generate real-time diarrhea risk profiles, guiding targeted interventions like distribution of oral rehydration solutions or WASH improvements.
Informing population-level strategies: Predictive models can identify high-risk areas to deploy proactive surveillance and tailor public health campaigns for diarrheal disease prevention.
Facilitating continuous learning: M-health integration can enable longitudinal data collection to refine algorithms, monitor trends, and evaluate digital health interventions over time.
In summary, our ML approach holds substantial potential to enhance digital health and m-health solutions, contributing to improved prevention, management, and population health outcomes for diarrheal diseases.
Conclusion
The current study suggested that the RF model outperformed compared with the other ML algorithms based on the performance evaluation metrics. Residence, wealth index, mother’s occupation, educational status, age of child, number of living children in households, drug for intestinal parasite, wasting, and acute respiratory infection were an important predictors of diarrhea among under-five children. Efforts to decrease childhood diarrhea should emphasis on the identified predictors of diarrhea. Moreover, childhood survival can be enhanced noticeably using these identified significant predictors to notify relevant policies and other stakeholders.
The researcher would like to provide the following recommendation based of the current study findings. Future researchers focused on clinical result dataset rather than self- reported data for ML prediction of diarrhea. Future works needs to implement disease prediction application based on the clinically evident symptoms and we recommended for future researcher to access and analyze the most currently available data, in order to present the timeliest information to our readers. Besides, we recommended for other scholars and health informatics professionals to utilize our study as a baseline in order to develop M-health or other digital health that have a significant contribution in the field of digital medicine. Policy makers should be considering this research result and propose diarrhea intervention or controlling mechanism in Ethiopia and the policies should implemented in different area of the country depend on the predictors relationship with diarrhea.
Supplemental Material
Supplemental Material - Comparative analysis of machine learning algorithms for predicting diarrhea among under-five children in Ethiopia: Evidence from 2016 EDHS
Supplemental Material for Comparative analysis of machine learning algorithms for predicting diarrhea among under-five children in Ethiopia: Evidence from 2016 EDHS by Alemu Birara Zemariam, Wondosen Abey, Abdulaziz Kebede Kassaw, and Ali Yimer in Health Informatics Journal.
Footnotes
Acknowledgements
The authors would like to extend their gratitude to the Central Statistical Agency of Ethiopia for the provision of data which helps us to undertake this study.
Authors’ contributions
ABZ and AY contributed to the conception and design, acquisition of data, analysis, and interpretation of data; ABZ, AKK, and WA took part in drafting the article or revising it critically for important intellectual content; all authors agreed to submit to the current journal; gave final approval of the version to be published; and agree to be accountable for all aspects of the research work.
Declaration of conflicting interests
The authors declare that they have no competing of interests with respect to the research, authorship, and publication of this manuscript.
Funding
The author(s) received no financial support for the research, authorship, and/or publication of this article.
Ethical statement
Data availability statement
Supplemental Material
Supplemental material for this article is available online.
Appendix
References
Supplementary Material
Please find the following supplemental material available below.
For Open Access articles published under a Creative Commons License, all supplemental material carries the same license as the article it is associated with.
For non-Open Access articles published, all supplemental material carries a non-exclusive license, and permission requests for re-use of supplemental material or any part of supplemental material shall be sent directly to the copyright owner as specified in the copyright notice associated with the article.