
Abstract
Introduction
Asthma is a chronic, non-communicable disease characterized by inflammation and narrowing of the bronchial tubes, resulting in reduced airflow in and out of the lungs. 1 It affected approximately 260 million individuals worldwide in 2019, and it was the 34th leading cause of disease burden, measured by Disability-Adjusted Life Years (DALYs). 2
Asthma can be relieved and controlled by avoiding triggers and lifestyle changes, and it can be effectively controlled with medication. Control requires diagnosis and continuing management with medication, both of which are best done at the primary care level. 3 Whilst the burden of disease from asthma is mainly through its symptoms, it can be fatal if poorly controlled. When asthma is poorly controlled, people may require admission and the risk of mortality increases substantially. For this reason, asthma hospitalizations and deaths are often regarded as “avoidable”, and admission and mortality rates for asthma have been used as indicators of primary care quality.4,5
Sri Lanka is a low-middle income developing country, which the evidence indicates suffers from a high burden of asthma. Asthma was the fourth leading cause of death in Sri Lanka in 2019 according to global estimates. 6 Although national estimates are not available for Sri Lanka, a study covering 7 out of 9 provinces found that wheezing (an indicator of asthma) was reported by 24% of adults, 80% of whom had at least one other symptom of asthma. 7 However, only 12% reported a diagnosis of asthma, indicating low levels of diagnosis. 7 The conclusion of low levels of diagnosis and inadequate treatment is reinforced by Sri Lanka’s very high asthma hospital admission rates of 895 per 100,000 population, 8 fifteen times more than the average rate in Organization for Economic Co-operation and Development (OECD) countries. 9 Additionally, Sri Lanka had one of the highest reported asthma mortality rates in the world (1.3 deaths per 100,000), nearly two to five times the mortality rates reported in Europe and high-income countries. 10 Death rates were also higher in poorer socioeconomic quintiles and highest in estate areas of the central hill country, 10 suggesting that disparities in access to healthcare may be contributing.
Clinical diagnosis of asthma requires spirometry with testing of bronchodilator reversibility in a healthcare setting. There is limited capacity for this in the Sri Lankan healthcare system, even at the hospital level, and limited availability of equipment and supplies often results in spirometry testing not being done in patients with possible asthma. 11 Having lower-cost non-clinical options to identify people with a high risk of having asthma could improve diagnosis and treatment rates by prioritizing those at higher risk for clinical testing, and by increasing treatment rates to reduce morbidity and mortality.
One option for improving screening at the community level might be to provide the public with access to reliable screeners that they can self-use to identify if they might have asthma and should seek proper assessment by a physician. This would require a screening tool adapted to the Sri Lankan population that uses non-clinical information to identify individuals with a high likelihood of having asthma.
One approach to doing this is to use self-reported data along with Machine Learning (ML) and Artificial Intelligence (AI) to streamline the process of identifying individuals who may require further diagnostic assessments or treatment for asthma. By integrating AI algorithms, which analyze patient-reported symptoms and triggers such as coughing or wheezing, with ML models that leverage both current data and historical records, it becomes possible to predict the presence or exacerbation of asthma with a personalized risk assessment.12–15 These AI-driven decision support systems can assist healthcare providers in interpreting patient-reported symptoms and characteristics, potentially accelerating the diagnosis and treatment process. 13
Moreover, a model that is developed using self-reported data could be used by individuals, or clinicians at primary or secondary care settings, particularly in countries without the resources for expensive laboratory tests. For a more comprehensive exploration of how ML and AI can be applied in this context, please refer to the “Related Work” section. Thus, we aimed to develop a predictive model incorporating adult asthma features and risk factors which can be deployed as a web application.
Related Work
Many existing clinical prediction models for asthma are designed for use within healthcare settings and require data that is typically only available through medical facilities. These models often involve clinical populations and use detailed clinical data, which is not always accessible to the general public, particularly in resource-limited settings like Sri Lanka. In contrast, the goal in the Sri Lankan context is to develop a self-use screener that can be utilized by ordinary people outside of healthcare facilities. This aligns with the need for accessible, population-based solutions that leverage available data to facilitate early detection and prompt medical consultation.
Tomita and colleagues 16 developed a model using Logistic Regression, Support Vector Machine (SVM), and Deep Neural Network (DNN) to predict adult asthma diagnoses. Their study used clinical features such as symptoms, physical signs, biochemical findings, lung function tests, and bronchial challenge test results from 566 adult outpatients at Kinki University Hospital, achieving a DNN model accuracy of 98%. Similarly, researchers from Ionian University, Greece, developed an asthma predictive model 17 using demographic, medical, and lung measurements, habits, and symptoms data from 132 patients, finding that Random Forest outperformed other models like Naïve Bayes, Logistic Regression, and SVM. These studies highlight the effectiveness of ML models but underscore the need for clinical data, which limits their applicability in non-clinical settings.
Philippine researchers integrated ML models to predict asthma using genetic information, 18 specifically Single-Nucleotide Polymorphism (SNP) data. They used Random Forest and Recursive Feature Elimination (RFE) algorithms to identify significant SNPs, with the integrated RF-SVM model achieving an accuracy of 62.5%. Priya and Priyadharshini 19 developed a Convolutional Neural Network (CNN) model that used a broad range of clinical features to achieve 98.36% accuracy. In another study, Chinese computer scientists 20 used classifiers such as Naïve Bayes and Random Forest on a dataset from a hospital in Pakistan, with Naïve Bayes attaining an accuracy of 98.75%. Additionally, a collaboration between South Korean and US researchers implemented a mobile health application using the Internet of Things (IoT). 21 They developed a CNN model using Peak Expiratory Flow Rates (PEFR), indoor particulate matter data, and weather data. This model, implemented as a mobile app on smartphones, demonstrated lower error rates compared to other benchmark techniques. These models, though highly accurate, rely on detailed clinical and genetic data.
In contrast, our approach focuses on developing a population-based asthma screener that can be used by individuals to self-assess their need for medical consultation. This approach leverages readily available data, making it more accessible and practical for use outside healthcare facilities. For instance, the National Health and Nutrition Examination Surveys (NHANES) data was used to predict asthma attacks in a cross-sectional United States (US) population, achieving an accuracy of 73.7% with an XGBoost model. 22 Additionally, a study combined ML with AI, 23 using data from social media and doctor visits to create a Decision Tree model with 87% accuracy, deployed as an Android app for user self-assessment.
Several real-world applications have successfully implemented ML and AI to assist with asthma management, highlighting the potential for self-use tools. For example, Smart Asthma: Forecast Asthma uses historical and real-time data to provide personalized forecasts and insights into potential triggers, enabling users to take preventive measures.24,25 Similarly, Propeller Health uses sensors attached to inhalers to track medication use and environmental data, providing users with health forecasts based on local conditions and reducing emergency visits by 57%.26–28 Hailie 29 and KagenAir 30 also offer personalized insights and forecasts to help users manage their asthma based on real-time data and usage patterns.
Most of the previously published approaches rely on data input by physicians and information from laboratory investigations and testing procedures. In Sri Lanka, where the priority is to triage people for clinical assessment, there is an urgent need for alternative tools that can be used by the public at the community level using information readily available to individuals. In Sri Lanka, where medical testing resources are limited, the widespread access to mobile phones with internet connectivity31–33 provides an opportunity to develop a relevant technology solution. A public-facing web tool based on a population-based screener can help individuals self-assess their asthma risk and determine the need for medical consultation. This approach leverages accessible data and technology, making it a practical and scalable solution for early detection and management of asthma in Sri Lanka.
AI-based systems have been successfully used to screen for undiagnosed conditions in other health areas. For example, Singapore’s AI system SELENA + addresses diabetic retinopathy by analyzing retinal images for early signs of eye diseases, significantly scaling up screening capabilities. 34 Singapore’s healthcare system also uses AI for early detection, treatment targeting, and resource optimization, demonstrating the broad potential of AI in improving healthcare delivery and efficiency. 34 These examples illustrate the feasibility and benefits of implementing AI-based screening tools in various health contexts, and such tools could likely be useful for asthma detection in resource-limited settings like Sri Lanka.
Methodology
Overall framework
The study followed a framework of six phases: • Phase 1: Data extraction • Phase 2: Data preprocessing and exploratory data analysis • Phase 3: Feature engineering • Phase 4: Model fitting • Phase 5: Model evaluation • Phase 6: Model deployment
Figure 1 provides a visual representation of the comprehensive data analysis workflow executed within each of these phases. Overall framework.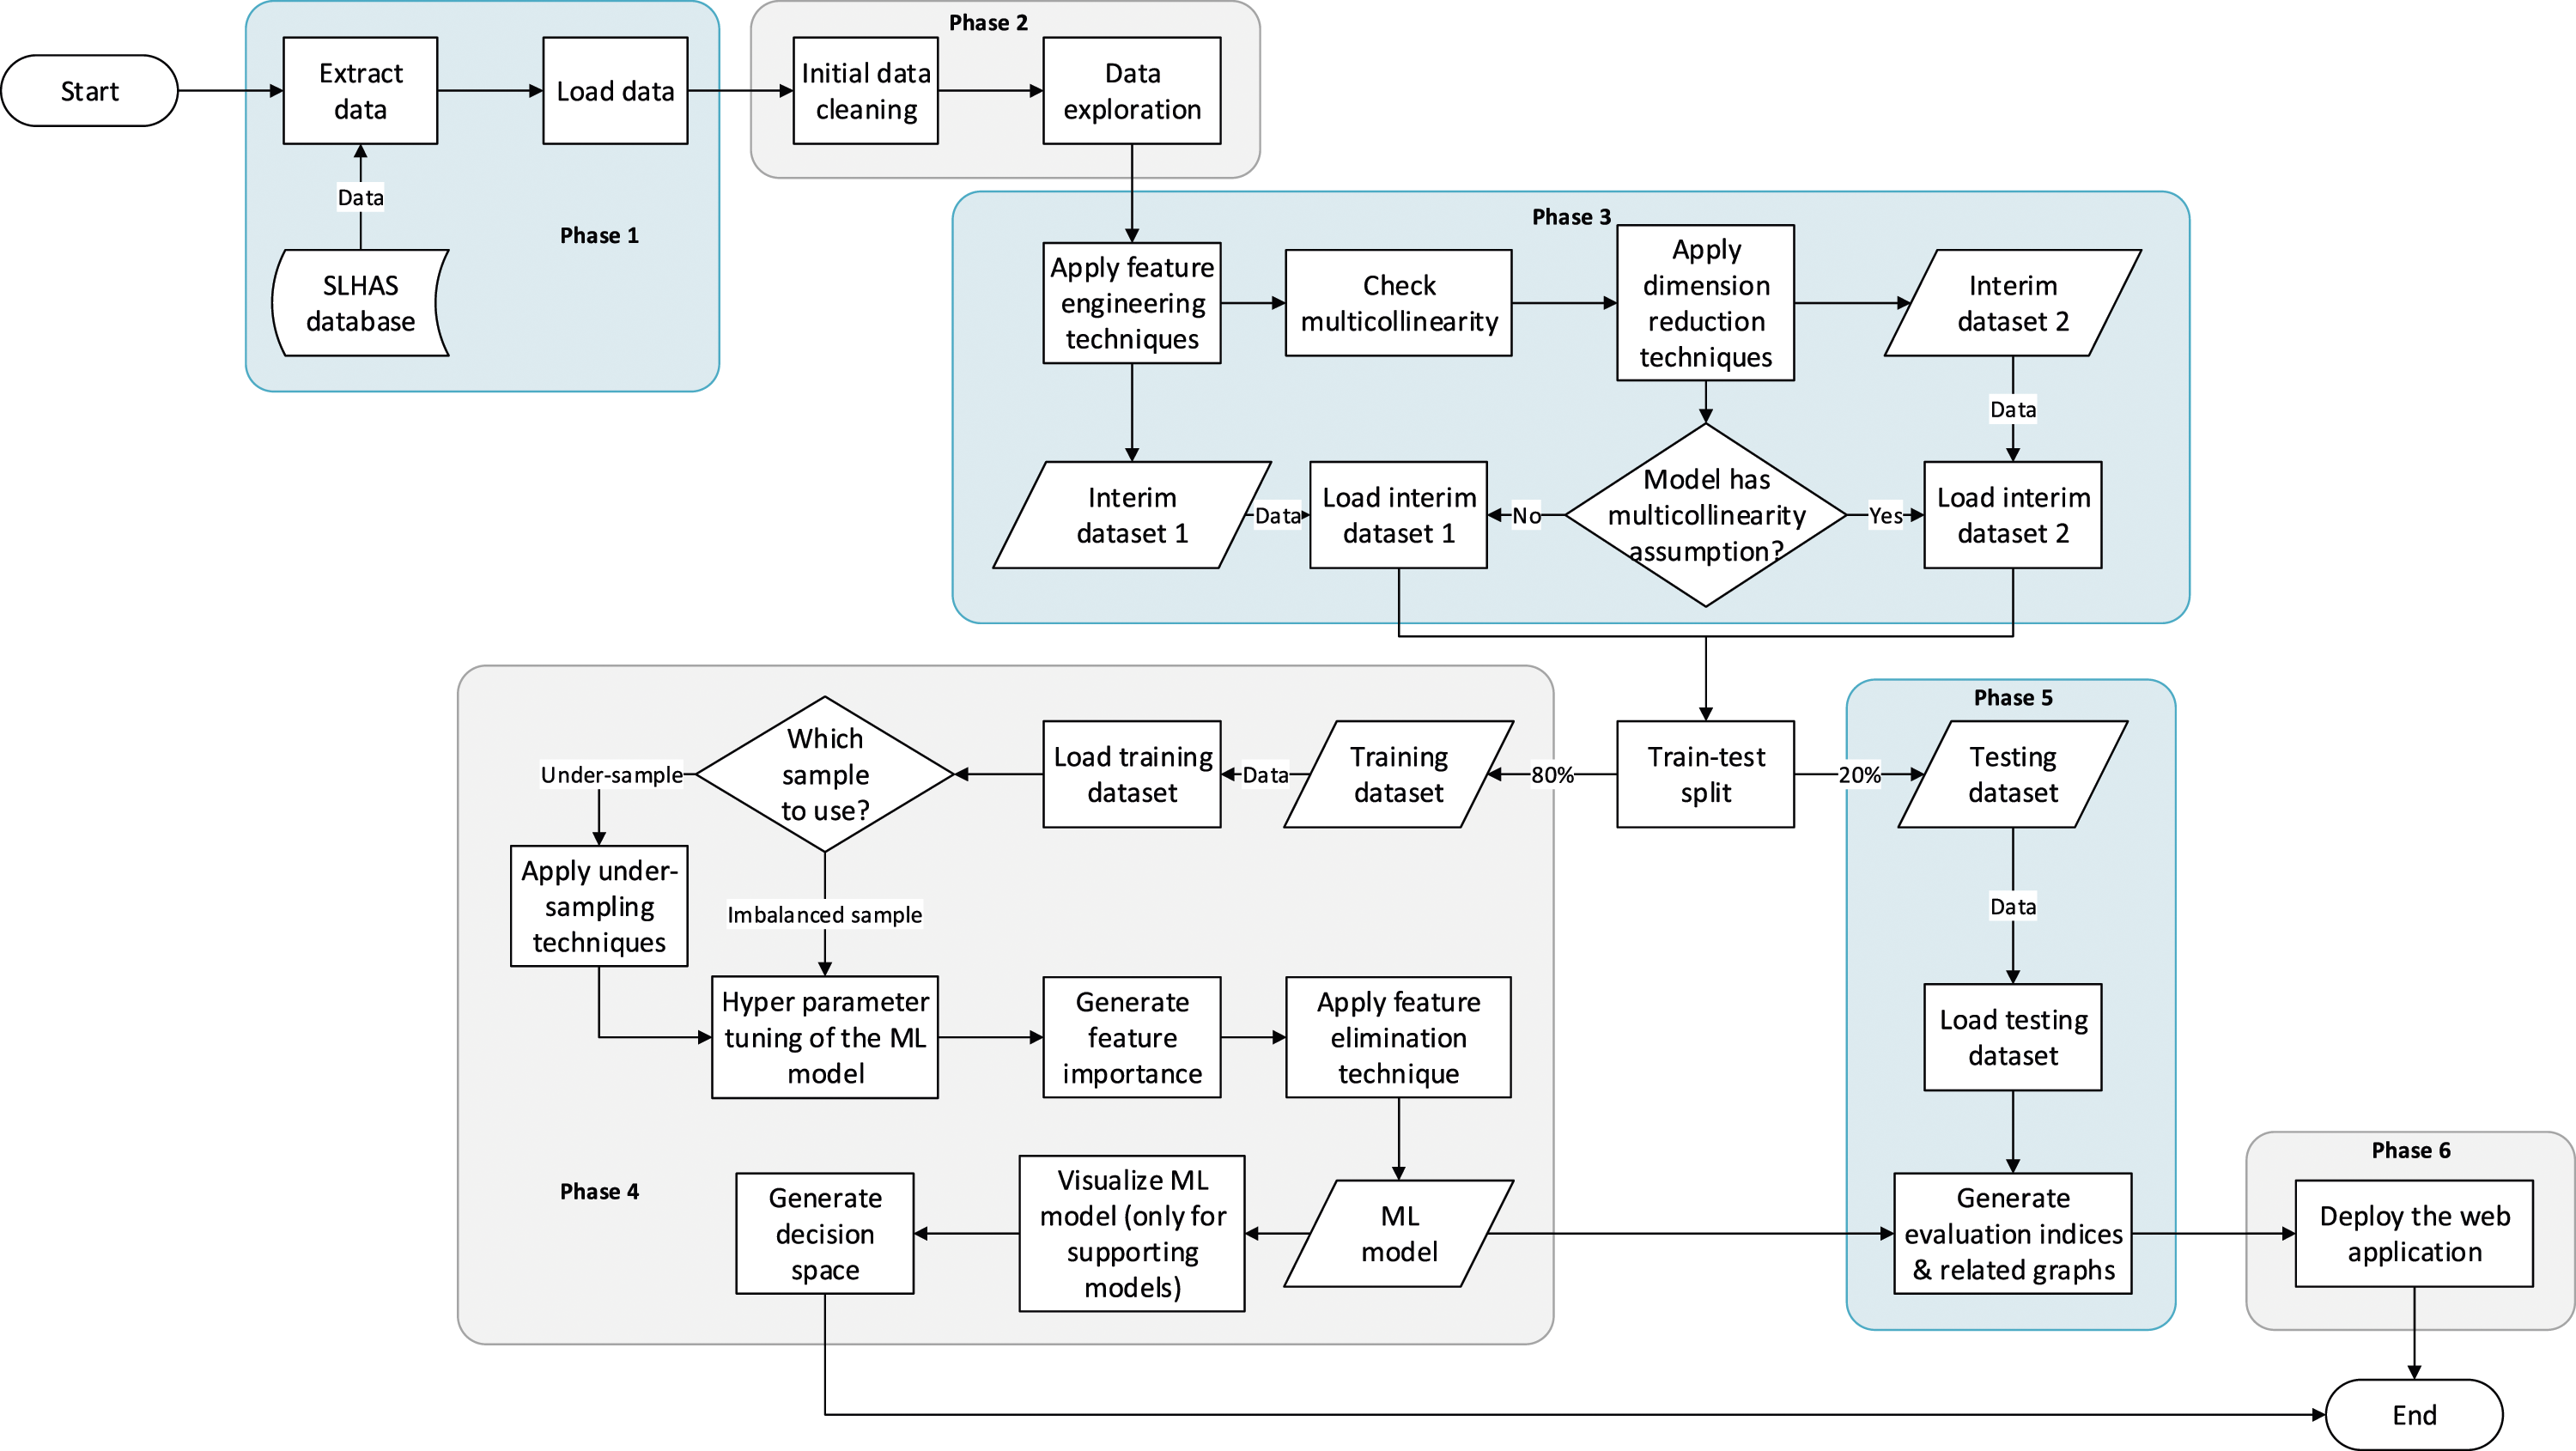
Study design and participants
We utilized data from the inaugural wave of the Sri Lanka Health and Ageing Study (SLHAS), a nationally representative longitudinal cohort study, conducted between mid-November 2018 and mid-November 2019.
The SLHAS employed a stratified, multistage probability sampling strategy to procure a representative sample of the non-institutionalized adult population (≥18 years) across Sri Lanka.35,36 This methodological framework treated all 14,014 Grama Niladhari Divisions (GNDs), the smallest administrative units in Sri Lanka, as primary sampling units (PSUs).35,36 These divisions were stratified according to district, residential sector, and Area Socio-Economic Status (ASES), with the latter quantified through Principal Component Analysis (PCA) of socio-economic indicators derived from the 2012 national census data furnished by the Department of Census and Statistics (DCS).35,36
To achieve a robust sample, two or more PSUs were selected from each stratum via probability-proportionate-to-size sampling. Within each PSU, households were systematically sampled, and one eligible adult meeting inclusion criteria: resident, aged ≥18 years, not pregnant, and able to provide informed consent; was randomly selected, with age weighting applied to ensure demographic representativeness. Households were excluded if the individual selected could not participate.35,36
Fieldwork was rotated across provinces to mitigate seasonal bias. Participants attended local field clinics, where they underwent comprehensive interviews to gather data on chronic diseases and symptoms, risk factors, and socio-economic variables. Each participant also underwent anthropometric measurements and blood tests. For participants with mobility limitations, interviews and abbreviated assessments were conducted in their homes. Data was collected using a Computer-Assisted Personal Interviewing (CAPI) application deployed on tablet devices.35,36
Of the 10,689 households sampled, 10,062 agreed to participate. Among these, 6,624 adults attended field clinics, with an additional 41 individuals completing home interviews, yielding an effective response rate of 65.0%. Response rates varied, with higher participation observed among women (69%), adults aged ≥45 years (74%), rural residents (70%), and individuals with known diabetic conditions (73%).35,36
Data collection
The SLHAS extensively leveraged electronic data capture methods, prominently featuring CAPI for streamlined data acquisition. The integration of CAPI offered several advantages: • Accelerated and enhanced precision in data acquisition within field settings compared to traditional methods. • Mitigation of costs and errors associated with manual data entry from paper-based forms, including the need for subsequent data cleaning. • Facilitation of intricate data collection designs, including randomized questionnaire modules, Global Positioning System (GPS) data recording, and coding of complex responses. • Drastically reduced turnaround time from data acquisition to data availability for analysis. • Agile adaptation of data collection tools in response to survey experience or project adjustments.
To facilitate electronic data capture, the SLHAS utilized iFormBuilder, a cloud-based mobile data collection platform provided by Zerion Software. 37 Customized data collection forms were employed, enabling data entry through typing, point-and-click methods, barcode scanning, and GPS signal capture via tablet PCs (Personal Computers). Furthermore, the iForm collection tools incorporated data validation checks to minimize erroneous entries, while the question design minimized reliance on free-text responses. More importantly, all Personally Identifiable Information (PII) was safeguarded through Public-Key Cryptography (PKC), ensuring robust data security and patient privacy.
Questionnaire tools
All the questionnaires used in this study are validated, translated, back-translated, and pilot-tested in the field prior to the actual commencement of the survey. Questions from standard international questionnaires were used. The European Community Respiratory Health Survey (ECRHS) II 38 was used to determine respiratory symptoms. The World Health Organization’s (WHO) STEPwise approach to noncommunicable disease risk factor surveillance (STEPS)39,40 was used to determine alcohol usage and physical activity, while questions from the National Health and Nutrition Examination Survey (NHANES) 201541,42 was used to determine smoking habits.
Household features such as garbage disposal and cooking were determined using questions from the Sri Lankan Household Income & Expenditure Survey (HIES) 2016 43 and Demographic & Health Survey (DHS) 2016,44,45 while demographic details were based on questions from the Sri Lankan Census of Population & Housing (CPH) 2011.46,47 These tools and questionnaires are available for public use, such as those from NHANES, HIES, DHS, and CPH, whilst the others are available for use with appropriate citation.
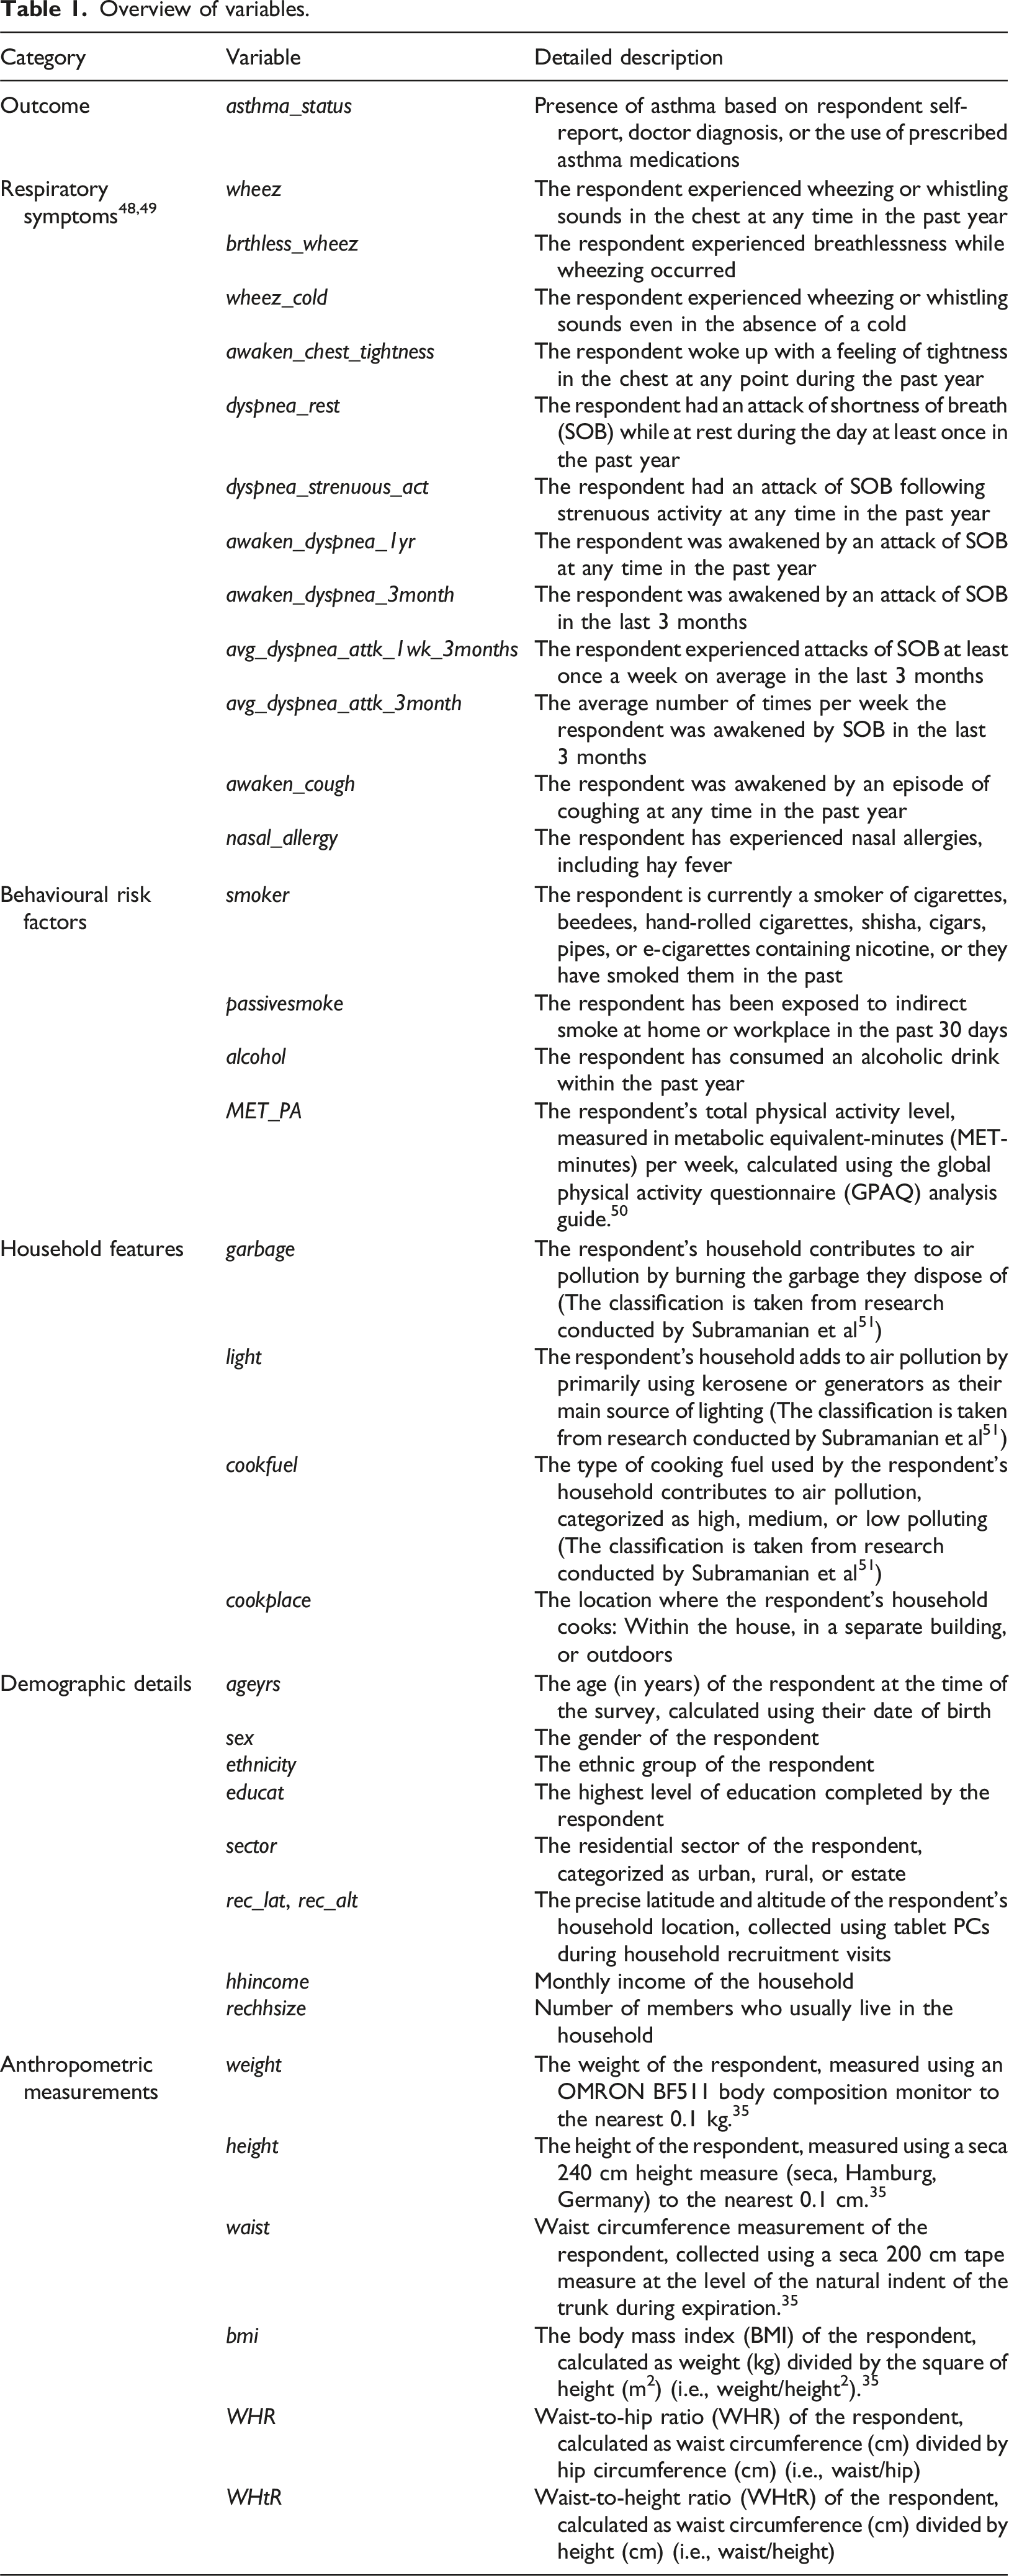
Variables considered for models
Overview of variables.
Preprocessing
Initial SLHAS datasets in Stata format were retrieved and then cleansed and explored graphically. Feature engineering techniques were applied, including binning, outlier detection, one-hot encoding, and imputation of missing data. We imputed missing data columns using the Multivariate Imputation by Chained Equations (MICE) algorithm when the missing data percentage was less than 40%. 52
Two variables are said to be highly correlated if the magnitude of the correlation coefficient is higher than 0.7. 53 Some ML models are sensitive to multicollinearity. Therefore, correlation coefficient calculation techniques like Cramer’s V (for categorical features), Pearson’s r (for numerical features), and correlation ratio (for mixed data) were employed to detect multicollinearity.
In our study, we employed three different dimension reduction techniques to handle correlated features for our ML models. We utilized Principal Component Analysis (PCA) for numerical features, Multiple Correspondence Analysis (MCA) for categorical features, and Factor Analysis of Mixed Data (FAMD) for mixed data. These techniques were chosen to address multicollinearity assumptions in our models by combining correlated features.
Data sampling
The model-building process of this study started with an 80% versus 20% train-test split with stratification. In tuning model hyperparameters, we adopted the grid search method with 10-fold cross-validation. Moreover, the 10-fold cross-validation technique allowed for RFE and performance score calculations.
Due to the unequal distribution between asthmatics and non-asthmatics in the dataset (known as the imbalance property), we used two categories of ML models: models built on an under-sampled dataset (mentioned as data level approach models in Table 3) and models that incorporated class weights to overcome the imbalance in the dataset, referred to as balanced models (also mentioned as algorithmic level approach models in Table 3).
Machine learning models
Logistic regression
Logistic Regression (Univariate Logistic Regression) is a statistical model that models the relationship between a dichotomous outcome variable and one or more categorical or continuous response variables, resulting in an equation to predict the outcome. 54
Support vector machine
Support Vector Machine (SVM) finds an optimal hyperplane in the dimensional space which separates observations belonging to one class (group) from another. 55 SVMs can handle both linear and nonlinear classifications.
Decision tree
A Decision Tree follows the divide-and-conquer approach to perform classification. 56 It recursively partitions the dataset using information gain metrics until each partition consists totally or mainly of cases from only a single class. 57
Random forest
Random Forest evolved from Decision Trees and is a combination of multiple decision trees. Each Decision Tree results in a predicted class, and the Random Forest selects the most voted class as the final prediction. 58
Naïve bayes
The Naïve Bayes algorithm is a supervised learning probabilistic classifier that utilizes Bayes’ theorem together with feature independence. 59
K-nearest neighbour
K-Nearest Neighbour (KNN) employs distance metrics to determine a group of K-similar samples. Then the class of an unknown case is obtained using the class attributes of the nearest K neighbour. 60
Gradient boost
Gradient Boost is an effective classifier designed to gradually convert a weak learner to a strong learner by minimizing the loss function. This loss function serves as a metric for measuring the prediction error. In essence, the objective function guides the gradient descent optimization process for this systematic reduction in the loss function. 61
Extreme gradient boost
The Extreme Gradient Boost (XGBoost) algorithm is an efficient and flexible form of the Gradient Boost algorithm. 62 The XGBoost differs from the Gradient Boost because it introduces a regularization term to the objective, apart from the loss function.
Adaptive boost
Adaptive Boost (AdaBoost) is a boosting algorithm that converts a weak learner into a strong one. It does this by adjusting weights with no prior knowledge of the learning ability of the learner. 63
Categorical boosting
Categorical Boosting (CatBoost) is a recently developed Gradient Boost algorithm that uses binary decision trees as the base predictor. It works exceptionally well with categorical features, resulting in the lowest information loss. Compared to other Gradient Boost algorithms, CatBoost is diverse due to its utilization of ordered boosting, its ability to be used even on small datasets, and its automatic handling of categorical features. 64
Light gradient boosting machine
Light Gradient Boosting Machine (LightGBM) is another algorithm that adopts the gradient boosting framework. It is designed to improve computational efficiency and is thus suitable for large datasets. LightGBM differs from other tree-based models by growing trees leaf-wise instead of level-wise. This prioritizes nodes with the most significant impact on reducing loss, leading to faster training times and frequently superior predictive performance, especially with large datasets. Therefore, LightGBM is a better model when compared to other tree-based models. 65
Multi-layer perceptron
Multi-Layer Perceptron (MLP) is a DNN with single or multiple hidden layers between input and output layers. 66 MLPs also have the characteristic of fully connected layers.
Probabilistic neural network
The Probabilistic Neural Network (PNN) belongs to the ANN group and is based on Bayes’ theory. It estimates the probability density function of each class. A PNN consists of four layers: input layer, pattern layer, summary layer, and decision layer. 67
Hybrid machine learning model
A Hybrid model combines two or more different ML modeling techniques to create a single, more powerful model. 68
Model building
We applied multiple ML classifiers identified in the literature to identify the most appropriate model for asthma prediction. The models we selected were Logistic Regression, SVM, Decision Tree, Random Forest, Naïve Bayes, KNN, Gradient Boost, XGBoost, AdaBoost, CatBoost, LightGBM, MLP, PNN, and a hybrid version of Logistic Regression and LightGBM models (referred to as the Hybrid Model). Of the constructed models, Logistic Regression, Naïve Bayes, MLP, PNN, and Hybrid Model utilized dimension reduction techniques to address the multicollinearity assumption.
Depending on the ML classifier, we employed several feature-importance techniques in this study: coefficients as feature importance (Logistic Regression and SVM), decision tree feature importance (Decision Tree, Random Forest, Gradient Boost, XGBoost, CatBoost, and LightGBM), and permutation feature importance (Naïve Bayes, KNN, AdaBoost, MLP, and PNN).
Model evaluation
The two main model evaluation techniques incorporated in this study were the confusion matrix and the Receiver Operating Characteristic (ROC) curve. Thus, accuracy, precision, recall (sensitivity), specificity, and the F1 score were calculated for the confusion matrix, and the Area Under Curve (AUC) was calculated for the ROC curve.
Finally, the decision boundaries (decision spaces) of each classifier were visualized in a two-dimensional space.
Model deployment
We utilized a Python-based web application framework called Flask to make the model available for end-users, enabling them to use it for practical decision-making.
Results
Characteristics of participants
Characteristics of SLHAS asthma sample.
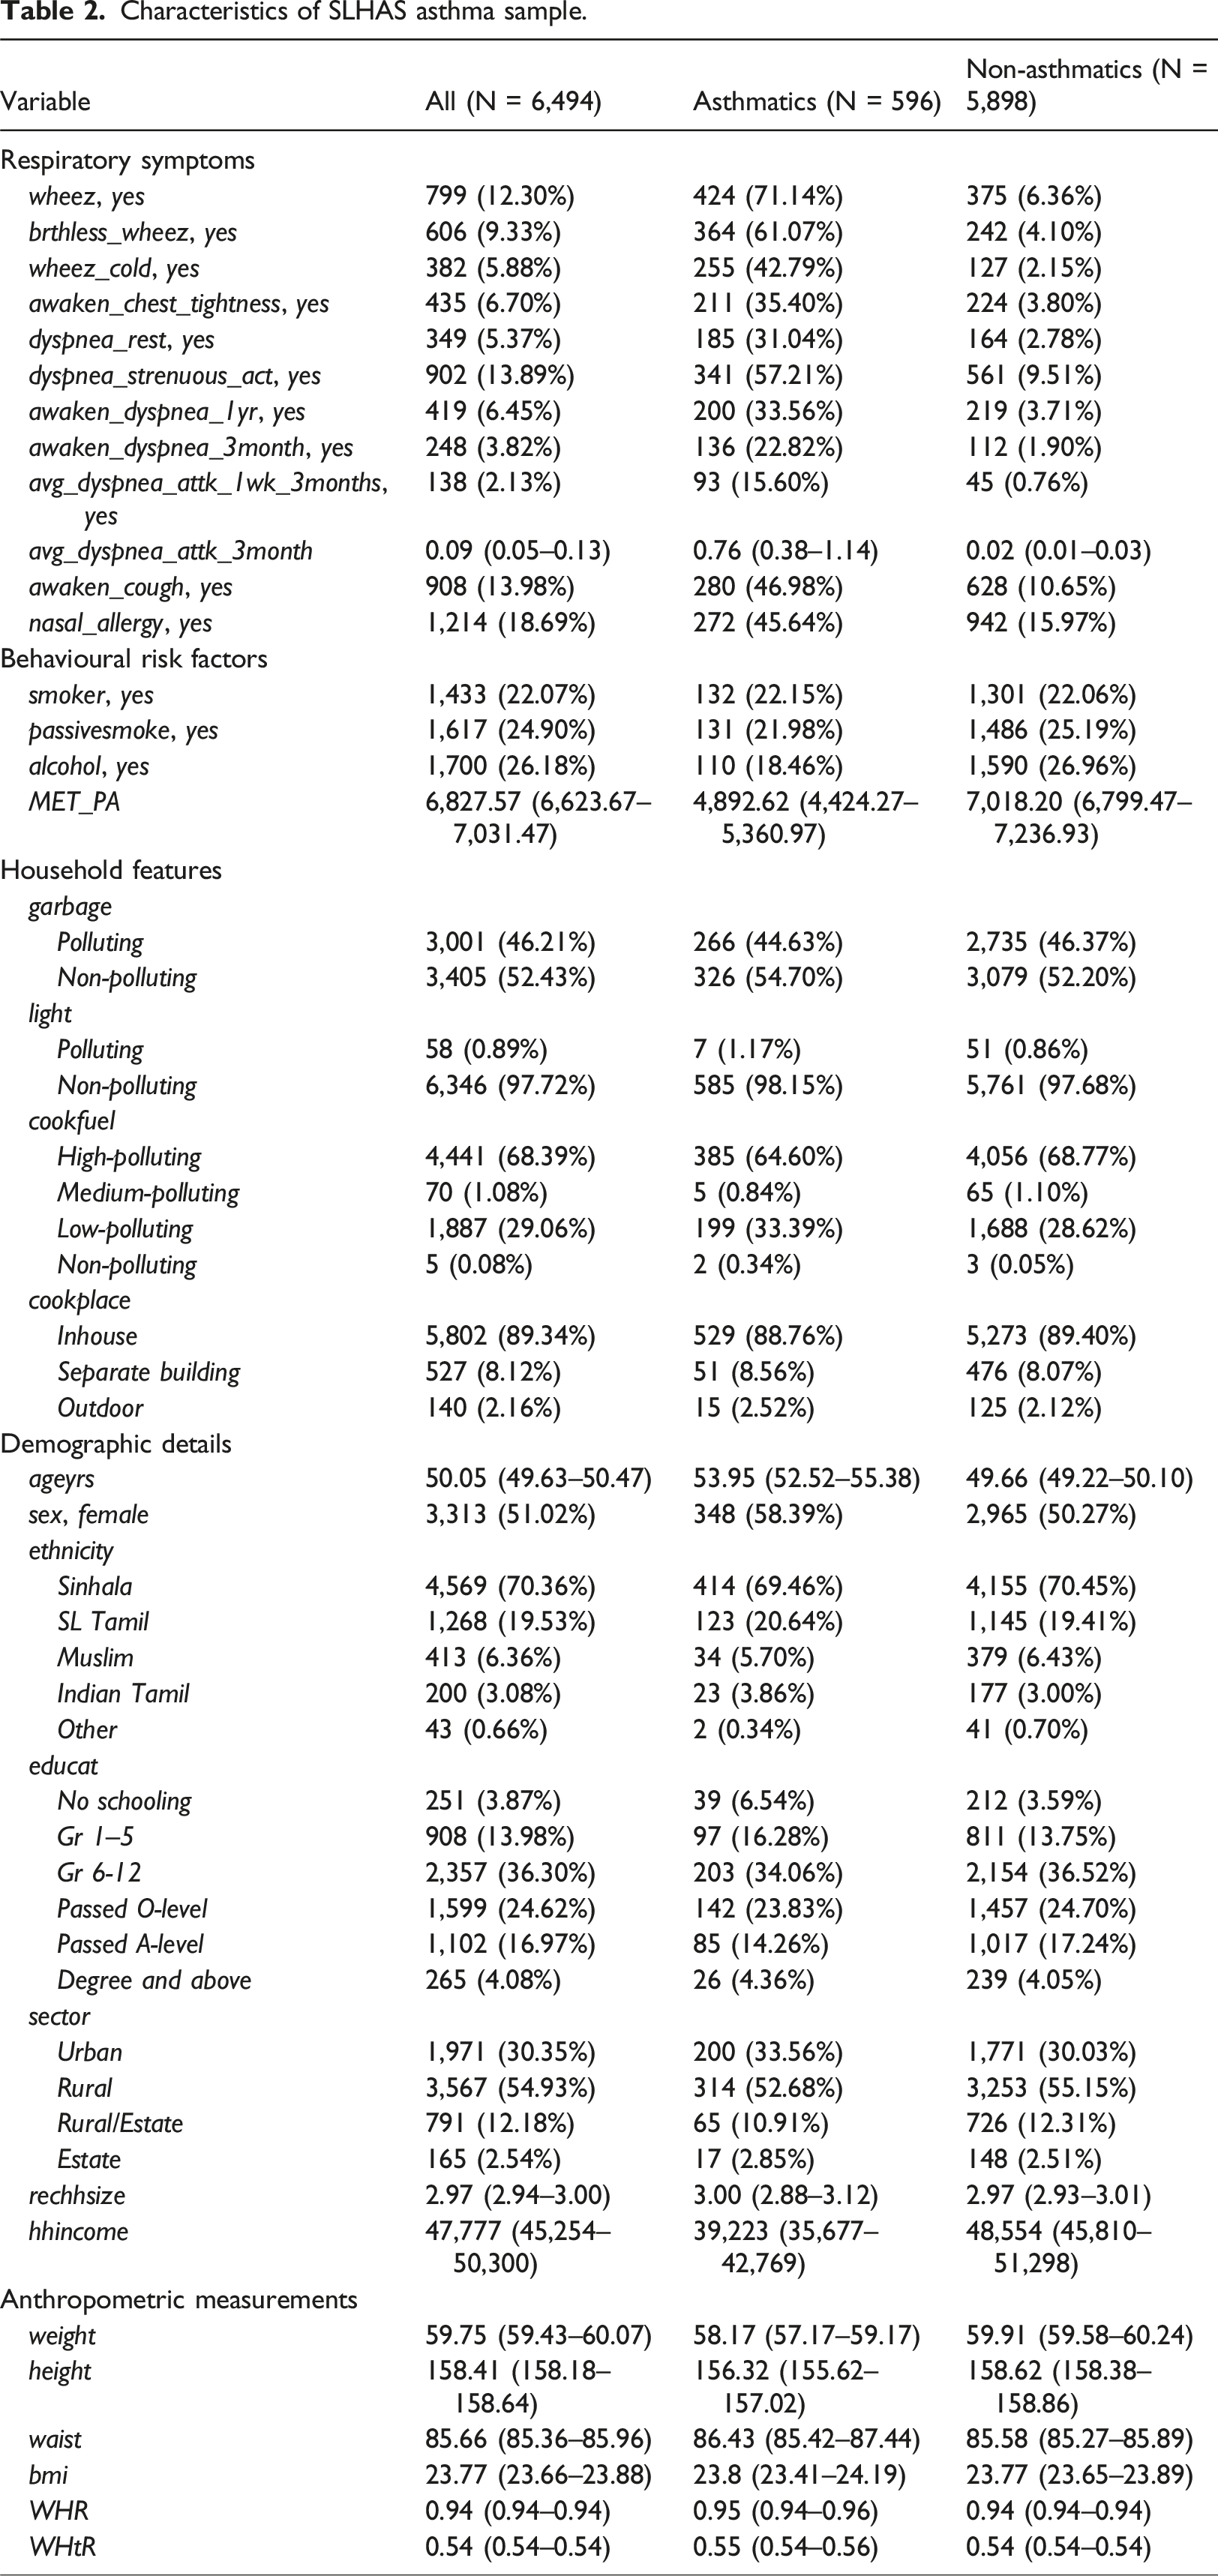
A significant number of individuals with asthma (∼71%) in the study displayed wheezing and other respiratory symptoms. Asthmatics demonstrated lower physical activity levels, evidenced by a lower mean MET_PA compared to non-asthmatics (4,892.62 vs 7,018.20). Demographic characteristics, environmental exposures, and anthropometric measurements showed similarities between asthmatics and non-asthmatics.
Model comparison
Evaluation indices of fitted ML models.
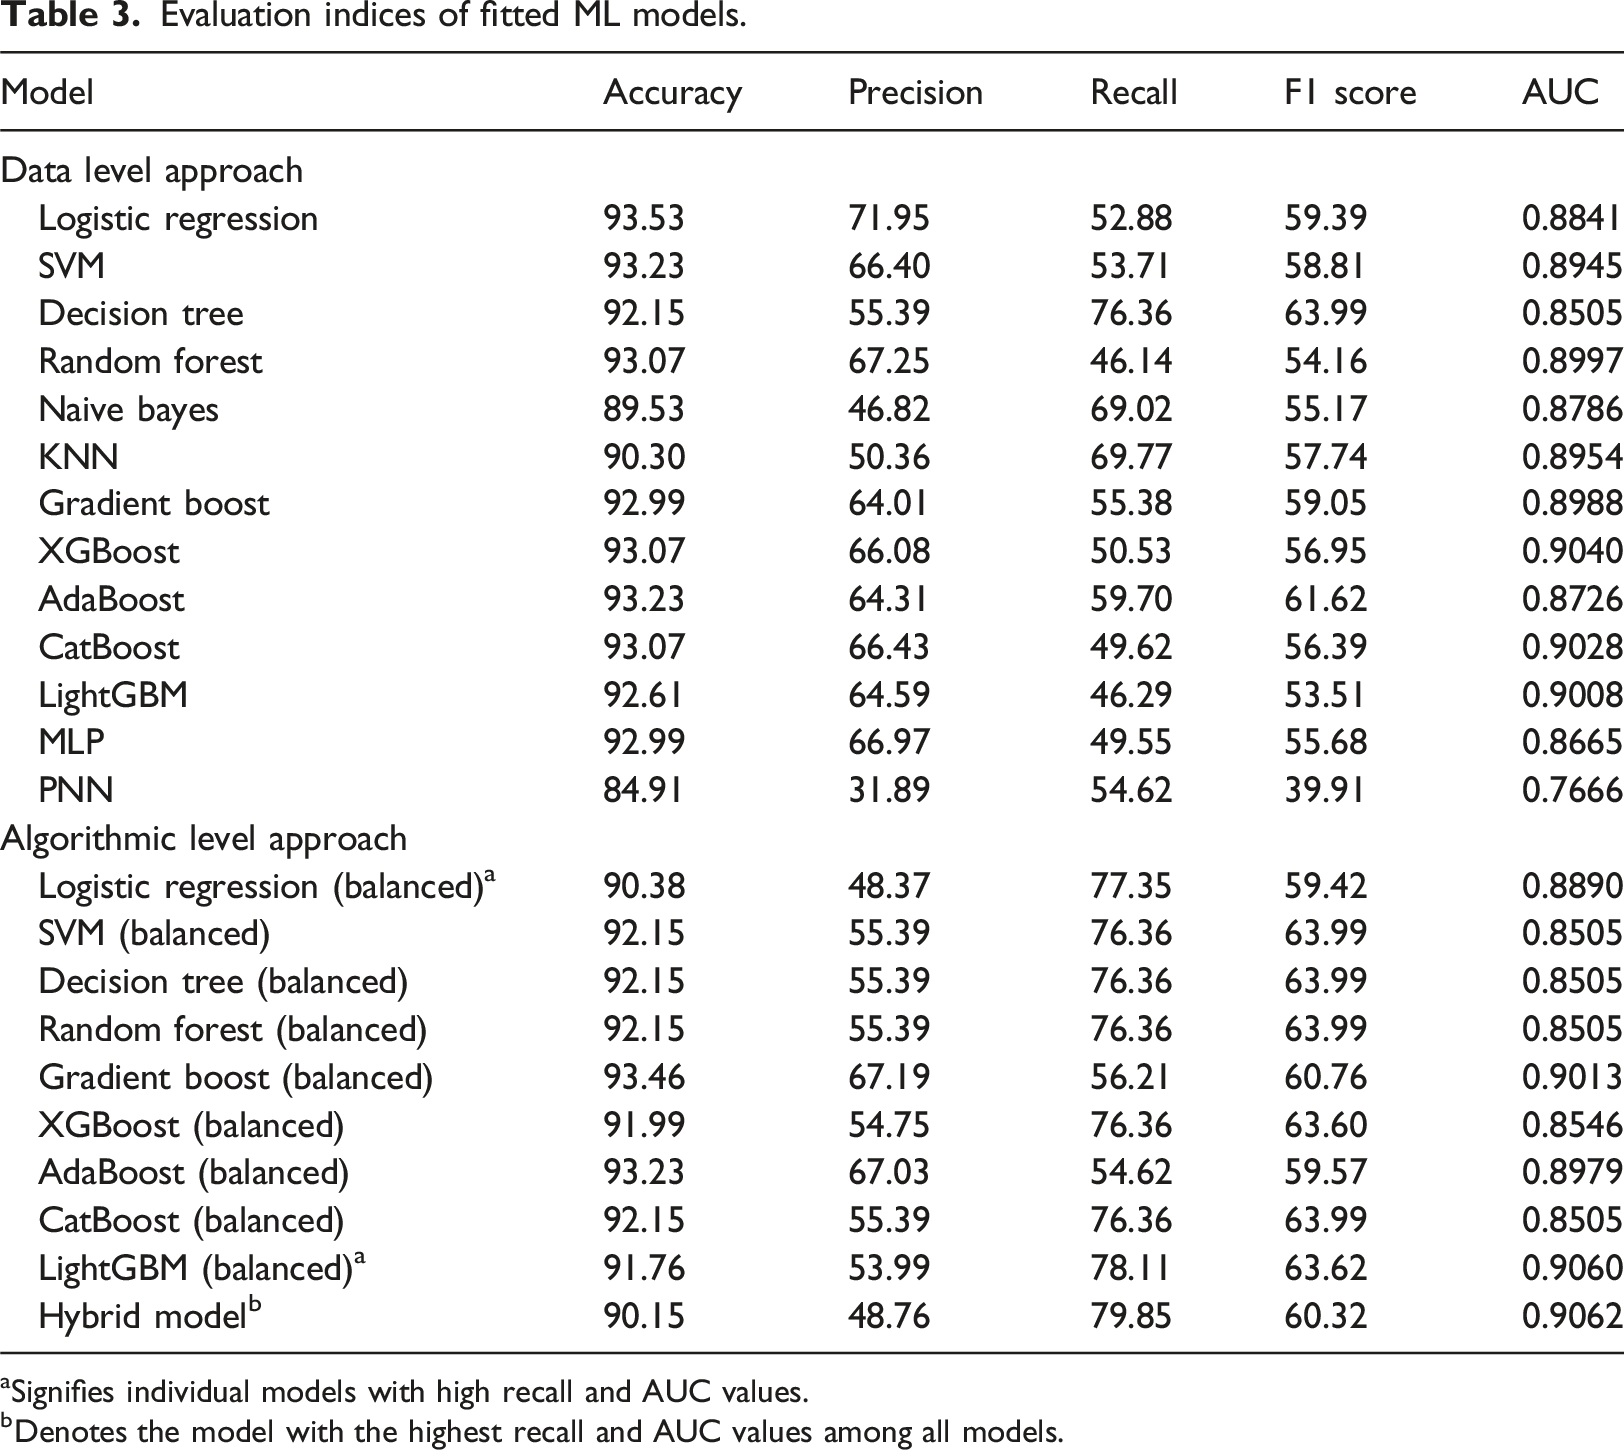
aSignifies individual models with high recall and AUC values.
bDenotes the model with the highest recall and AUC values among all models.
This implies that balanced LightGBM and balanced Logistic Regression are the first and second-best individual models for accurately identifying actual asthma patients (Table 3). This led us to develop a model combining the balanced LightGBM and the balanced Logistic Regression, which we called the Hybrid model. The Hybrid model recorded the highest value of sensitivity (recall) and AUC of all the models we had constructed and was selected as the best model, excelling in terms of sensitivity, AUC, and the number of features utilized (as elaborated in the section “Optimum Features”).
Considering the number of models we experimented with, only those demonstrating high evaluation scores are presented in the forthcoming sections.
Feature importance
Figure 2 illustrates the importance of individual features in a few selected models. In general, all ML models indicate that input variables related to wheezing are noticeable in their ability to predict asthma. In conjunction with wheezing, the occurrence of SOB episodes following strenuous activity, and the presence of nasal allergies such as hay fever, emerge as factors related to having asthma, as indicated by feature importance scores from models exhibiting high accuracy rates. Notably, among behavioural characteristics, engaging in less physical activity appears to be associated with asthma. Feature importance of selected models: (a) balanced Logistic Regression model; (b) balanced LightGBM model; (c) Hybrid model.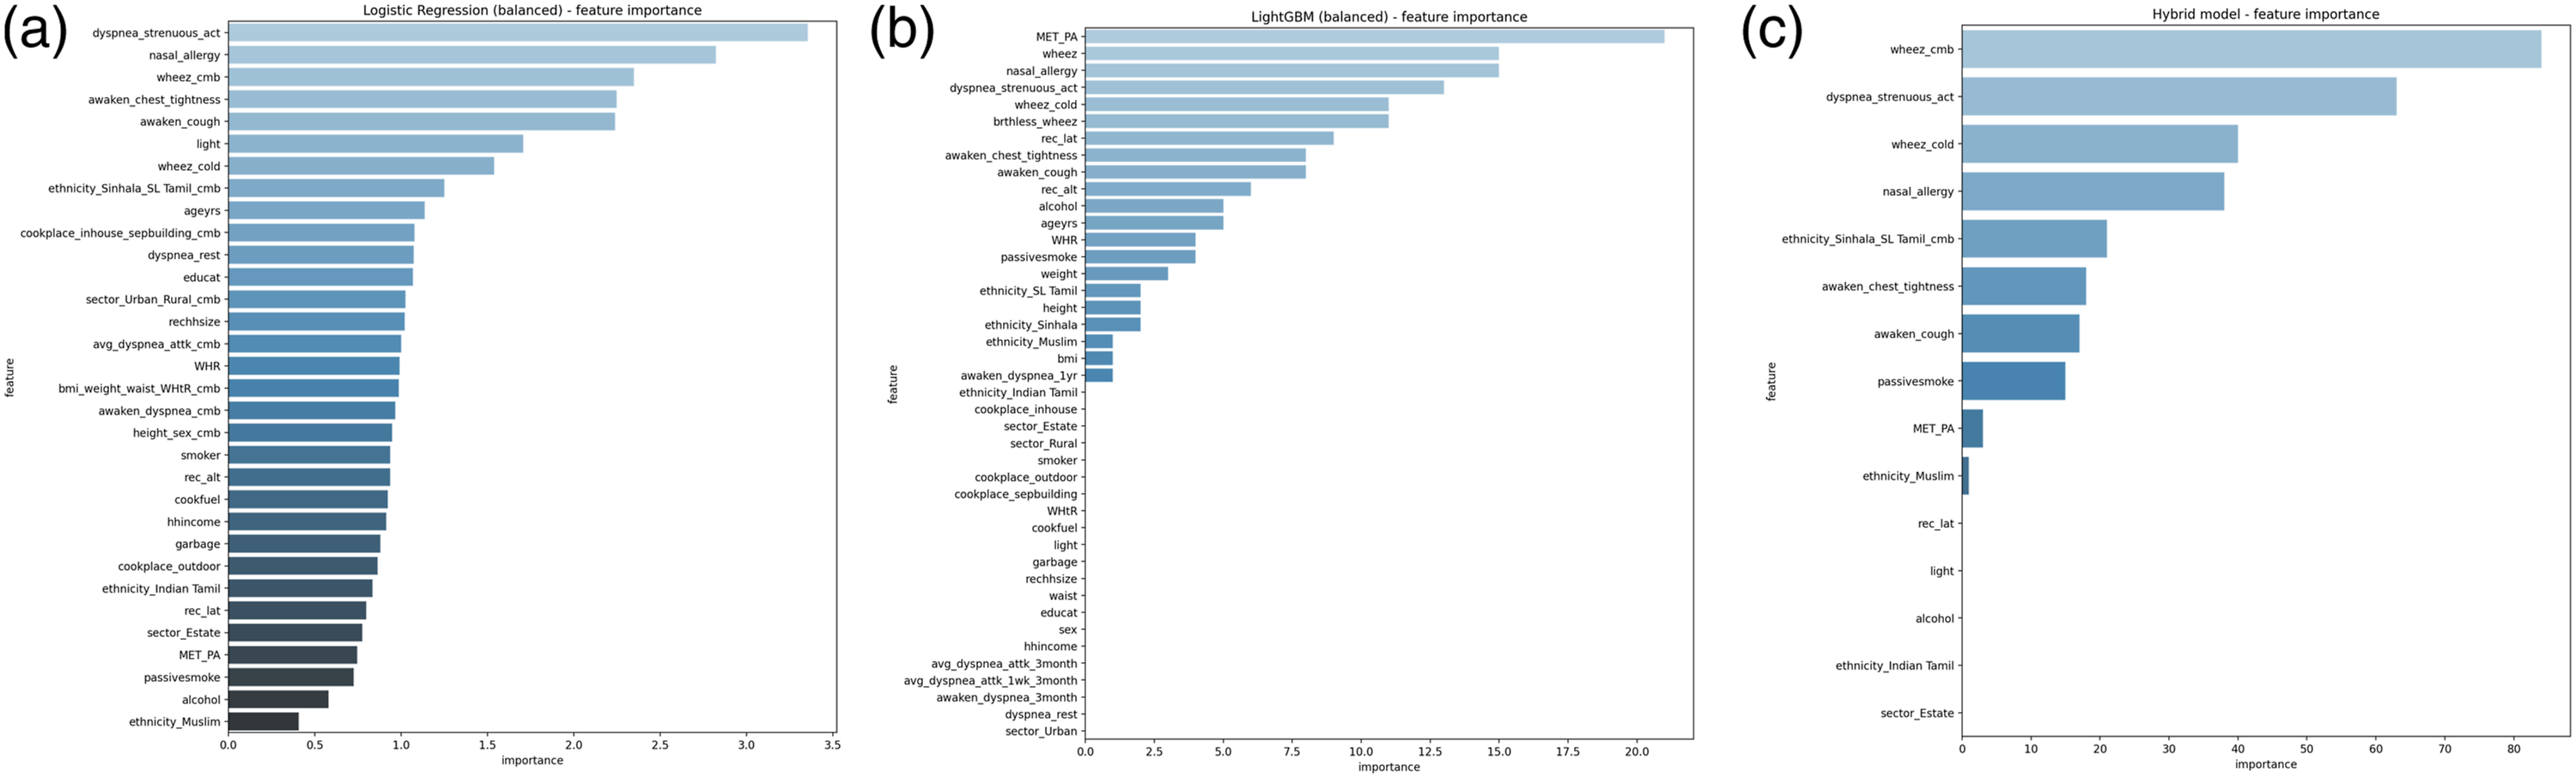
Optimum features
By utilizing feature importance and cross-validated recall, the RFE algorithm provided the optimal number of input features and identified which ones should be utilized. Figure 3 presents the number of input features required to achieve the highest cross-validated recall in a set of selected models. We considered the initial set of features that yield the highest cross-validated recall as the optimal number for each ML model. Consequently, the balanced Logistic Regression model yielded the best outcomes with the first 15 features, the balanced LightGBM model with the first 30 features, and the hybrid model with the first 12 features. Thus, among the models showcasing the highest accuracy levels, the Hybrid model stood out for requiring the fewest optimal features. The optimum number of features in selected models: (a) balanced Logistic Regression model; (b) balanced LightGBM model; (c) Hybrid model.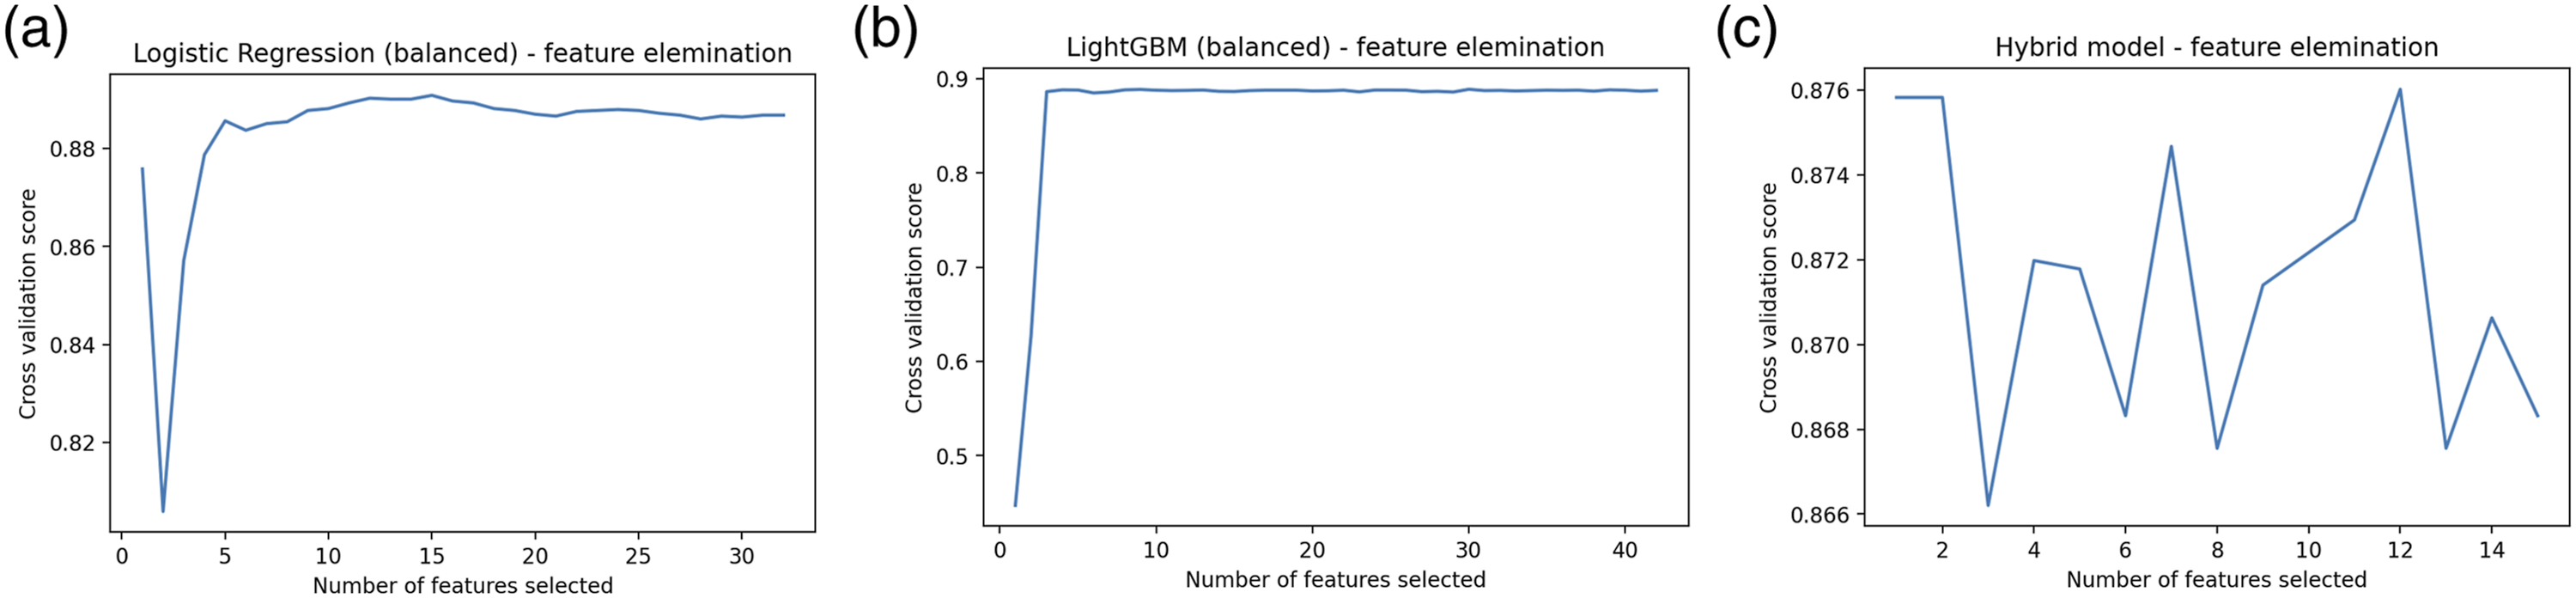
ROC curves
Figure 4 displays the ROC curves of the models, showcasing high AUC values. These curves visually depict the sensitivity and specificity of the models. Points closer to the top-left corner of the curve indicate better suitability and a closer approximation to the model’s ideal state. All three models demonstrated AUC values near 0.90. However, the Hybrid model outperformed the others by achieving the highest AUC while utilizing the least number of features. ROC curves of selected models: (a) balanced Logistic Regression model; (b) balanced LightGBM model; (c) Hybrid model.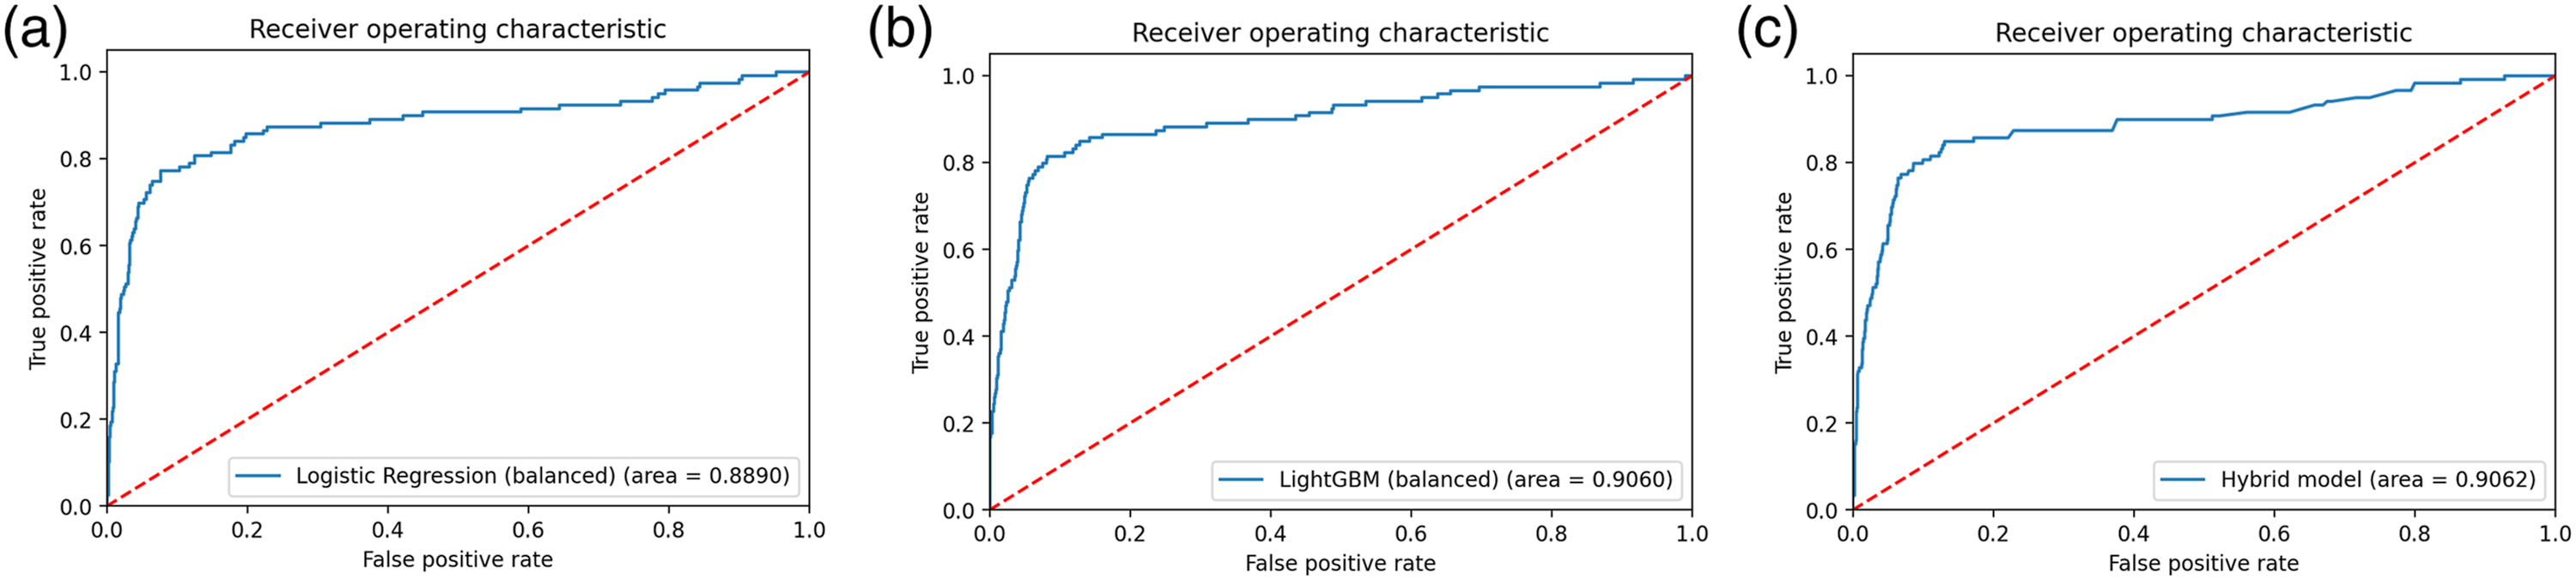
Decision space
The decision space, depicted in Figure 5, visually illustrates how a set of fitted models delineate the feature space into different classes, accompanied by the AUC metric in the bottom right corner. Each model’s prediction process and division of the feature space are showcased. The X and Y axes represent input features, reduced to two dimensions through dimension reduction algorithms. Red dots denote asthmatic patients, while blue dots denote non-asthmatic patients. The background colours, shades of red for asthmatics and shades of blue for non-asthmatics, highlight the respective feature spaces. The decision boundary, delineated by contour lines, marks regions where the classifier assigns class labels based on input features. Notably, the Hybrid model and balanced Logistic Regression model demonstrate clear separations between asthmatic and non-asthmatic classes, contrasting with the balanced LightGBM model, which lacks such a distinct separation. Decision space of selected models: (a) balanced Logistic Regression model; (b) balanced LightGBM model; (c) Hybrid model.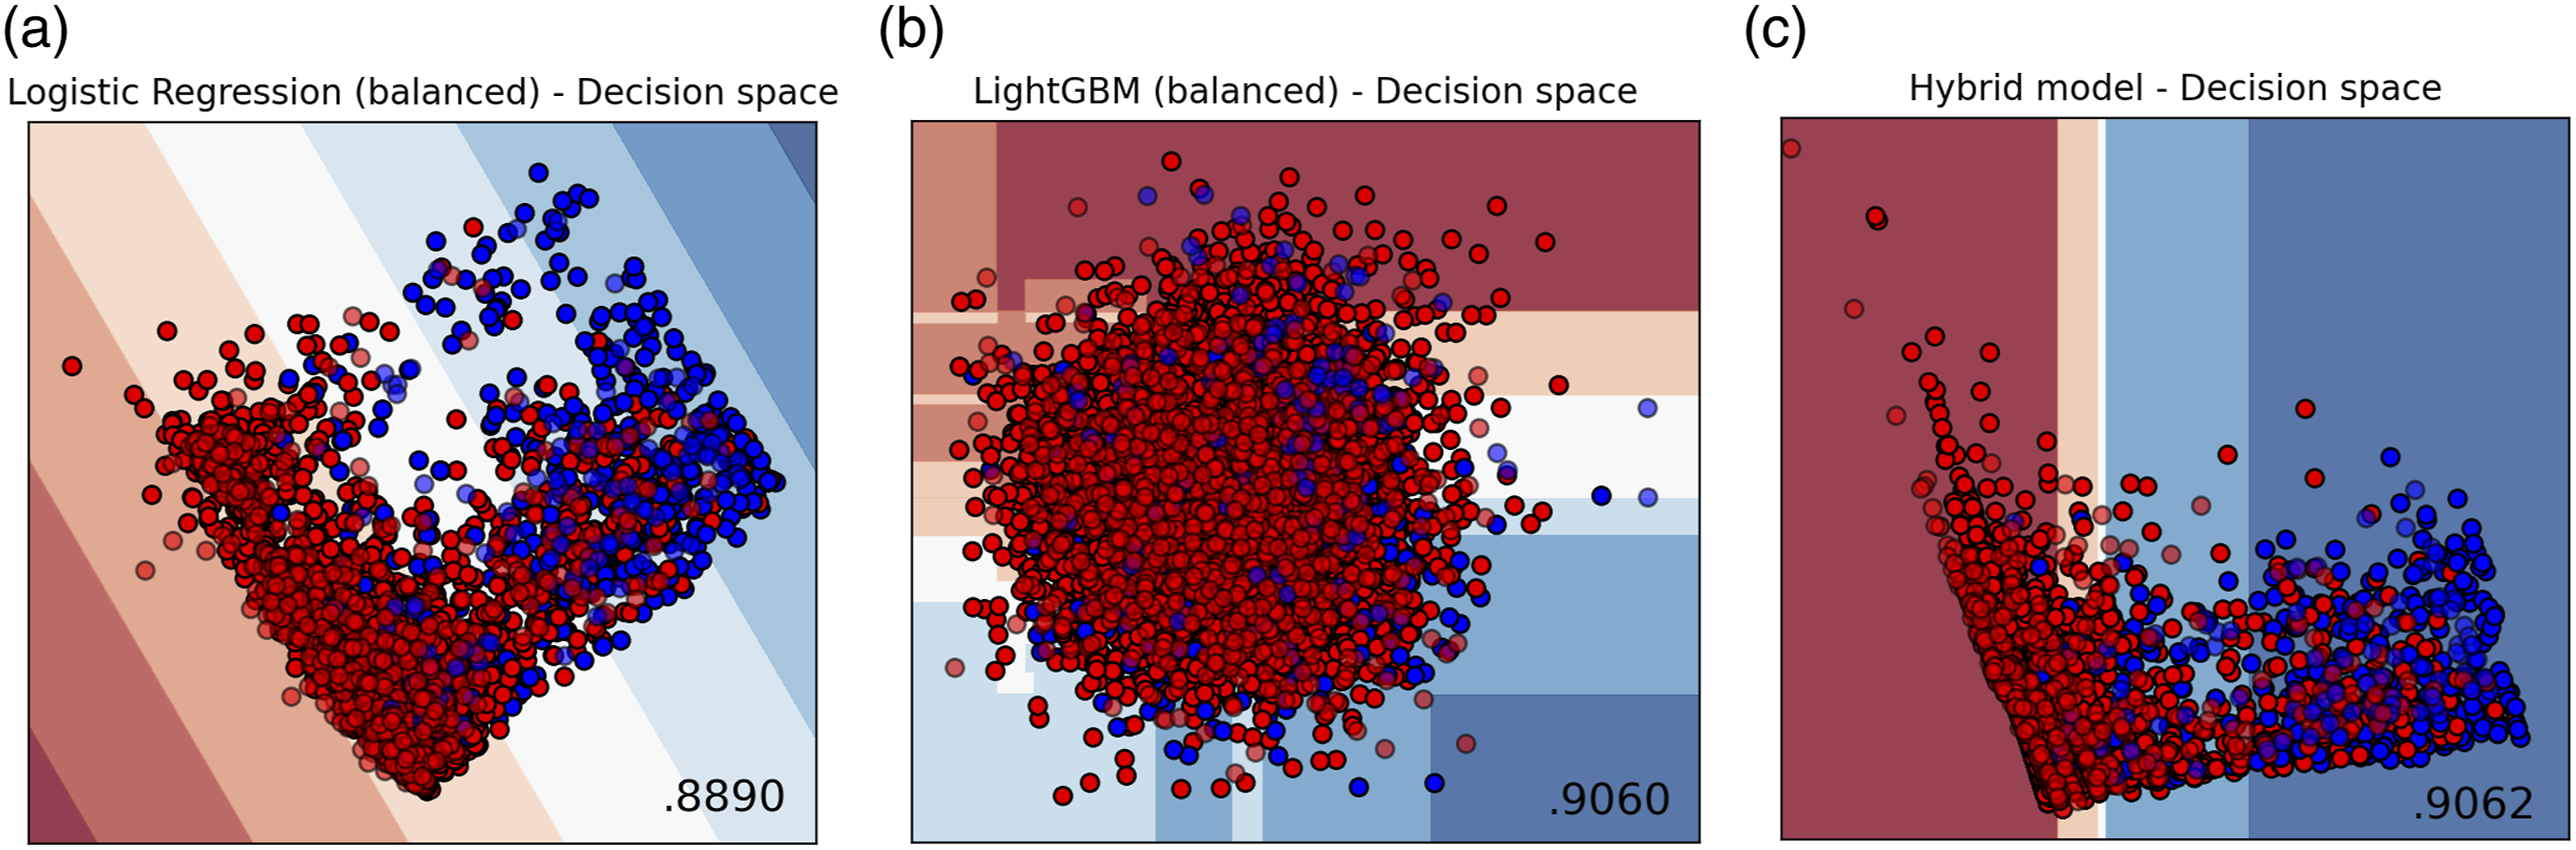
Discussion
Discussion on fitted models
This study commenced by identifying the problem of accurate early diagnosis of asthma at affordable costs. It was crucial to avoid misdiagnosis due to its potential consequences. Hence, it became evident that a precise methodology was needed to predict asthma. As a resolution, a group of ML and statistical classifiers, along with a web application, were developed for asthma prediction.
In this paper, a total of 23 ML models were utilized to predict asthma among adults in Sri Lanka, employing a representative database collected through digital means. Different sampling techniques were employed to enhance the ML models’ performance. Thirteen models were tested on under-sampled data, while ten were tested on imbalanced data. The study found that ML models trained on imbalanced data with class weights performed better in predicting asthma compared to those trained on under-sampled data. These classifiers include Logistic Regression, SVM, Decision Tree, Random Forest, Naïve Bayes, KNN, Gradient Boost, XGBoost, AdaBoost, CatBoost, LightGBM, MLP, and PNN.
To determine the best model, two evaluation metrics were utilized: recall (sensitivity) and AUC. Given the low prevalence of asthma, high accuracy alone is not sufficient since correctly identifying individuals with asthma is crucial. Therefore, recall was prioritized as the primary measure to evaluate all models. Subsequently, AUC was used to assess overall model performance. This approach facilitated accounting for variations in dataset balance, including both balanced and imbalanced datasets.
Following this evaluation approach, the balanced LightGBM model emerged as the top-performing individual model, with a recall of 78.11% and an AUC of 0.9060. The second-best individual model was the balanced Logistic Regression model, with a recall of 77.35% and an AUC of 0.8890.
To further enhance model performance, a Hybrid approach was adopted. This involved using the balanced Logistic Regression model to identify the most significant features, leveraging its interpretability and effectiveness in feature selection. These selected features were then used to fit the balanced LightGBM model, combining the strengths of both models. This Hybrid model approach enabled leveraging the recall and AUC benefits of the LightGBM model while ensuring the best set of features of the Logistic Regression model were used for prediction. This resulted in the highest level of accuracy and reliability in identifying asthma cases.
This hybrid model utilized wheez, brthless_wheez, wheez_cold, awaken_chest_tightness, dyspnea_strenuous_act, awaken_cough, nasal_allergy, passivesmoke, MET_PA, ethnicity, and sector as input variables. These are six asthma symptom variables (wheeze, breathlessness with wheeze, wheeze in the absence of a cold, awaking with chest tightness or cough, and shortness of breath with strenuous activity), two risk factors (nasal allergies and passive smoking), two demographic factors (ethnicity and sector of residence), and one behavioural factor (total physical activity).
The Hybrid model reported an accuracy of 90.15%, indicating that the proportion of those correctly categorized by the model is 90.15%. Since the Hybrid model recorded a 79.85% sensitivity, it can correctly identify actual asthma patients with a probability of 79.85%. A specificity of 91.18% indicates that the model can accurately identify non-asthmatics with a probability of 91.18%. The AUC of 0.9062 of the model suggests that the likelihood of correctly distinguishing an asthmatic from a non-asthmatic is 90.62%.
Model deployment
The ultimate solution integrated into this research is a Flask app where users can answer a specified set of questions and obtain a prediction of having asthma. Once the app is launched, users can view the front-end question set. As users provide answers to the questionnaire presented, their responses are fed into the developed model as features to generate the prediction outcome. Figure 6 provides the complete questionnaire. Front-end questionnaire for data entry by users of the Flask app.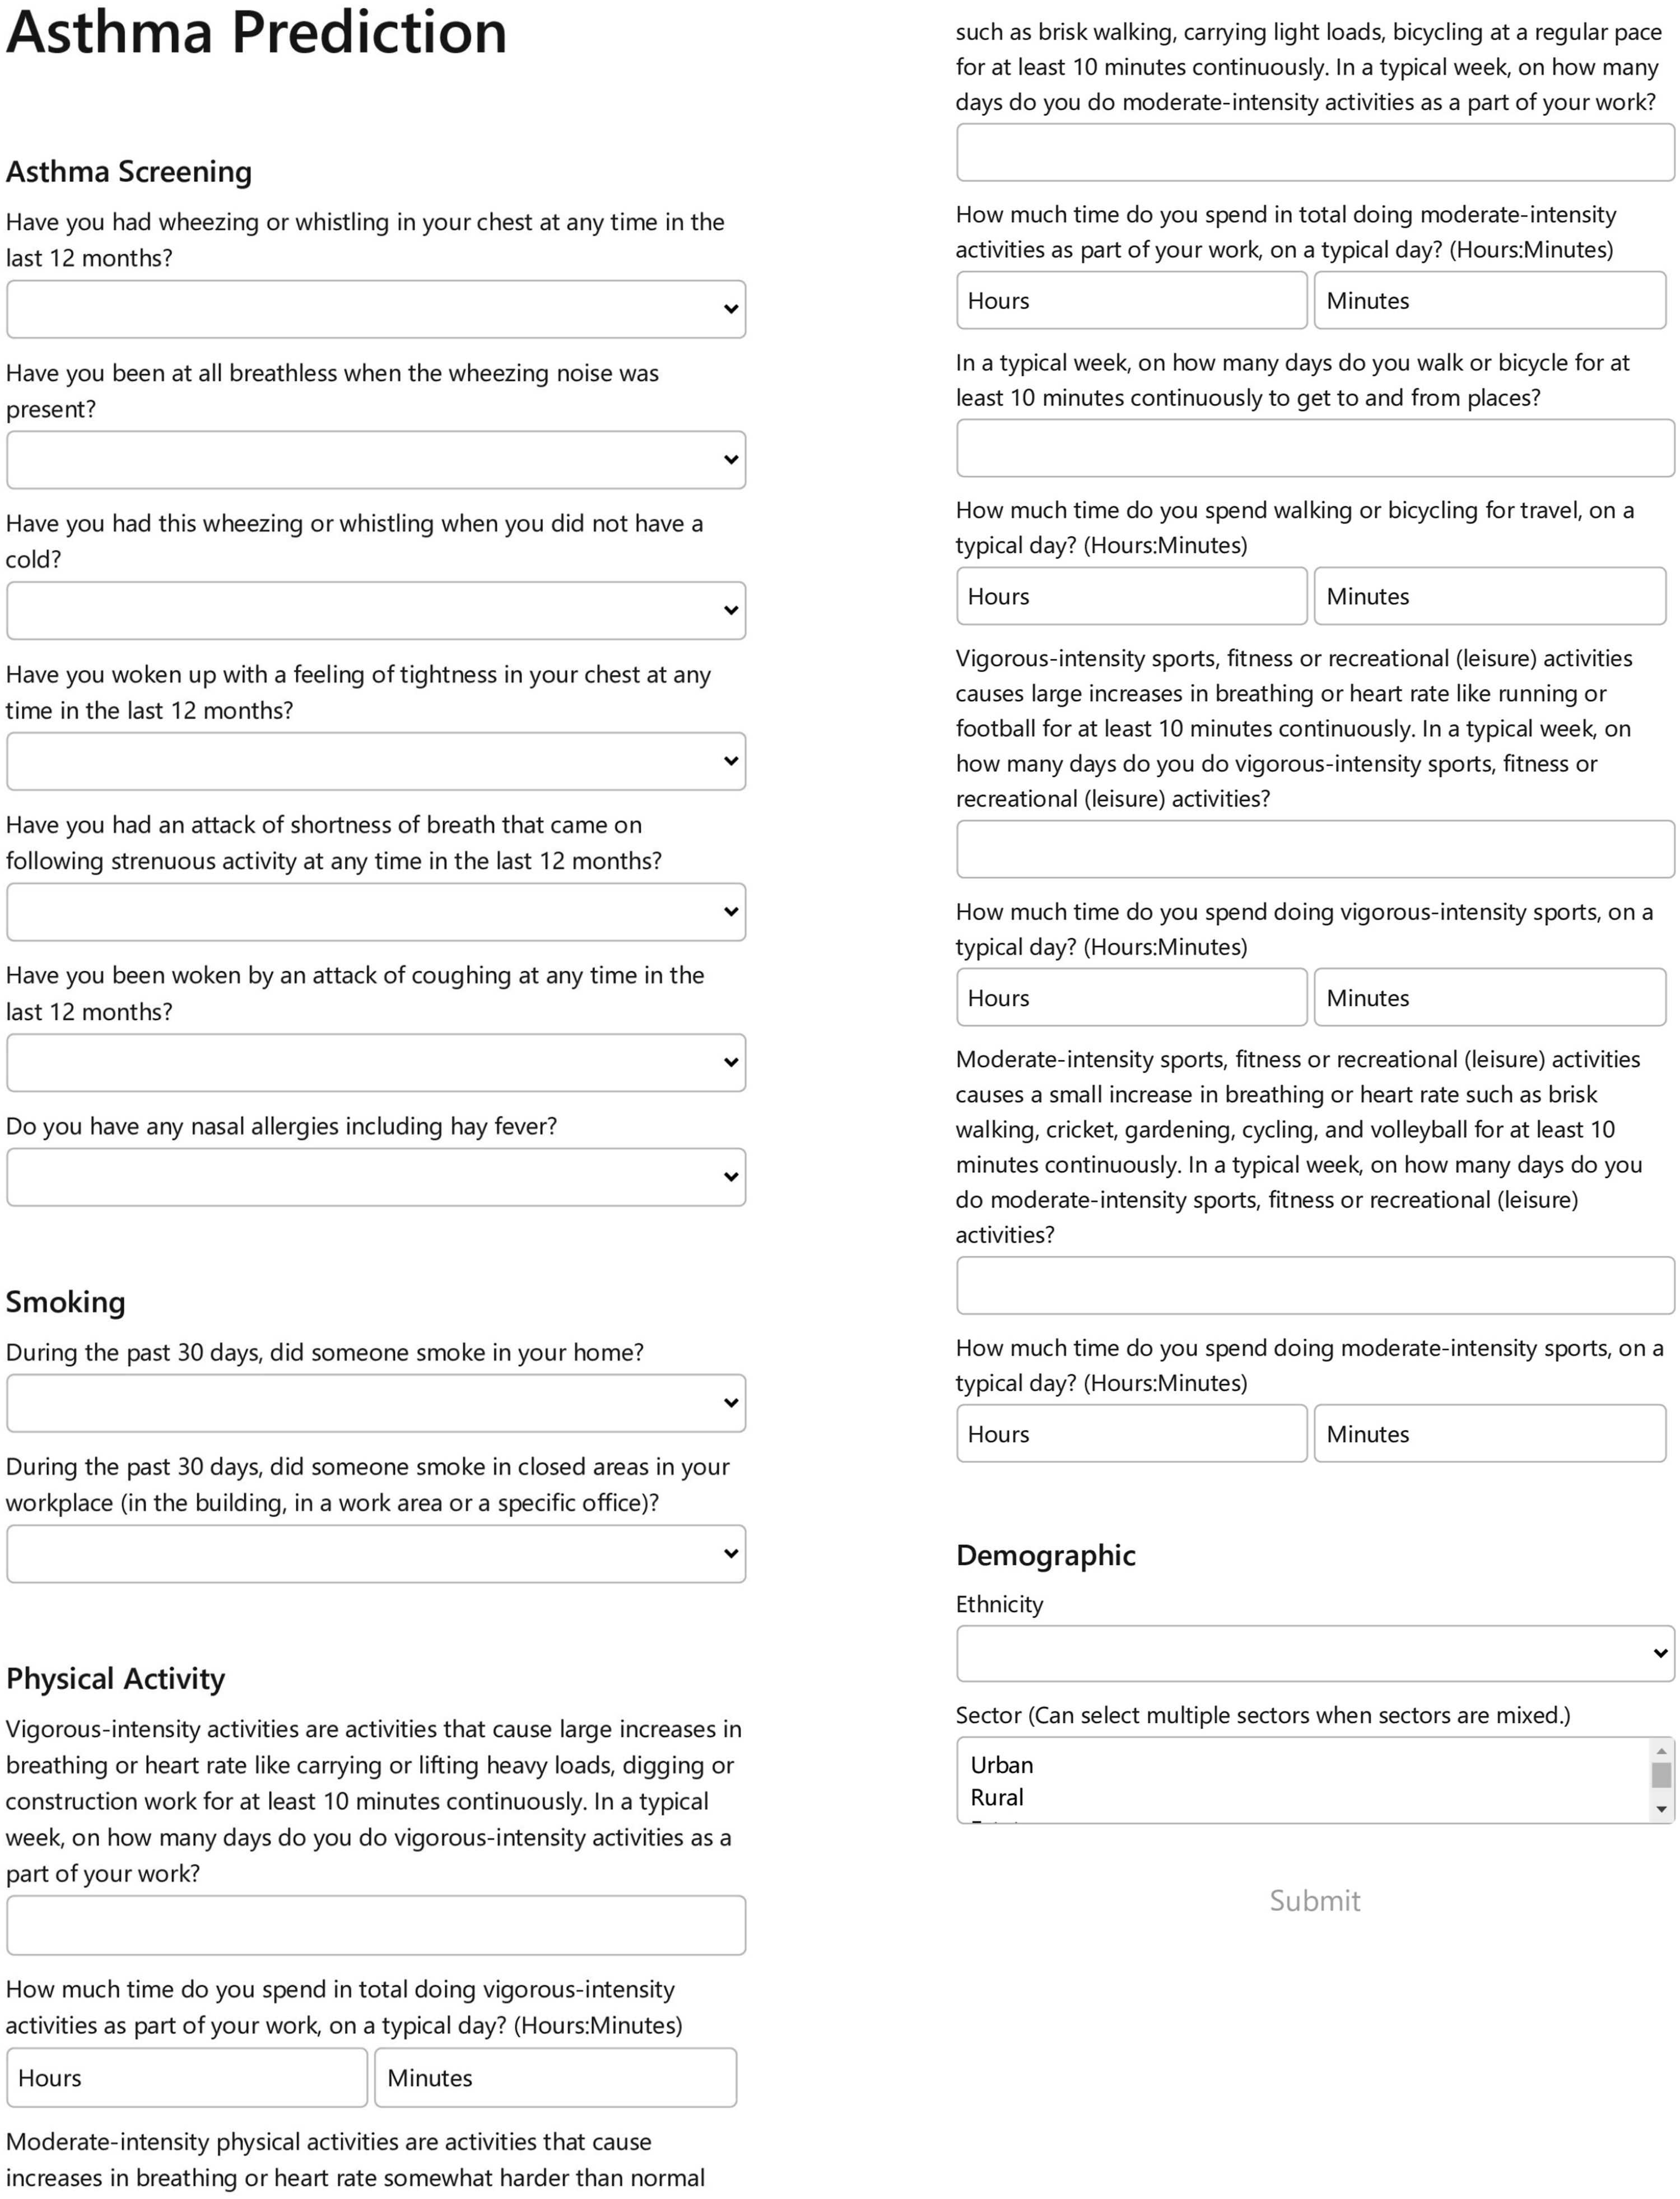
After all fields in the questionnaire are successfully filled, the user clicks the “submit” button and is shown the prediction result. The values inputted by the user are extracted and fetched to the hybrid model, which is saved as a Pickle object, to perform calculations and provide the output. A positive prediction is indicated by displaying the result in red, while a negative prediction is shown in green (Figure 7). Additionally, for greater transparency, the AUC and predicted probability are presented to the users with a brief description. Prediction outcome of the Flask app.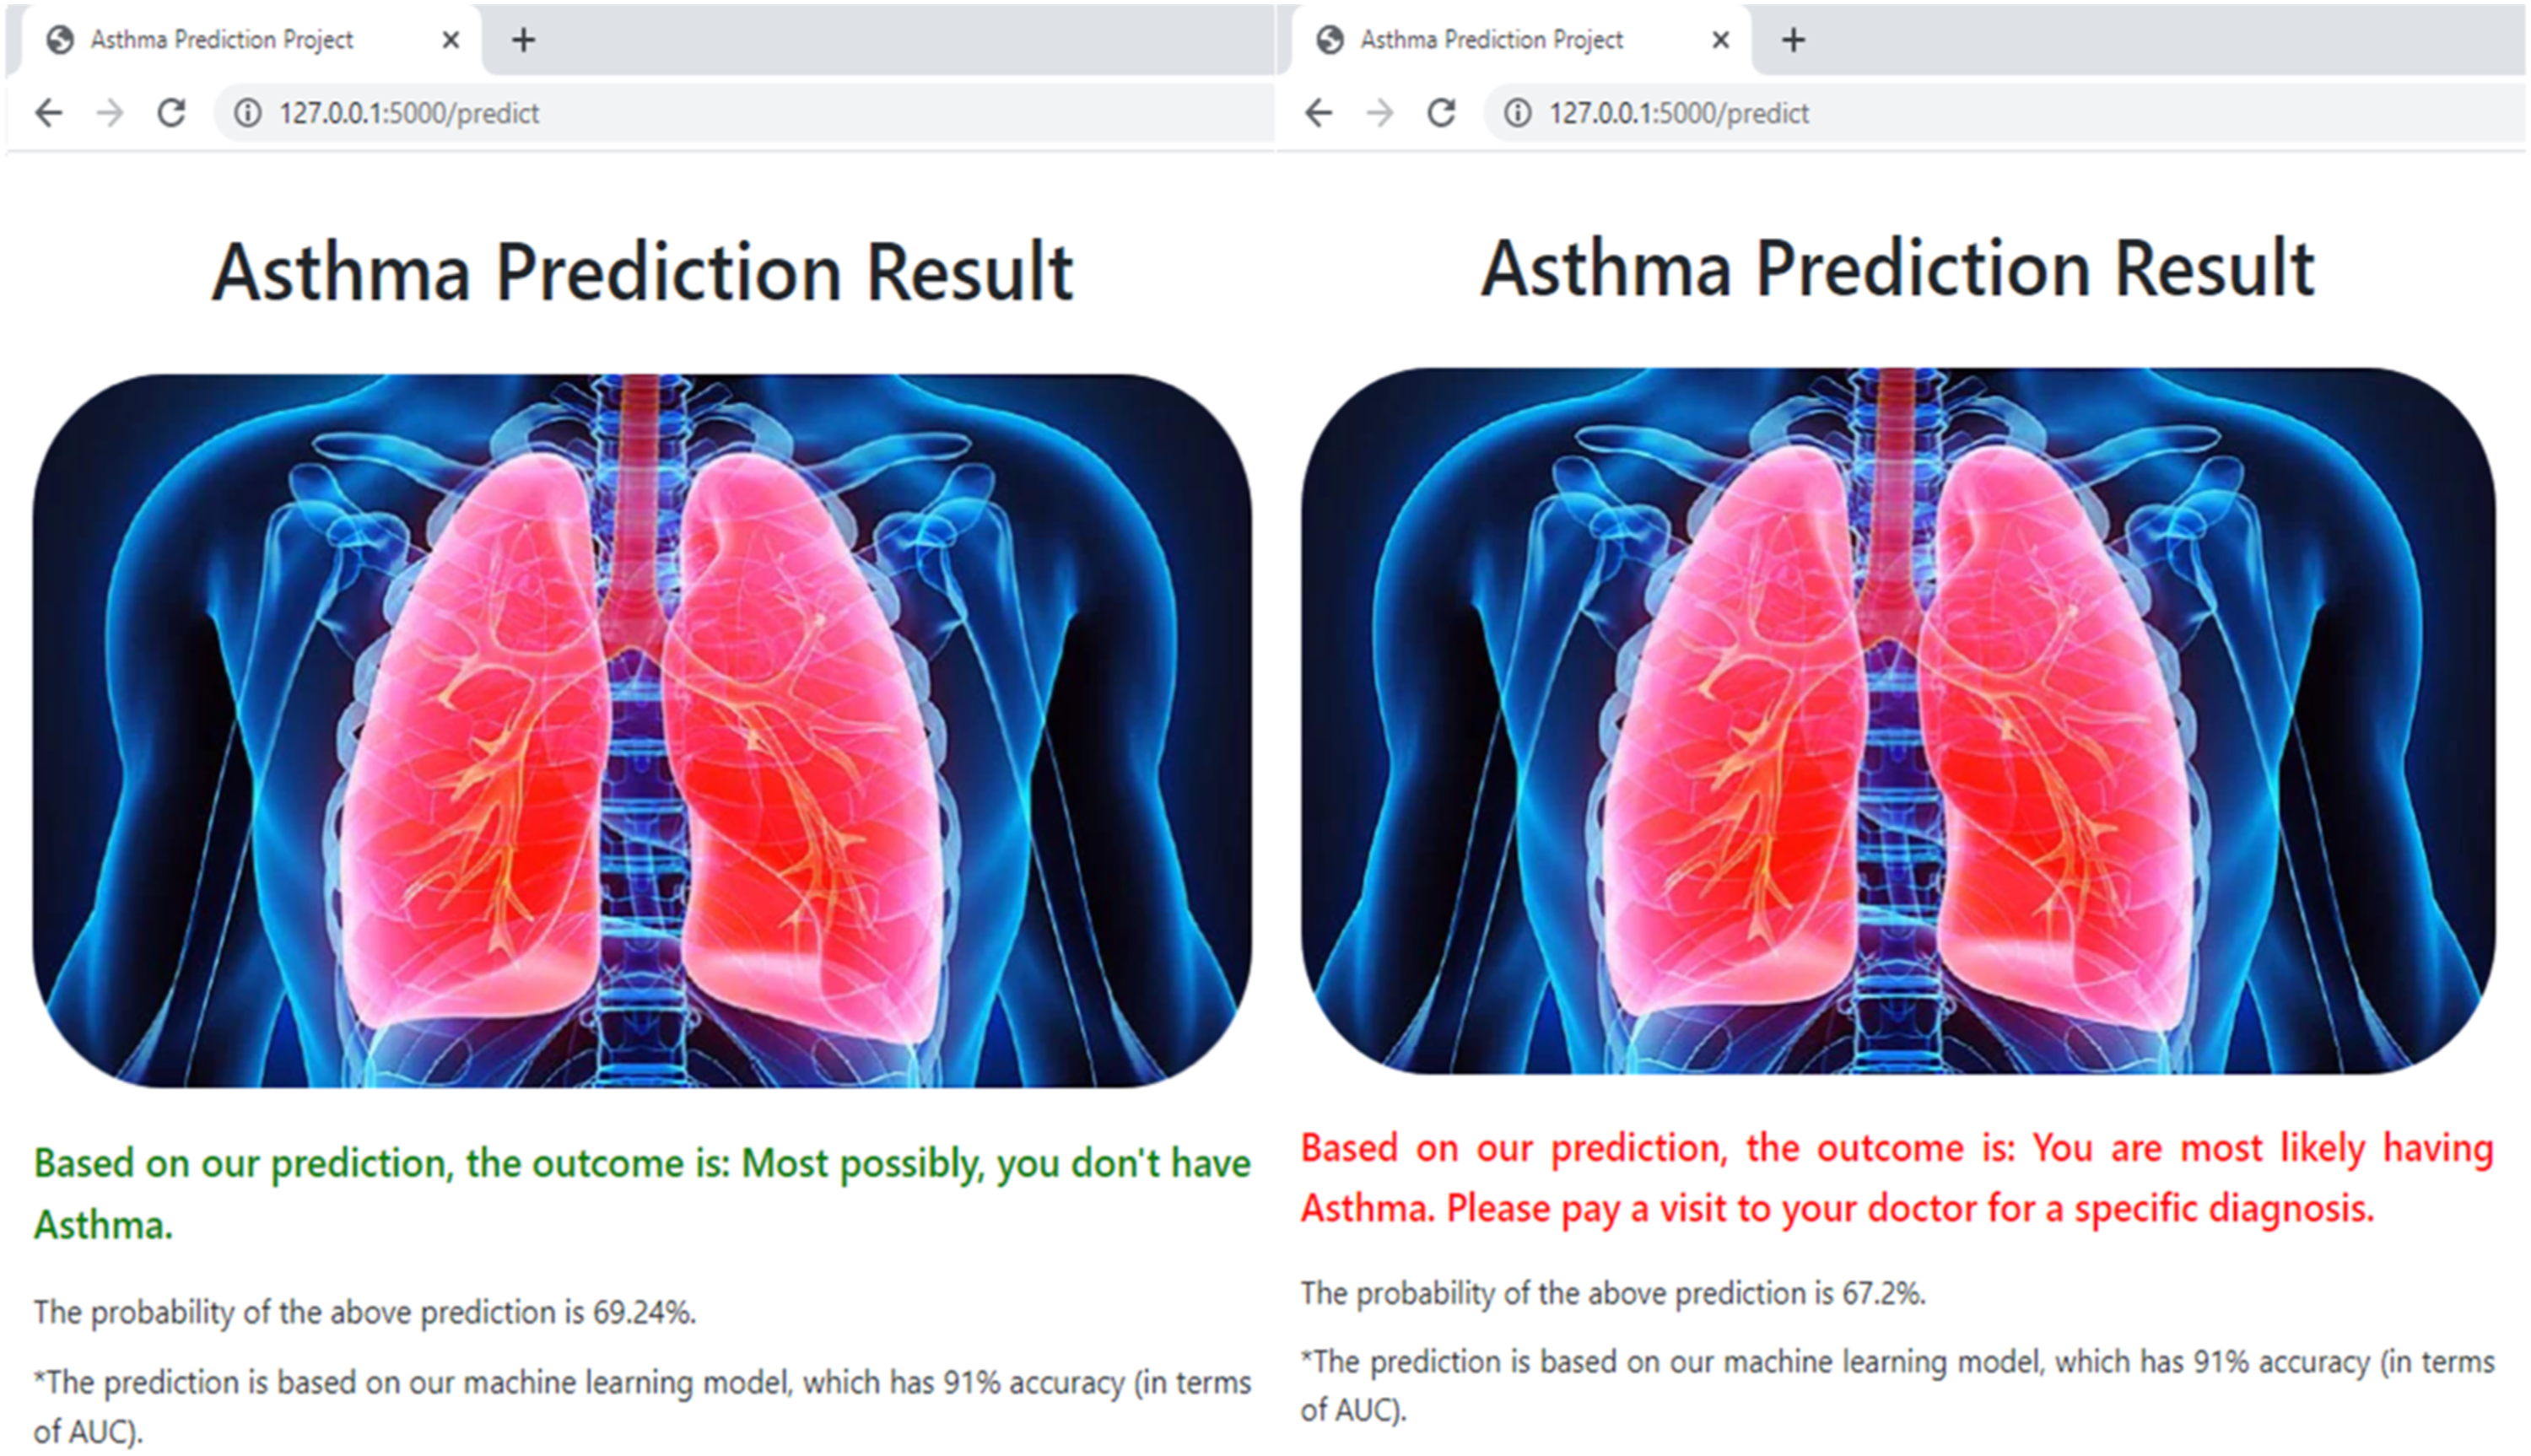
Strengths
This research uses data from a nationally representative adult health survey, enabling a robust analysis of various factors impacting asthma. By examining multiple variables such as respiratory symptoms, behavioural risk factors, and demographic details, the study offers a comprehensive understanding of the disease rather than focusing solely on isolated factors. This approach enhances the local validity of the study results, facilitating informed decision-making.
The study differentiates itself by evaluating a large number of ML models (thirteen) on under-sampled and imbalanced data to find the best predictor for asthma outcomes. A rigorous evaluation was undertaken, utilizing a variety of ML and statistical models to enhance predictive accuracy.
Unlike previous studies that often relied on biochemical findings or lung function,16–18,20,69–72 this study prioritizes variables that do not require laboratory or lung function testing. This is important for several reasons. Firstly, it broadens the use of ML-based apps to settings with limited resources. Sri Lanka, like other low- and middle-income countries, has limited resources for testing. The recent economic crisis in Sri Lanka has further strained the health system, leading senior clinicians to advocate for greater reliance on “clinical judgment” and reduced dependence on laboratory investigations. 73 Our web application can supplement such clinical judgment as a low-cost tool that relies on self-reported symptoms and background characteristics and potentially triages patients for further investigation.
Secondly, by excluding spirometry data and anthropometric measurements in the final model, the study enhances self-detection by individuals in the community. The application allows individuals to actively participate in the prediction process by easily inputting their data and receiving personalized prediction outcomes. With an intuitive interface and easy-to-navigate forms, the application encourages users to interact with the tool, promoting proactive asthma management.
With ever-increasing access to the internet and the ready availability of mobile phone devices, such a web-based application is becoming increasingly accessible to the general public in Sri Lanka. For instance, in 2022, 52.6% of Sri Lankans had internet access and there were 1.5 mobile connections per person on average, indicating a high penetration of mobile devices. 31 In low- and middle-income countries, as many as 70% of the population were mobile users 32 and 55% had internet access in 2023. 33 This trend demonstrates the rapid growth of connectivity and the potential for digital health interventions in these regions. Furthermore, the individual-centric approach could increase individual awareness, foster engagement, and facilitate health-seeking for asthma, particularly in the Sri Lankan setting, where the prevalence of asthma is likely to be high (estimated at 23%, which is far higher than in other South Asian countries), but diagnosis and treatment rates are likely to be low, due to social stigmas associated with asthma and underdiagnosis by the healthcare system. 7
Sri Lanka boasts over 1,000 Healthy Lifestyle Centres (HLCs) that actively screen for diabetes, hypertension, and cardiovascular disease, 74 reaching approximately 0.5 million adults aged 35 and over annually. 75 These efforts align closely with the WHO Package of Essential Noncommunicable (PEN) Disease Interventions for Primary Health Care, 76 although Sri Lanka focuses predominantly on cardiovascular disease, diabetes, and hypertension. While PEN includes guidelines for treating asthma symptoms, and Sri Lanka has established asthma treatment protocols in primary care, 77 there is no national policy for widespread asthma screening, unlike the systematic screening for cardiovascular disease, hypertension, and diabetes conducted at HLCs. Additionally, Sri Lanka benefits from frequent doctor-patient interactions and a robust public health infrastructure. 78 Public health midwives routinely visit homes with newborns, and public health inspectors conduct various community health initiatives. These existing settings and resources provide opportunities to disseminate information about this app to the public. The app could be promoted at screening centers for individuals to use independently, or even potentially be adapted into existing screening programs at resource-limited primary or secondary facilities by healthcare staff.
Limitations of the study
Using secondary data presented certain limitations, primarily due to the unavailability of crucial explanatory variables and a high rate of missing data on vital variables. Key parameters such as outdoor air pollution, history of allergic diseases beyond nasal allergies and hay fever, family history of allergic diseases, climate conditions, and exposure to pets were absent from the dataset. Additionally, due to a significant proportion of missing values, variables related to occupational exposures (∼53%) and family history of asthma (∼49%) had to be excluded.
Another limitation was the lack of data on children for inclusion in model development. The data was from the SLHAS survey, which focused exclusively on the health and ageing aspects of adults, and did not survey children.
The study encountered challenges related to the computational intensity and lengthy training times required for ML models. Despite achieving high AUC values, prioritizing recall over precision resulted in many models not attaining high precision values. This trade-off between recall and precision represents another limitation of the study.
Furthermore, the predictive model developed in the study has inherent limitations in predicting the outcome of physician-diagnosed asthma. The outcome variable relied on self-reported asthma or medical records/prescriptions related to asthma rather than a predetermined set of diagnostic criteria by a clinician. In some cases, this reliance on participants’ recall of an asthma diagnosis or their medical records may have led to misclassification. Nonetheless, the model predicts the outcome variable of physician-diagnosed asthma based on participants’ reports or medical records.
Suggestions for future work
In future iterations, enhancing the best-fitted model could involve incorporating variables that were unavailable in the current study. Additionally, a variation could explore the integration of biomarkers and clinical measurements into the model, specifically for clinical settings.
Another avenue for improvement lies in integrating wearable sensor data from devices such as IoT devices or wearable sensors. This data could capture real-time physical activity levels, environmental exposures, and climate data, thereby enriching the model’s accuracy and predictive capabilities.
It is recommended that this app be trialed in the community, with user feedback collected from both clinical professionals and the general public on various parameters. Key aspects to evaluate should include ease of use, likelihood of continued use, and user satisfaction. Additionally, it is important to assess the app’s impact on health outcomes, specifically looking at parameters such as an increase in new asthma diagnoses, improved adherence to medication, and overall management of asthma symptoms. Collecting and analyzing this data will provide valuable insights into the app’s effectiveness and areas for further improvement.
While this study explored many single-type ML algorithms, it primarily focused on one mixed ML model, the Hybrid model. Future work could involve comparing this Hybrid model with other mixed models to determine the most effective model in terms of prediction power.
To further enhance the user experience, steps can be taken to make the web application even more user-friendly than its current interface. Additionally, exploring options such as web hosting and the development of a mobile application could increase the accessibility and usability of the tool in future iterations.
Conclusion
A combination of Logistic Regression and LightGBM classifiers (the Hybrid model) demonstrates a 90.62% accuracy rate in predicting asthma, as measured by AUC. The study identifies wheezing or whistling sounds in the chest, breathlessness accompanied by wheezing, attacks of SOB, coughing attacks, chest tightness, nasal allergies, physical activity level, exposure to passive smoking, ethnicity, and sector of residence as the most significant factors associated with asthma. Additionally, the web application provides the opportunity to deploy the model for real-time predictions at home or in clinical settings.
We anticipate that this study will prove valuable to healthcare providers, IT service providers in healthcare, and patients within the Sri Lankan healthcare system. It may encourage possible asthmatics to seek appropriate healthcare, as well as aid in the initial screening of individuals in lower-level healthcare facilities, facilitating further specialist evaluation where necessary.
Supplemental Material
Supplemental Material - Machine learning approaches for asthma disease prediction among adults in Sri Lanka
Supplemental Material for Machine learning approaches for asthma disease prediction among adults in Sri Lanka by JRNA Gunawardana, SD Viswakula, Ravindra P Rannan-Eliya and Nilmini Wijemunig in Health Informatics Journal.
Footnotes
Acknowledgements
The authors thank their colleagues in the SLHAS consortium, consisting of the Institute for Health Policy, University of Colombo, University of Ruhuna and University of Peradeniya, for their input to the design of the survey tools and support of data collection, in particular Dr Renuka Jayatissa (Medical Research Institute) whose staff provided training in anthropometric measurement; colleagues in the Ministry of Health, who facilitated the SLHAS, especially Dr S Sridharan, Deputy Director General (Planning); and Dr Anuji Gamage (Kotelawala Defence University).
Author contributions
The SLHAS survey was conceived, designed, and managed by RRE, NW, and other SLHAS collaborators. JRNAG designed and implemented the framework for the asthma prediction model. This includes data extraction, preprocessing, exploratory data analysis, feature engineering, model fitting, evaluation, and deployment. SDV provided technical advice and supervision for model implementation. JRNAG prepared the manuscript and it was reviewed and improved by NW and SDV. All authors have read and approved the final version of the manuscript.
Declaration of conflicting interests
The author(s) declared no potential conflicts of interest with respect to the research, authorship, and/or publication of this article.
Funding
The author(s) disclosed receipt of the following financial support for the research, authorship, and/or publication of this article: This study was supported by the Swiss Agency for Development Cooperation (SDC) and the Swiss National Science Foundation (SNSF) through the Swiss Programme for Research on Global Issues for Development (r4d programme) by the grant “Inclusive Social Protection for Chronic Health Problems” (Grant number 400640_160374), and the Institute for Health Policy Public Interest Research Fund (Grant number PIRF-2018-02).
Ethical statement
Data availability statement
The data supporting the findings of this study are available from the SLHAS Consortium, but restrictions apply to their availability. These data were used under license for the current study and are not publicly accessible. The SLHAS Consortium, which has implemented an Open Data policy, will grant access to SLHAS Wave 1 data starting in 2024 upon application to the Consortium by interested researchers. The specific data file utilized for this paper can be acquired from the corresponding author upon reasonable request and with permission from the SLHAS Consortium.
Supplemental Material
Supplemental material for this article is available online.
References
Supplementary Material
Please find the following supplemental material available below.
For Open Access articles published under a Creative Commons License, all supplemental material carries the same license as the article it is associated with.
For non-Open Access articles published, all supplemental material carries a non-exclusive license, and permission requests for re-use of supplemental material or any part of supplemental material shall be sent directly to the copyright owner as specified in the copyright notice associated with the article.