
Abstract
Background and significance
Across Australia, one in nine people admitted to hospital will experience an adverse event. 1 Not only do these have an impact on the individual patient but also on the wider health system and resources. An Australian study found the mean incremental impact of the presence of any diagnosis flagged as occurring in hospital was US$9,244 and 5.3 additional hospital days. 2 With this as the premise, a reduction of this harm should be seen as a collective public health priority. To assist in the measurement of harm, a national, recognised set of priority hospital-acquired complications (HACs) have been developed. These priority HACs were widely announced in mid-2016. 3
The application of standards through accreditation programmes is a common mechanism to improve care and provide confidence in the quality of hospitals.1,4 In Australia, evidence of compliance with the National Safety and Quality in Health Service Standards (the ‘National Standards’) is required by hospitals to maintain accreditation status.5,6 The overarching National Standards are (1) Clinical Governance, (2) Partnering with Consumers, (3) Preventing and Controlling Infections, (4) Medication Safety, (5) Comprehensive Care, (6) Communicating for Safety, (7) Blood Management, and (8) Recognising and Responding to Acute Deterioration.
The National Standards provide minimum expectations of clinical systems. As a result, they influence professional practice and reduce the occurrence of unnecessary harm. For example, Standard 4, requires the implementation of practices and processes to reduce medication incidents, such as drug related respiratory depression. As a result, compliance with the National Standards should reduce the occurrence of the HACs they are aligned to. 7
Many attempts at monitoring professional practice and clinical processes exist in the literature, including audit and feedback. 8 A seminal review of randomised control trials on audit and feedback in healthcare settings found that the median absolute improvement was 4.3%. 9 The wide variability associated with this study supported the view that the features and design of an intervention could substantially impact its effectiveness.10–13
The aim of this study is to assess the impact and effectiveness of a novel electronic audit and feedback (e-A&F) system, implemented in mid-2018, on improving the professional practice and clinical processes associated with the National Standards. To meet this aim, we evaluated the change in the rates of adverse outcomes (HACs) pre- and post- implementation the e-A&F system.
Methods
Study design
A protocol detailing our study methods has been published previously. 14 Briefly, we used a segmented regression analysis of interrupted time series, a quasi-experimental approach, to assess the change of HACs pre- and post-implementation of the e-A&F system. This study was undertaken at a 600-bed tertiary teaching hospital, staffed by approximately 5,500 clinical and non-clinical personnel, which is one of the largest hospital’s in Western Australia in which the novel e-A&F was implemented.
Study inclusion and exclusion criteria
The hospital is representative of a typical tertiary Australian hospital. 15 All overnight inpatient episodes to the hospital were included for the initial period without any intervention (Period 1, July 2014 to July 2016), the period after announcement of priority HACs (Period 2, July 2016 to July 2018), and the period after the implementation of the e-A&F system (Period 3, July 2018 to January 2021).
Intervention
In mid-2018, a Western Australian (WA) tertiary hospital implemented an e-A&F system known locally as Consumer-Engaged National Standards Audits (CENSAs). CENSAs offers healthcare providers and management personnel with near real-time feedback via web-based dashboards. Data are entered at the bedside on mobile devices by trained auditors. Data are securely stored to the hospital data warehouse. To ensure reliability and trust in the data the system utilises automated data validation processes, and committee and governance monitoring and oversight. To ensure inter-auditor consistency, as part of the implementation, a series of in-person educational sessions were provided. These sessions focused on standardising the approach to the response to audit questions. To ensure ongoing inter-auditor consistency, the training session content and a quick-reference guide (Appendix 1 - CENSAs Quick Reference Guide) were made available on the local intranet for staff to be able to access on-demand. Demonstration audit tools were also made available for staff for the training purposes, prior to live data collection.
These dashboards are hosted on the local intranet and built using the business intelligence tool Tableau© (Seattle, Washington). The dashboards, which are refreshed daily, provide feedback for each ward and work area in the form of quality indicators aligned to the eight overarching National Standards (see Figure 1 for Standard 4 dashboard). Individual user log data have been collected for the dashboards, including professional group and hospital area of employment. Evidence from user log data supports that clinicians have had ongoing engagement with this aspect of the e-A&F system. A 6-month snapshot to January-2021 indicated 1,837 separate instances of staff accessing the dashboards. An example of CENSAs dashboard standard 4 - medication safety.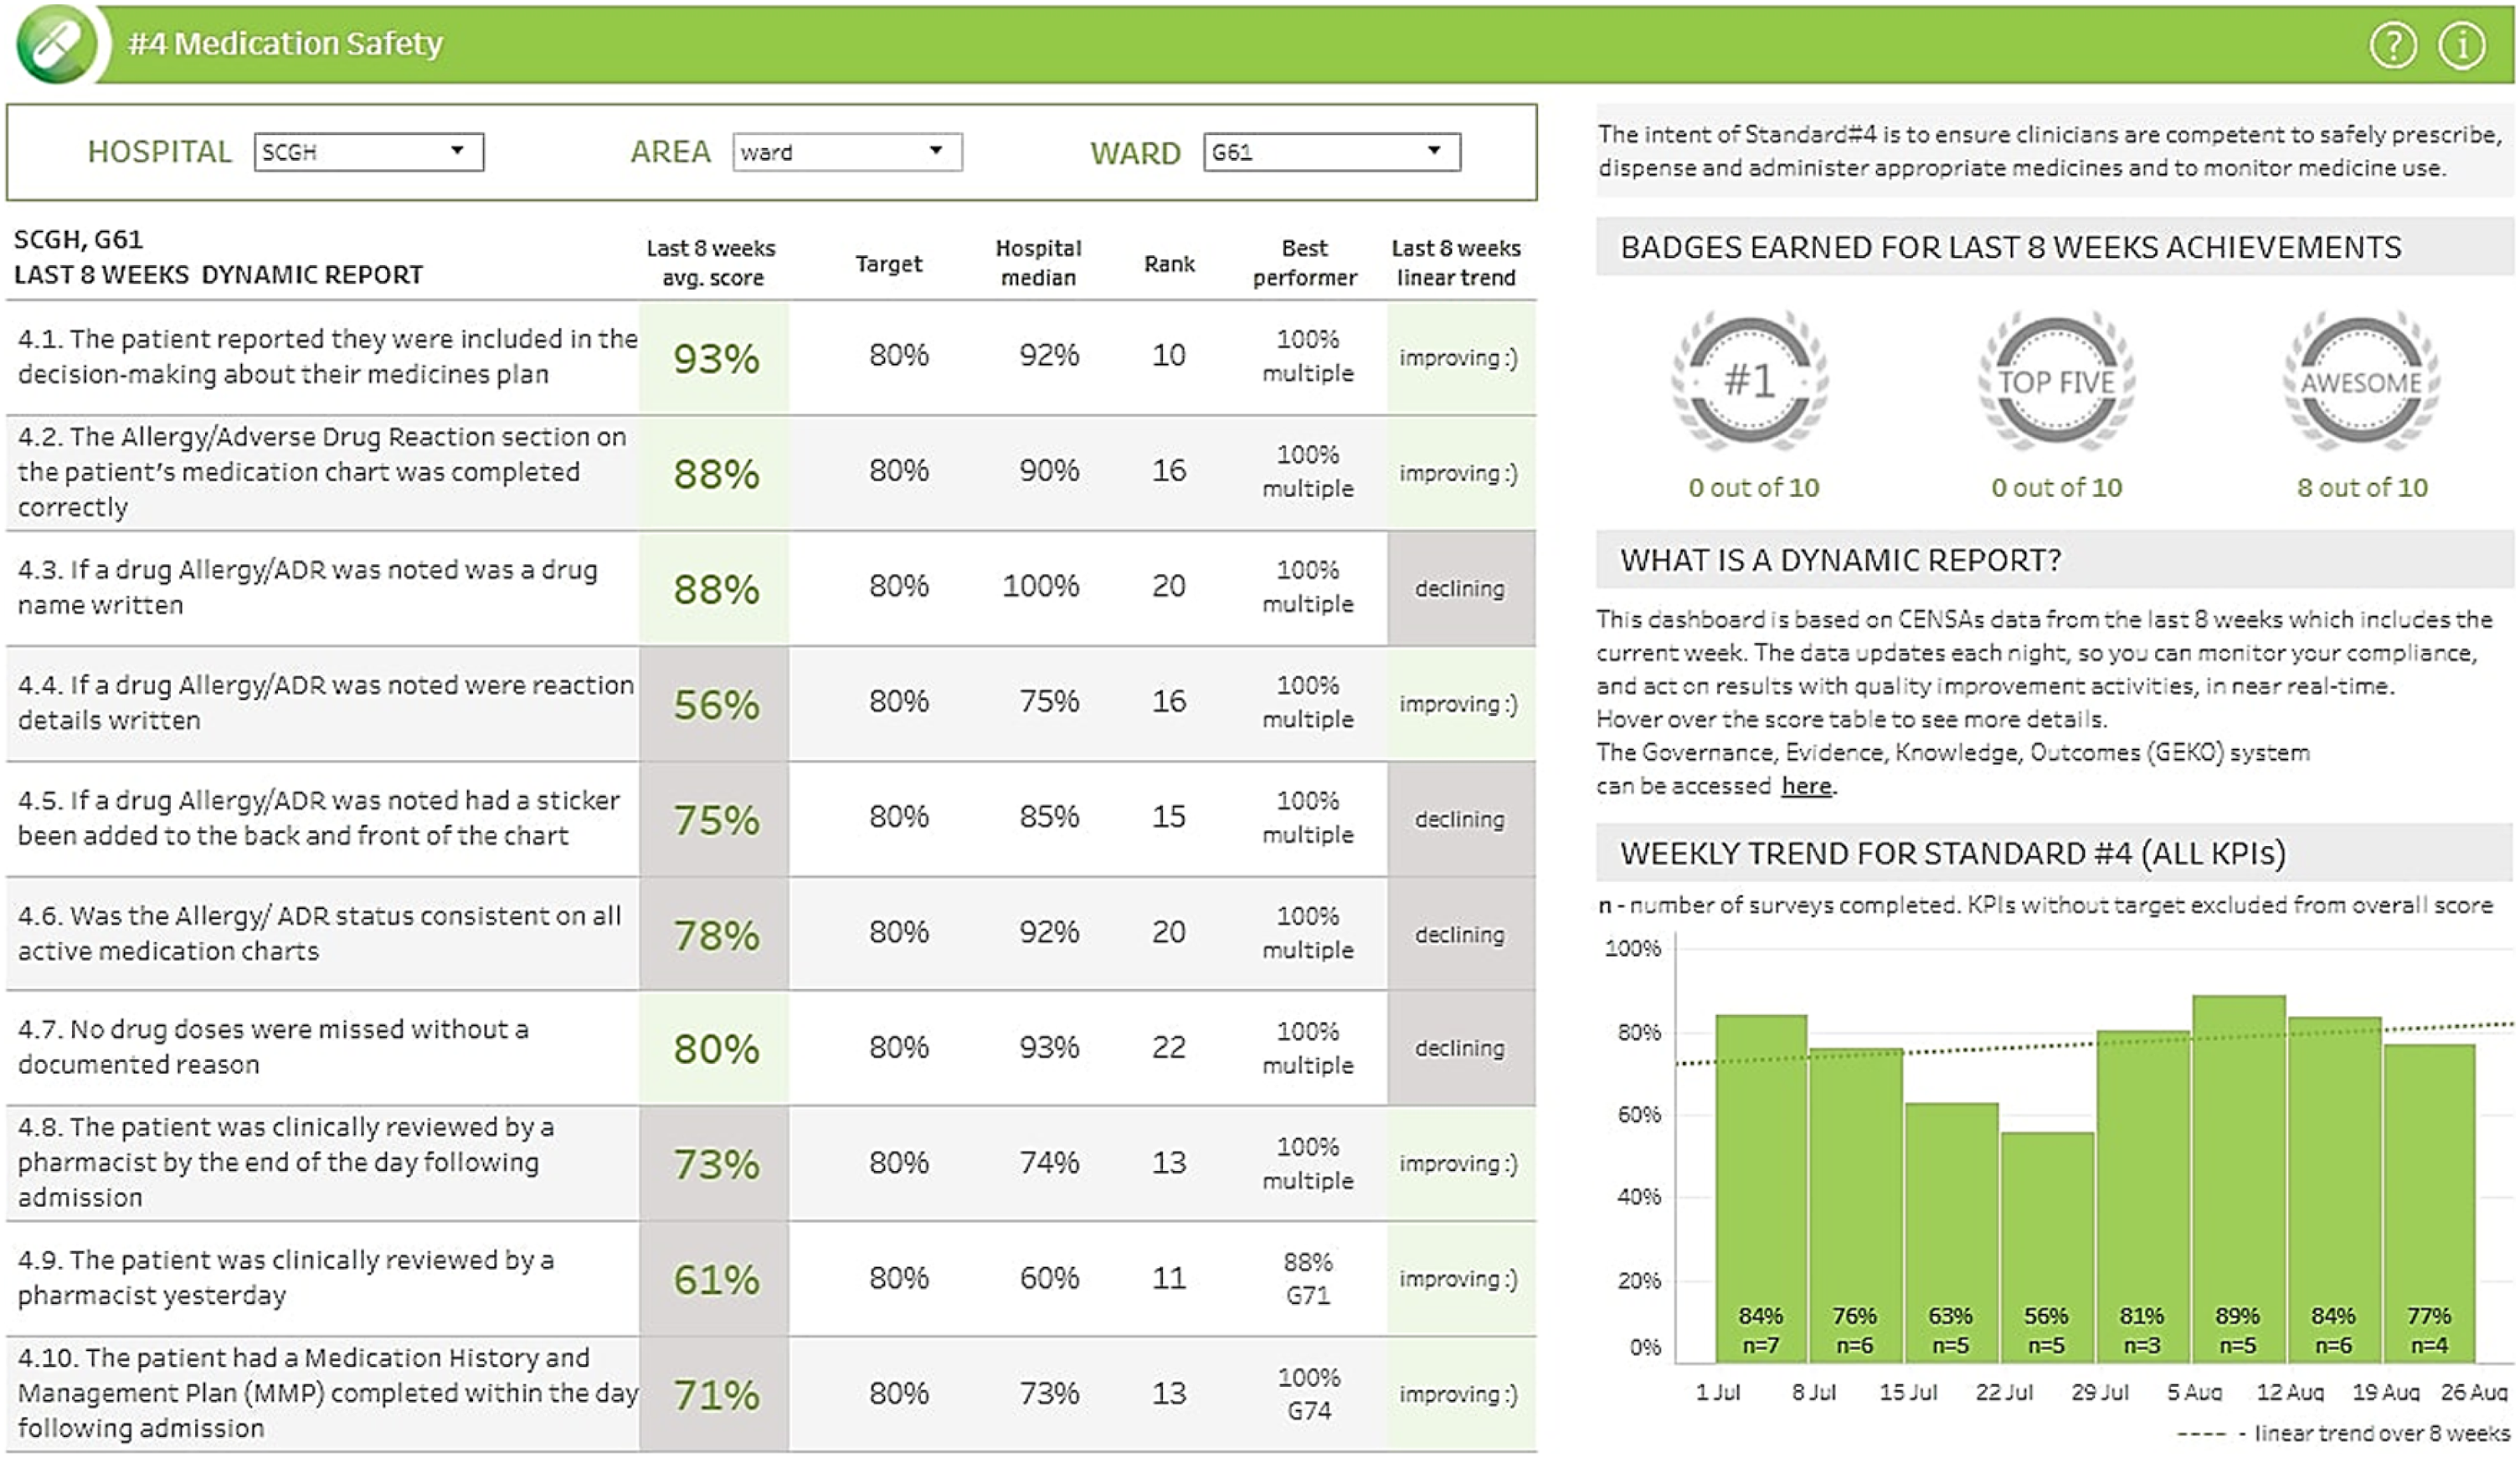
An initial process of piloting was undertaken on three surgical and three medical wards with improvements identified incorporated. Following this, hospital-wide data collection and reporting tools were launched in mid-2018. The quality indicators collected and reported by CENSAs were identified during a development process with input from local clinicians. Priority was given to quality indicators that maximised clinical impact and relevancy, monitoring feasibility, and feasibility to action non-compliance. Quality indicators were designed so that only patients at risk of the condition being examined were included in the denominator.
Data sources
The local inpatient administrative dataset, which contributes to the statutory WA Hospital Morbidity Data Collection (HMDC), and collects all public and private hospital separations in WA, was utilised. 16 Data fields utilised included age, sex, ethnicity, funding source (public or private), admission and discharge dates, admission type (elective or emergency), category of care, principal admitting and existing comorbidity diagnosis codes, procedure codes, external cause codes, unplanned return to theatre flags, and condition onset flags. Condition onset flags were used to distinguish pre-existing conditions from those arising during hospitalisation. 17
Outcomes
All 13 HACs applicable to the study site were identified using nationally-agreed specifications from the International Classification of Disease – Tenth Revision – Australian Modification (ICD-10-AM) codes (see Appendix 2 - Hospital-Acquired Complication Diagnosis List).18,19 These were (1) pressure injuries (2) falls resulting in fractures or intracranial injuries (3) healthcare-associated infections (4) surgical complications requiring unplanned return to theatre (5) respiratory complications (6) venous thromboembolism (7) renal failure (8) gastrointestinal bleeding (9) medication complications (10) delirium (11) persistent incontinence (12) malnutrition and (13) cardiac complications. Only HACs specific to obstetric clinical care, which is not provided at the study site, were excluded. These were ‘Third and fourth degree perineal laceration during delivery’ and ‘Neonatal birth trauma’. An additional overall ‘combined’ group was calculated for episodes with one or more HACs.
Statistical analysis
HAC outcomes were evaluated as monthly count data to which a Poisson model was applied to perform for segmental regression analysis. The regression model was developed as per an approach utilised previously in the literature for two interventions.
20
We denote Y as the outcome measure at time t; T is a continuous variable (Period 1 slope) counting the number of periods at time t from the start of the study period; p are variables (Period 2 and 3 levels) for time t occurring before (p = 0) or after (p = 1) the respective interventions; D are continuous variables (Period 2 and 3 slopes) counting the number of periods from the start of the intervention at time t, until the time before the next intervention D = 0; Ft is the total episodes in time t applied as an offset.
20

The 13 HAC outcomes and the combined outcome were modelled separately. Time-series plots were used initially to explore trends in outcomes over time. 21 Results were expressed as counts and predicted means with 95% confidence intervals and presented graphically as time series charts. Slope and level changes for each period were calculated as risk ratios (RR) and presented as forest plots. This equated to a total of 70 individual coefficients. Excluding the combined outcome this equated to 65 individual coefficients. All analyses were conducted using SAS V.9.4 (Cary, North Carolina).
Sample size
A convenience sample was utilised, with all records meeting the inclusion/exclusion criteria included in the analysis. In the pre- and post- analysis, the HAC outcomes were expressed monthly across nearly 7 years (79 monthly time points in total). While there are no fixed recommendations for the number of time-points required for segmental regression analysis, as power is dependent on factors such as data variability and presence of confounding effects, some studies have suggested 40–50 time points as a guide.22,23 In addition, 100 observations per time-points has been suggested as being able to improve the stability of the model. From 2014 to 2021 there were 222,792 episodes and 18,969 HAC endpoints. Therefore, the sample size exceeded the guidelines for the analysis approach.21,24
Results
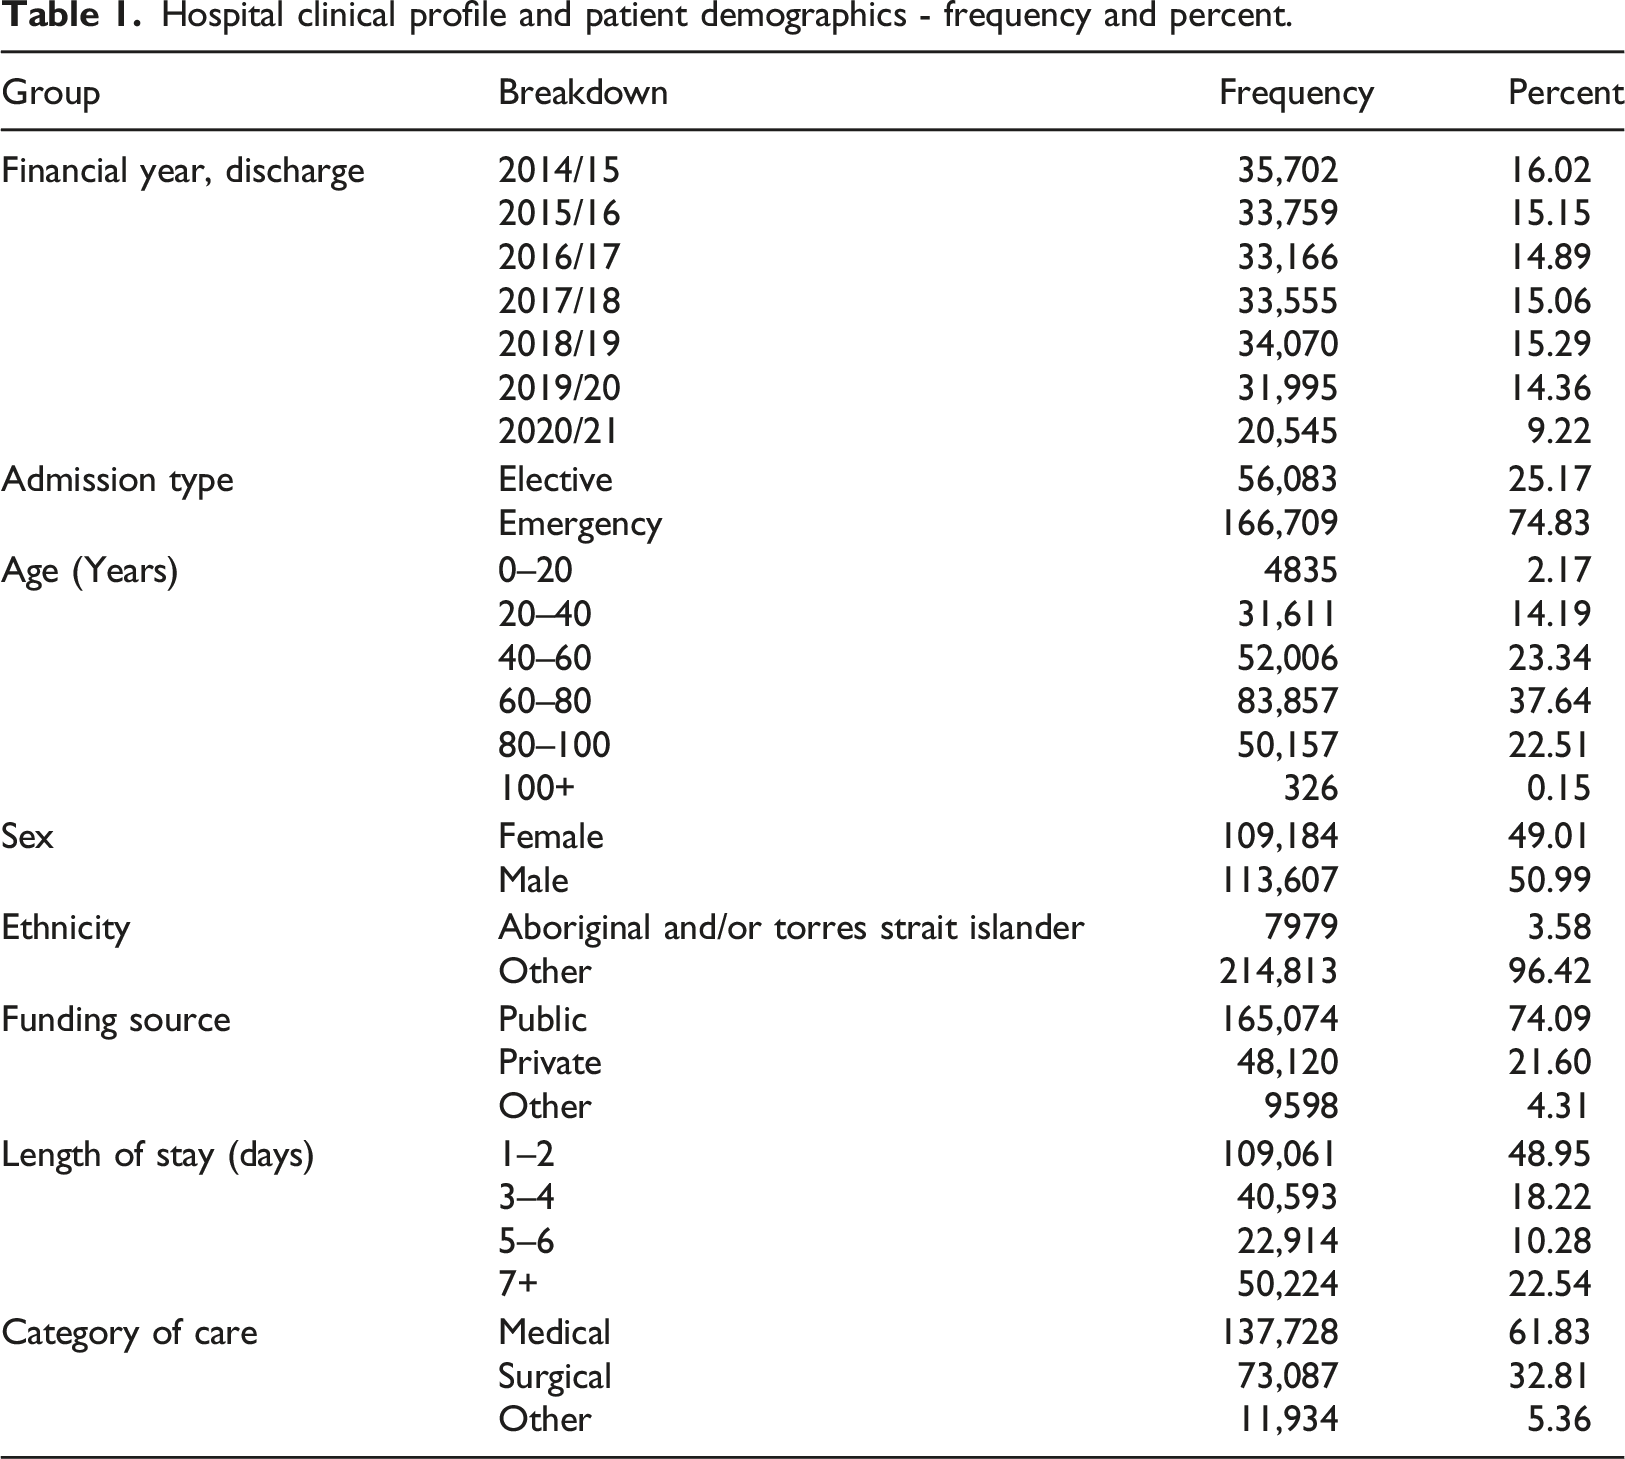
Hospital clinical profile and patient demographics - frequency and percent.
Breakdown of individual hospital-acquired complication (HAC) outcome groups - frequency and percent.
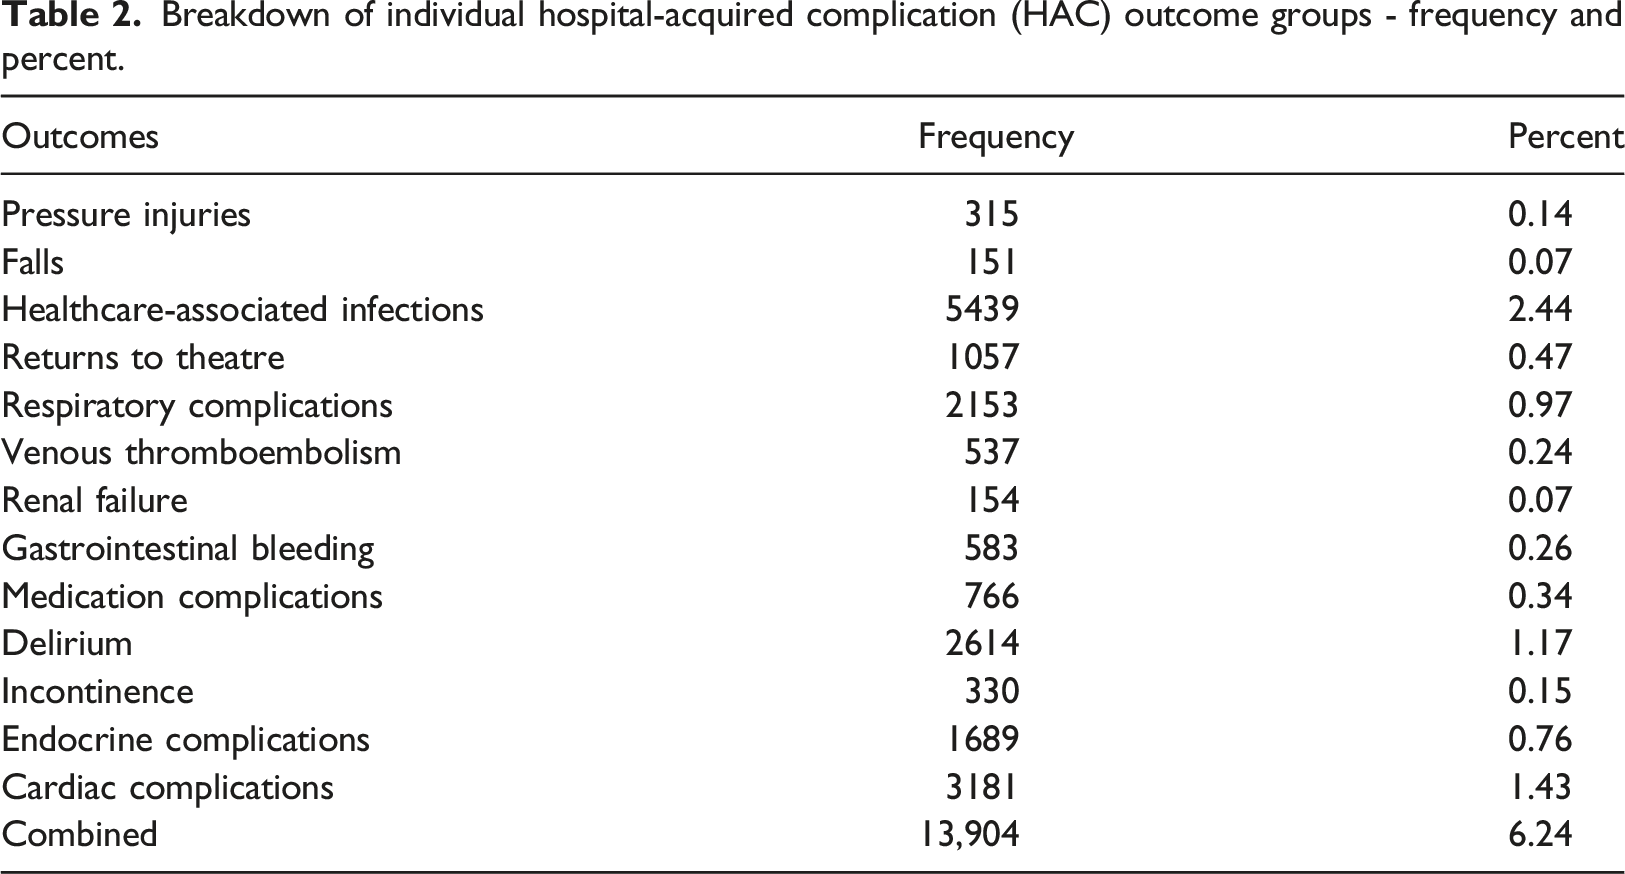
Figure 2 presents the observed time-series for the combined HAC outcome with the fitted pre- and post-intervention trends. The risk for an individual patient of any HAC at the commencement of the study period (Period 1) was 7.00%. Over the course of the period, or the slope, this risk increased by 0.84% each month (RR = 1.008, 95% CI [1.005, 1.012], p < .001). The outset, or level change, of the next period, Period 2, when the national priority list of HACs were announced was associated with an immediate non-significant increase of 5.02% (RR = 1.050, 95% CI [0.972, 1.135], p = .216). The course of the period was associated with a substantial decreasing trend of 1.82% (RR = 0.982, 95% CI [0.9778, 0.986], p < .001) each month. Finally, the implementation of the e-A&F intervention was associated with an immediate significant decrease of 23.00% (RR = 0.770, 95% CI [0.707, 0.840], p < .001), followed by gradual decrease month-on-month of 0.35% (RR = 0.997, 95% CI [0.993, 1.000, p = .033). Time-series figures for each of the 13 HACs are shown in Appendix 3. Interrupted time series of combined hospital-acquired complications, July 2014 to January 2021.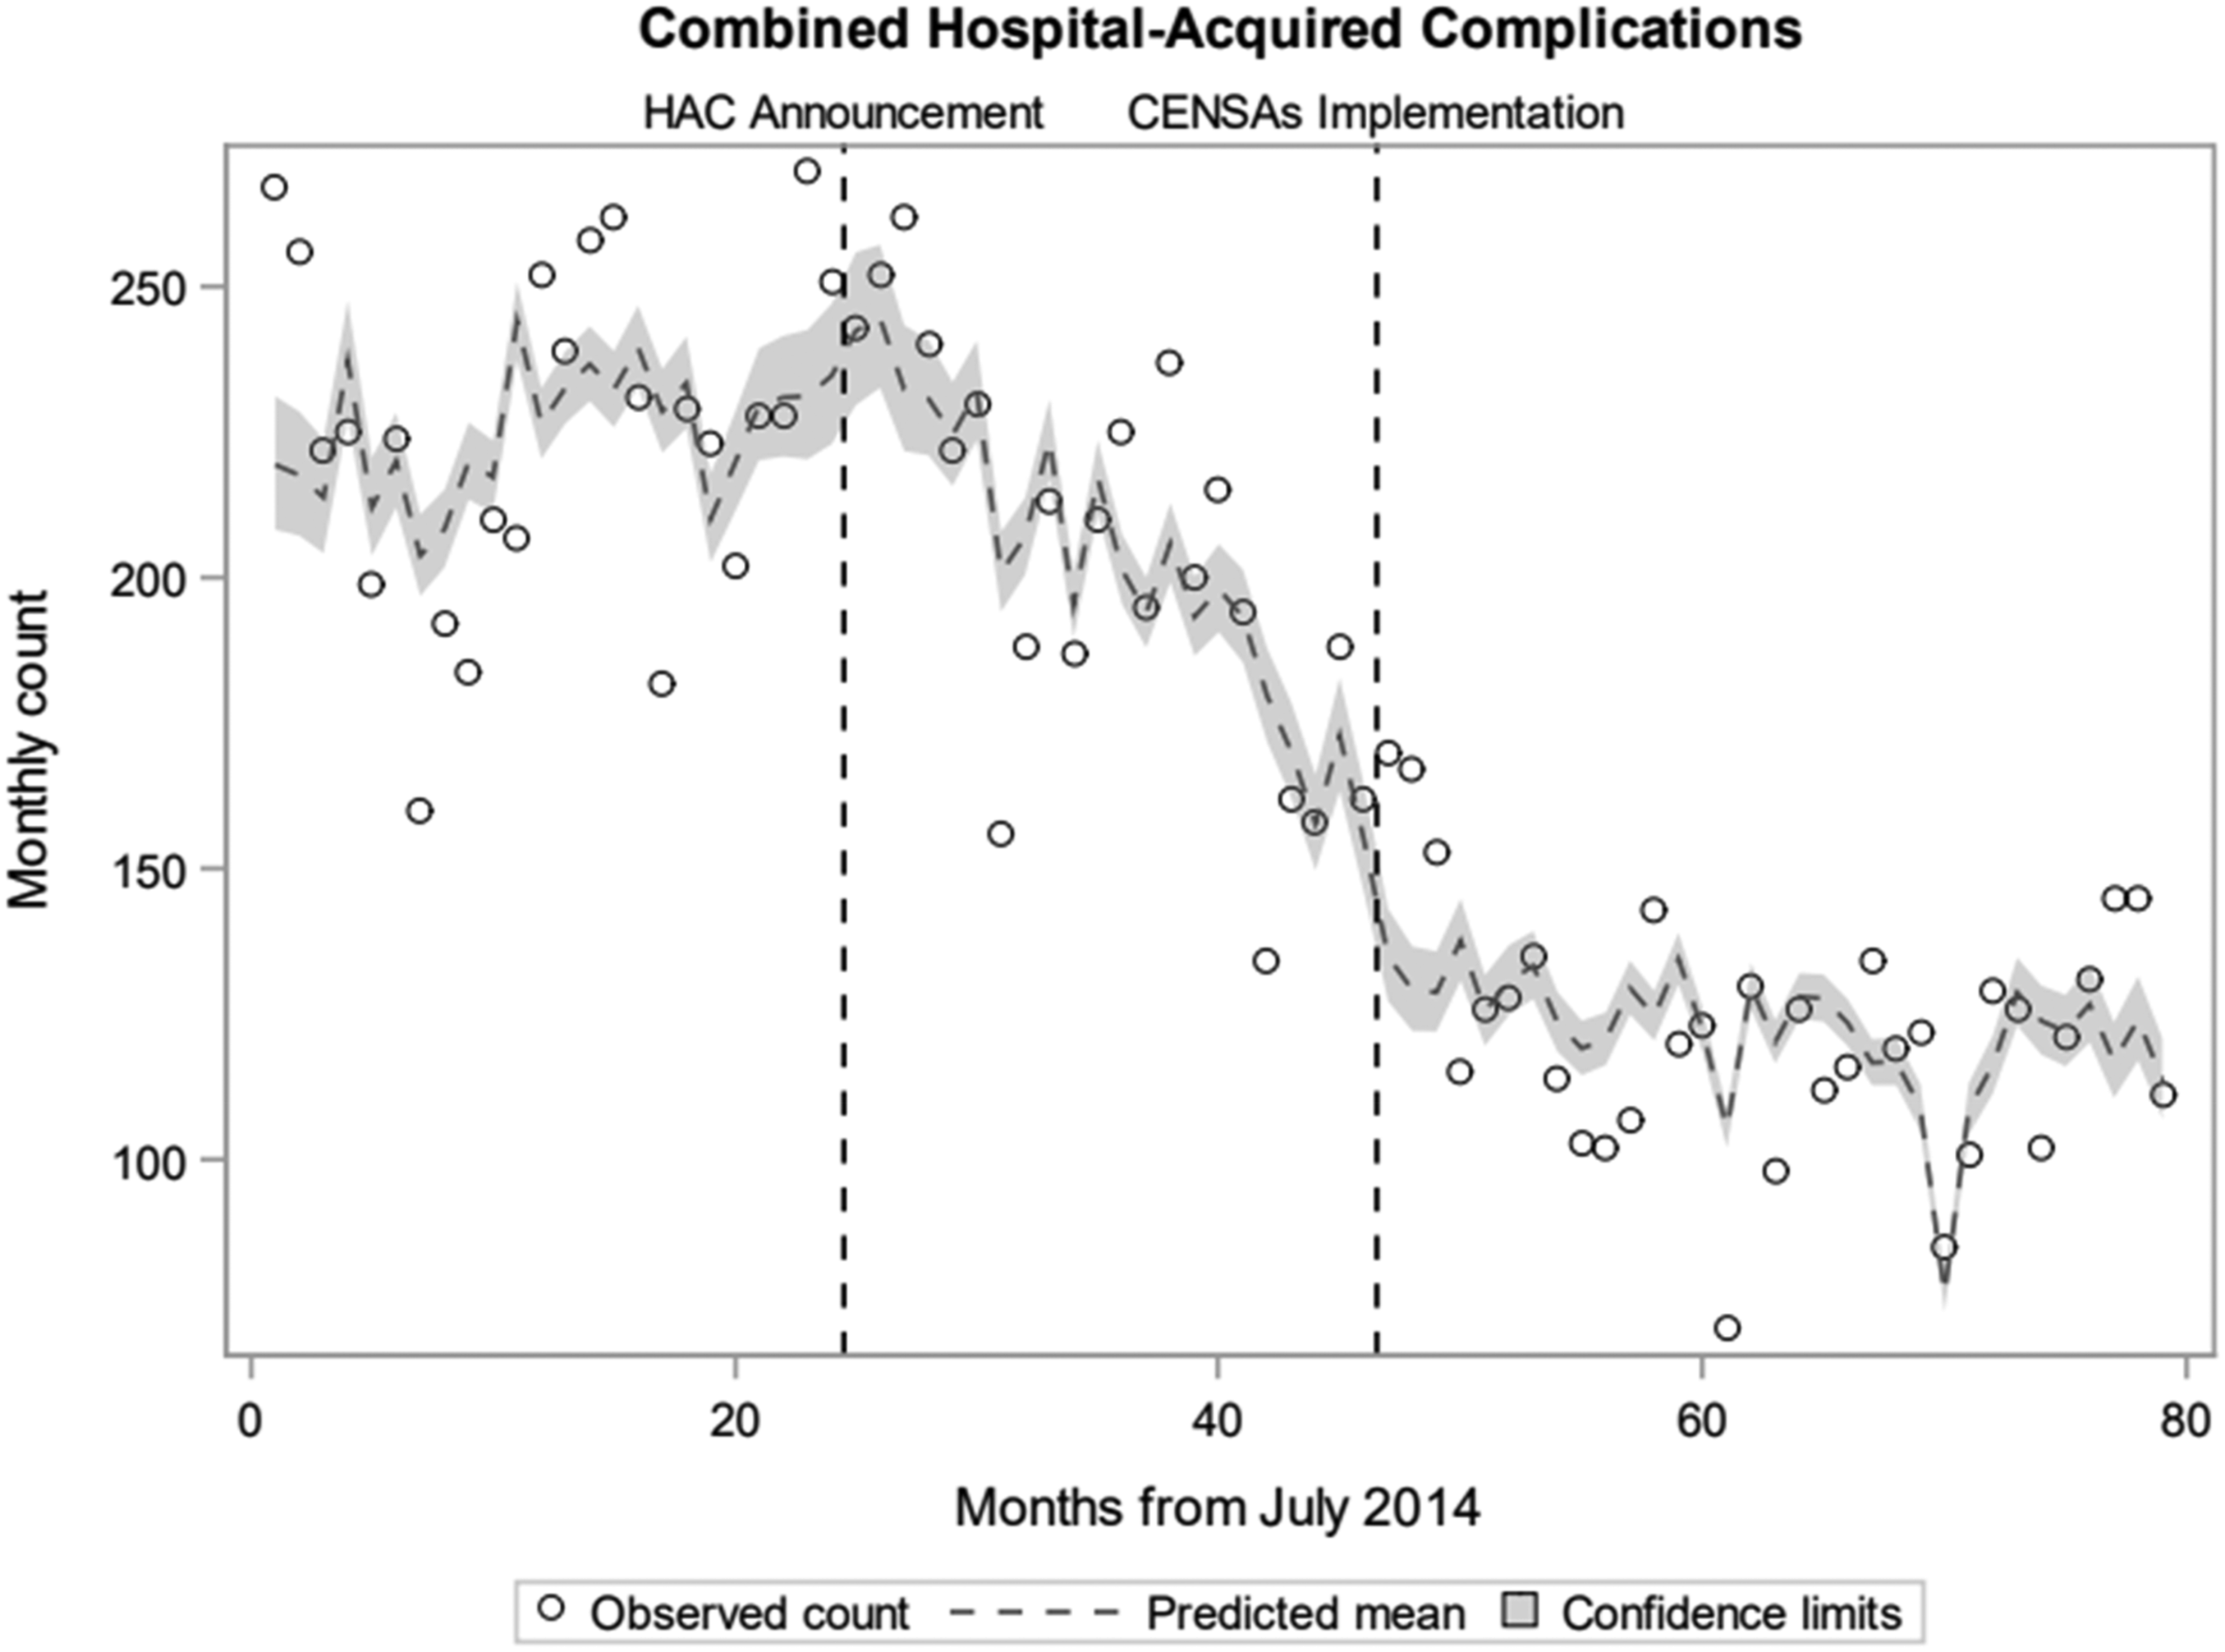
From the end Period 1, until the end of the study, the overall risk of a HAC reduced from 8.57% to 4.12% - a 51.93% reduction. The proportion which was attributed to each of the interventions modelled is illustrated in Appendix 4. The HAC announcement was found to be responsible for 29.99% (or 57.75% of the total) of the reduction and the CENSAs implementation was responsible for 21.93% (or 42.22% of the total).
Broadly, time-series results for the 13 individual HAC outcomes followed a similar pattern to that seen for the combined outcome. A total of 4 coefficients were noted to differ significantly in terms of the direction of the trend of the combined outcome. These included 2 that indicated an improved RR of HACs when the combined indicated a worsened RR: incontinence (Period 1 slope, RR = 0.967, 95% CI [0.946, 0.987], p = .002) and endocrine complications (Period 2 level change, RR = 0.729, 95% CI [0.588, 0.903], p = .004). Returns to theatre indicated a worse RR for Period 3 (level change, RR = 1.914, 95% CI [1.359, 2.694], p < .001) and for (slope, RR = 1.012, 95% CI [1.003, 1.022], p = .01) when the combined indicated an improved RR.
The RR coefficients for each HAC outcome of the level change in Period 3, on the immediate implementation of CENSAs, are presented within the forest plot of Figure 3. A RR below 1 was interpreted as an improved HAC outcome. A total of 5 of the 13 HAC outcomes, excluding the combined outcome, were found to have a statistically significant improvement. These ranged from the largest, endocrine complications (RR = 0.623, p < .001), to infections (RR 0.768, p < .001). These were also amongst the 5 most frequent HAC outcomes. A further 4 of the HAC outcomes had a positive coefficient for the period 3 level change, although these were not statistically significant. Forest plot of segmented regression analyses coefficients, period 3 level change, implementation of CENSAs.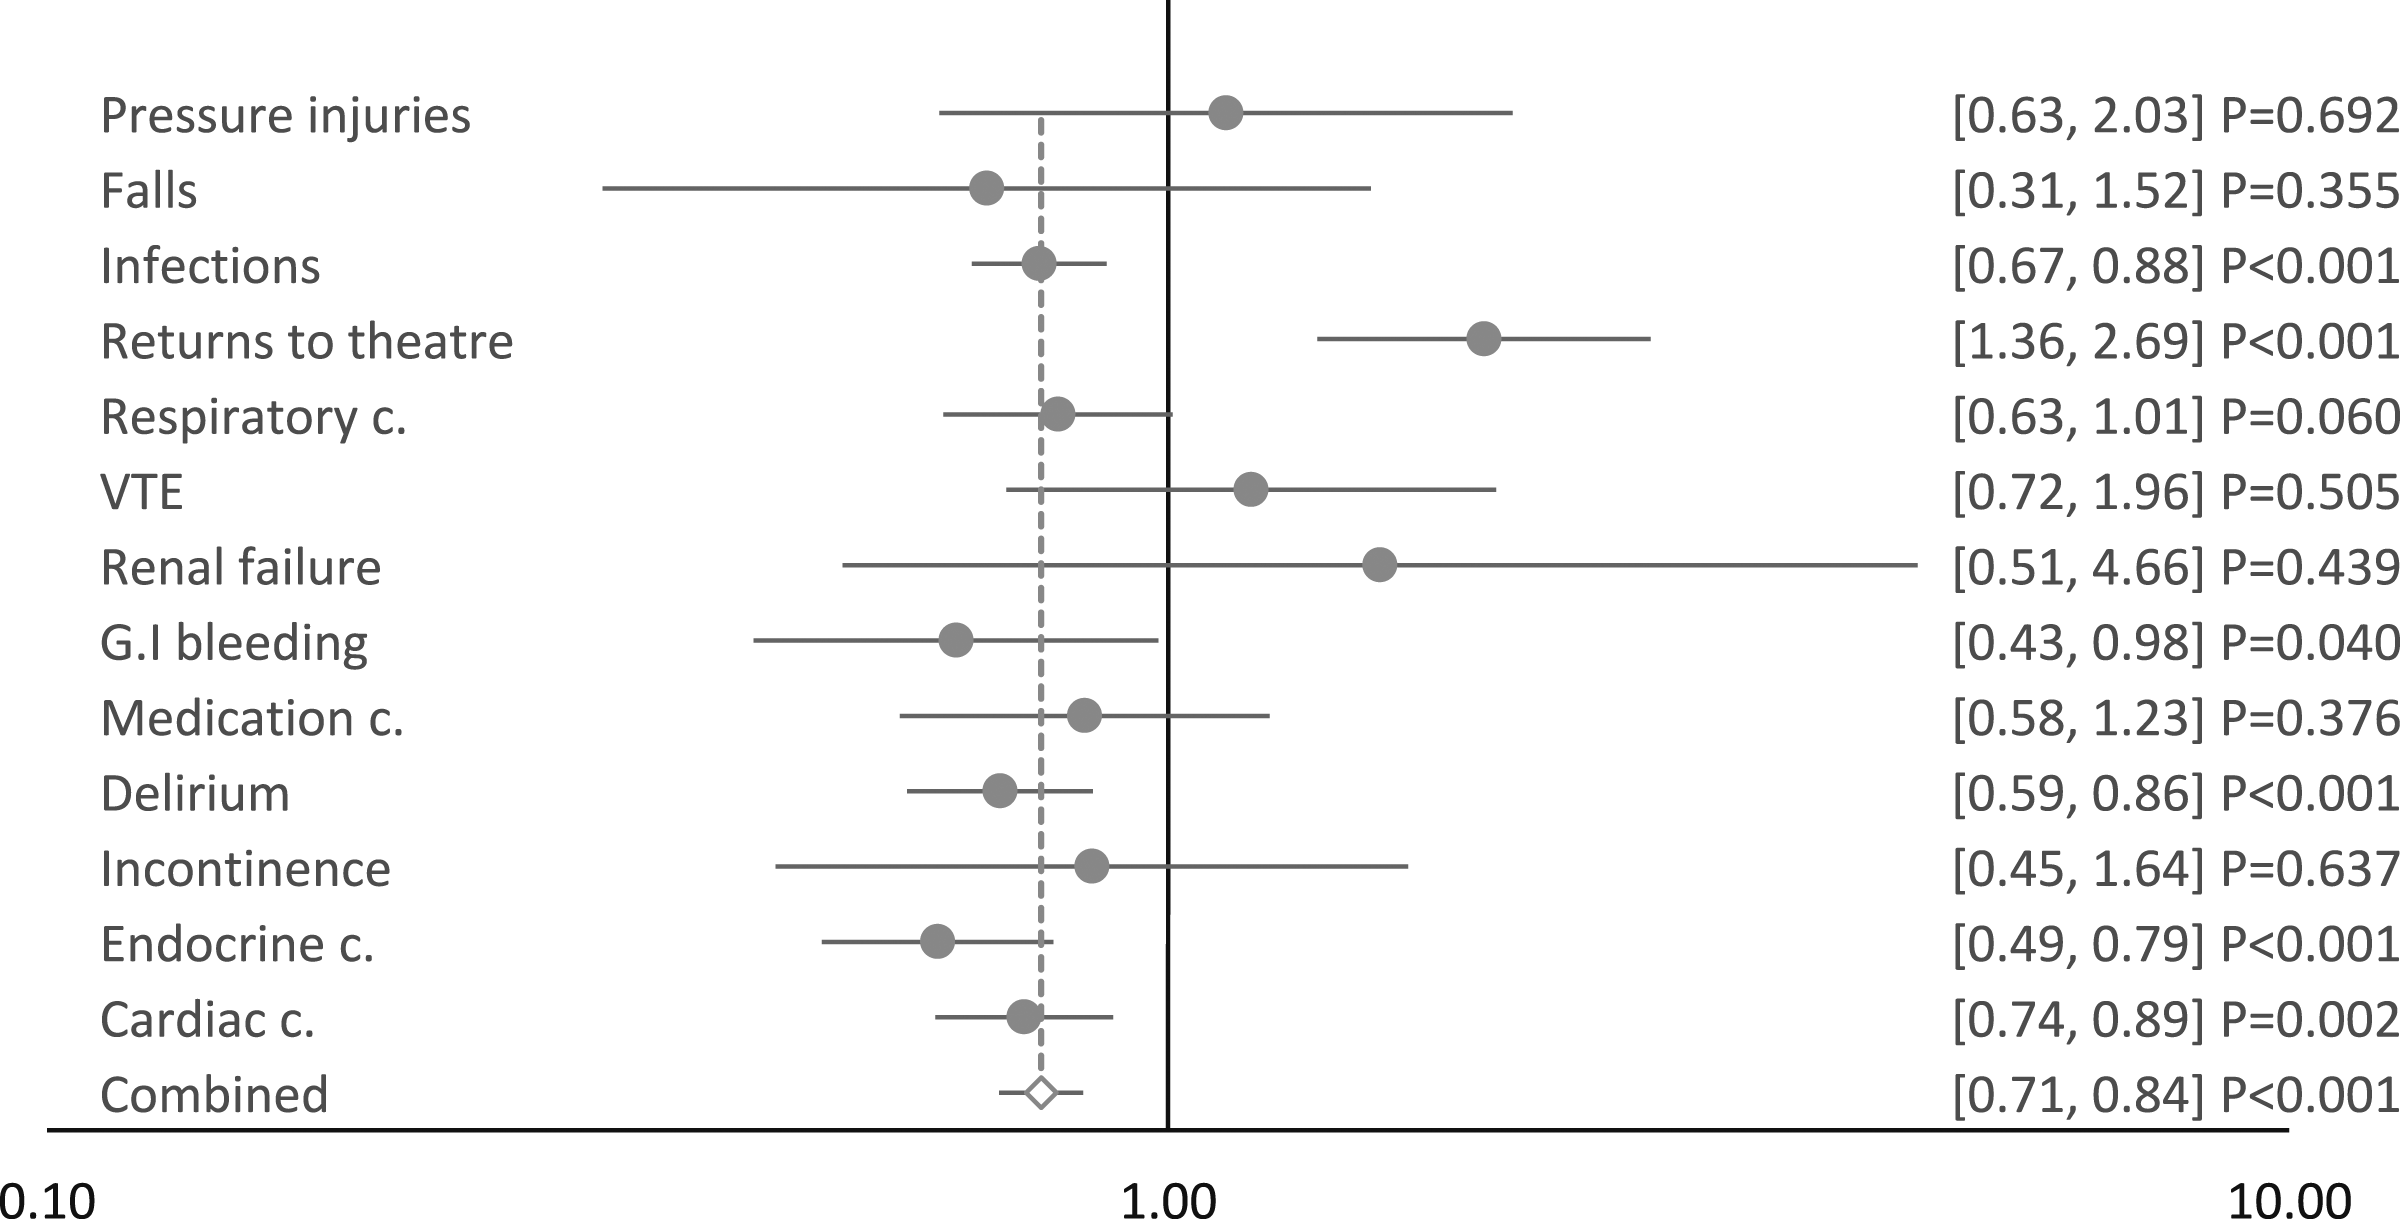
The RR coefficients for each HAC outcome of the slope, or the month-on-month trend following the implementation of CENSAs, in Period 3 are presented within the forest plot of Figure 4. A total of 4 of HAC outcomes, were found to have a statistically significant improvement. These ranged from the largest, incontinence (RR = 0.963, p = .014), to delirium (RR = 0.992, p = .040). A further 4 of the HAC outcomes had a positive coefficient for the Period 3 slope, although these were not statistically significant. The remaining estimated coefficients from the segmented regression analyses for period 1 and 2 are contained in Appendix 5. Forest plot of segmented regression analyses coefficients, period 3 slope (month-on-month trend), implementation of CENSAs.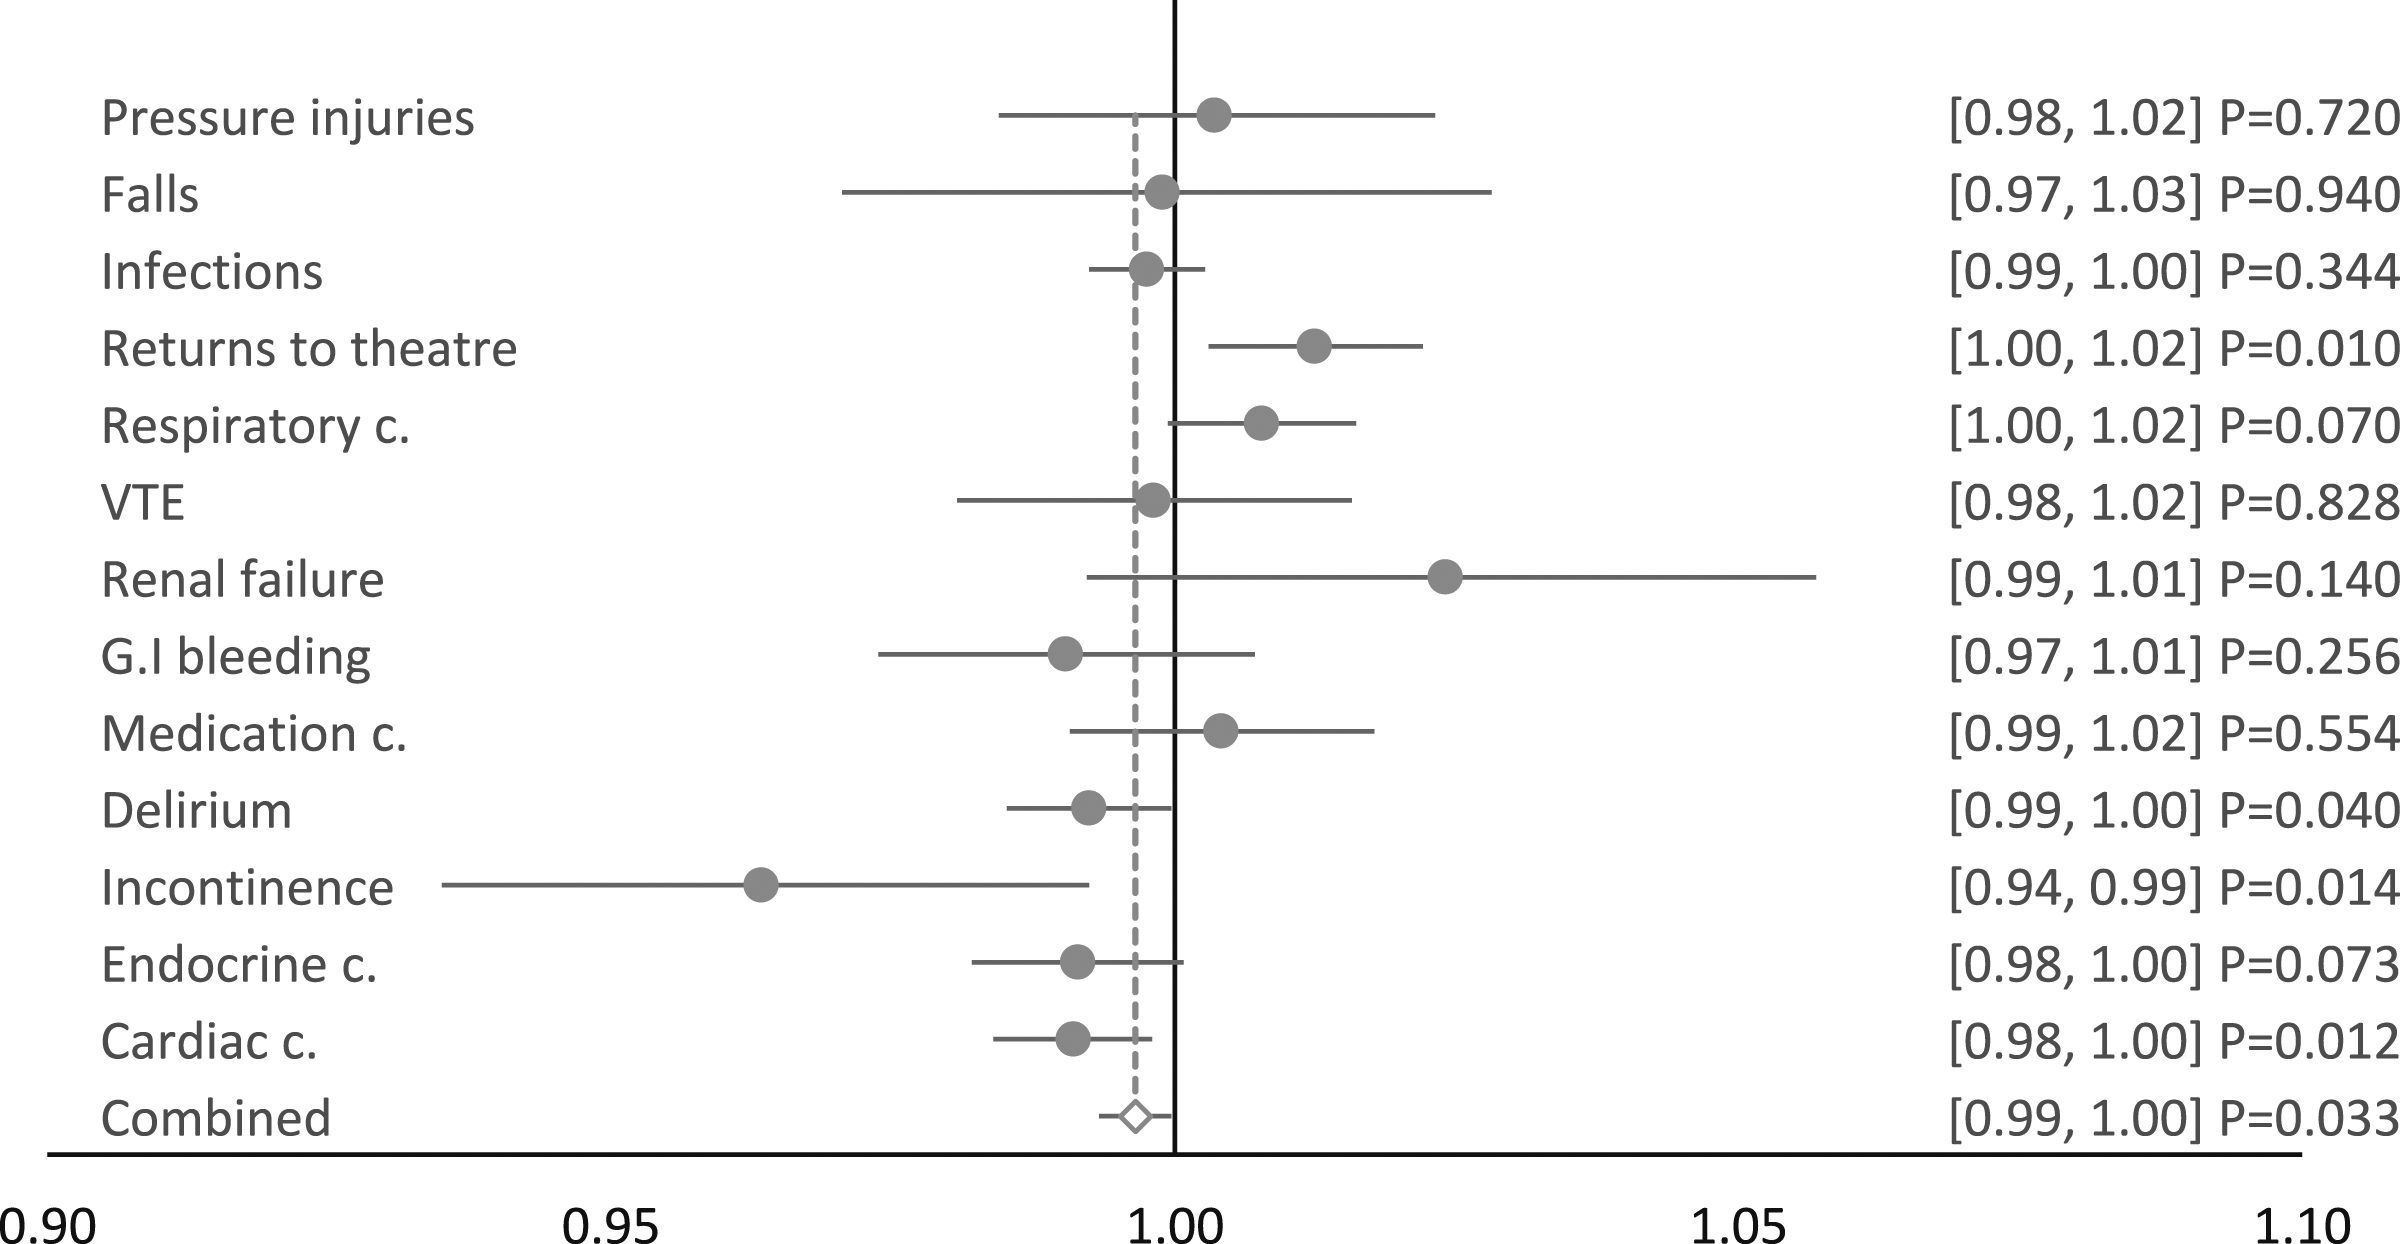
Discussion
Principal findings
This study assessed the impact and effectiveness of an e-A&F system on patient safety in a representative tertiary Australian hospital. 15 This was achieved by evaluating the change of HACs pre- and post-implementation of CENSAs. Across the study period, from mid-2014 to early-2021, an incidence rate of 6.24% of any HAC in an episode of care was found. The overall combined HAC outcome was composed of the presence of any of 13 individual HAC outcomes in an episode, which ranged from falls resulting in fractures or intracranial injuries, at 0.07%, to healthcare-associated infections, at 2.44%.
The trends of the 13 individual HAC outcomes were found to be broadly similar to the combined HAC outcome. Of the remaining total 65 coefficients, 4 were noted to be statistically significantly the inverse of the direction of the trend of the combined. The coefficient for the level change and slope for the returns to theatre HAC outcome, during period 3, was one of these that was not consistent with the trend of the combined.
Our findings lend evidence to a mechanism that the mere announcement of a measurement framework, even at a national level, can lead to local services developing associated strategies that lead to significant improvements, equating to a near 1% per month decrease from the baseline.
Comparison with previous studies
The seminal Cochrane review on the effect of audit and feedback on healthcare professional practice found that the median absolute improvement that could be expected of an intervention was 4.3%, a small-to-moderate effect. 9 The Cochrane review searched the literature until the end of 2010 for all audit and feedback interventions across all health settings. Since this time, research has been performed on more contemporary approaches to audit and feedback, e-A&F, including interventions performed specifically in hospital settings. Some of this research has demonstrated that, despite an initial improvement in practice or outcomes, these improvements are potentially not sustainable. 25 It was posited that this effect may be the result of greater initial opportunity for improvement when performance is low. 25
The Cochrane review also found that large variability (interquartile range 0.5%–16%) for the median absolute improvement that could be expected of an audit and feedback intervention. 9 This, it suggested, supported the view that the individual features of an intervention could substantially influence its effectiveness.10–13 This might suggest that CENSAs has a mixture of both strong and weak effect features.
Despite the increased research focus on e-A&F, to our knowledge, between 2011 and mid-2022, only a single study examined the effect of an e-A&F intervention with a hospital-wide scope and providing feedback across multiple domains, as in our study. 26 While rates of HAC outcomes were within the expected range for an Australian hospital 27 it is difficult to draw firm conclusions about how our results compare to previous studies. Accepting these limitations, we argue our findings are within an expected range of results.
Possible explanations and implications for policymakers
One of the key findings of the study was the change in the direction of the trend in approximately mid-2016, from an increasing rate of HACs at the beginning of the study period, to a decreasing rate of HACs in Period 2. This coincides with the national announcement of the priority list of HACs. 3 In our study this announcement of HACs was attributed with a reduction of risk of 29.99%. This would appear to be the manifestation of the Hawthorne Effect, an observer effect that is often cited as a source of bias for behavioural changes among observed study participants. 28 This period also coincides with a major governance reform, including the devolution of legal and governance responsibilities to boards of area health services. 29 It would appear, taken together, these lend evidence to a mechanism that the mere announcement of a measurement framework, even at a national level, can lead to local services developing associated strategies that lead to significant improvements.
The challenge would appear to be the ability to sustain large continued improvements over time. Our findings lend evidence that, following an improving trend of a reduction in HACs since their national announcement, CENSAs helped to produce a further improvement of 21.93%. In fact, 5 of the 13 individual HAC outcomes had a statistically significant improvement at the commencement of period 3. These were also amongst the 5 largest HAC outcomes in terms of their frequency of occurrence. A further 4 HAC outcomes had a positive coefficient for the period 3 level change, although these were not statistically significant. Possibly, this represents poor precision of lower frequency HACs.
The coefficient for the level change for the returns to theatre HAC outcome, during period 3, was 1 of 4 that was statistically not consistent with the trend of the combined. We argue that the increasing trend of unplanned returns to theatre could potentially be explained by beneficial practice changes related to more timely and appropriate responses to the care of deteriorating patients. Transfer to operating theatre is a core interventional option in the response to acute deterioration. 30 It is plausible that an improvement in recognition of acute deterioration would result in patients having timelier transfer to operating theatre, resulting in less severe complications of care. The alternative may be patients requiring re-admission to hospital at a later stage or a subsequent episode, only then admitting to the operating theatre, resulting in poorer clinical outcomes.
Finally, as noted previously, to our knowledge only a single previous study has examined the effect of an e-A&F intervention the scope of which was hospital-wide and providing feedback across multiple domains, as in our study. 26 Therefore, our study helps to address the paucity in the research on how these interventions targeting multiple domains and levels of care can effectively lead to improvement in the quality of care. Studying diverse e-A&F interventions permits future collation and aggregation of findings and provide generalised recommendations for optimised design.
Unanswered questions and future research
In this study we assessed the longitudinal impact and effectiveness of an e-A&F system on patient safety in a hospital setting. It is plausible that e-A&F can improve patient safety on an individual patient-level, viewed as the product of an additional bedside safety intervention. An analysis should be undertaken to examine this possibility looking at the predictors of HACs at an individual, or patient-level. The costs of any improvements found should also be explored as these would help to justify further rollout and implementation. Finally, further exploration should be made to clarify the strength of evidence for CENSAs against what have been found to be large effect features of e-A&F.
Strengths and limitations
A core strength of this study is the use of segmented regression analysis of interrupted time series design – the principal benefit of which is to allow the differentiation of the effects of an intervention from secular trends. 31 An example of such a secular trend would include the recent global policy developments regarding prescription of drugs linked to major bleeds (e.g., nonsteroidal anti‐inflammatory drugs and oral anticoagulants). 32 The corresponding practice changes could explain a finding of a steep downward trend for gastrointestinal bleeding in isolation. It is however unlikely that the trends found in this study for individual HAC outcomes, which are broadly consistent with the combined HAC outcome, observed at specific time points, simultaneously reflect such secular trends overall for all HACs combined.
Fundamental to this design is the use of population-level risk ratios, or in this case specifically, hospital-level risk ratios. Therefore, the findings should not have been confounded by individual-level characteristics unless there had been a simultaneous change alongside the intervention itself. Likewise, the approach to limit the study to a single site allowed granular consideration of practice changes that would not have been possible if a larger scope of study sites was utilised. Using a larger sample size by including other sites may have led to potentially introducing bias into the study in the form of non-equivalent counterfactual controls.
The local inpatient administrative dataset, which contributes to the WA Hospital Morbidity Data Collection, was utilised for the analysis of this study. 16 The WA Hospital Morbidity Data Collection, as a critical data collection at a state-level, benefits from routine quality assurance processes, which help to ensure the data are of good quality overall. This includes ensuring individuals who present to hospital with aliases are merged and not recorded separately. However, the deficits of administrative data in terms of clinical accuracy are widely appreciated. 33 It is also possible that practices in the collection of administrative data shift over time. This could potentially create systematic bias in the analysis of this data over time, implying a trend exists where in reality it does not. Evidence from the study suggests that this did not occur. A systematic change in the way administrative data is collected would be expected to affect all HAC outcomes equally. Rather, we found a total of 4 (6.15%) coefficients were noted to be statistically significantly the inverse of the direction of the trend of the combined.
The period of our study did extend into the COVID-19 pandemic. As a quasi-experimental observational study design changes to hospital activity as a result of a pandemic may have had an unintended confounding effect during Period 3. However, even as late as late-2021, Western Australia had virtually no cases of community transmission with most active cases associated with arrivals from abroad or inter-state and in supervised quarantine. 34 A combination of geographic isolation and strict protocols for entry and supervised quarantine helped to maintain low community transmission throughout 2020 and 2021. 34 Given this, we argue the low likelihood of a confounding effect during Period 3.
Conclusion
This study assessed the impact and effectiveness of an e-A&F system on patient safety in a Western Australian hospital setting. This was achieved by evaluating the change in the rates of HACs pre- and post-implementation of CENSAs utilising a segmented regression analysis of interrupted time series design. Risk of HACs were broadly in keeping with national benchmarks. The risk of HACs change trend findings were complex, both across and within the periods.
Supplemental Material
Supplemental Material - Longitudinal evaluation of an electronic audit and feedback system for patient safety in a large tertiary hospital setting
Supplemental Material for Longitudinal evaluation of an electronic audit and feedback system for patient safety in a large tertiary hospital setting by James Soresi, Kevin Murray, Theresa Marshall and David B Preen in Health Informatics Journal.
Footnotes
Acknowledgements
The authors would like to acknowledge the collaborate support of all those in addition to the SCGH Safety Quality Performance team who helped to develop the dashboards, including NMHS Business Information Performance, and the staff who have helped to collected their own local data, including the Nursing Staff.
Author contributions
JS, DP and KM conceptualised the project and drafted the manuscript. DP, KM and TM reviewed and edited the manuscript. All authors read and approved the final manuscript.
Declaration of conflicting interests
The author(s) declared no potential conflicts of interest with respect to the research, authorship, and/or publication of this article.
Funding
The author(s) received no financial support for the research, authorship, and/or publication of this article.
Ethical statement
Supplemental Material
Supplemental material for this article is available online.
References
Supplementary Material
Please find the following supplemental material available below.
For Open Access articles published under a Creative Commons License, all supplemental material carries the same license as the article it is associated with.
For non-Open Access articles published, all supplemental material carries a non-exclusive license, and permission requests for re-use of supplemental material or any part of supplemental material shall be sent directly to the copyright owner as specified in the copyright notice associated with the article.