
Abstract
We constructed a preventive social behaviours (PSB) Index using survey questions that were aligned with WHO recommendations, and used linear regression to assess the impact of reported COVID-19 deaths (RCD), people’s confidence of government handling of the pandemic (CGH) and government stringency (GS) in the United Kingdom (UK) over time on the PSB index. We used repeated, nationally representative, cross-sectional surveys in the UK over the course of 41 weeks from 1st April 2020 to January 28th, 2021, including a total of 38,092 participants. The PSB index was positively correlated with the logarithm of RCD (R: 0.881, p < .001), CGH (R: 0.592, p < .001) and GS (R: 0.785, p < .001), but was not correlated with time (R: −0.118, p = .485). A multivariate linear regression analysis suggests that the log of RCD (coefficient: 0.125, p < .001), GS (coefficient: 0.010, p = .019), and CGH (coefficient: 0.0.009, p < .001) had a positive and significant impact on the PSB Index, while time did not affect it significantly. These findings suggest that people’s behaviours could have been affected by multiple factors during the pandemic, with the number of COVID-19 deaths being the largest contributor towards an increase in protective behaviours in our model.
Introduction
Preventative social behaviours (PSB) including school and workplace closures, restrictions on mass gatherings and lockdown measures are effective in reducing transmission of COVID-19.1–3 Timely implementation of these measures has been essential to control the COVID-19 pandemic that has already claimed 3.5 million lives worldwide (approximately 128,000 in the UK).3,4 Their success depends on a multitude of factors that affect the public’s adherence. 5 A key motivating factor for adherence to PSB guidance is the individuals perceived need to protect themselves, their relatives and their community networks.6,7 The reported COVID-19 deaths have previously been used as a surrogate measure representing the need to protect oneself or family. 8 Major barriers to adherence to PSB guidance include lack of trust in the prescribed guidance, failure of others in compliance to the guidance, the inability to follow it (e.g., need to attend work or carer for others) and negative impact on ones’ mental health. 8 Additionally, lower levels of trust in governments’ public health messaging was associated with poorer adherence to PSB. 9
Government policy and regulations play a prominent role in the effective implementation of public health measures to tackle the COVID-19 pandemic. 2 The level of stringency derived from the enacted government policy has been shown to affect the levels of COVID-19 associated deaths. 10 A lower degree of Government stringency and slower implementation of guidance response times have been found to be associated with a higher COVID-19 related mortality. 3 Government policy is thought to be fundamental in promoting adherence to PSB. In the United Kingdom (UK), the government first introduced PSB measures on 16th March 2020, advising the public to avoid unnecessary travel and to work from home when possible. 11 1 week later a nationwide lockdown was introduced, lasting for 7 weeks. Following the initial lockdown, the level of government stringency (GS) varied greatly, until a second lockdown was further introduced on November 5th, 2020, 12 and a third one on January 6th, 2021. 13 There is scarce evidence on what factors can positively affect adherence to PSB and specifically, there is a lack of lack of evidence of the relationship between governmental stringency and adherence to these guidelines over time.
Governments worldwide acknowledge that “lockdowns'' are not sustainable in the long-term, it is important to understand how governmental guidance, and specifically how government stringency, has impacted the promotion of PSB by the public. 14 The main objective of this work was to evaluate the association between PSB and GS over time. Additionally, we sought to evaluate the influence of additional factors on the relationship between GS and PSB, including time, the reported number of COVID-19 deaths and reported confidence in government handling of the COVID-19 pandemic.
Starting in March 2020, YouGov and Imperial College London partnered to create a survey that could be used to gather insights regarding people’s attitudes and behaviours towards the COVID-19 pandemic across multiple countries. 15 Questions regarding other pandemic-related issues, such as use of facemasks and missed routine vaccinations were also added over time. Techniques. This study aims to perform a analysis of this data, with the aim of understanding the relationship between multiple protective behaviours, government policy stringency and the public opinion in the United Kingdom. Relationship between reported COVID-19 deaths, government stringency, reported confidence in government handling of the pandemic and a novel PSB index is explored by correlation analysis as well as by conducting linear regressions to determine the relationship of PSB with the other variables over time.
Methods
Study overview
Since the COVID-19 pandemic began, YouGov has been commissioned to undertake repeat national cross-sectional surveys in the UK as well as other countries. The survey asked individuals a broad range of survey questions regarding their behaviours during the pandemic, their use of face mask, opinions about their government handling of the pandemic among others. Data for this survey are publicly available and further detail about the survey and questions asked can be found on its GitHub repository. 15 In this study we examined the data collected from the UK population. This data are collected from a nationally representative cross-section of the UK population over the course of 41 weeks from 1st April 2020 to January 28th, 2021. The duration of this study covers the first national lockdown, ending on 1st June 2020, easing of restrictions during the summer and the reinstatement of the national lockdown on the 6th of January 2021. The responses to the questions in the YouGov survey were used to generate a novel preventative and social index (PSB) score and a Confidence in Government Handling index (CGH). Data from the Oxford COVID-19 Government Response Tracker (OxCGRT) were used to generate a Government Stringency (GS) index. 16 Ethical approval was waived as part of the [details omitted for double-anonymised peer review]’s ethical policy.
Participants and procedures
For each country and survey, YouGov samples a nationally representative population from a larger panel of respondents in each country to complete an online survey. YouGov generates survey weights to adjust the samples to be nationally representative. The surveys examine the populations attitudes to, and adoption of preventative social behaviours around COVID-19 and are repeated every one to 2 weeks (median time between survey waves of 8 days, range 5–20 days). The survey consists of a core set of demographic questions and additional questions relating to COVID-19 and preventative social behaviours to curtail the pandemic.
Measures
In this study we used the 20 preventative social behaviour questions asked in the YouGov surveys to create a novel PSB index. The questions were included if they were in accordance with WHO’s COVID-19 public guidance, 17 if they were adopted in the last week, were in line with WHO’s recommendations, and had generalised applicability. The questions were excluded if they related to behaviours that did not represent WHO recommendation (e.g., eaten separately at home); a hypothetical question (e.g., how likely are you to self-isolate if you have symptoms); common behaviour which predates the pandemic (e.g., covering of mouth when sneezing); a behaviour which was not possible/accessible over the entire course of the pandemic (e.g., use of hand sanitizer); in contrast with government recommendations; necessary for survival; or if it may be interpreted as ambiguous (e.g., avoided going to the shops).
Preventative social behaviours (PSB) assessed for inclusion or exclusion in the PSB index.
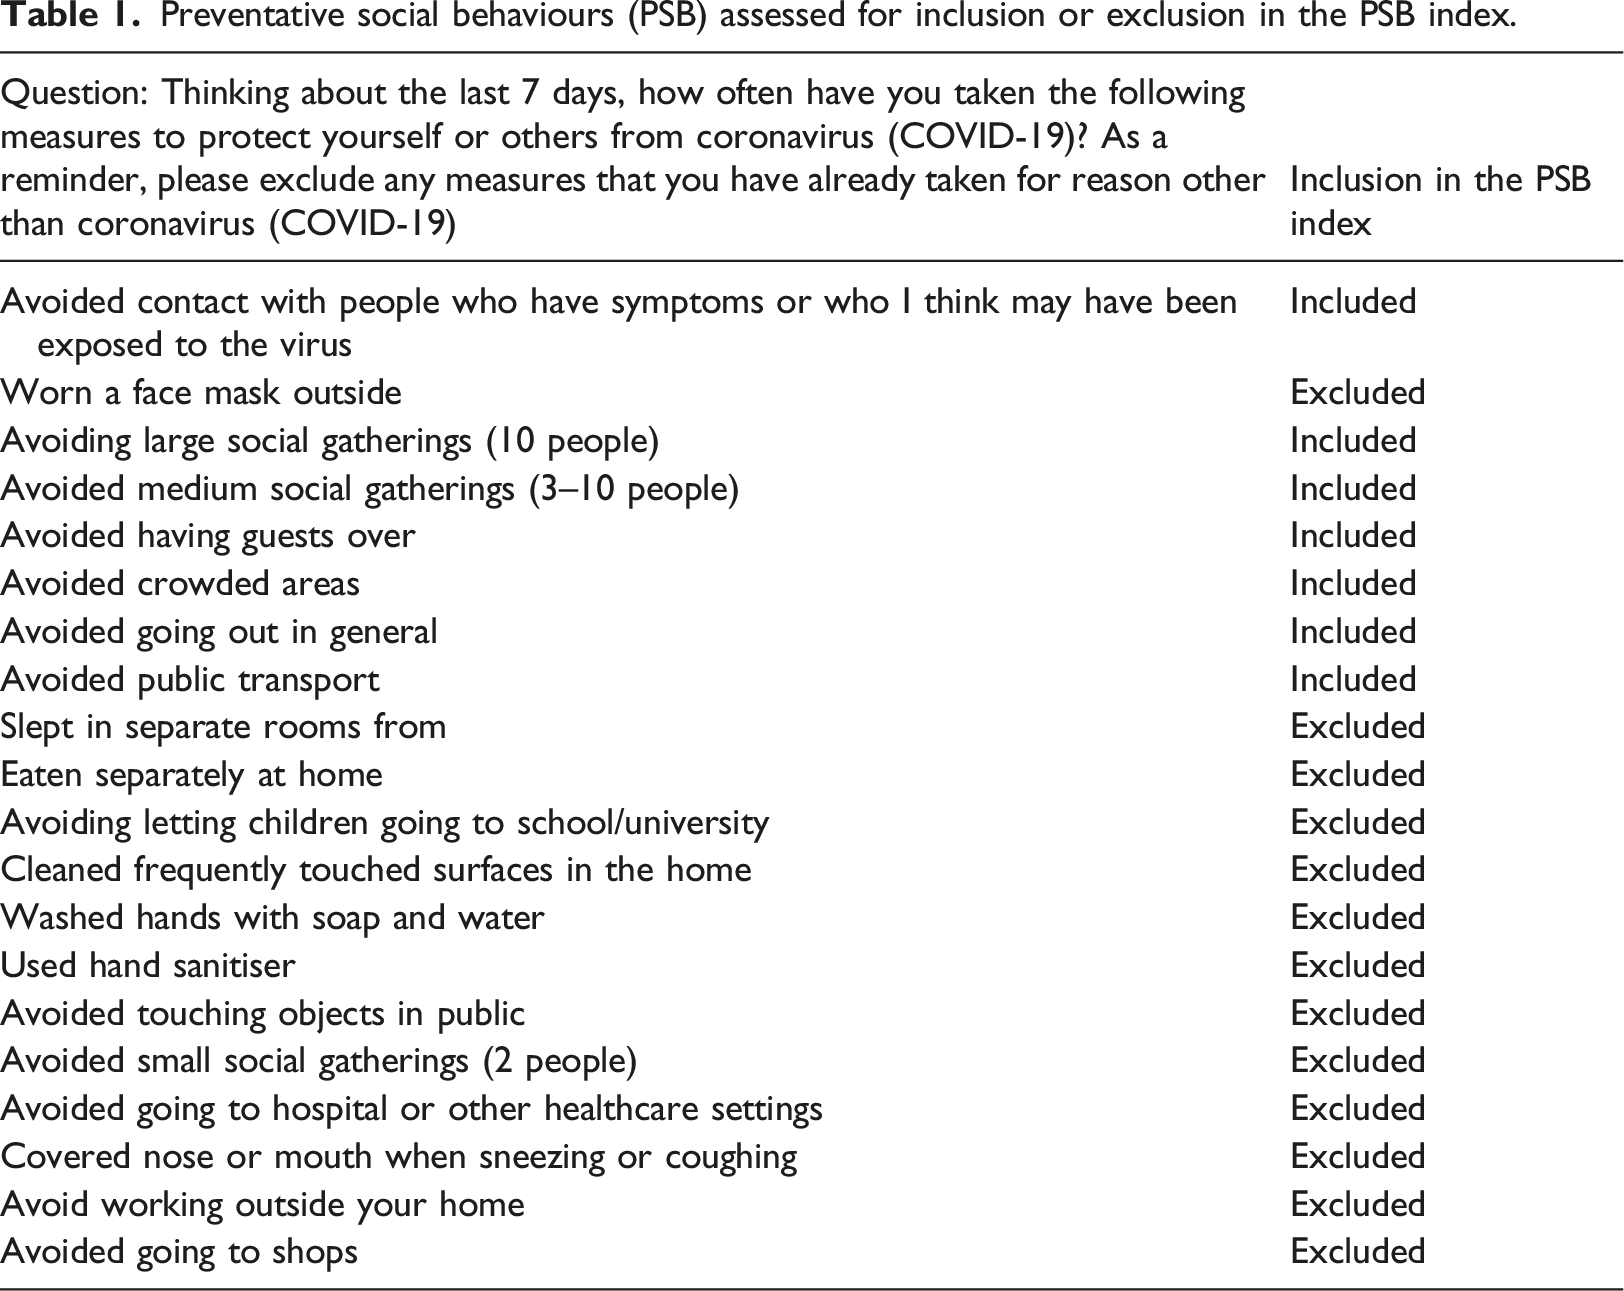
Each of the included preventative questions from the YouGov survey, had five possible responses: ‘always’; ‘frequently’; ‘sometimes’; ‘rarely’; or ‘not at all’. Each response was ranked from most preventative (‘always’ as 5) to least preventative (‘not at all’ as 1).17,18 A weighted average of the sum of all the responses for each question for each week was calculated by multiplying the proportion of responses to the respective ranks while taking into consideration the survey weights of each participant. The mean weighted average of each of the relevant survey questions has then informed the calculation of the PSB composite index score for a specific week (PSB index weekly score = μ(
Confidence in Government Handling (CGH) of the COVID-19 response was asked of all participants in the YouGov COVID-19 surveys. The question asked was ‘how well do you feel the government is handling the issue of coronavirus?’. The percentage of individuals responding ‘very’ or ‘somewhat well’ for each of the corresponding weeks of the published preventative behaviour survey questions was calculated to define the CGH index. 19
The Government Stringency (GS) index was calculated using data from the Oxford COVID-19 Government Response Tracker (OxCGRT). 16 The OxCGRT systematically collects information on several different common policy responses that governments have taken to respond to the pandemic on 20 indicators such as school closures and travel restrictions for more than 180 countries to form different indices, one of which is the ‘stringency index’. The ‘stringency index’ records the variations in responses from publicly available information for each day, which is calculated as a composite measure based on nine indicators measured on an ordinal scale (from 0 to 100, where 100 is the most stringent). The nine indicators used are: school closures, workplace closures, cancelled public events, restrictions on gatherings, closure of public transport, public information campaigns, stay at home measures, restrictions on internal movement and international travel controls. 16 As each wave of questionnaires was sent over a period of 2–4 days, the mean of the highest and lowest stringency index score was calculated to form the GS index for the period over which the waves were delivered.
The 7-day average of the number of deaths of people who had had a positive test result for COVID-19 and died within 28 days of the first positive test (Reported COVID-19 deaths, RCD), as reported by Public Health England (PHE) was recorded for each of the corresponding weeks of the published preventative behaviour survey questions. 4
Data analysis
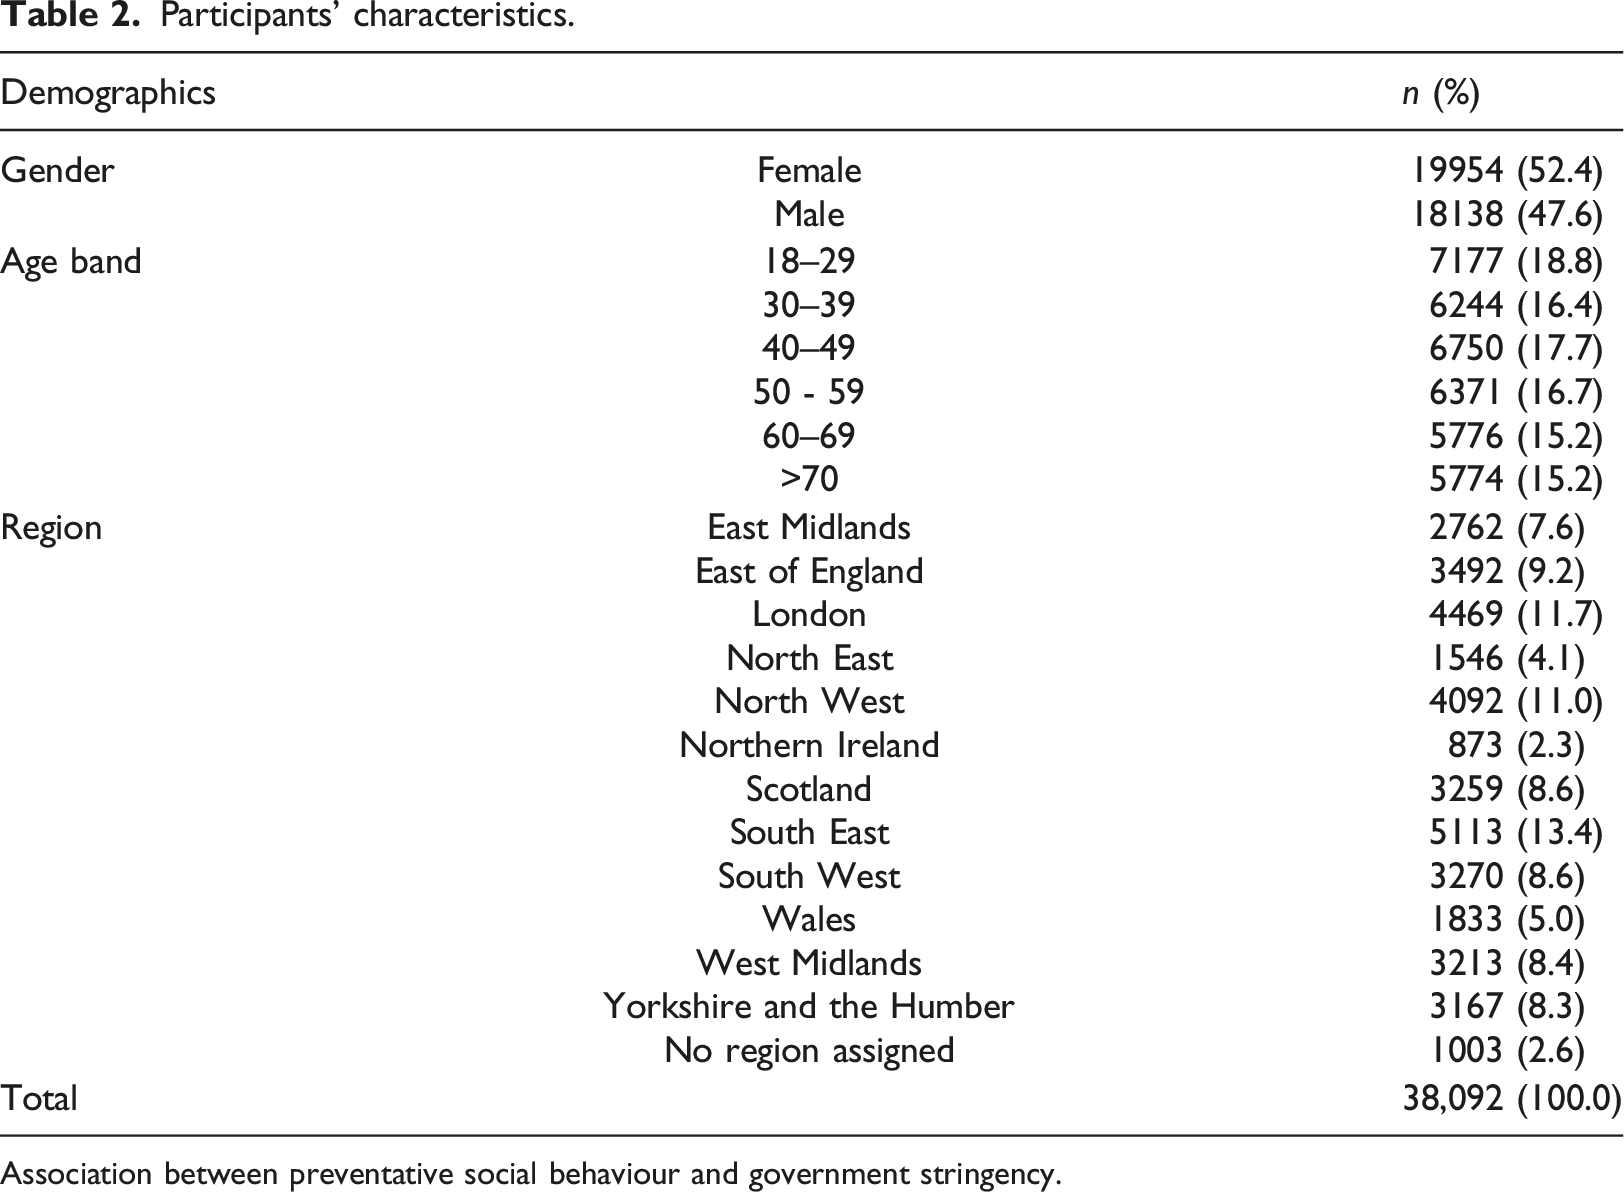
The characteristics of participants including age, gender and geographical location were based on responses to questions asked in the survey. We examined at the relationship between PSB index scores, GS index, CGH, and recorded COVID-19 deaths between April 2020 – March 2021, across four significant events, including the start of the 1st national lockdown (April 2020), the launch of the ‘Eat out to help out’ government initiative (August 2020), the start of the second lockdown (November 2020), and the start of the third lockdown (January 2021). We explored how changes in GS was related to the adoption or PSB (measured by our PSB index), for this we used the GS score on the date of the first lockdown, and corresponding PSB score as a reference score and compared the % change over the following surveys. We next explored whether the relationship remained significant after controlling for the effect of reported COVID-19 deaths, CGH and time (as well as potential interactions between GS index and time, and between CGH and time).
Data were initially visualized using in Excel (v 16.49), where line and scatter plots were created to explore the data. Statistical analysis was conducted using RStudio Desktop (v1.4.1103), and R (v 4.0.5). The associations among variables of interest were determined by producing scatter plots and calculating Pearson’s correlation (R) and its associated p value. Further analyses were conducted using multiple linear regression to determine the influence of variables, such as time, CGH and RCD and GS index on the PSB index.
Linear regression analysis, using the ordinary least squares method, was conducted using the base R ‘lm’ function, and R2 and p values were extracted using the ‘summary’ function. In order to maximise the correlation of PSB and RCD, we compared the R value of RCD and PSB and the logarithm of RCD (lRCD) and PSB, As lRCD had a larger association with PSB we proceeded with lRCD instead of RCD. To identify the most suitable model for our analysis, we used a sequential approach by iteratively comparing nested linear models using the anova base function in R. The final model used in our model includes the variables RCD, GS and CGH, but not the time variable. Covariates in our final model were checked for multicollinearity by calculating the variance-inflation factor (VIF) using the vif function in R. All our covariates had a VIF score lower than 5, suggesting low collinearity. Variable standardisation, to obtain variables of mean 0 and standard deviation 1, was conducted in order to compare variable coefficients and determine their relative importance to one another. This was achieved by using the scale.
Results
Participants’ characteristics.
Association between preventative social behaviour and government stringency.
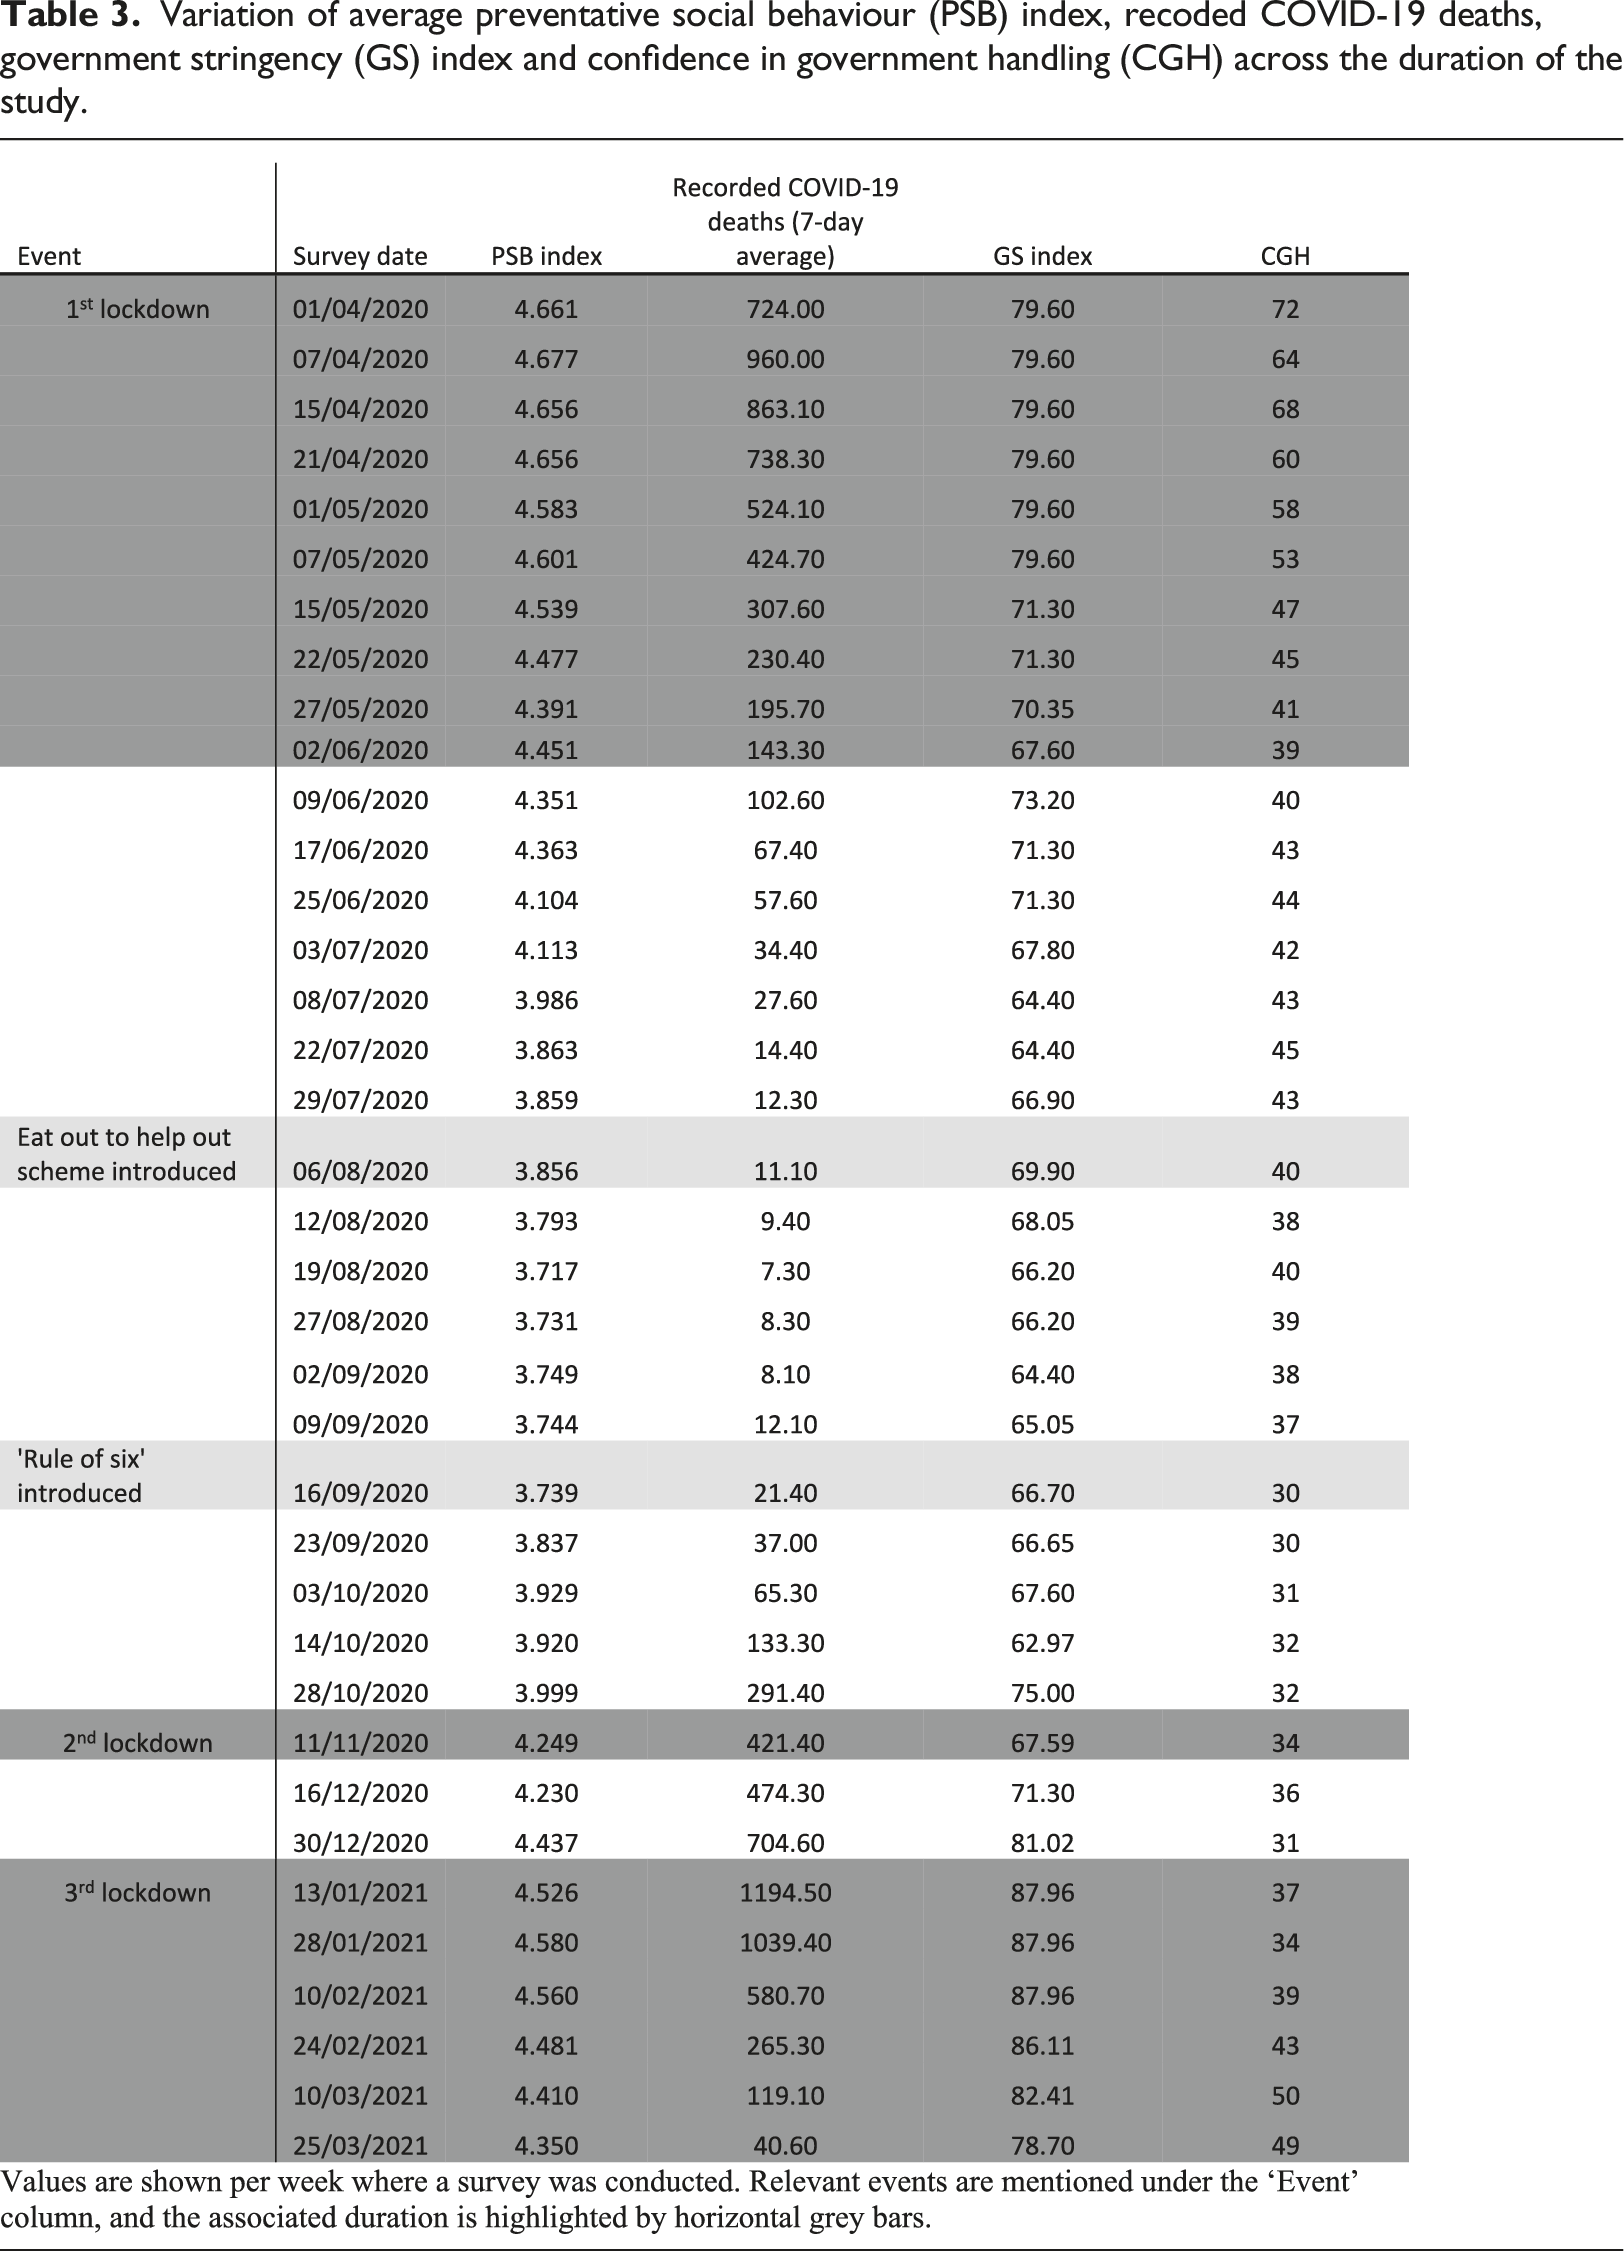
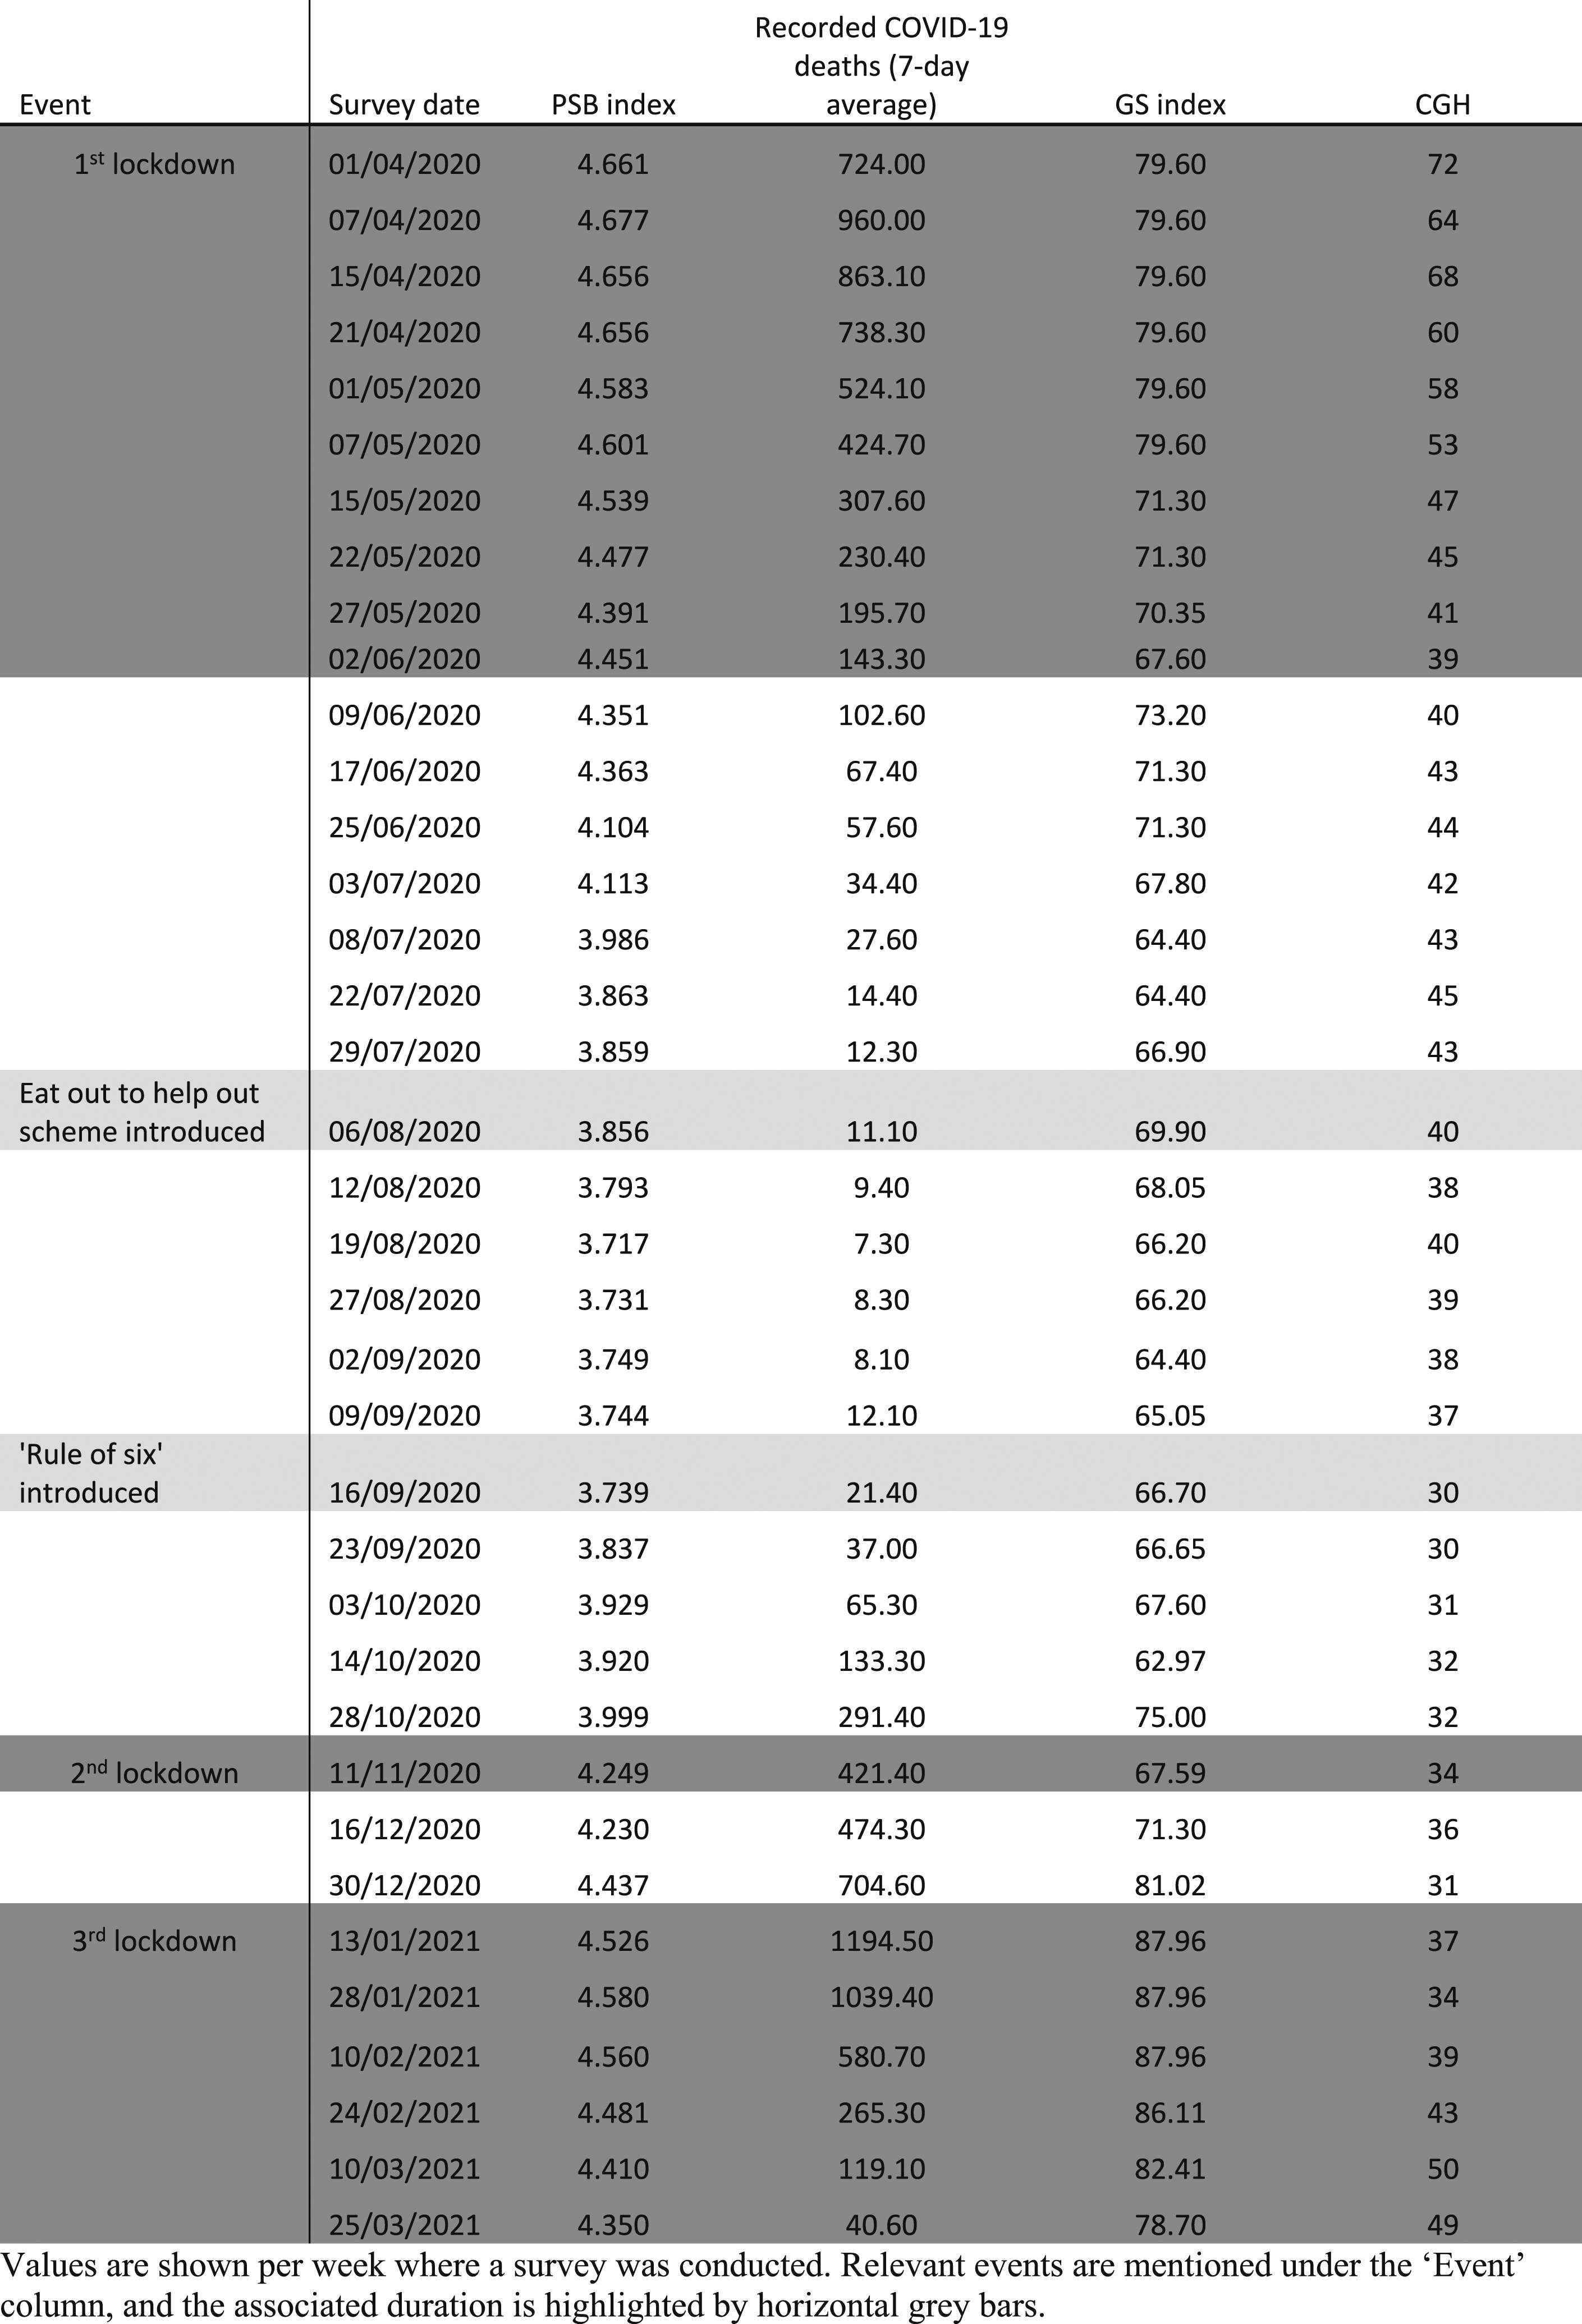
Variation of average preventative social behaviour (PSB) index, recoded COVID-19 deaths, government stringency (GS) index and confidence in government handling (CGH) across the duration of the study.
For a better visualisation of how the GS and PSB index scores have changed over time in comparison to when PSB was at its highest (on the week of the 7th April 2020), PSB and GS index scores during each week are shown as a percentage increase or decrease to their relative figures on the 7th April 2020, Figure 1(a). Overall, PSB and GS index scores were significantly associated (R = 0.785, p < .001) (Figure 1(b)). Relationship between government stringency (GS) and preventative social behaviour index (PSB) over time. a) Percentage change in PSB and GS compared to when PSB was at its highest in the week of 7th April 2020. b) Correlation between PSB and GS.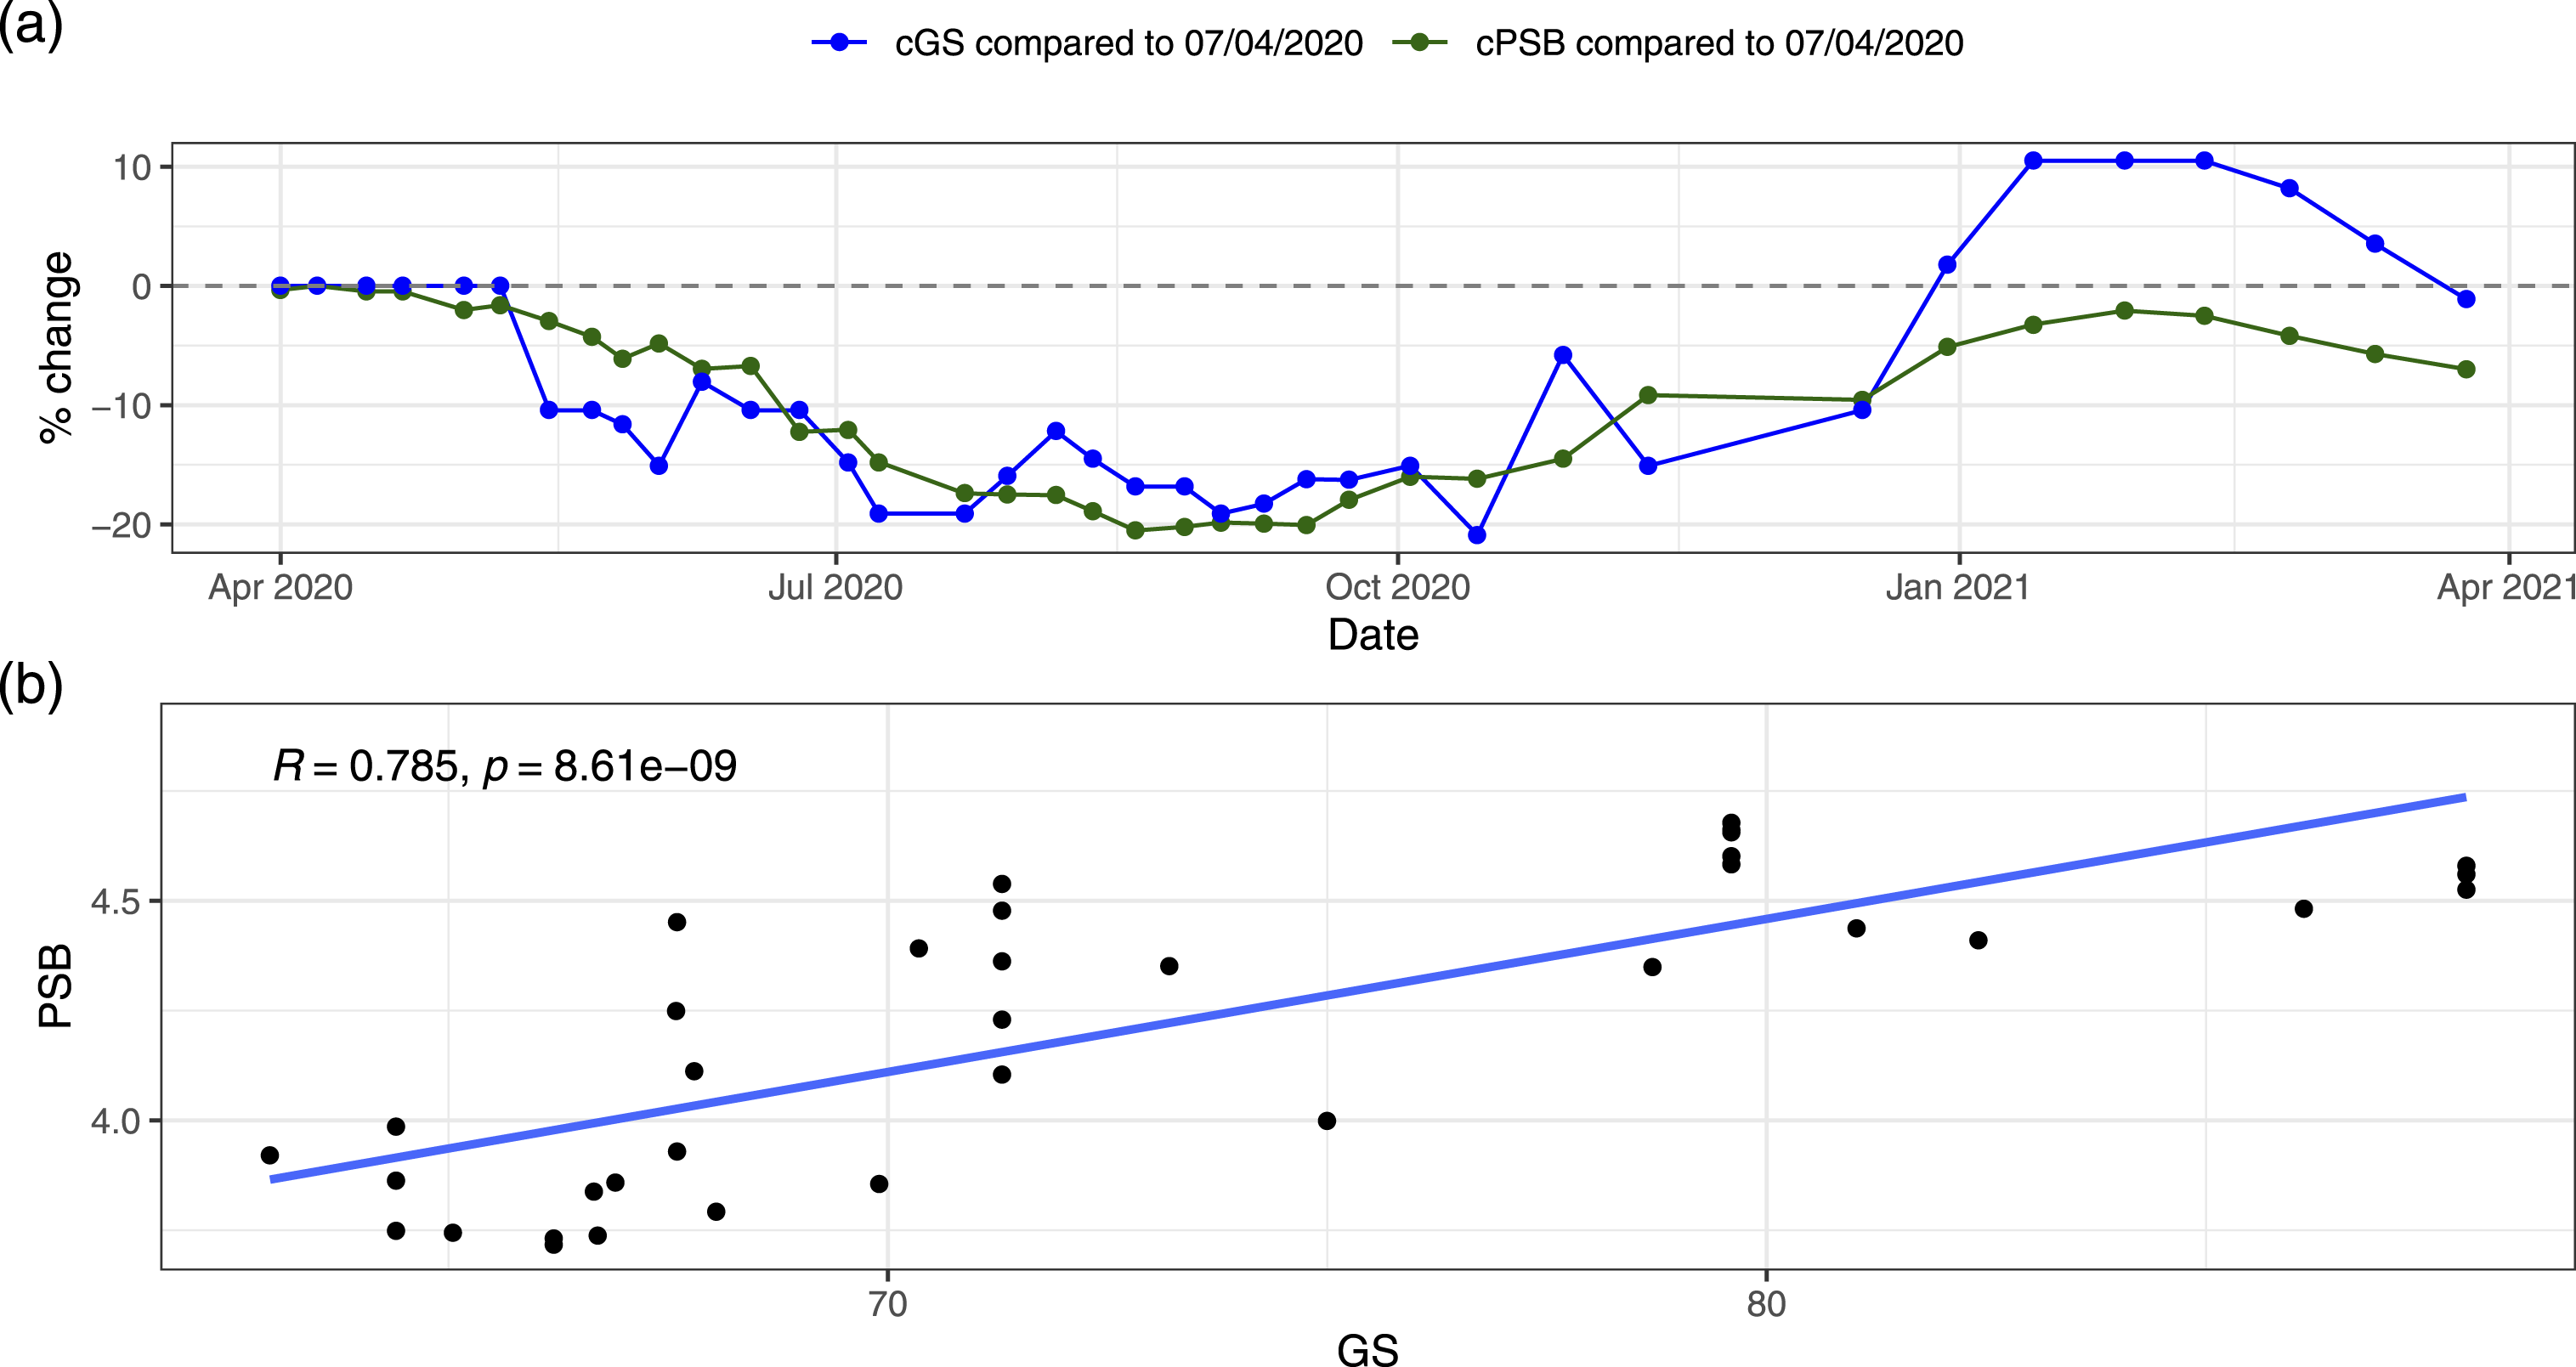
Associations with time, confidence in government and COVID-19 deaths.
During the first lockdown the CGH index score ranged between 39 and 72 and the lRCD between 143.30 and 960.00. During the second short lockdown, the CGH index score was 34 and the RCD 421.40. During the third lockdown the CGH index score ranged between 34 and 50 and PSB between 4.350 and 4.580. A detailed overview of the variation across time is provided in Table 3 and Figure 2. In April 2020, PSB index had peaked at 4.68 and reported COVID-19 deaths reached an initial peak at 960 deaths per day (7-day average). During this month public opinion on government handling of the pandemic steadily declined from 72 to 60% over the same month. Reported COVID-19 deaths peaked again in January 2021, reaching higher levels than in April 2020, with PSB index scores increasing alongside this, but never quite reaching the same levels as in April 2020 (PSB = 4.68). All four variables continued to show a general pattern of decline over time until September 2020. PSB index scores were at their lowest in the week of the 19th of August 2020, 2 weeks following the introduction of the ‘eat out to help out’ government scheme. This also coincided with the highest level of reported COVID-19 deaths of 1195 deaths per day (7-day average) on the week of 13th January 2021. This also coincided with the highest level of GS (87.96) and the second peak of PSB (4.58). Associations between preventative social behaviour index (PSB) and a) reported COVID-19 deaths (RCD), b) confidence in government handling (CHG), c) time and d) government stringency (GS) index.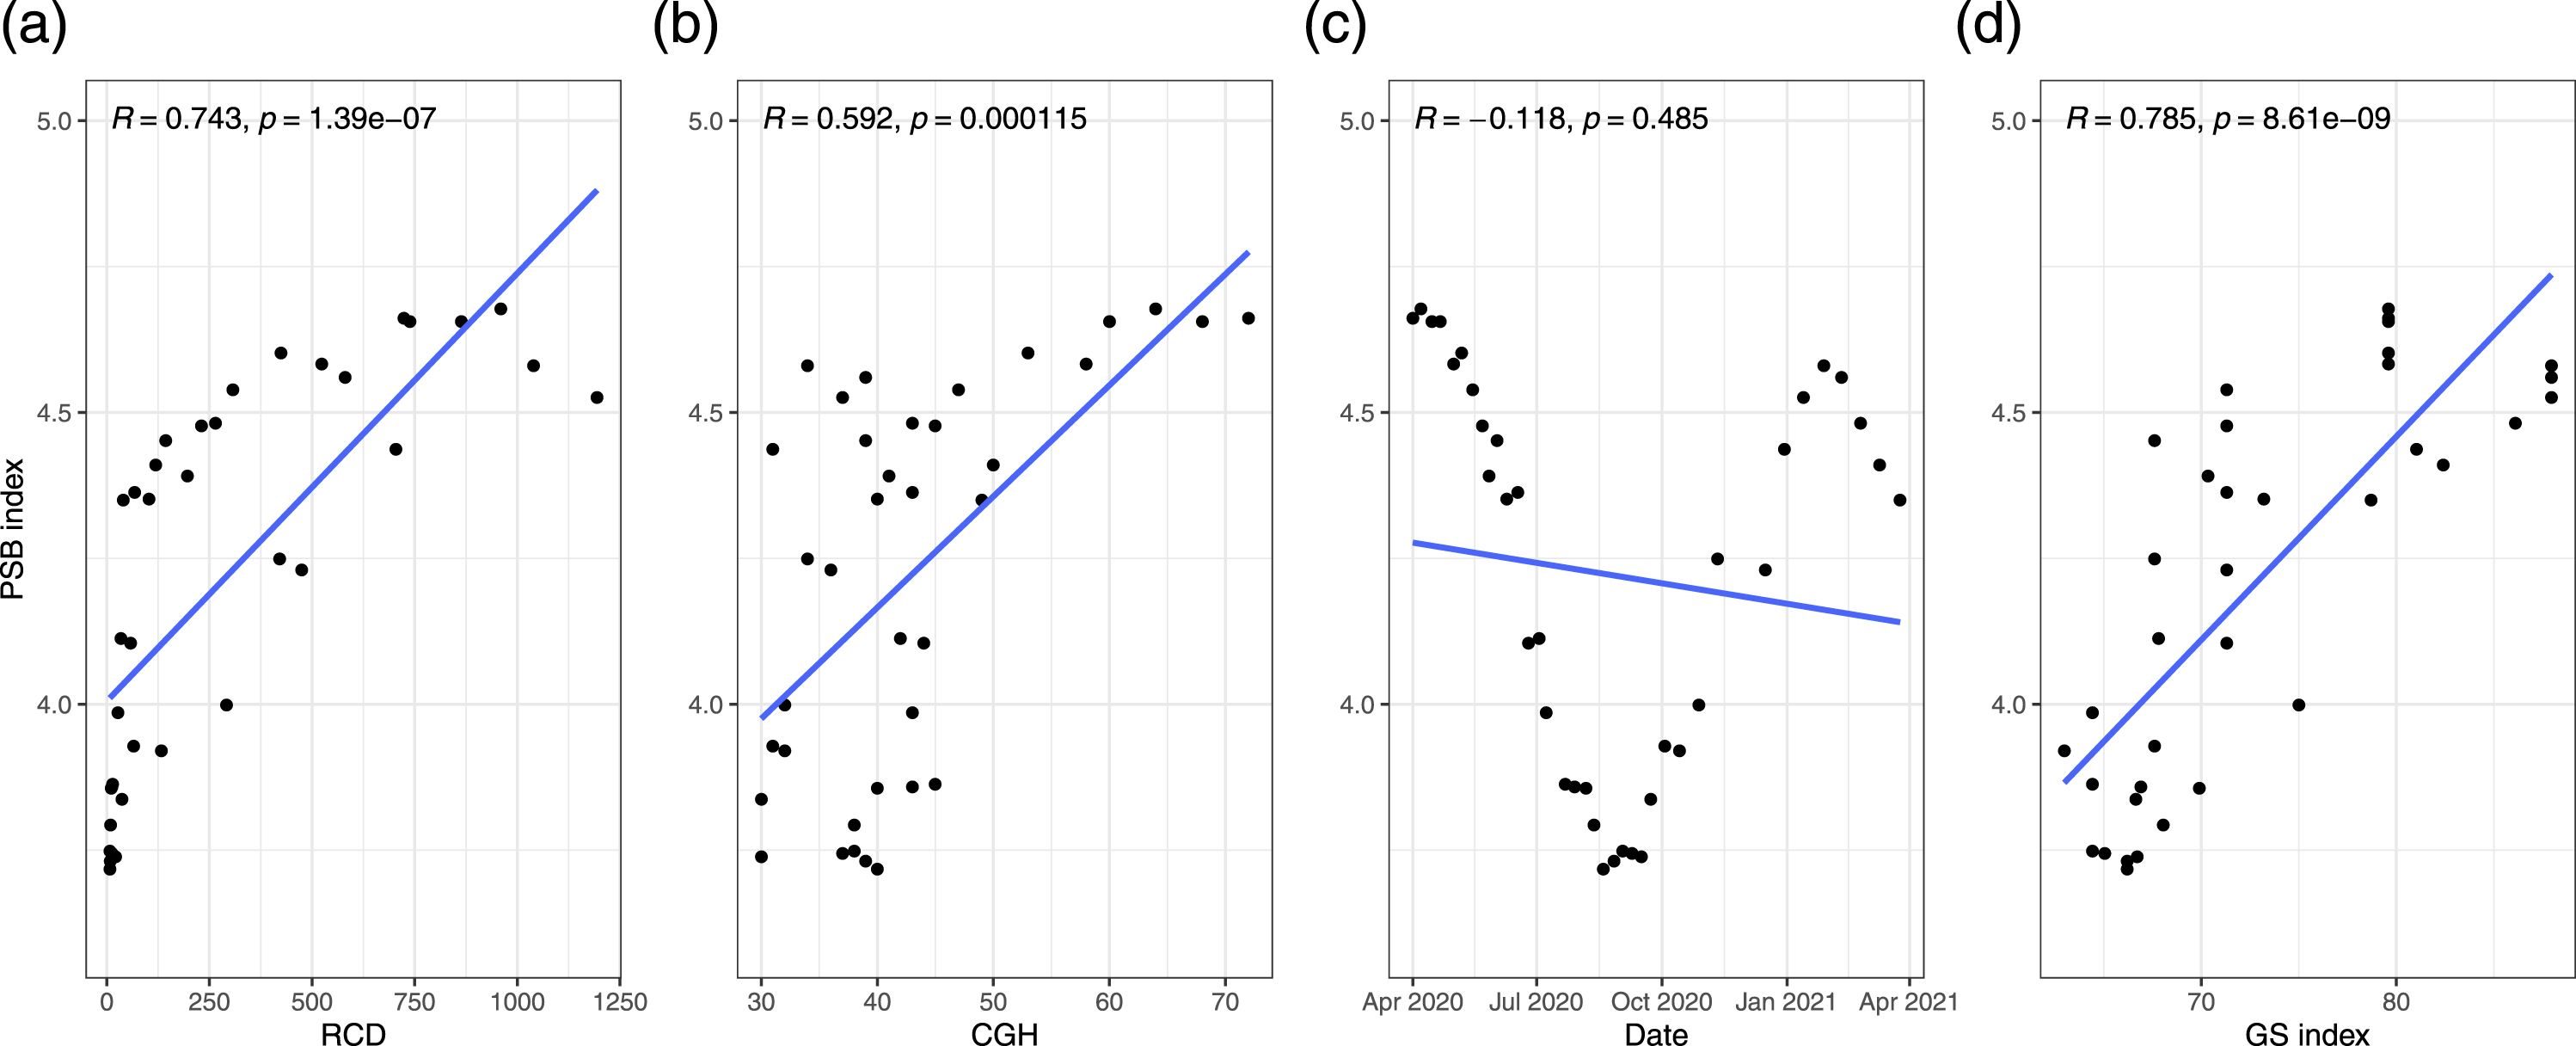
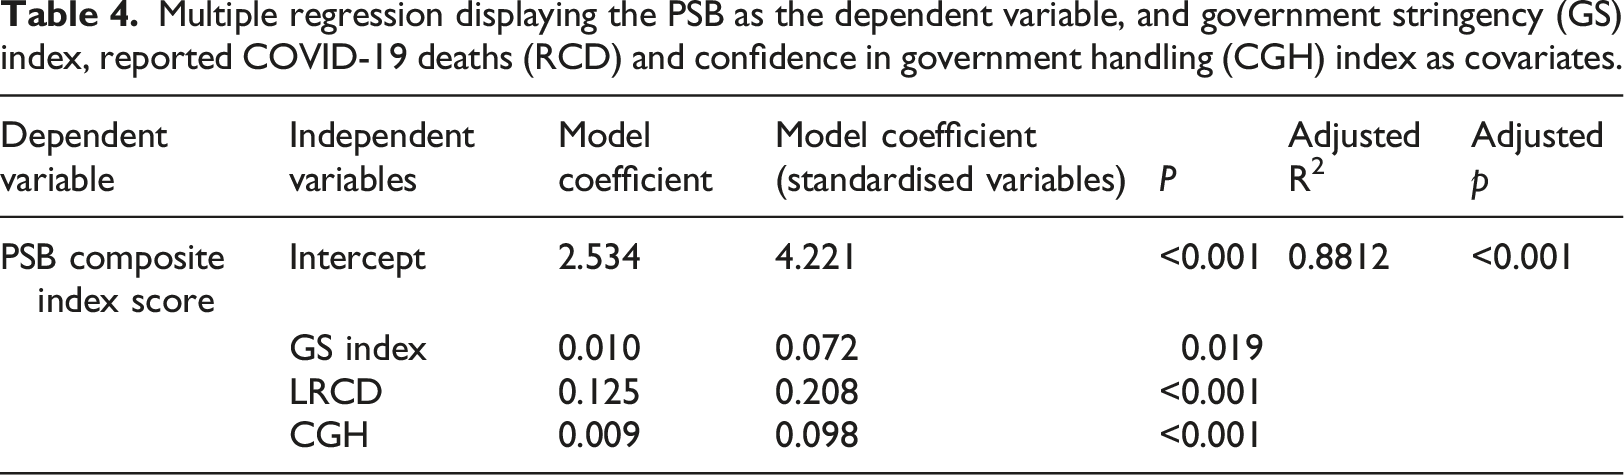
Significant associations were found between PSB and lRCD (R = 0.0.881, p < .001), CGH (R = 0.59, p < .001), and GS index (R = 0.79, p < .001)), but not with time (Figure 3). In a linear regression model controlling for the effect of RCD, CGH and GS, the association between PSB and GS (model coefficient 0.010, p < .019), RCD (model coefficient: 0.125, p < .001), and CGH (model coefficient: 0.009, p < .001) were significant and positive (Table 4). Although not included in the final model, the ‘time’ variable was not significantly associated with PSB when. Conducting a similar model but including standardised variables showed that RCD had a relative importance, compared to GS and CGH of 2.89 and 2.13 times, respectively; and CGH had a relative importance compared to GS of 1.35 times. Changes of ‘PSB index’ (blue), ‘GS index’ (grey), ‘recorded COVID-19 deaths, 7-day average’ (red) and ‘reported confidence in the government’s handling of the pandemic (CGH), percentage response – handling well/very well’ (green) over ‘time’. Five important events are also represented in the graph (A-E). A: 1st June 2020, 1st national lockdown measures eased. B: 3rd August 2020, ‘Eat out to help out’ government initiative launched. C: 6-22 September 2020, R value increases to 1.2, newer restrictions on public house openings and crowds (maximum 6 allowed to gather). D: 5th November 2020, second national lockdown imposed; E) 6th January 2021, third national lockdown measures imposed. Multiple regression displaying the PSB as the dependent variable, and government stringency (GS) index, reported COVID-19 deaths (RCD) and confidence in government handling (CGH) index as covariates.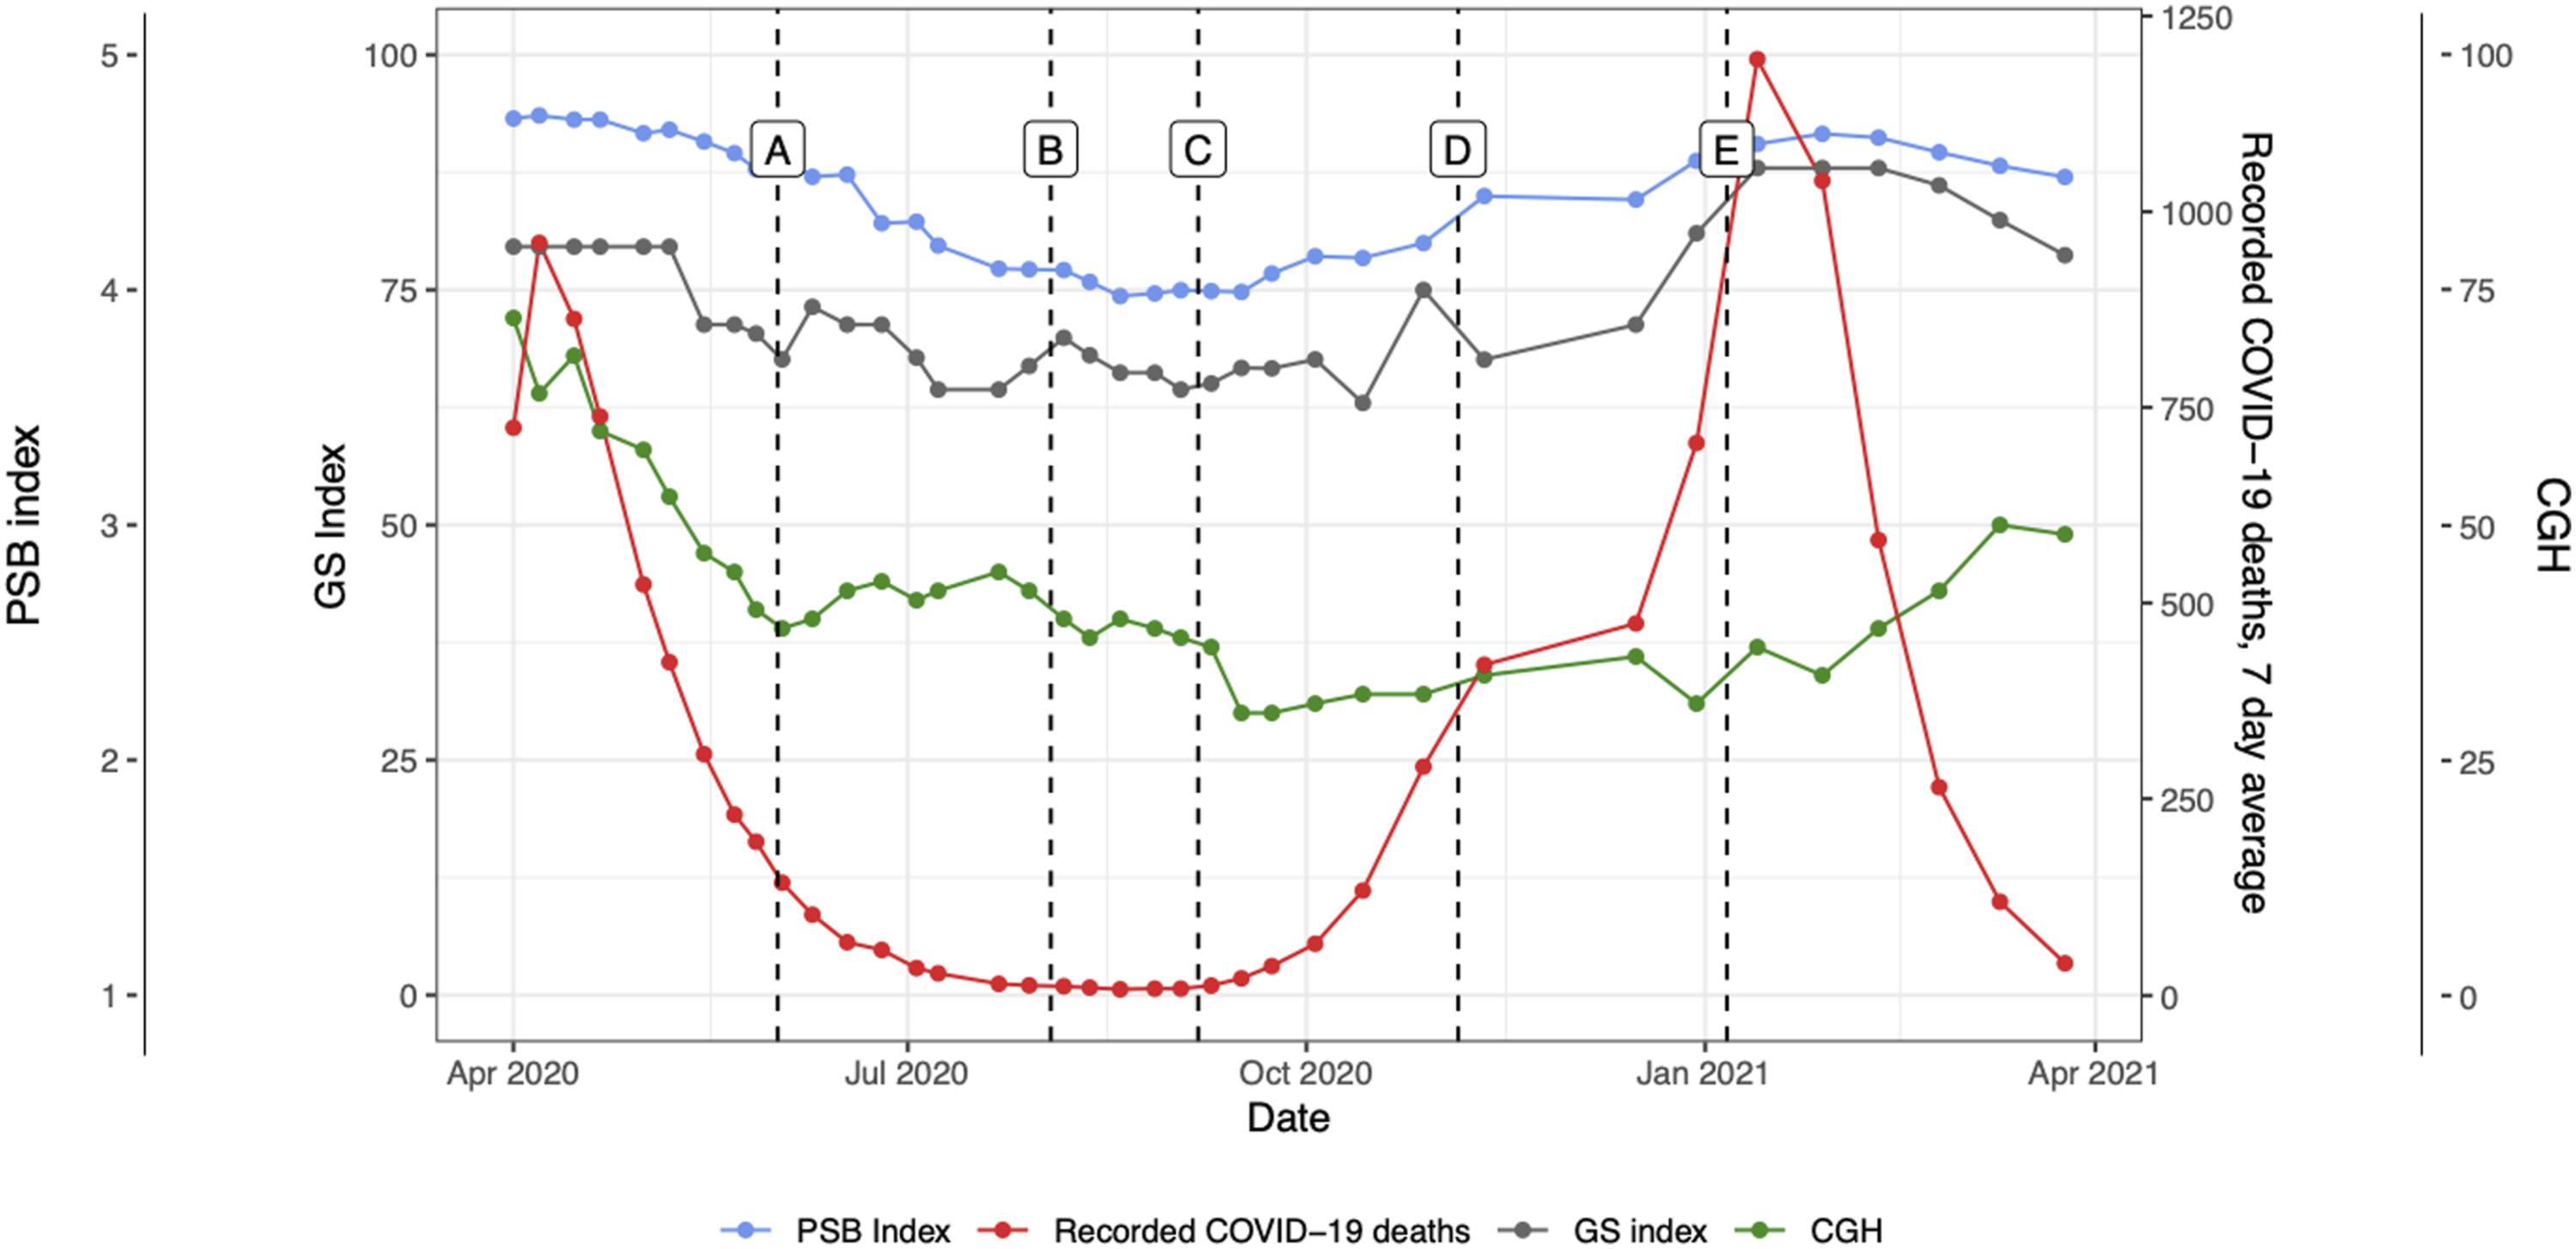
Discussion
Key findings
Our analysis provides some insights of the interplay between different metrics measuring peoples’ and the government’s actions during the COVID-19 pandemic. Preventative social behaviour and government stringency index scores were significantly and positively associated on multivariate linear regression analyses, suggesting that individuals adhered more to protective behaviours as the government imposed stricter measures. The number of reported COVID-19 deaths also showed a significant and positive association with the PSB index in the multivariate linear regression analysis. It is possible that individuals observed the changing number of COVID-19 related deaths during the pandemic as an indicator of the need to protect themselves and others, adopting more protective behaviours as the number of deaths increased. People’s confidence in the government’s handling of the pandemic also appeared to have a significant and positive association with preventative behaviours, suggesting that people adopted more measures to protect themselves if they approved of the government’s handling of the COVID-19 pandemic. However, our model suggests that RCD had a larger impact on peoples behaviours than either GS or CGH. These results can help understand what could have led to individuals adopting more preventative behaviours during the COVID-19 pandemic in the UK.
Comparison with previous literature
Our findings add to the growing evidence around the important relationship between the degree of government stringency and the adoption and maintenance of preventative social behaviours amongst the public.2,5,6,8,12,20 Preventative social behaviour levels rose with increases in government stringency index levels. However, government stringency appeared to have the lowest impact of all the variables we included in our model. Our findings oppose some of the literature that describe COVID-19 related policy fatigue, a reduction in the effectiveness of government stringency on preventative social behaviour over time. 7 Our results representing the percentage change in both preventative social behaviour and government stringency index scores over time, allow a more direct visual comparison between the two: in general, as government stringency scores dropped, the public was expected to relax on preventative social behaviour, as exemplified by the government initiatives to kickstart the service industry by incentivising the use, actively promoting the public to leave their homes and dine in public restaurants (i.e. ‘eat out to help out scheme’). 21 Therefore, a drop in preventative social behaviour in line with that of government stringency could suggest that the public is adhering aptly to government advice at both higher and lower stringency levels. A lack in the clarity of message may have contributed to the relative lack of importance of this variable compared to RCD in preventative social behaviour scores as individuals were unsure of which rules to follow.11,16
To our knowledge, no other research has followed the UK public’s behaviours over the course of the pandemic to reflect how preventative social behaviour may have altered in response to ongoing changes in stringency levels over time. The failure to reach the same preventative social behaviour index levels seen in April 2020 (4.68), in January 2021 with the highest level of stringency (87.96) may be explained by several theories. The rationale for the cautious and possibly delayed instigation of a national lockdown in the UK was in part due to the expected public exhaustion from lockdown and consequently eventual non-adherence to social distancing guidance. 22 A lack in the clarity of message may have contributed to the decline in PSB scores as citizens were unsure of which rules to follow.11,23 Rypdal et al’s modelling, suggested that the predicted second wave in Europe was more likely a consequence of intervention fatigue, a failure to reintroduce necessary interventions at an appropriate time. Countries which did so early were less likely to suffer the same level of fatalities, in the second wave, 24 further reinforcing the idea that stringent governmental behavioural policy continues to be effective in the reduction of COVID-19 cases. On February 14th, 2021, the UK had recorded over 3.84 million cases of COVID, with over 2.314 million individuals having received their first dose of the vaccine, despite this the preventative social behaviour index was as relatively high in the week of 28th January as it was in May 2020. This relatively high preventative social behaviour index score may reflect, among other situations, the UK’s general compliance to law and rules or the adherence to recommendations due to fear of punishment.22,25
Our model suggests that RCD (as a logarithm) was the factor that influenced PSB the most, having over double the relative impact of CGH and GS, indicating that the UK public tended to adopt higher levels of protective behaviours as COVID-19 deaths increased. This effect is likely due to the perceived increase in risk of COVID-19 infection. Previous literature 26 has identified positive effects of perceived risk of exposure to disease and preventative behaviours. These findings may also be explained by an inefficiency of government interventions to stop COVID-19 infections and subsequent deaths. However, it is possible that due to a possible time delay between policy implementation and its effect, these results could also be interpreted as deaths from COVID-19 having a more rapid impact on protective behaviours compared to GS or CGH. Future analysis could be focused around understanding the time to effect of different policies.
Similar theories may also provide an understanding in explaining the significant but relatively small influence public opinion may have had on the preventative social behaviour index scores within our model. In May 2020, the preventative social behaviour index scores began to decline; however, the GS index scores however remained constant at 79.6 for a further 2 weeks. Furthermore, the PSB index managed to reach a peak at the peak of the second national lockdown, comparable to the second week of May 2020. One explanation for this may be that at the height of the first national lockdown, the effect of ‘rallying behind the flag’ was at its highest, as suggested by the level of confidence in the government's response to the COVID-19 (60%–72%). 27 As the confidence in the governments’ response to the COVID-19 pandemic dropped and in turn the sentiment of uniting together, the ability to achieve the same record high preventative social behaviour may have diminished.
Limitations
The limitations of this study are those associated with an observational study using publicly available data on which our analysis has been made. As such, our findings do not infer causality, rather highlight the relationship between our examined variables and the strengths of such relationships. Furthermore, our analysis is built on several assumptions. Firstly, all behaviours within the preventative social behaviour index are weighted equally, and therefore contribute equally, to the level of caution we have recorded as the preventative social behaviour index. Secondly, the YouGov global survey responses are weighted by YouGov using sociodemographic data to ensure they are nationally representative. However, an average of only 1006 individuals were questioned in each wave, which may not have been an adequate sample in reliably representing an entire nation. The responses were self-reported and therefore will be allied to its associated bias. 27 Due to the correlation in some of our metrics (i.e. PSB and GS) it is possible that the effective sample size in our regression analysis is lower than expected and thus has less power.
Moreover, numerous complex variables in determining preventative social behaviour have been outlined within the literature, we however chose to review four: time, government stringency, confidence in government handling of the pandemic and reported COVID-19 deaths. It may be argued that further evaluation of specific demographics such as age, gender, employment, and mental health status may be necessary in evaluating changes in preventative social behaviour, and these should be further explored in future research. 28
Previous literature has shown how data can be used to investigate peoples’ behaviours, such as with the use of clinical notes to identify psychiatric stressors, 29 using call logs from a mental health and wellbeing helpline to identify behaviour patterns 30 or using Twitter data to assess mental health of sexual and gender minorities. 31 Our work showcases the use of survey data in the context of behaviour analysis. One key advantage of the data used in our analysis is that they were collected over a year, and can show how peoples’ behaviours changed over time, however, future studies could explore the use of different algorithms to further identify time-dependant insights.
Implications for policy
The relationship of government stringency on COVID-19 related deaths has been examined at length, however little research has evaluated the relationship between government stringency and the underlying facets which it has been designed to alter to reduce COVID-19 related deaths, the public's behaviour. This research allows us to appreciate a plausible relationship between changes in GS and PSB demonstrating relatively high levels of adherence to government stringency levels over time. Several theories have been postulated with regards to the efficacy of non-pharmaceutical interventions over time, however our findings would suggest that adherence to such interventions remains relatively high, even in the second wave of the pandemic in the UK and therefore the use of increasing government stringency as an intervention against the spread of COVID-19 may continue to be an effective intervention in the future should it be required.
Conclusion
Preventative social behaviour and government stringency index scores were significantly and positively associated, suggest that government stringency is an effective tool in promoting preventative social behaviour. There may have been new interventions which could have improved (increase in police fines) or worsened adherence (increase in vaccinations), and future research efforts should address a more nuanced evaluation of the individual impact, and interplay, of the interventions adopted in response to the COVID-19 pandemic. Overall, our findings can be used to improve pandemic preparedness and contribute to the development of evidence-based policies in the context of future threats.
Footnotes
Declaration of conflicting interests
The author(s) declared no potential conflicts of interest with respect to the research, authorship, and/or publication of this article.
Funding
The author(s) received no financial support for the research, authorship, and/or publication of this article.