
Abstract
This paper employs the Analytical Hierarchy Process (AHP) to enhance the accuracy of differential diagnosis for febrile diseases, particularly prevalent in tropical regions where misdiagnosis may have severe consequences. The migration of health workers from developing countries has resulted in frontline health workers (FHWs) using inadequate protocols for the diagnosis of complex health conditions. The study introduces an innovative AHP-based Medical Decision Support System (MDSS) incorporating disease risk factors derived from physicians’ experiential knowledge to address this challenge. The system’s aggregate diagnostic factor index determines the likelihood of febrile illnesses. Compared to existing literature, AHP models with risk factors demonstrate superior prediction accuracy, closely aligning with physicians’ suspected diagnoses. The model’s accuracy ranges from 85.4% to 96.9% for various diseases, surpassing physicians’ predictions for Lassa, Dengue, and Yellow Fevers. The MDSS is recommended for use by FHWs in communities lacking medical experts, facilitating timely and precise diagnoses, efficient application of diagnostic test kits, and reducing overhead expenses for administrators.
Keywords
Introduction
Decision-making is a systematic process that helps people choose the best option from numerous alternatives and various organizations rely on decision support systems (DSSs) to improve decision-making activities. Multi-criteria decision analysis (MCDA) techniques are imperative tools utilized in developing DSSs, focused on aiding policymakers to choose the best alternative that achieves a given goal based on considered criteria.1–3 According to Eltarabishi et al., 4 the ability to break down complex problems into simplest forms makes these methods the most recognized tools for handling decision-making problems. MCDA methods aid decision-making by considering multiple criteria, 5 delineating conditions, their importance, and influence.6,7 Abdullah et al. 8 defines these methods as techniques for evaluating and selecting alternatives based on various criteria. In healthcare, selecting an appropriate MCDA method is crucial for intelligent systems aiding medical decisions.9,10 Among some well-known MCDA methods such as Technique for Order of Preference by Similarity to Ideal Solution (TOPSIS), VlseKriterijumskaOptimizacijaIKompromisnoResenje (VIKOR), Analytical Hierarchy Process (AHP), Analytic Network Process (ANP); Simple Multi-attribute Rating Technique (SMART), Measuring Attractiveness by a Categorical Based Evaluation (MACBETH), ELimination Et ChoixTraduisant la REalitè (ELECTRE), Preference Ranking Organization Method for Enrichment Evaluations (PROMETHEE), Evaluation of Mixed Data (EVAMIX), Evidence and Value: Impact on DEcisionMaking (EVIDEM), Multi-Attribute Utility Theory (MAUT) and AHPSort, 11 the AHP was chosen in this study due to its effectiveness and suitability for group decision-making,12–14 providing structured, comprehensive assessments of decision variables’ importance.15–17
The incessant migration of healthcare workers from developing countries, such as Nigeria, to developed countries, has led to a severe dearth of health workers with antecedent negative consequences. This shortage of physicians has resulted in the training and employment of non-physician practitioners called community health workers or Frontline Health Workers (FHWs) for basic medical care delivery. FHWs in Nigeria use National Standing Orders, a written protocol as a guide to diagnose and treat common diseases at the primary care level. The works in Refs. 18 and 19 define a standing order (SO) as a procedure for identification of diseases as well as relevant treatments in the absence of a doctor by an authorized non-physician health worker. In multi-symptom, multi-disease situations, these FHWs lack adequate resources to carry out timely and accurate diagnosis with accomplishment of desired efficiency. Thus, the diagnostic process must be optimized to handle these multi-symptom, multi-disease conditions, especially for febrile illnesses.
Most tropical febrile diseases are confusable as they share a common manifestation or symptoms, making it difficult for physicians and FHWs to effectively diagnose. 20 The management of high-burden and confusable febrile diseases requires an intelligent medical DSS (MDSS) as a tool for early detection and precise diagnosis of a patient’s health condition. This could lengthen the life span and enhance the well-being of the impacted population or group. This study develops an AHP-based multi-disease, multi-symptom tool for early and accurate differential diagnosis of febrile diseases by FHWs to increase healthcare access for people living in rural and resource-poor communities. Since it is challenging for physicians to decide on an illness based on the symptoms, our MDSS recommends the efficient utilization of Rapid Diagnostic Test (RDT) kits for diagnosing diseases. The febrile diseases considered in this study are some of the common diseases in Nigeria such as malaria, lower and upper respiratory tract infections, tuberculosis, acquired immunodeficiency syndrome (AIDS) and human immunodeficiency virus (HIV), enteric fever, lower and upper urinary tract infections, lassa fever, dengue fever and yellow fever. 21 Anopheles mosquitoes transmit plasmodium parasites, causing malaria with symptoms like fever, headache, and fatigue. Antimalarial drugs and antimalarial chemoprophylaxis are some pharmaceutical interventions that combat malaria,22,23 while interventions like indoor spraying and insecticide-treated bed nets are non-pharmaceutical. 24 Enteric fever caused by Salmonella Typhi, leads to severe symptoms like abdominal pain and can be fatal if untreated. Treatments include antibiotics, vaccines, and hygiene improvements.25,26 HIV weakens the immune system, leading to opportunistic infections. Antiretroviral therapy and safe sex education help manage HIV.27,28 Respiratory tract infections (RTIs) affect the upper and lower airways, with symptoms such as cough and chest pain. RTIs are caused by bacteria, viruses, and fungi. Treatments include antibiotics, antiviral drugs, vaccination, and respiratory hygiene.29–31 Urinary tract infections (UTIs) result from bacterial entry into the urethra, causing symptoms like abdominal pain and frequent urination. The works in Refs. 32–34 report that antibiotics and personal hygiene practices are good treatment options for UTIs.
This study considers risk factors contributing to tropical diseases, acknowledging their complexity and shared risk factors as in Uzoka et al. 35 The MDSS will aid physicians, especially in remote areas, but its effectiveness can be boosted with user-friendly software and mobile health app considerations for data security. No previous research has examined diagnosing and treating eleven febrile diseases using an MDSS. The following is a list of our specific contributions to this paper. (a) gathering data from patients and physicians to create datasets; (b) employing data analytics to construct a multi-disease, multi-symptom AHP model; (c) devising a linear mathematical model, aggregate diagnostic factor index (ADFI), for disease assessment triggered by AHP; (d) developing an AHP-based MDSS for differential diagnosis; (e) setting medical expert thresholds for disease prediction; (f) designing a spreadsheet dashboard for displaying results; (g) assessing the MDSS’s performance against laboratory tests for diagnostic accuracy, reliability, and effectiveness.
The remaining content is arranged as follows: A Section on Related Works examines cutting-edge methods for creating MDSSs for illness diagnosis and therapy. The experimental design of the proposed AHP-based MDSS is presented in the methodology section using field datasets from physicians’ experience, and the discussion of results section discusses the results and their implications after comparing them with the diagnoses of medical experts and validated laboratory test results. The article is concluded with suggestions for more research.
Related works
MCDA methods in healthcare
Healthcare demands swift, accurate decision-making with less error. 4 Analyzing interventions and MCDA methods highlights their importance in healthcare problem-solving. Reviews on MCDA in healthcare often focus on supporting investment decisions, health technology assessment (HTA), coverage determinations, authorization, medical automation, performance measurement, disease management, research funding allocation, and more. 36 Alharbi et al. 1 evaluated healthcare information systems’ efficiency using a combined TOPSIS and Fuzzy AHP framework, identifying access control and software security as vital factors. Ayan et al. 37 discussed various weighting techniques for MCDA tasks in healthcare, including entropy, AHP, Level Based Weight Assessment (LBWA), CRiteria Importance Through Intercriteria Correlation (CRITIC), Full Consistency Method (FUCOM), Criterion Impact Loss (CILOS), Best Worst Method (BWM), and Method based on the Removal Effects of Criteria (MEREC). These techniques can be divided into three groups: objective, subjective, and hybrid. Hybrid techniques blend subjective and objective approaches, while subjective methods rely on decision-maker-assigned weights and objective methods employ mathematical algorithms. Selecting an appropriate method poses challenges, with objective methods offering reproducible results and greater accuracy, particularly in complex decision scenarios with numerous criteria. They are recommended for situations where expert input is difficult to obtain.
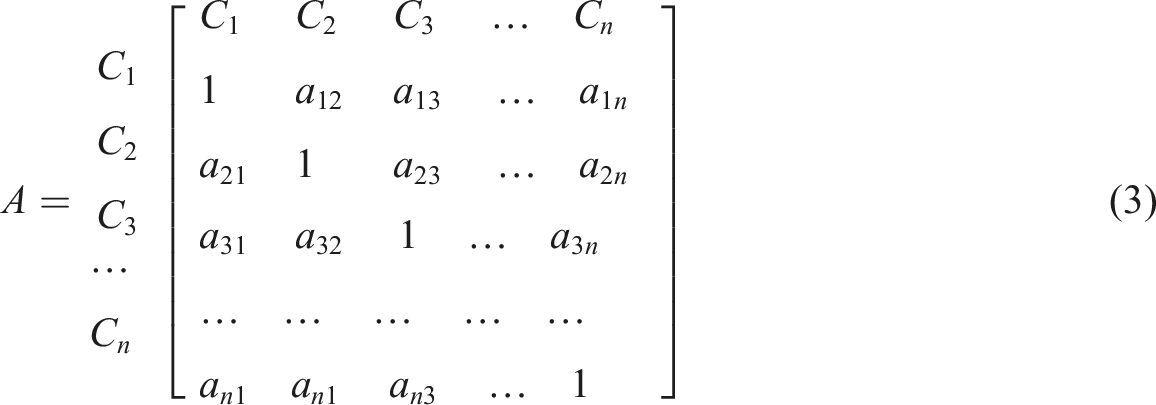
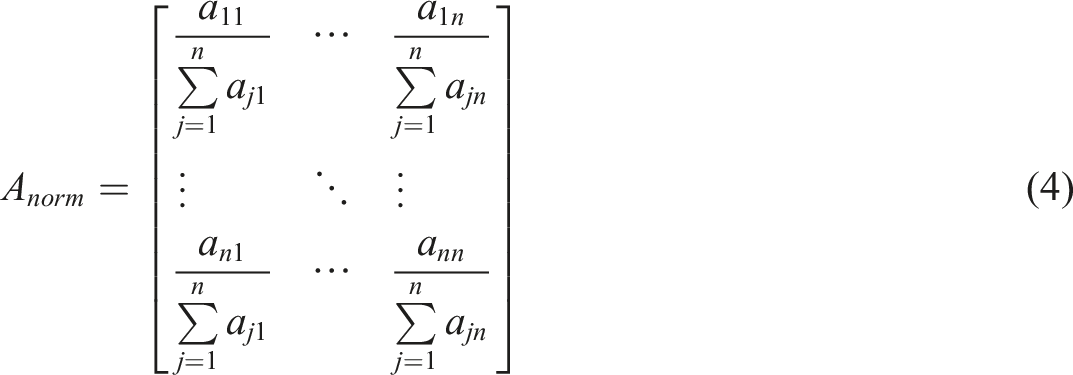
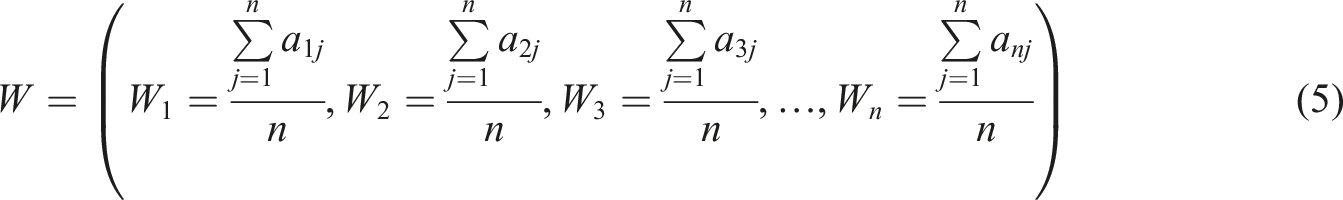
The BWM is a decision-making technique focused on identifying the best and worst criteria within a set. In Refs. 38, BWM was observed to be suitability for health decisions due to its adaptability and consistent outcomes, suggesting its growing preference in health applications. However, Pamučar et al. 39 pointed its limitations in scenarios with multiple best or worst criteria. The FUCOM algorithm, requiring fewer pairwise comparisons, is used in various healthcare evaluations, such as healthcare waste treatment selection and pandemic resilience.40–42 Despite its efficiency, FUCOM’s fewer comparisons may hinder conveying subtle preference variations, potentially leading to less accurate decisions. Similarly, the LBWA, another subjective-based method, ranks criteria by relative importance, offering a solution for decision-makers struggling with assigning precise weights. Although LBWA is relatively new, it finds application in healthcare decision-making, albeit with fewer comparisons, akin to FUCOM.39,43,44 Objective-based methods such as AHP, entropy, CRITIC, CILOS, and MEREC are employed in decision-making. CRITIC identifies criteria contrasts using correlation coefficients and standard deviations. CILOS adjusts criteria significance as they approach ideal values, overcoming entropy method’s limitations. According to Ref. 45, MEREC calculates weights based on criteria’s removal effects on alternatives, aiding decision-makers in excluding specific criteria. Unlike other methods, MEREC focuses on exclusion rather than inclusion principle. 46 AHP constructs comparison matrices to determine criteria weights, aggregating eigenvectors to gauge alternatives’ relative importance.
MCDA methods in healthcare.
MCDA methods for disease diagnosis and treatment
In under-developed countries like Nigeria, confusable tropical disease symptoms pose treatment challenges due to limited healthcare infrastructure.67,68 Asuquo et al. 69 observed there is continual increase in patients’ waiting times and hospital stays, especially in remote areas. Implementing a clinical diagnostic system can provide swift, accurate decision-making tool for nursing staff and less-experienced physicians, improving disease severity evaluation and prompt treatment, crucial where doctors and lab. tests are scarce. This is capable of reducing mortality, morbidity rates, and enhancing overall disease control.
Summary of previous studies on MCDA methods for disease diagnosis and treatment.
Methodology
Study design and sampling method
The methodology deployed in this study for the task of febrile disease diagnosis is presented in Figure 1. Before formulating the AHP structure and developing its model, a field study in selected states in Nigeria’s Niger Delta region—Rivers, Cross River, Akwa Ibom, and Imo—resulted in the creation of a febrile disease dataset. Data were collected using two instruments validated by domain experts with the use of the Open Data Kit app.
94
Sixty-two (62) doctors working in secondary and tertiary care facilities—both public and private—who specialize in diagnosing febrile illnesses provided their experiential knowledge to one data source. A patient’s consultation tool, intended to help doctors gather information about their symptoms and record initial diagnoses along with recommendations for further investigation, was the other source of data. The patients’ dataset was used as a baseline to test the performance of the AHP model developed from the physicians’ experiential knowledge to assess the degree of precision in the febrile disease differential diagnosis. Study methodology for febrile disease diagnosis.
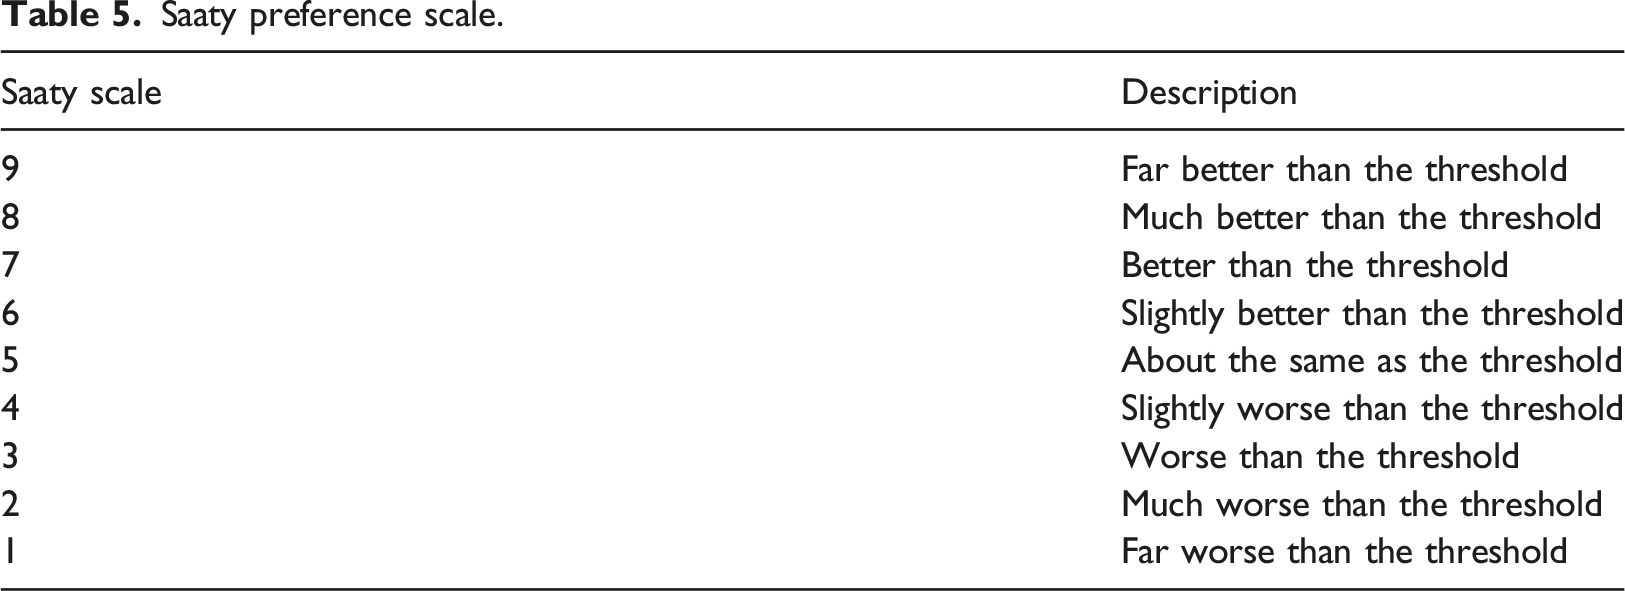
The sections of the physician knowledge extraction tool are A, B, and C. Section A contains demographic information of physicians while Section B provides physicians the opportunity to share their knowledge on the causative relationships between each of the diseases and associated symptoms. The causative relationships were rated on a linguistic scale of 1-5 for none, low, moderate, high, and very high, respectively. The instrument also provided an opportunity for the physicians to indicate their level of confidence in the rating on a scale of 1-10, where a confidence level of 1 denotes the lowest and a level of 10 the highest. In this study, we recognized the possibility that genetics, lifestyle, and exposures could predispose individuals to some of these diseases. 35 Section C gives doctors the chance to assign a numerical value (1 = No effect, 2 = Weak effect, 3 = Moderate effect, 4 = Strong effect, 5 = Very strong effect) to each risk factor for the disease under consideration, such as exposure to mosquito bites, genetic conditions, high cholesterol, high blood pressure, and travel to endemic regions. These risk factors were captured during patient consultation and became a component of the decision support filter of our diagnostic model. The identified symptoms became criteria while the diseases became alternatives. The study goal is to perform differential diagnosis of eleven febrile diseases with the possibility of uncovering co-morbidity.
Data analysis
Demographic profile of physicians
Location, age, gender, and experience distribution of physicians.
Sampling distribution of the population mean of physicians’ assertions
Interrelationship connecting malaria symptoms and their confidence level.
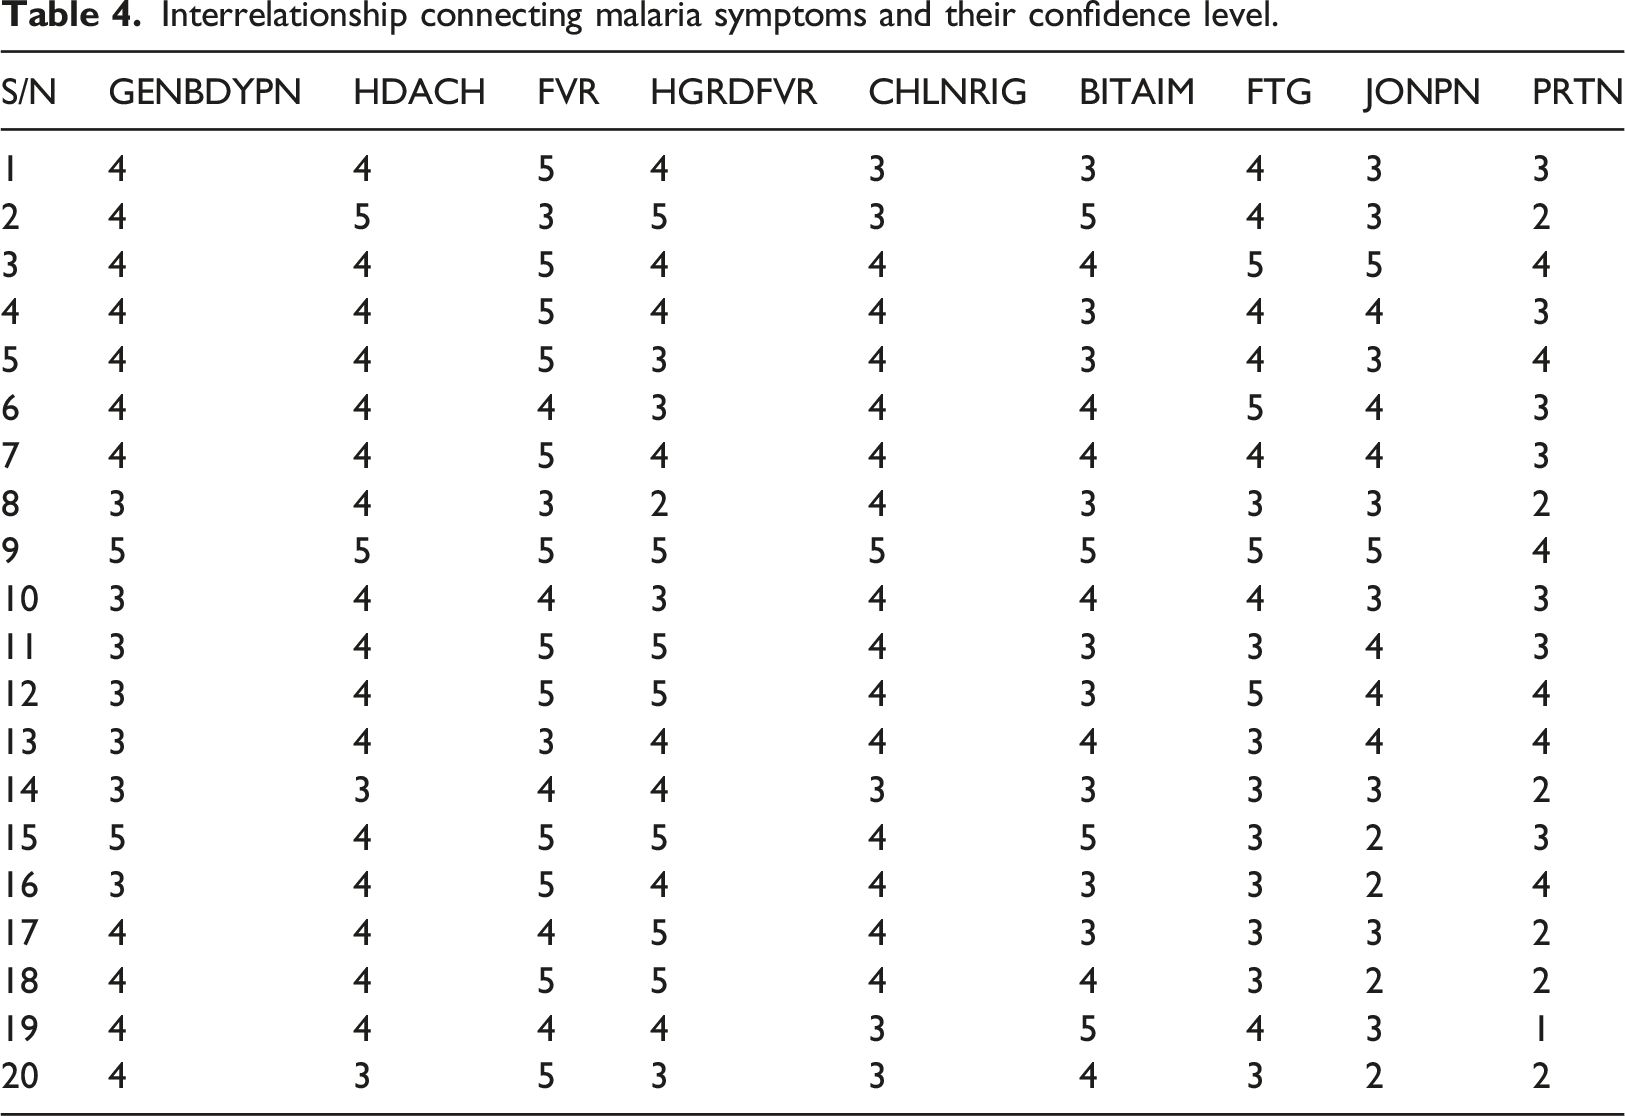
Medical researchers commonly employ parametric tests to accurately estimate data with greater statistical power. They rely on the Central Limit theorem (CLT) to assume the population’s probability distribution. CLT posits that with a sufficiently large sample size from a population of known variance, the sampled variables’ mean will approximate the population mean. Moreover, these samples tend to follow a normal distribution, with variances approaching that of the population as sample size increases. Mathematically, CTL states that, if 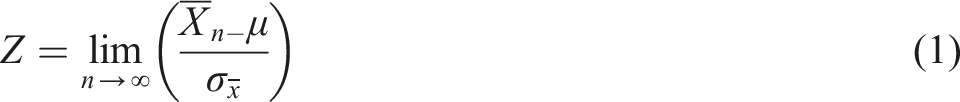

Saaty preference scale.
AHP modeling for febrile disease diagnosis
Conceptual disease-symptoms modeling
An exploratory analysis of the physicians’ dataset reveals a total of forty-three (43) symptoms and eleven (11) diseases (see Table A.1), out of which nausea and vomiting (NUSNVMT), nausea (NUS), vomiting (VMT) have been changed to NUS-VMT; reducing the symptoms to 41 in all. So, a patient with a symptom of nausea or vomiting or both is represented as NUS-VMT. From our analysis, twenty (20) symptoms were interrelated with two or more febrile diseases, presented in Table A.2a as a multi-disease-symptom model. Table A.2a shows that while FVR is a symptom related with all the 11 diseases; FTG and HGDFVR were related with 8 of the diseases; NUS-VMT and LWGDFVR each with 5 of the diseases; CGH, CHSPN, HDACH, SRTRT, and CHLNRIG each with four of the diseases; BLDFASG, DIFBRT, and JNTNMSCPN each related with three of the diseases; BLDYURN, CLYDURN, GENBDYPN, NGTSWT, WGTLS, WHZ, and ADPN each with 2 of the diseases. However, the single disease-symptom model in Table A.2b indicates the symptom that contributes to triggering the diagnosis of a specific disease. For instance, for a patient with a symptom of YELOEY, the YELFVR disease model will be triggered for diagnosis results and treatment while TB disease will be triggered for LMP symptom, and so on. A combination of the two disease-symptoms model further indicates that a patient with symptoms of ADPN, FTG, FVR, GENBDYPN, HDACH, JONPN, BITAIM, PRTN, and/or HGDFVR will cause the MAL disease model to be triggered while symptoms like CGH, FVR, HGDFVR, LWGDFVR, SRTRT, CTRH, FOLBRT, and/or EPNOTG will trigger the URTI disease model.
Intelligent disease diagnosis system with AHP model
The architectural design of the MDSS for febrile disease diagnosis is shown in Figure 2, with medical experts, a knowledge base, a diagnostic system, decision support filters, an AHP diagnostic engine, a patient, FHW, and a user interface as major components. The user interface enables a FHW to input appropriate information obtained from interaction with a patient such as symptoms and risk factors into the diagnostic system. Structured experiential knowledge of the study domain obtained from medical experts is represented in the knowledge base. The patient examination and test results, along with the risk factors that make a patient more susceptible to these febrile diseases, are adequately included in the knowledge base. The decision support filters in the diagnostic system use this data to mimic the actions of a skilled physician utilizing the AHP diagnostic engine to initiate the relevant individual febrile disease models as a predicted result for additional examination. The AHP diagnostic engines help identify suspected illnesses based on patient symptoms and risk factors, allowing doctors to recommend the best course of action. They also differentiate between the symptoms of feverish illnesses. The FHW can as well visualize the system’s predicted diagnosis on the user interface for prompt and precise healthcare decision-making, medical advice, and treatment. System architecture of the AHP-based MDSS for febrile disease diagnosis.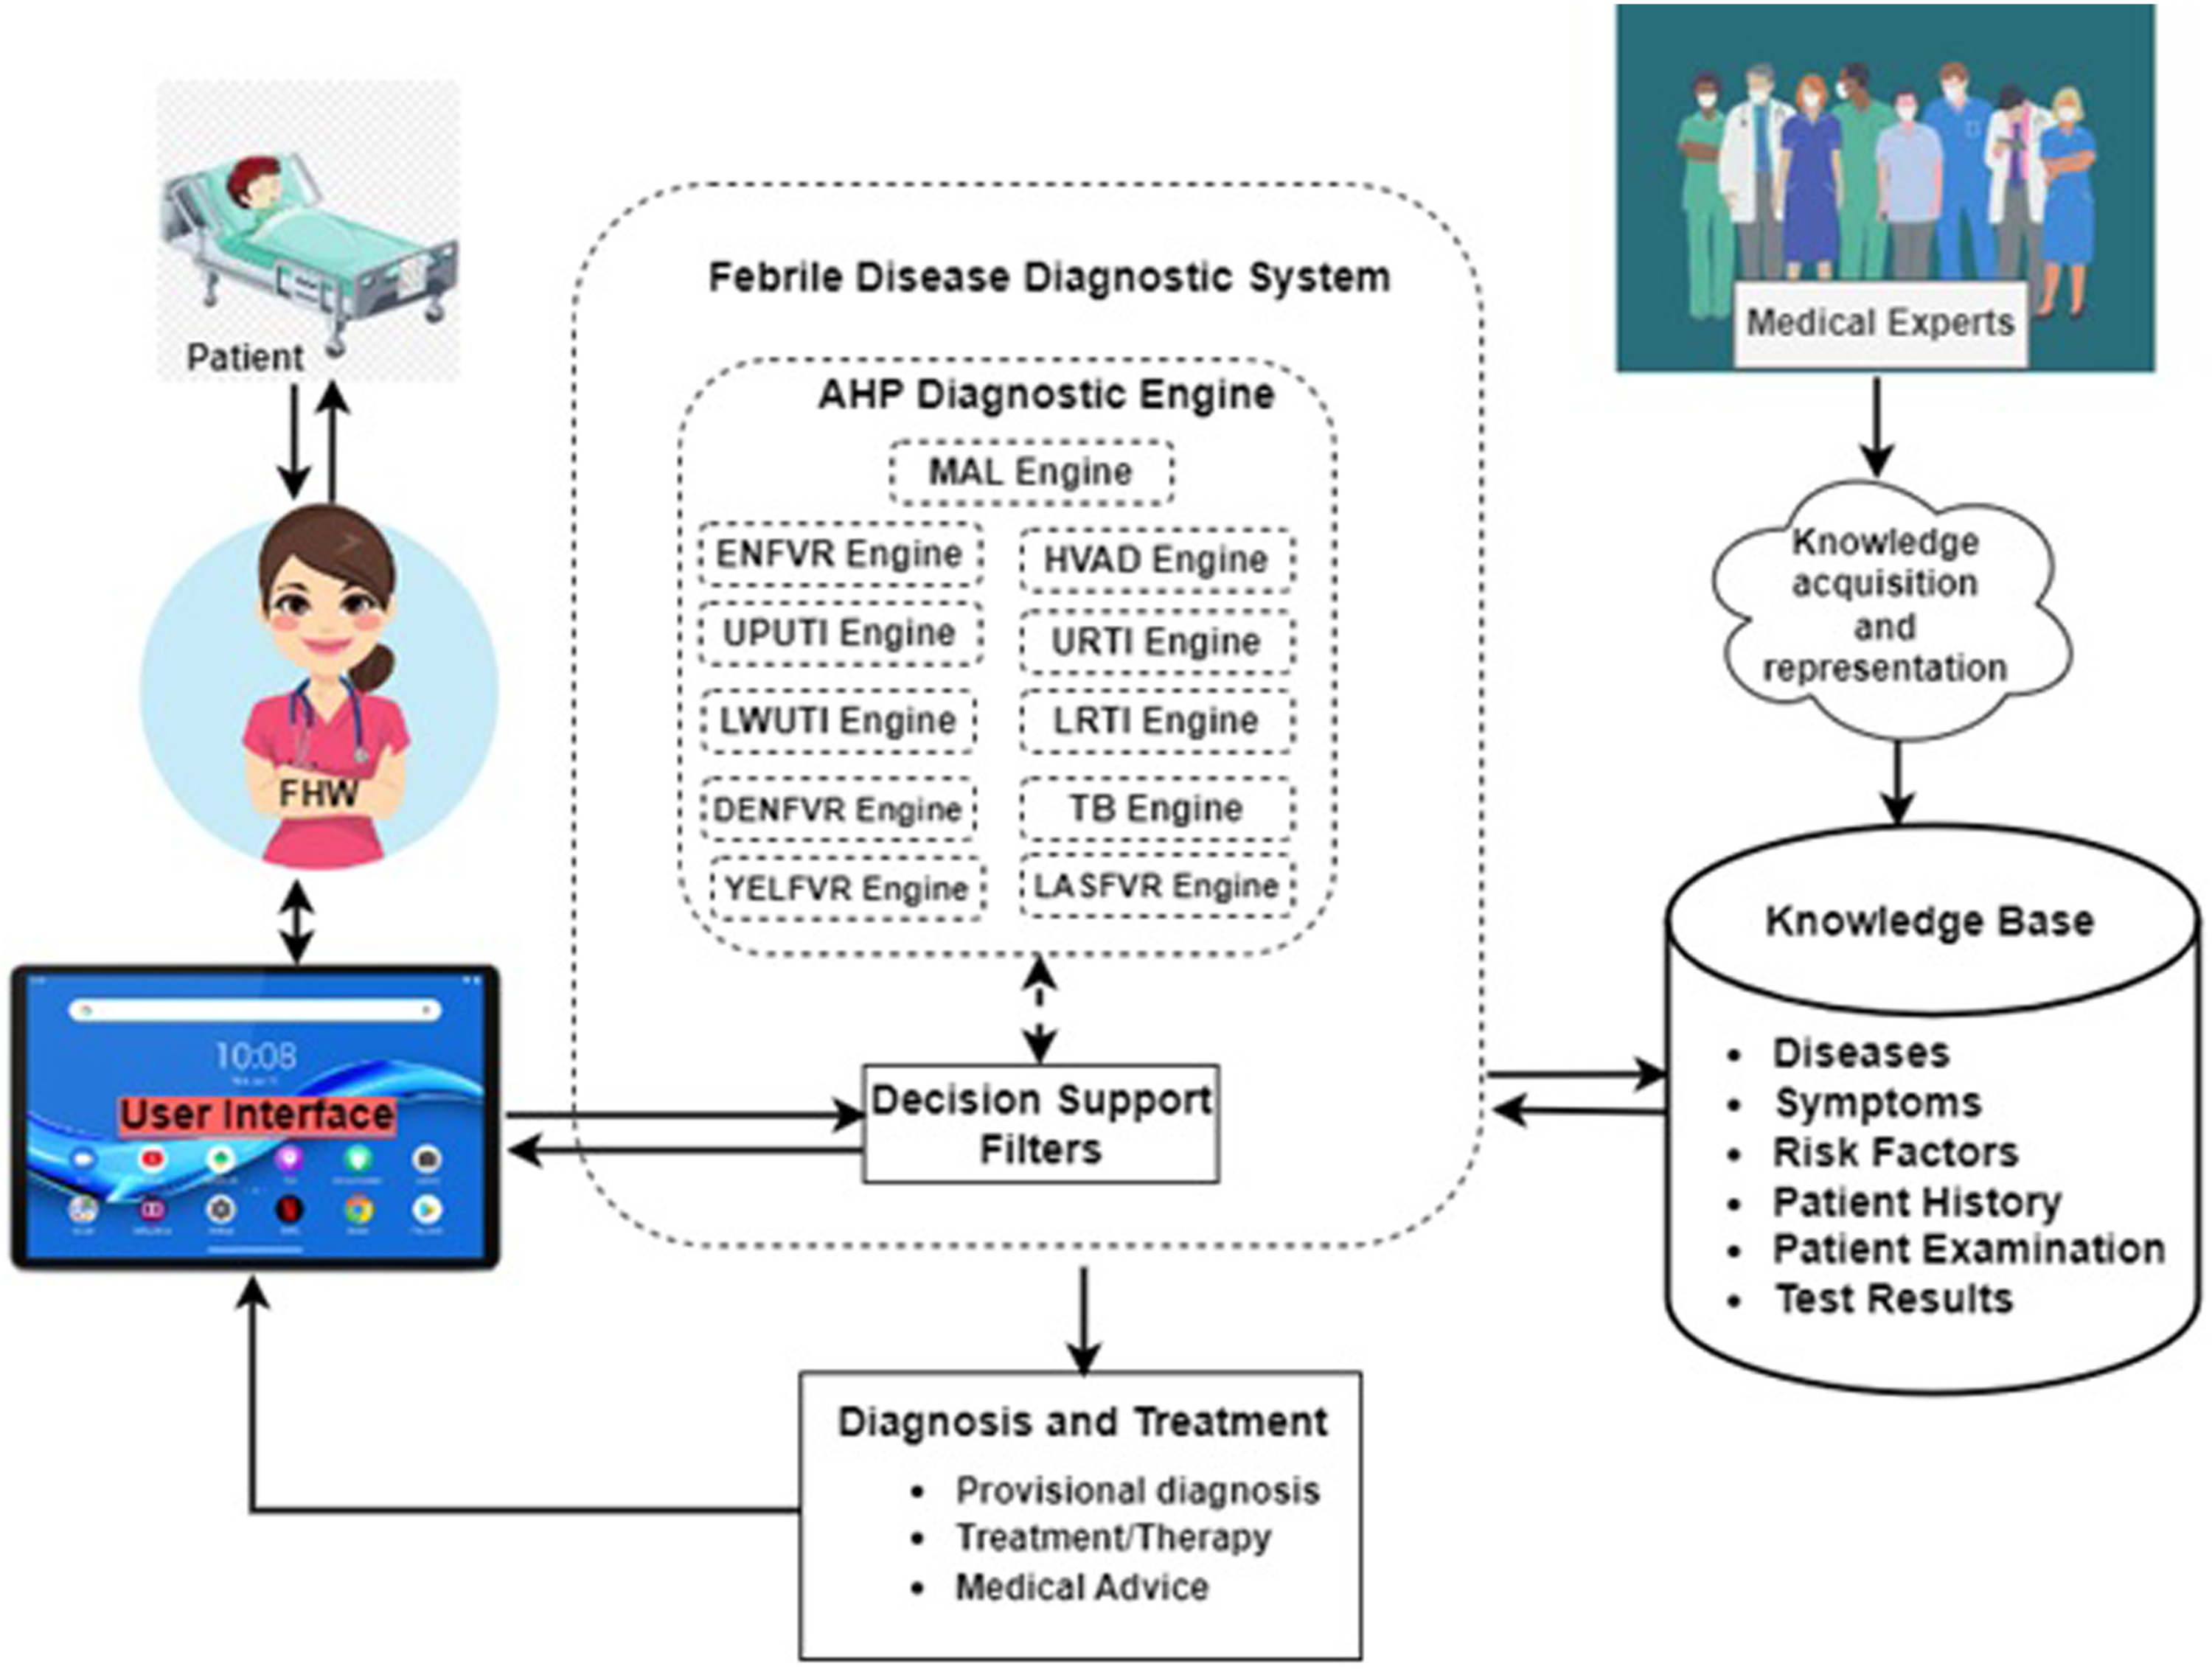
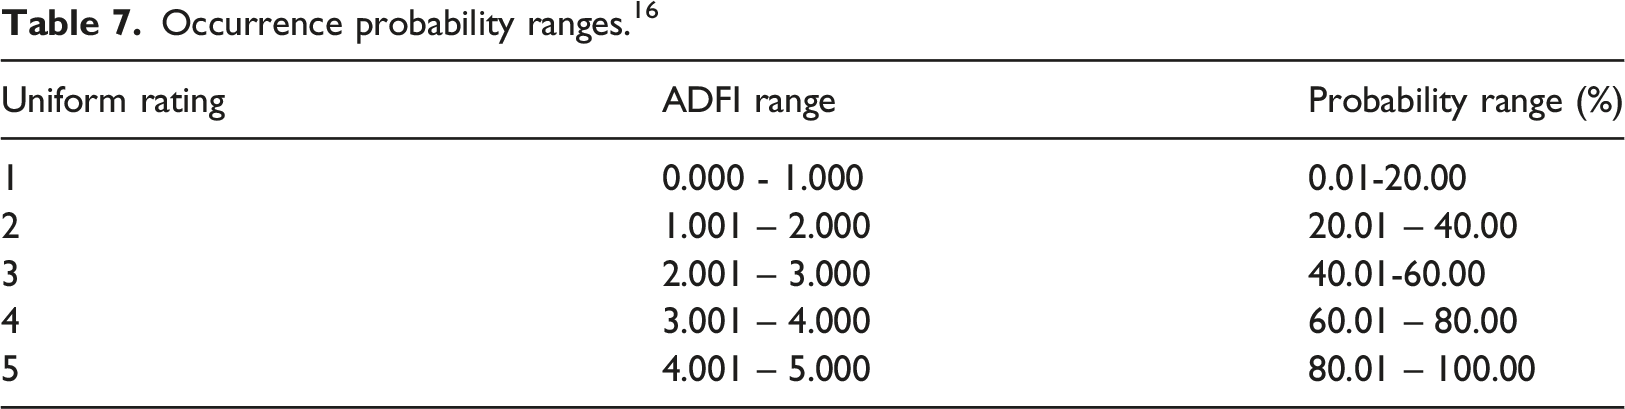
Due to the challenges in large-scale group decision-making, we develop explicit, linear consensus models stored in the AHP knowledge base to trigger each disease for intelligent diagnosis based on the contribution of its associated symptoms from physicians’ opinions and preferences. Thus, a threshold is set for each disease prediction by the AHP diagnostic engine and for the possibility of co-morbidity where there are overlapping symptoms. The linear models provide a formula for computing the probability of occurrence of any of the eleven diseases based on the linguistic value of symptoms: 1 = absent; 2 = very low; 3 = low; 4 = moderate; 5 = high; 6 = very-high.


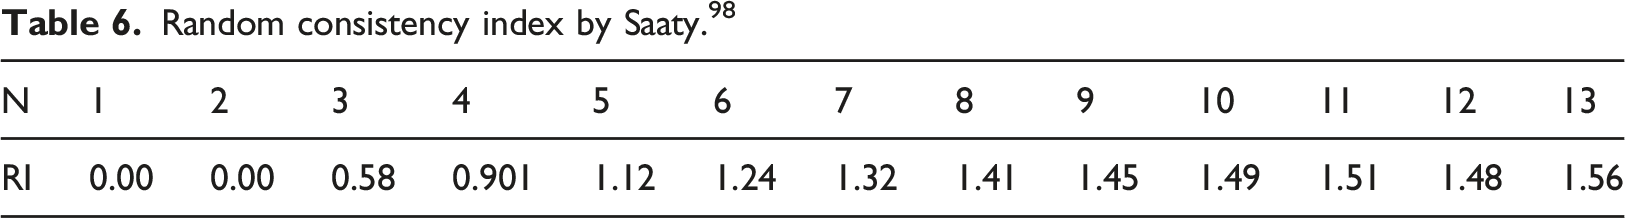
Random consistency index by Saaty. 98

Occurrence probability ranges. 16
Discussion of results
Priority weight of symptoms in the AHP model
AHP model showing priority weights of relevant symptoms in diagnosing each disease.
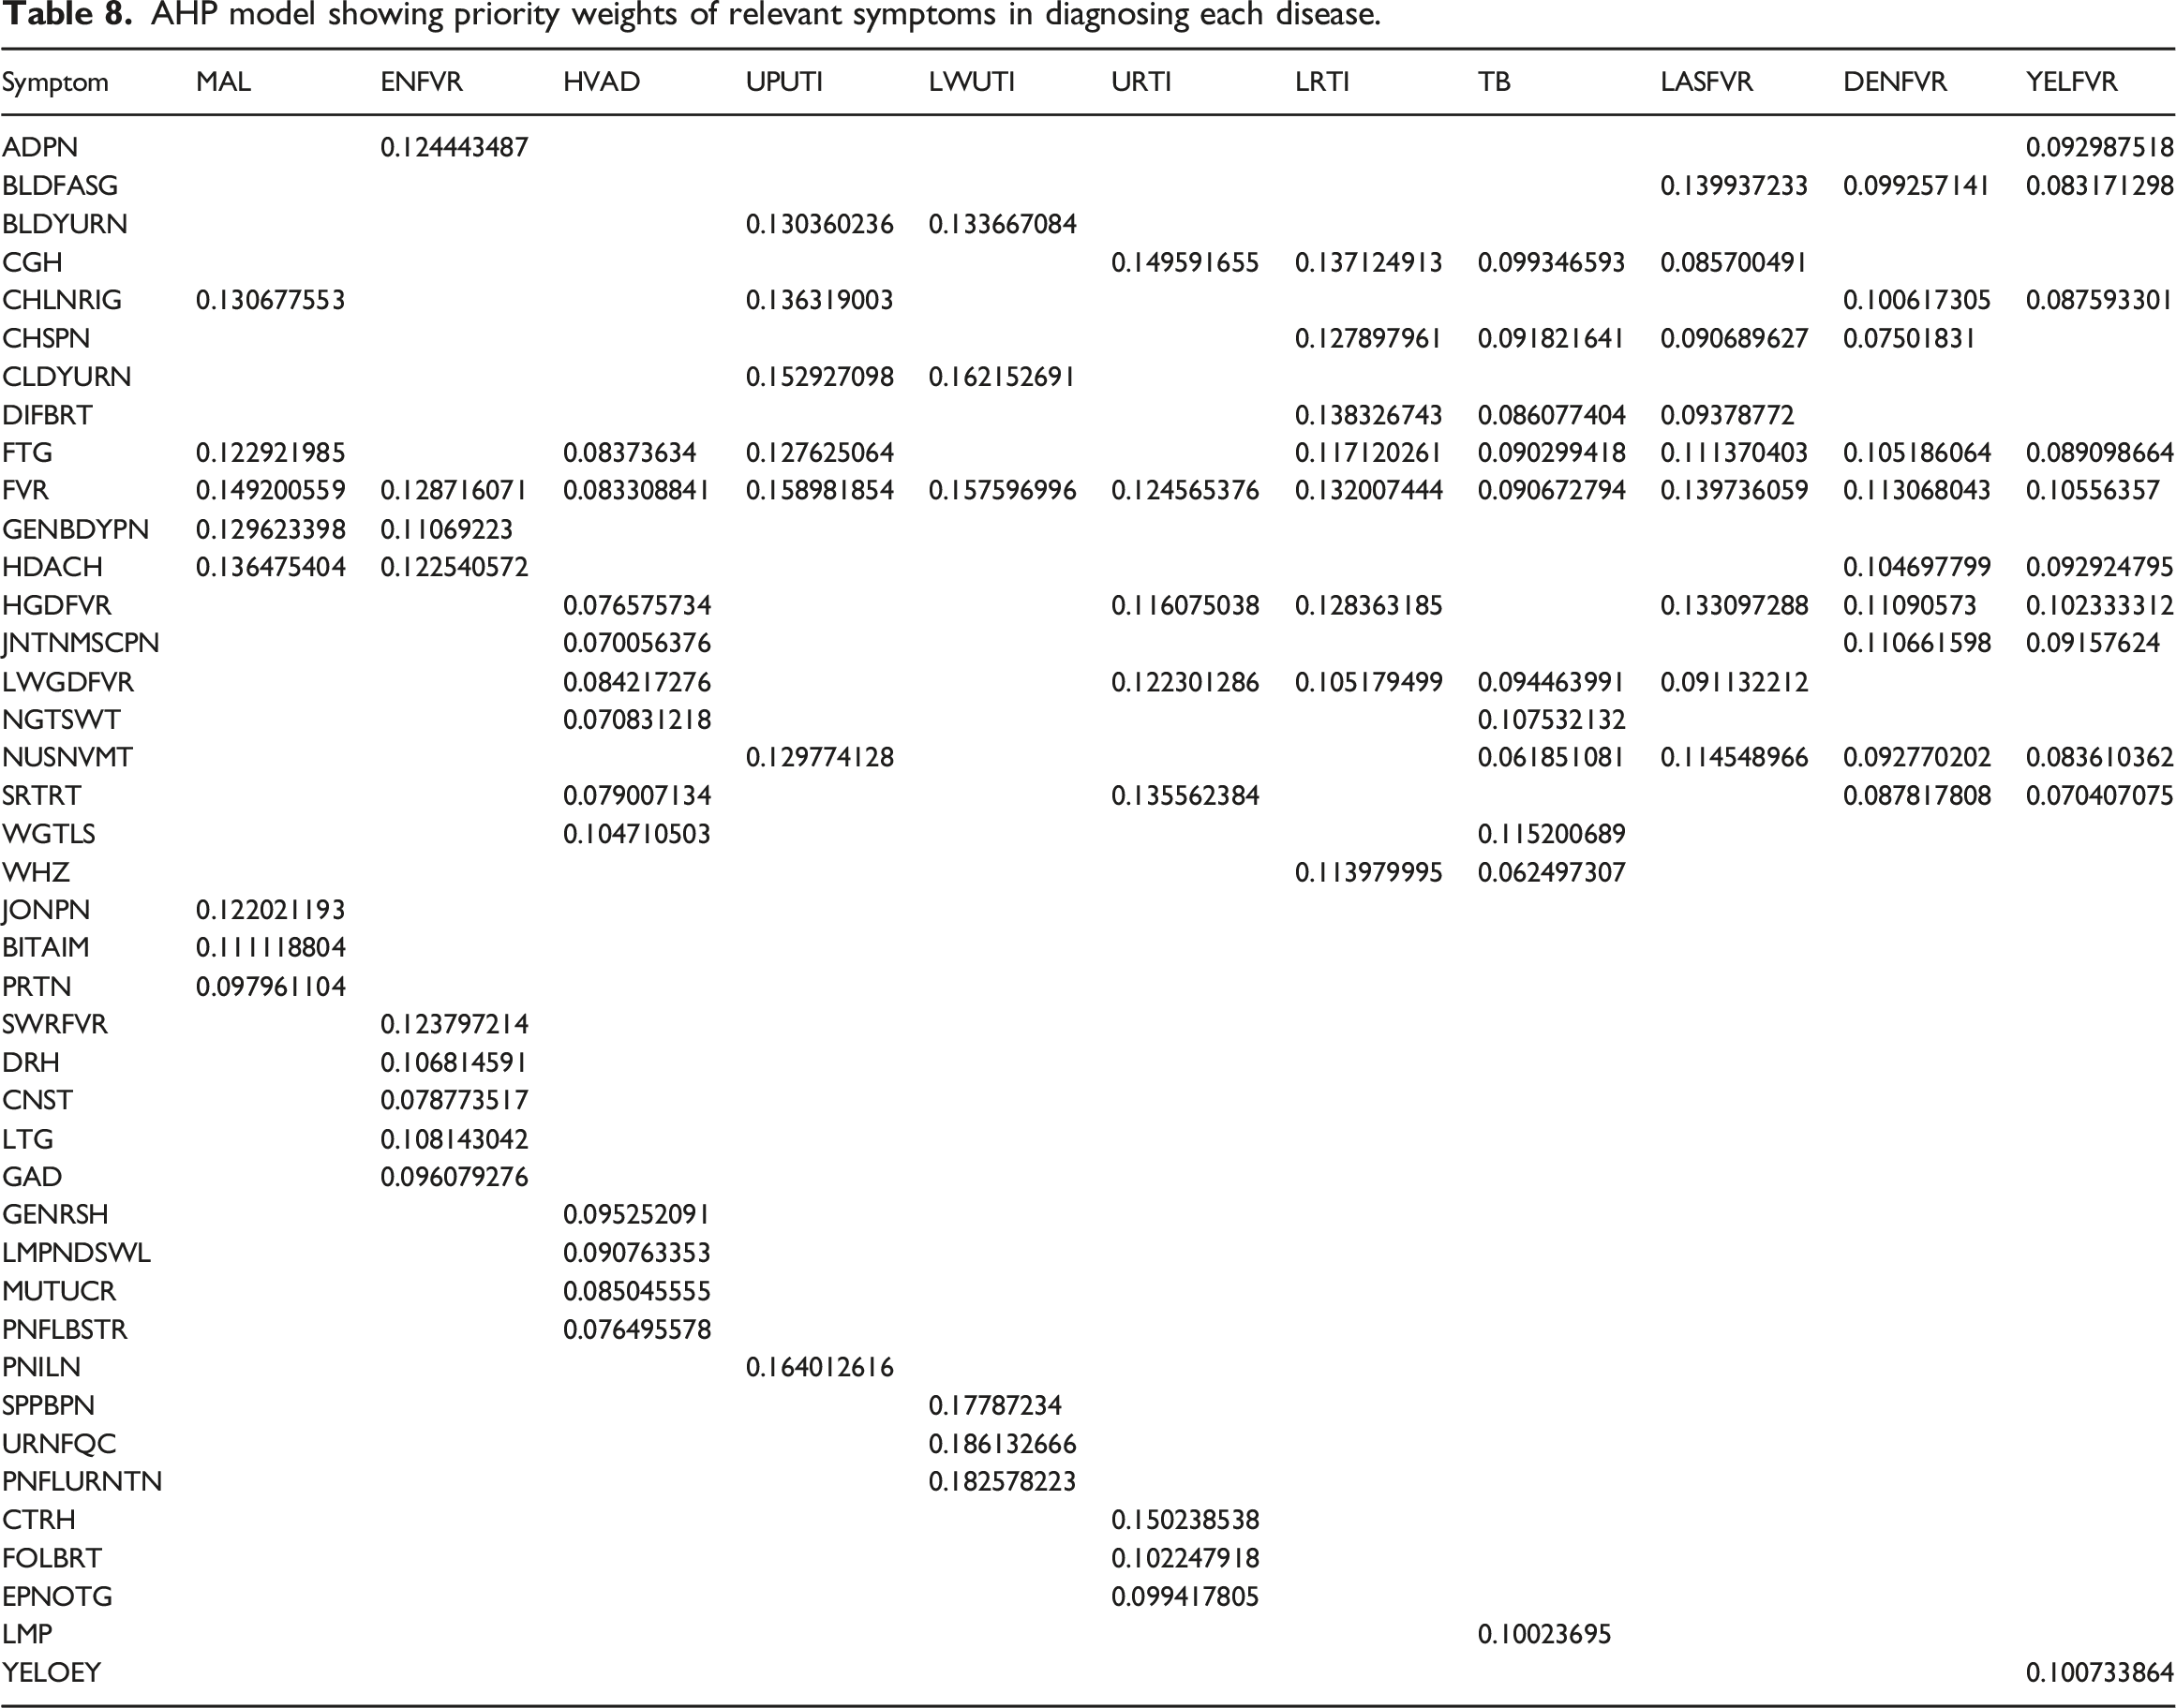
Out of the eleven diseases, only MAL and UPUTI had negative CR of −0.015245828 and −0.003411893 respectively, instead of zero (0). The rest of the diseases had zero (0) consistency ratio values. According to Teknomo, 99 negative CR is theoretically not possible but may arise due to error in the approximation of Eigen value especially with Microsoft Excel spreadsheet since Excel gives approximated Eigen values. To validate the weights of the symptoms and resolve these issues, the same sets of values (physicians’ response) were fed into Super Decision Software, 100 and approximately equivalent values (normalized matrix and weighted eigenvector) as that from the Excel spreadsheet but with CR of zero (0) for all the diseases.
Figure 3 shows a typical spreadsheet result dashboard of ADFI and Typical result dashboard for disease diagnosis (e.g. MAL).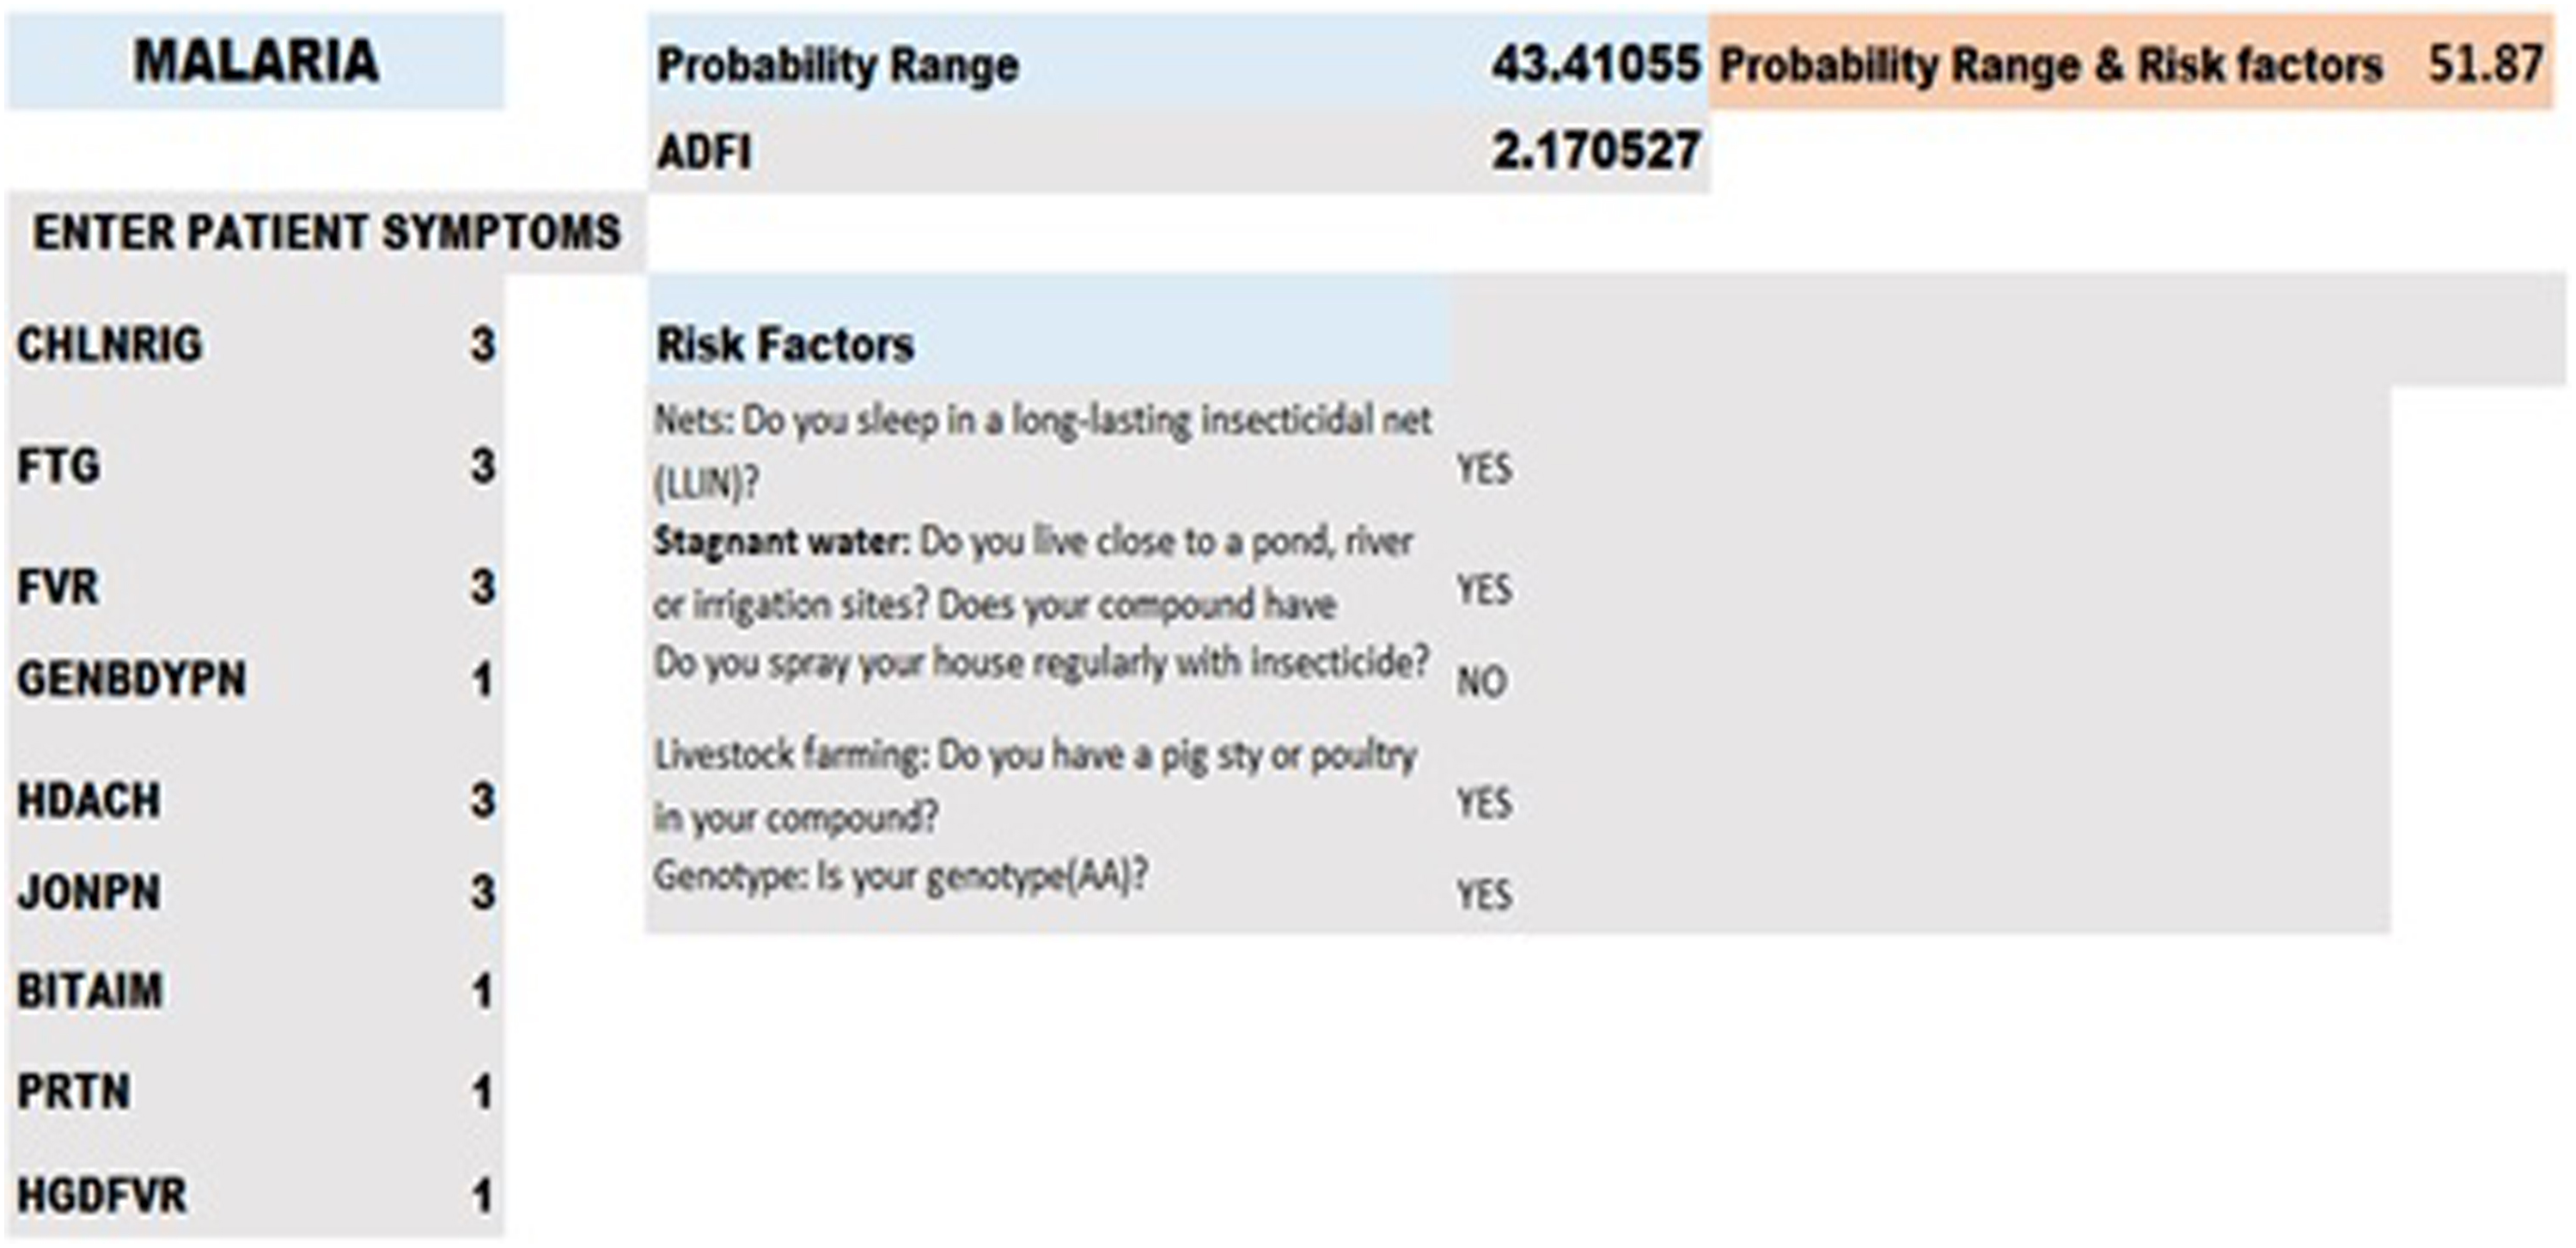
Performance evaluation of AHP-based MDSS
The developed linear models describing the ADFI for each febrile disease were used in testing 3249 patient data, collected from public and private medical institutions. The patient data comprises patient and physician demographic information, patients’ symptoms, risk factors that predispose a patient to a particular disease, suspected disease by the physician, and the confirmed disease after carrying out laboratory tests. Data used was for patients aged between 5 years and above, which comprises 1336 males and 1913 females.
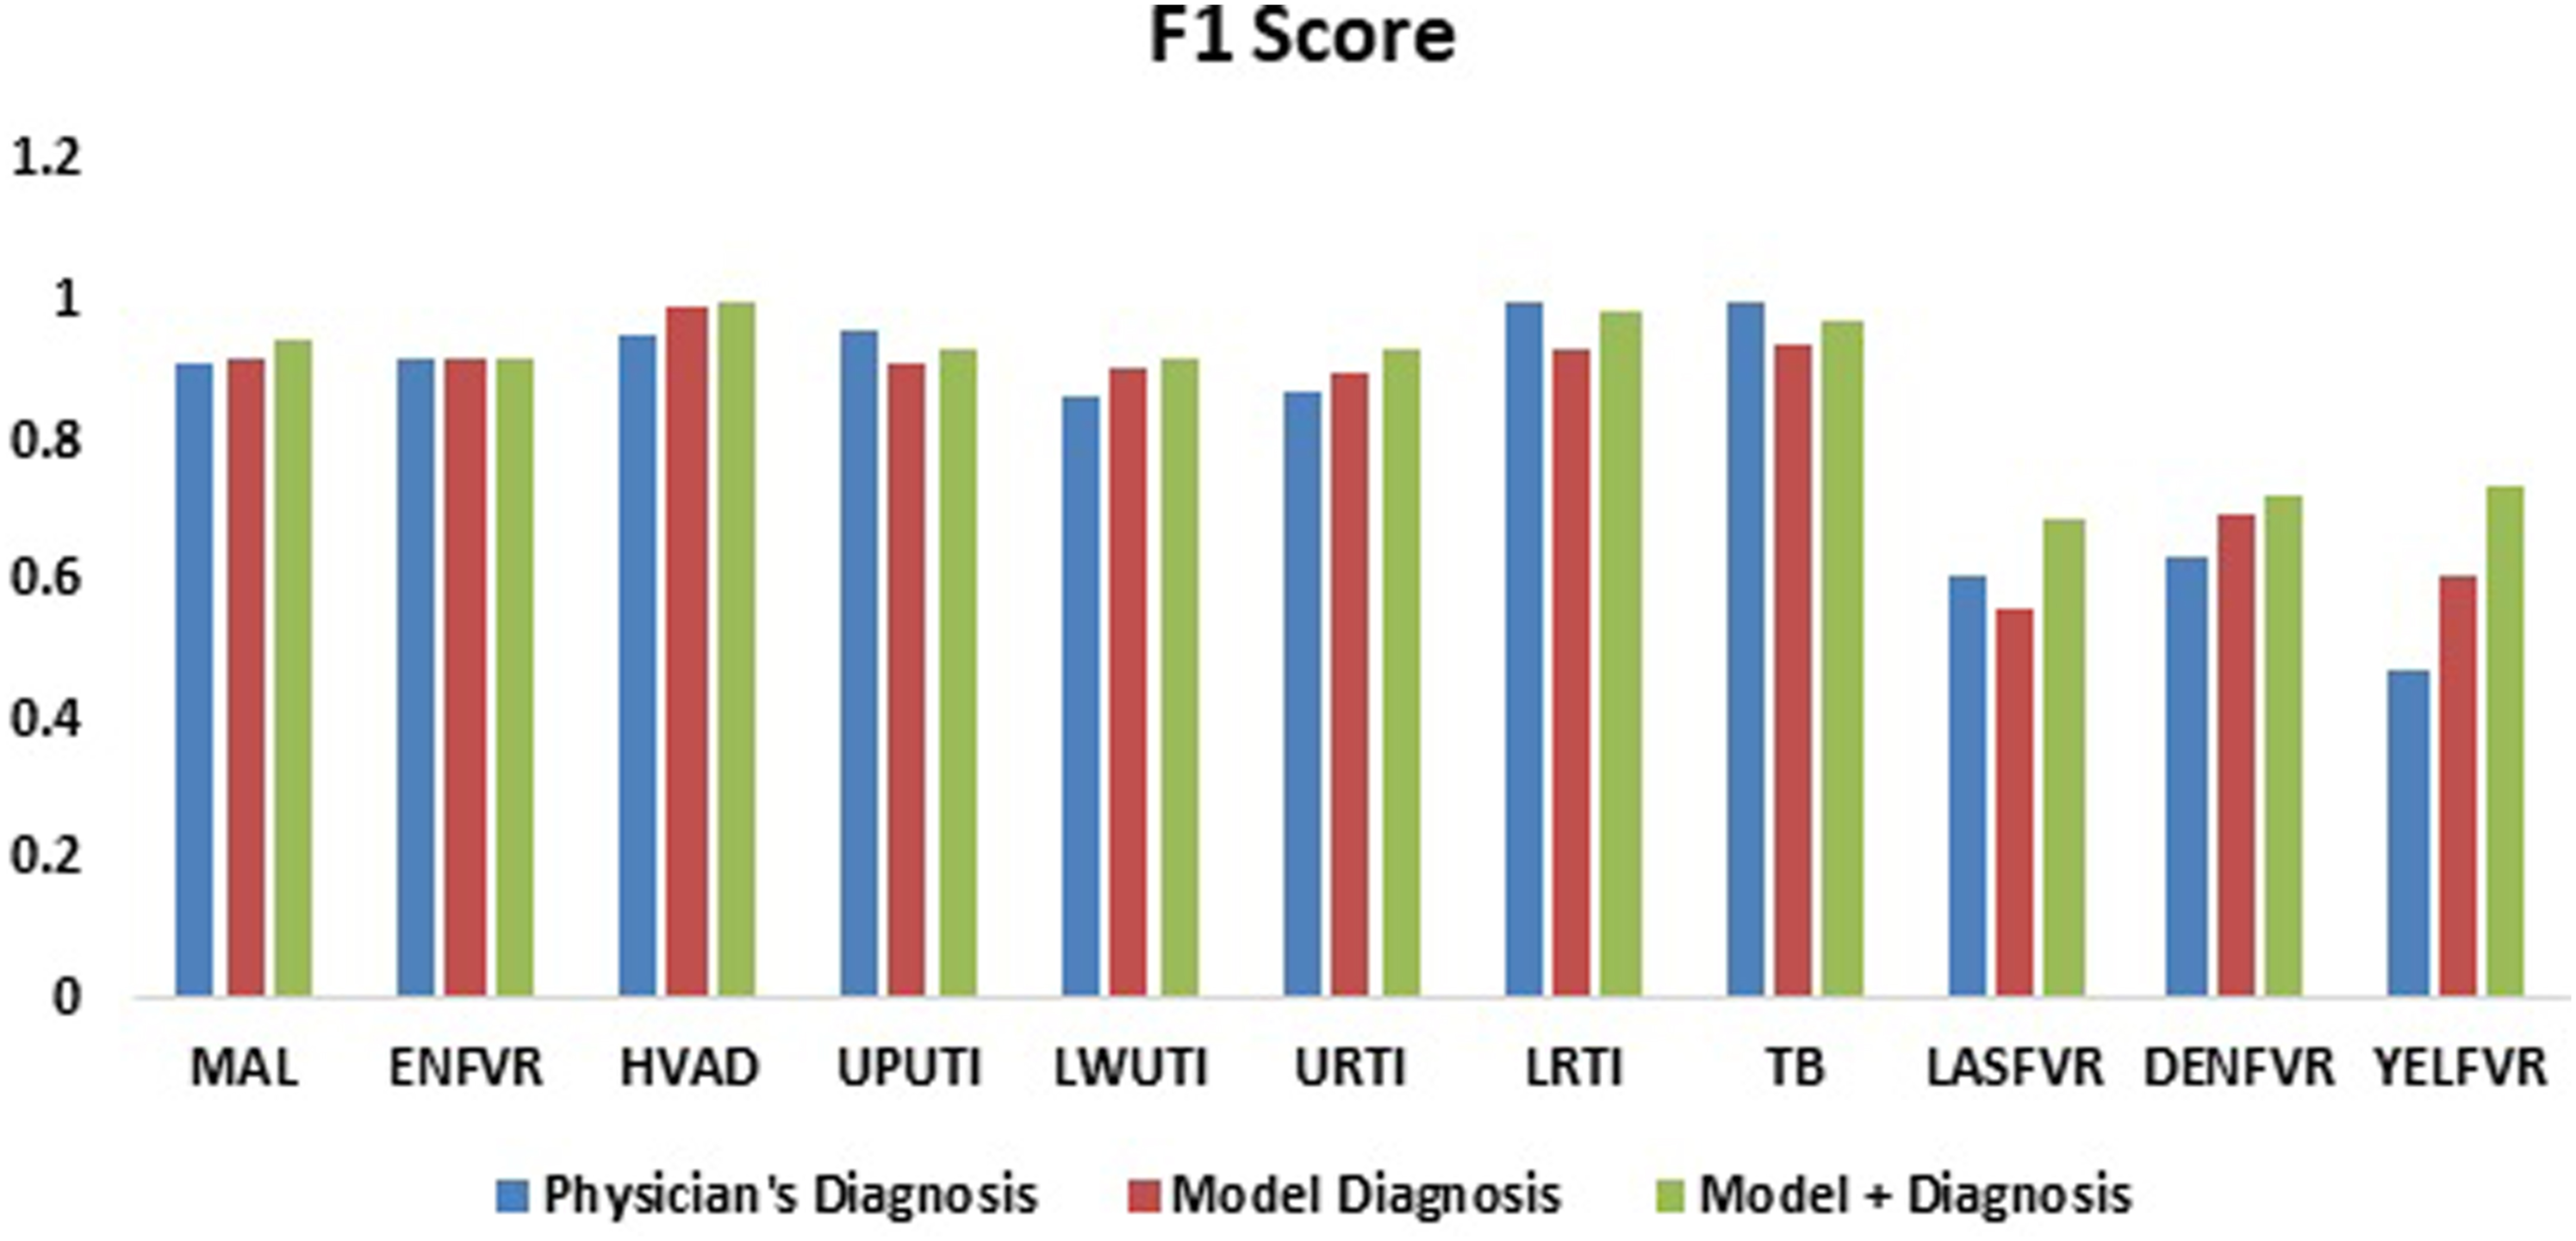
Further analysis using accuracy, precision, sensitivity, and F1 score are presented in Table A.5. Results indicate that the performance of the developed AHP model+ for the MDSS very closely mimics the physician’s diagnosis based on these metrics. In terms of accuracy, the AHP model+ achieves these results: MAL (90.06%), ENFVR (85.4%), HIV/AIDs (92.1%), UPUTI (87.5%), LWUTI (85.4%), URTI (86.9%), LRTI (96.9%), and TB (91.4%). Furthermore, the AHP model performs slightly better than the physicians’ decision in the diagnosis of LASFVR (0.685714; 0.470588), DENFVR (0.723404; 0.592593), and YELFVR (0.733333; 0.375), in terms of F1score. Figures 4 and 5 present the accuracy and F1 score plots comparing the physicians’ and the AHP models’ results for each febrile disease. Similar to Maranate et al.
83
who observed nightmares as the most ranked symptom, our study identifies fever to be associated with every considered febrile disease. Samuel et al.
86
used Fuzzy AHP to predict heart failure obtaining an average accuracy of 91.10% while our study achieves highest accuracy of 96.9% in the prediction of LRTI. Furthermore, compared to Uzoka et al.
58
where AHP method was used to predict typhoid obtaining an accuracy of 78.91%, our study achieves a prediction accuracy of 85.4% for the same febrile disease. The AHP engine for tuberculosis diagnosis in Fergus and Stephen
14
obtained an accuracy of 82% while the present study achieves an accuracy of 94.1% indicating significant improvements in providing sustainable solution as an information system for febrile disease diagnosis and treatment. Accuracy: Physician vs. Model and Physician vs. Model+ diagnosis. F1 score: Physician vs. Model and Physician vs. Model+ diagnosis.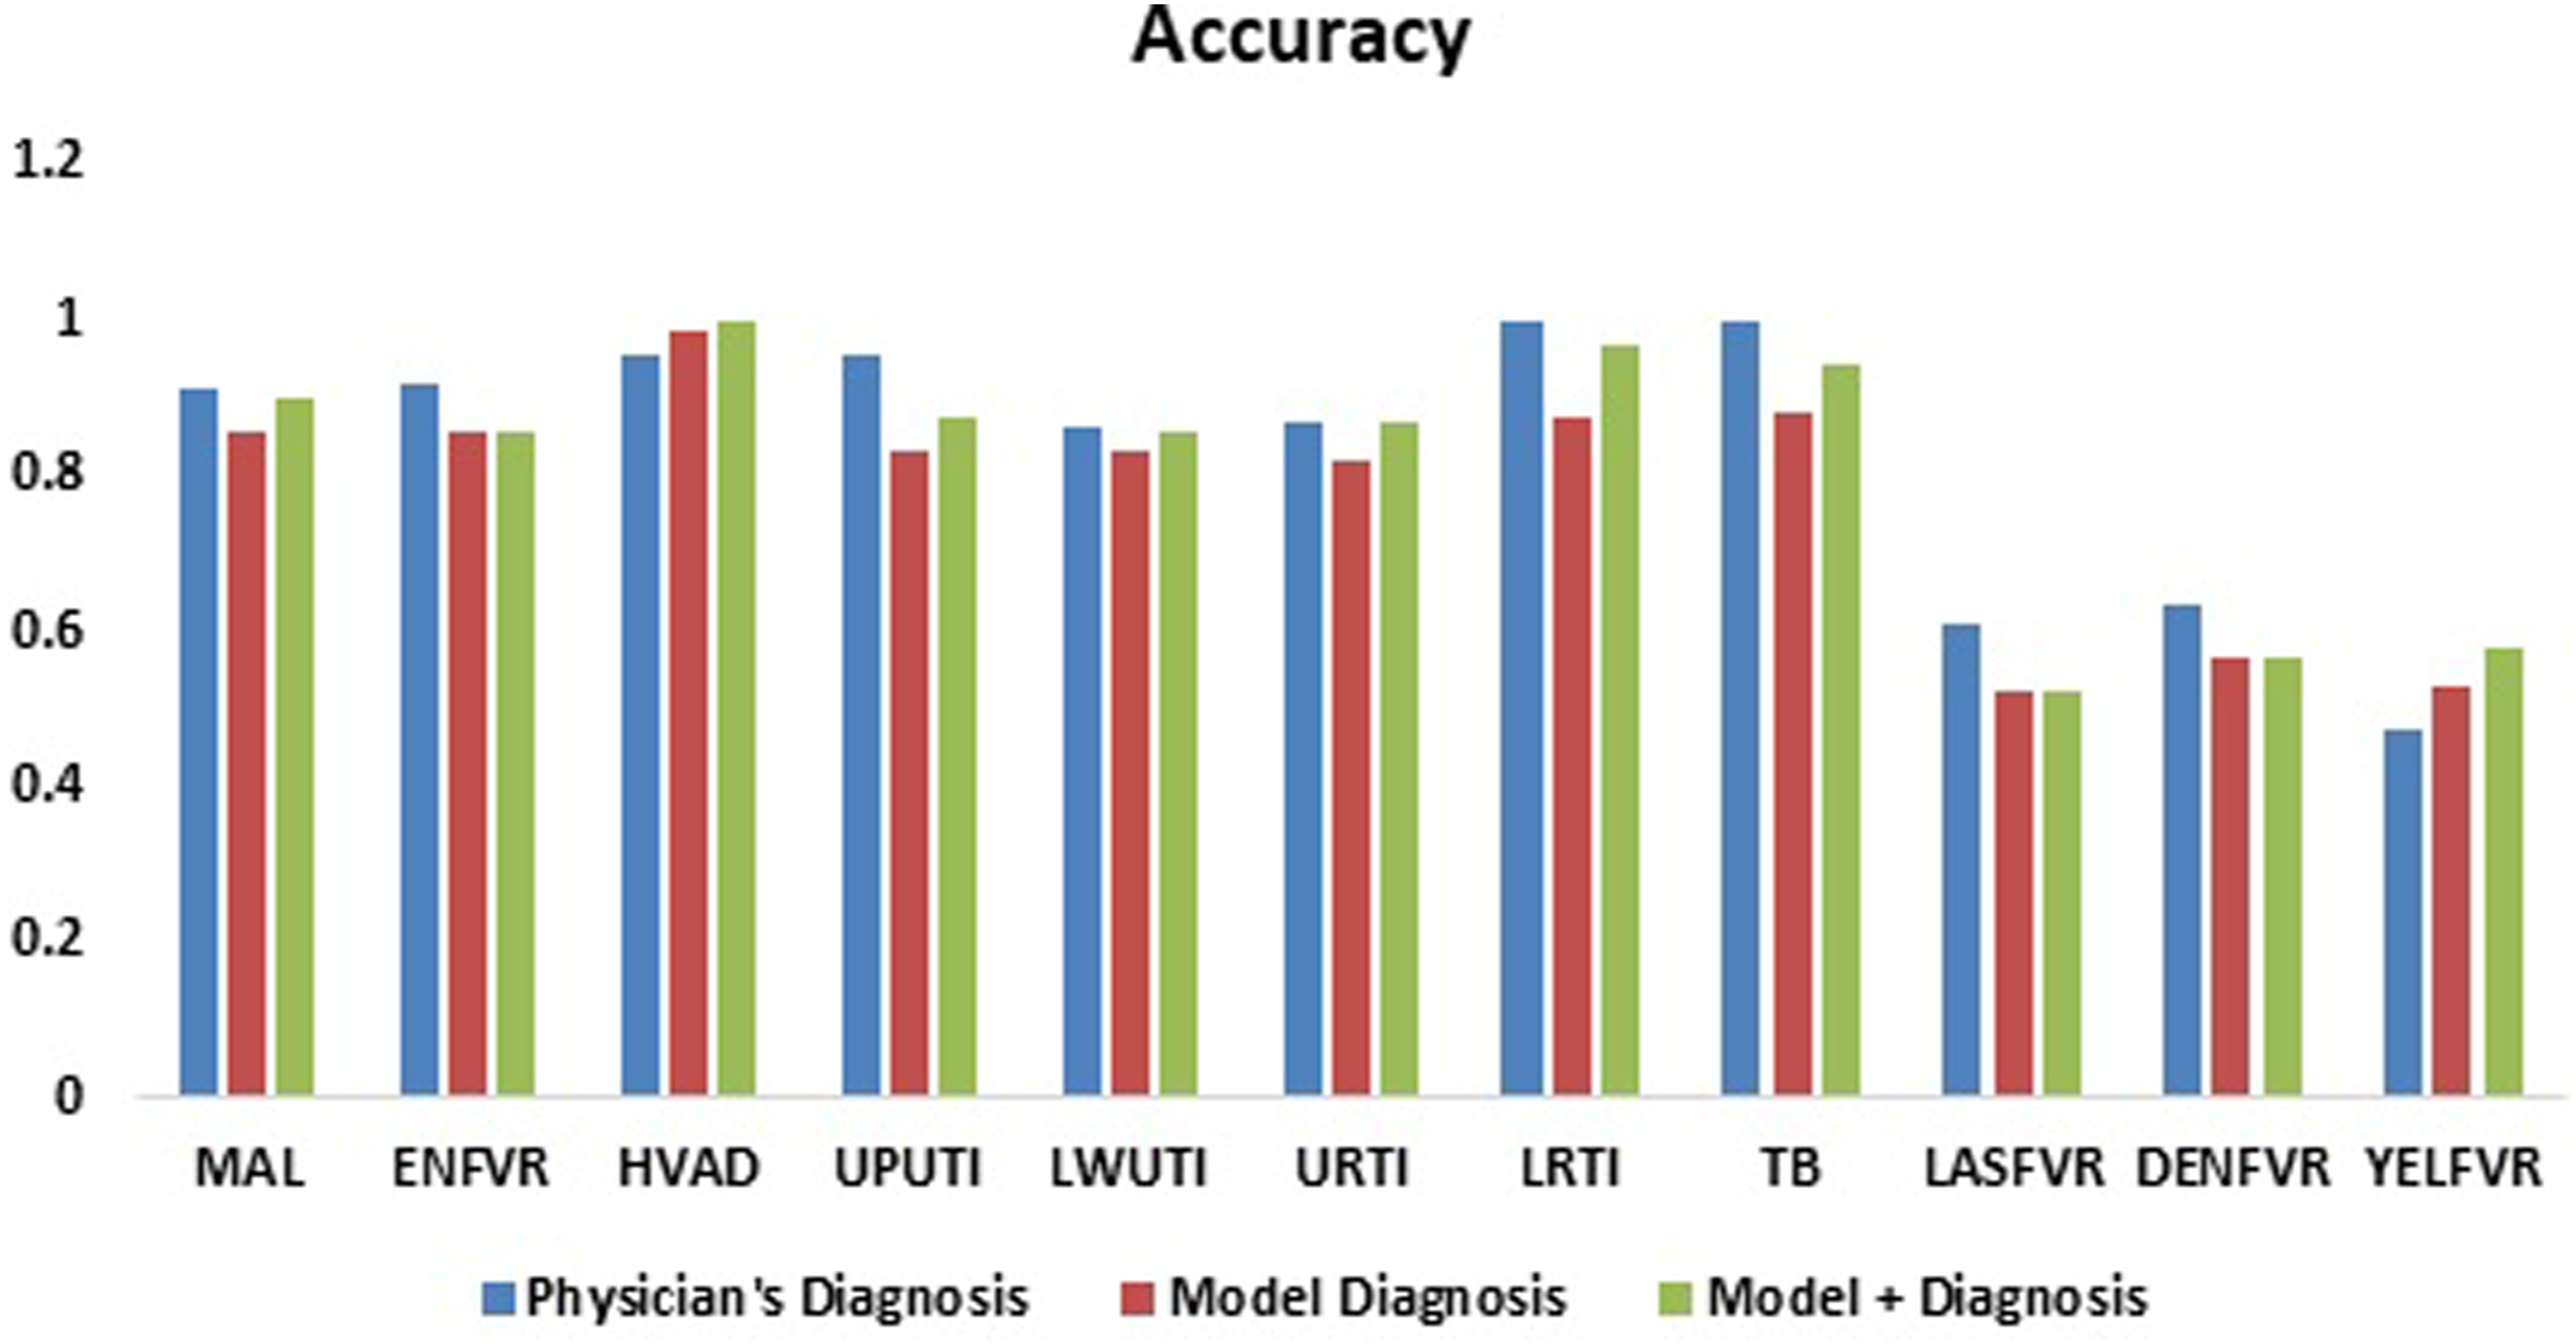
Implication of results
The AHP-based MDSS studied here aids both experts and non-experts like physicians and field health workers (FHWs) in diagnostic decision-making, particularly beneficial in rural regions and low- to middle-income countries (LMICs) where medical access is limited. This research extends MCDA’s application, highlighting its ability to mimic human intelligence in decision-making, as evidenced by performance metrics. Additionally, it reinforces previous findings on the influence of risk factors on disease predisposition and transmission. 35 The model exhibits high precision in diagnosing several common tropical diseases such as MAL, ENFVR, HIV/AIDS, URTI, LRTI, UPUTI, and LWUTI, reflecting physicians’ accurate diagnoses, validated by the models. These diseases, frequently encountered in the tropics, result in ease of diagnosis and clinical accuracy. However, for less common diseases like Dengue, Yellow fever, and Lassa fever, which have higher fatality rates and lower disease burden, the model shows lower precision due to reduced suspicion and diagnostic accuracy.
Recommendations
In resource-limited environments, the immediate availability of new or improved healthcare tools is often unfeasible due to significant time and resource investments. Hence, utilizing existing evidence-based solutions becomes crucial for enhancing patient care. Adopting the AHP-based MDSS, along with suitable algorithms or linear models, can significantly improve decision-making and resource allocation. As national standing orders may not adequately address multi-symptom, multi-disease conditions, deploying the results through an app in primary health centers can prevent overuse of RDT kits, reducing overhead expenses and saving government funds. However, in implementing the app, we recommend that the FHWs be equipped with RDT kits to enable more intelligence gathering for further improvement of the services provided by the app. This will also enable faster and more accurate disease diagnosis, lowering morbidity and averting mortalities. Other important recommendations include: (i) a usability evaluation of the developed system to determine the level of its usefulness, acceptability and user satisfaction; (ii) a more precise age-specific algorithm should be developed since the causes of febrile illness vary across diverse age groups.
Conclusions
This study addressed the complex task of selecting a suitable weighting method for MCDA, presenting an AHP-based MDSS for diagnosing eleven febrile diseases, considering associated risk factors. Utilizing datasets containing physicians’ experiential knowledge and patients’ confirmed laboratory tests, the model outperformed existing literature in accuracy predictions for certain diseases. Notably, the model closely mirrored physicians’ suspected diagnoses, especially when risk factors were considered. The AHP model achieved high accuracy values (85.4% - 96.9%) for various diseases, suggesting its utility, particularly in resource-constrained settings. Importantly, the model accounted for co-morbidities, enhancing its practicality in real-life situations. Proposing a mobile app with a user-friendly interface, integrating privacy and security features, would facilitate timely and accurate decision-making in diagnosing and treating febrile diseases, potentially reducing the overuse of RDT kits by FHWs in remote communities.
Footnotes
Declaration of conflicting interests
The author(s) declared no potential conflicts of interest with respect to the research, authorship, and/or publication of this article.
Funding
The author(s) disclosed receipt of the following financial support for the research, authorship, and/or publication of this article: This research was funded by [New Frontier Research Fund], grant number [NFRFE-2019-01365].
Ethical statement
Data availability statement
The data used to support the findings of this study are available from the corresponding author upon reasonable request.
Appendix
Disease and symptom abbreviations.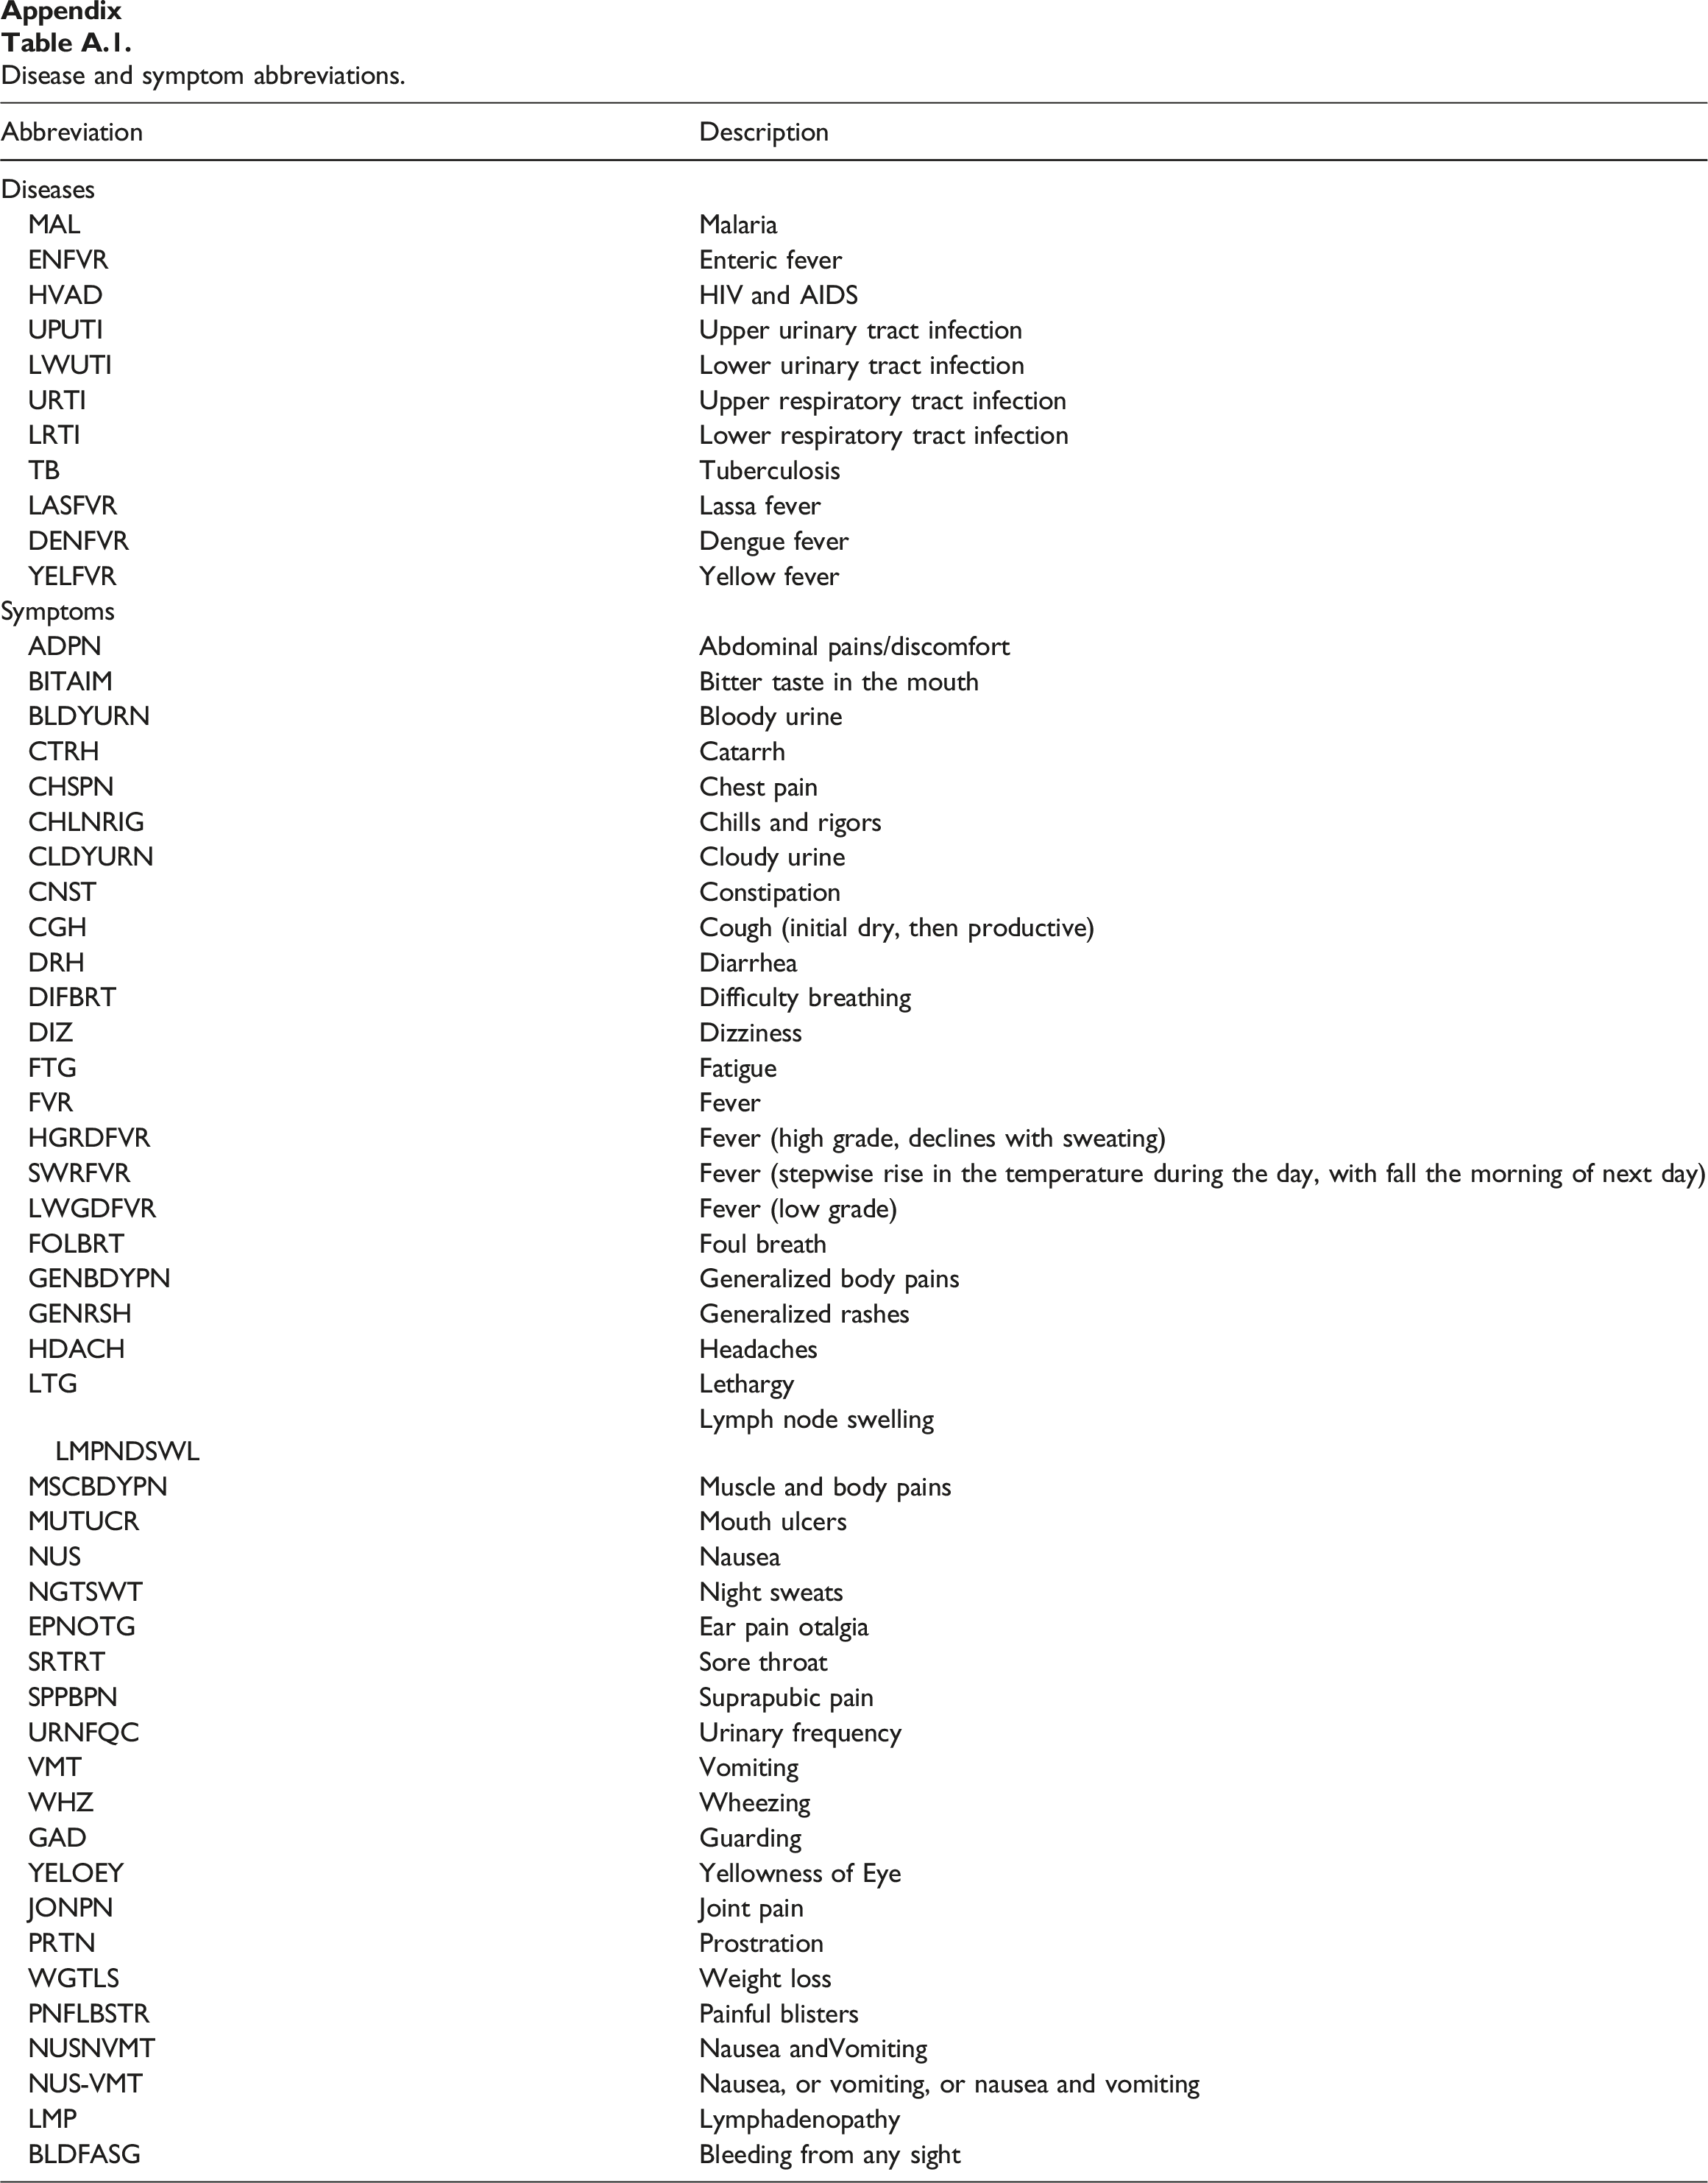
Abbreviation
Description
Diseases
MAL
Malaria
ENFVR
Enteric fever
HVAD
HIV and AIDS
UPUTI
Upper urinary tract infection
LWUTI
Lower urinary tract infection
URTI
Upper respiratory tract infection
LRTI
Lower respiratory tract infection
TB
Tuberculosis
LASFVR
Lassa fever
DENFVR
Dengue fever
YELFVR
Yellow fever
Symptoms
ADPN
Abdominal pains/discomfort
BITAIM
Bitter taste in the mouth
BLDYURN
Bloody urine
CTRH
Catarrh
CHSPN
Chest pain
CHLNRIG
Chills and rigors
CLDYURN
Cloudy urine
CNST
Constipation
CGH
Cough (initial dry, then productive)
DRH
Diarrhea
DIFBRT
Difficulty breathing
DIZ
Dizziness
FTG
Fatigue
FVR
Fever
HGRDFVR
Fever (high grade, declines with sweating)
SWRFVR
Fever (stepwise rise in the temperature during the day, with fall the morning of next day)
LWGDFVR
Fever (low grade)
FOLBRT
Foul breath
GENBDYPN
Generalized body pains
GENRSH
Generalized rashes
HDACH
Headaches
LTG
Lethargy
LMPNDSWL
Lymph node swelling
MSCBDYPN
Muscle and body pains
MUTUCR
Mouth ulcers
NUS
Nausea
NGTSWT
Night sweats
EPNOTG
Ear pain otalgia
SRTRT
Sore throat
SPPBPN
Suprapubic pain
URNFQC
Urinary frequency
VMT
Vomiting
WHZ
Wheezing
GAD
Guarding
YELOEY
Yellowness of Eye
JONPN
Joint pain
PRTN
Prostration
WGTLS
Weight loss
PNFLBSTR
Painful blisters
NUSNVMT
Nausea andVomiting
NUS-VMT
Nausea, or vomiting, or nausea and vomiting
LMP
Lymphadenopathy
BLDFASG
Bleeding from any sight
Multi disease-symptoms model.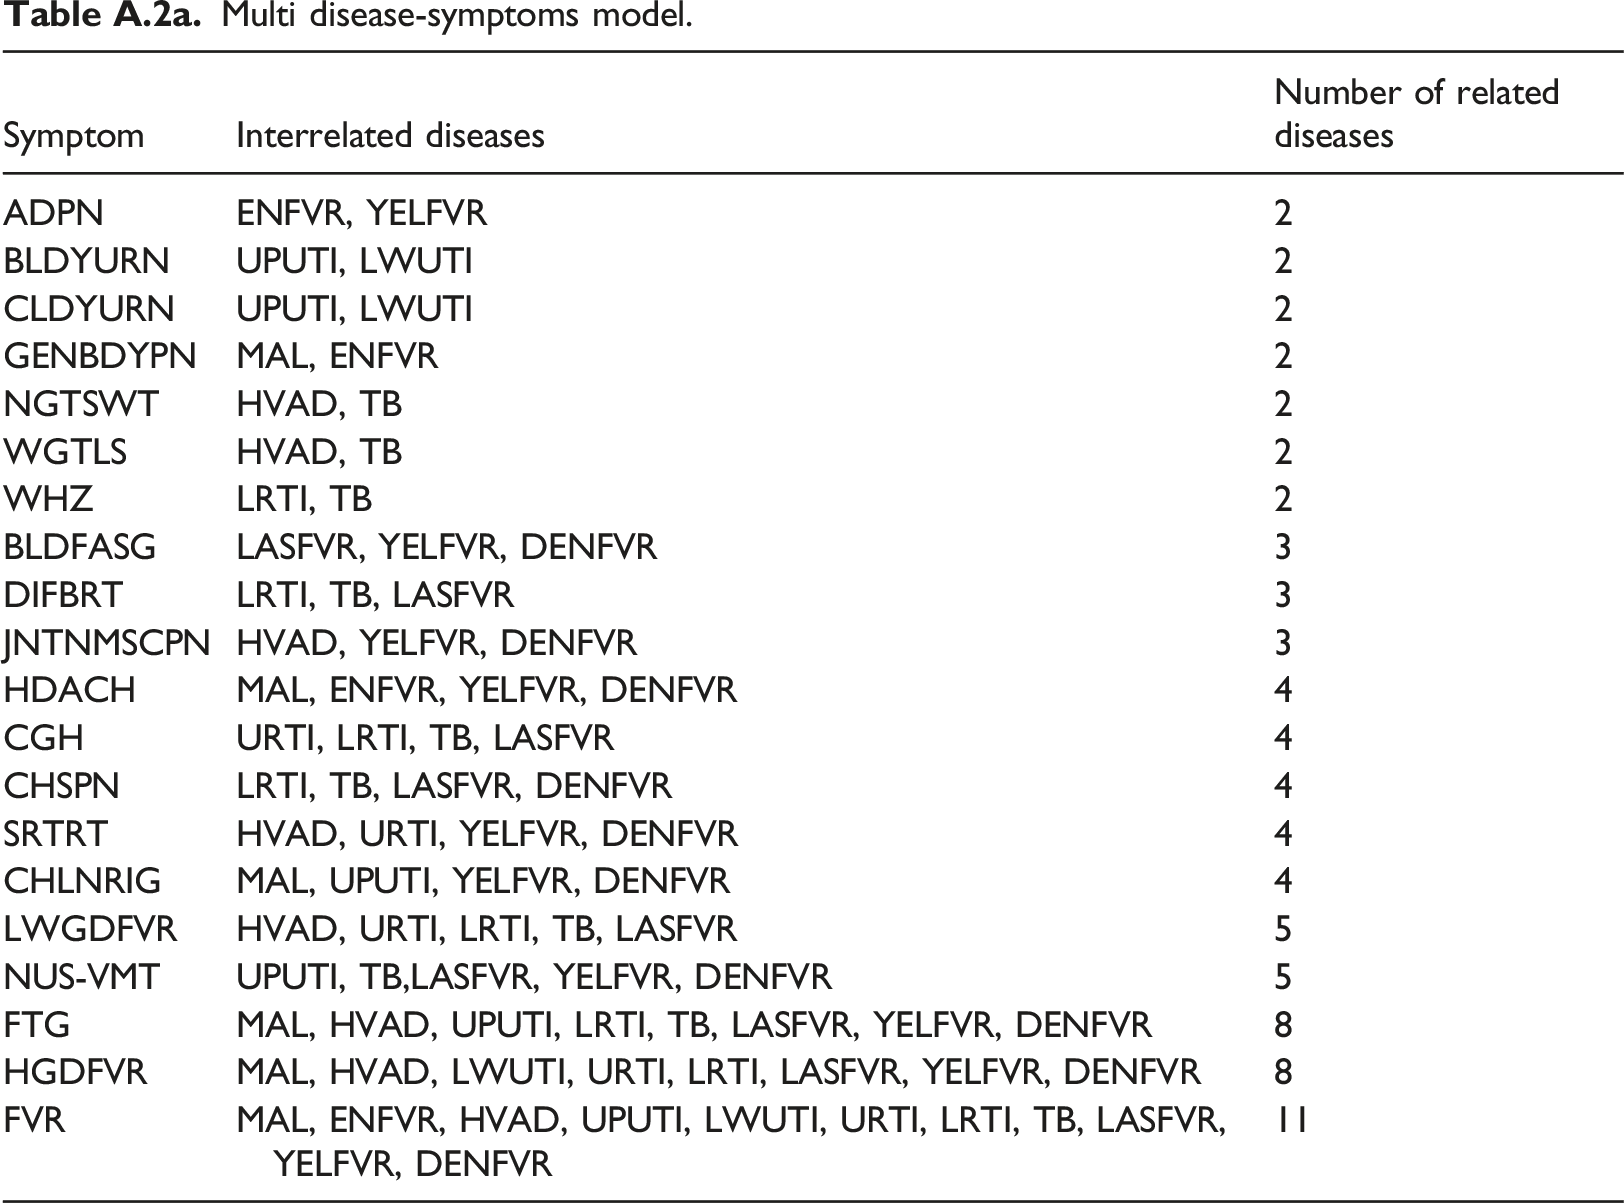
Symptom
Interrelated diseases
Number of related diseases
ADPN
ENFVR, YELFVR
2
BLDYURN
UPUTI, LWUTI
2
CLDYURN
UPUTI, LWUTI
2
GENBDYPN
MAL, ENFVR
2
NGTSWT
HVAD, TB
2
WGTLS
HVAD, TB
2
WHZ
LRTI, TB
2
BLDFASG
LASFVR, YELFVR, DENFVR
3
DIFBRT
LRTI, TB, LASFVR
3
JNTNMSCPN
HVAD, YELFVR, DENFVR
3
HDACH
MAL, ENFVR, YELFVR, DENFVR
4
CGH
URTI, LRTI, TB, LASFVR
4
CHSPN
LRTI, TB, LASFVR, DENFVR
4
SRTRT
HVAD, URTI, YELFVR, DENFVR
4
CHLNRIG
MAL, UPUTI, YELFVR, DENFVR
4
LWGDFVR
HVAD, URTI, LRTI, TB, LASFVR
5
NUS-VMT
UPUTI, TB,LASFVR, YELFVR, DENFVR
5
FTG
MAL, HVAD, UPUTI, LRTI, TB, LASFVR, YELFVR, DENFVR
8
HGDFVR
MAL, HVAD, LWUTI, URTI, LRTI, LASFVR, YELFVR, DENFVR
8
FVR
MAL, ENFVR, HVAD, UPUTI, LWUTI, URTI, LRTI, TB, LASFVR, YELFVR, DENFVR
11
Single disease-symptoms model.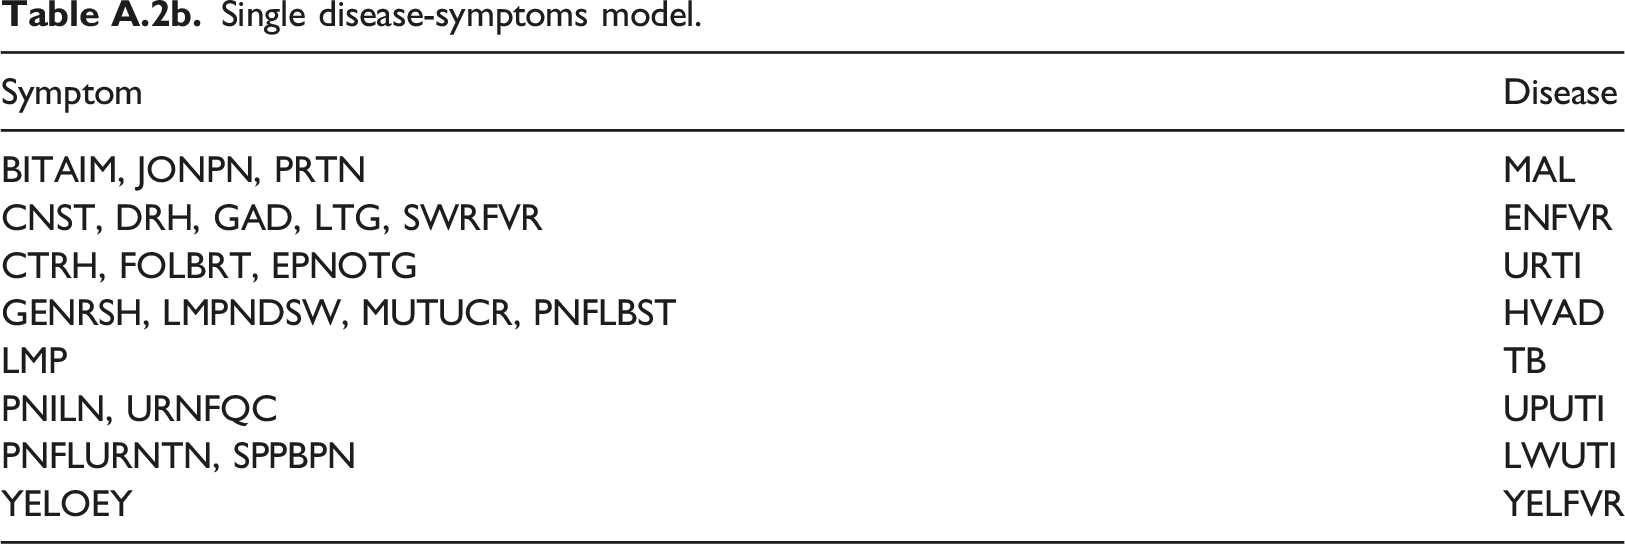
Symptom
Disease
BITAIM, JONPN, PRTN
MAL
CNST, DRH, GAD, LTG, SWRFVR
ENFVR
CTRH, FOLBRT, EPNOTG
URTI
GENRSH, LMPNDSW, MUTUCR, PNFLBST
HVAD
LMP
TB
PNILN, URNFQC
UPUTI
PNFLURNTN, SPPBPN
LWUTI
YELOEY
YELFVR
Aggregate diagnostic factor index (ADFI) for eleven febrile diseases.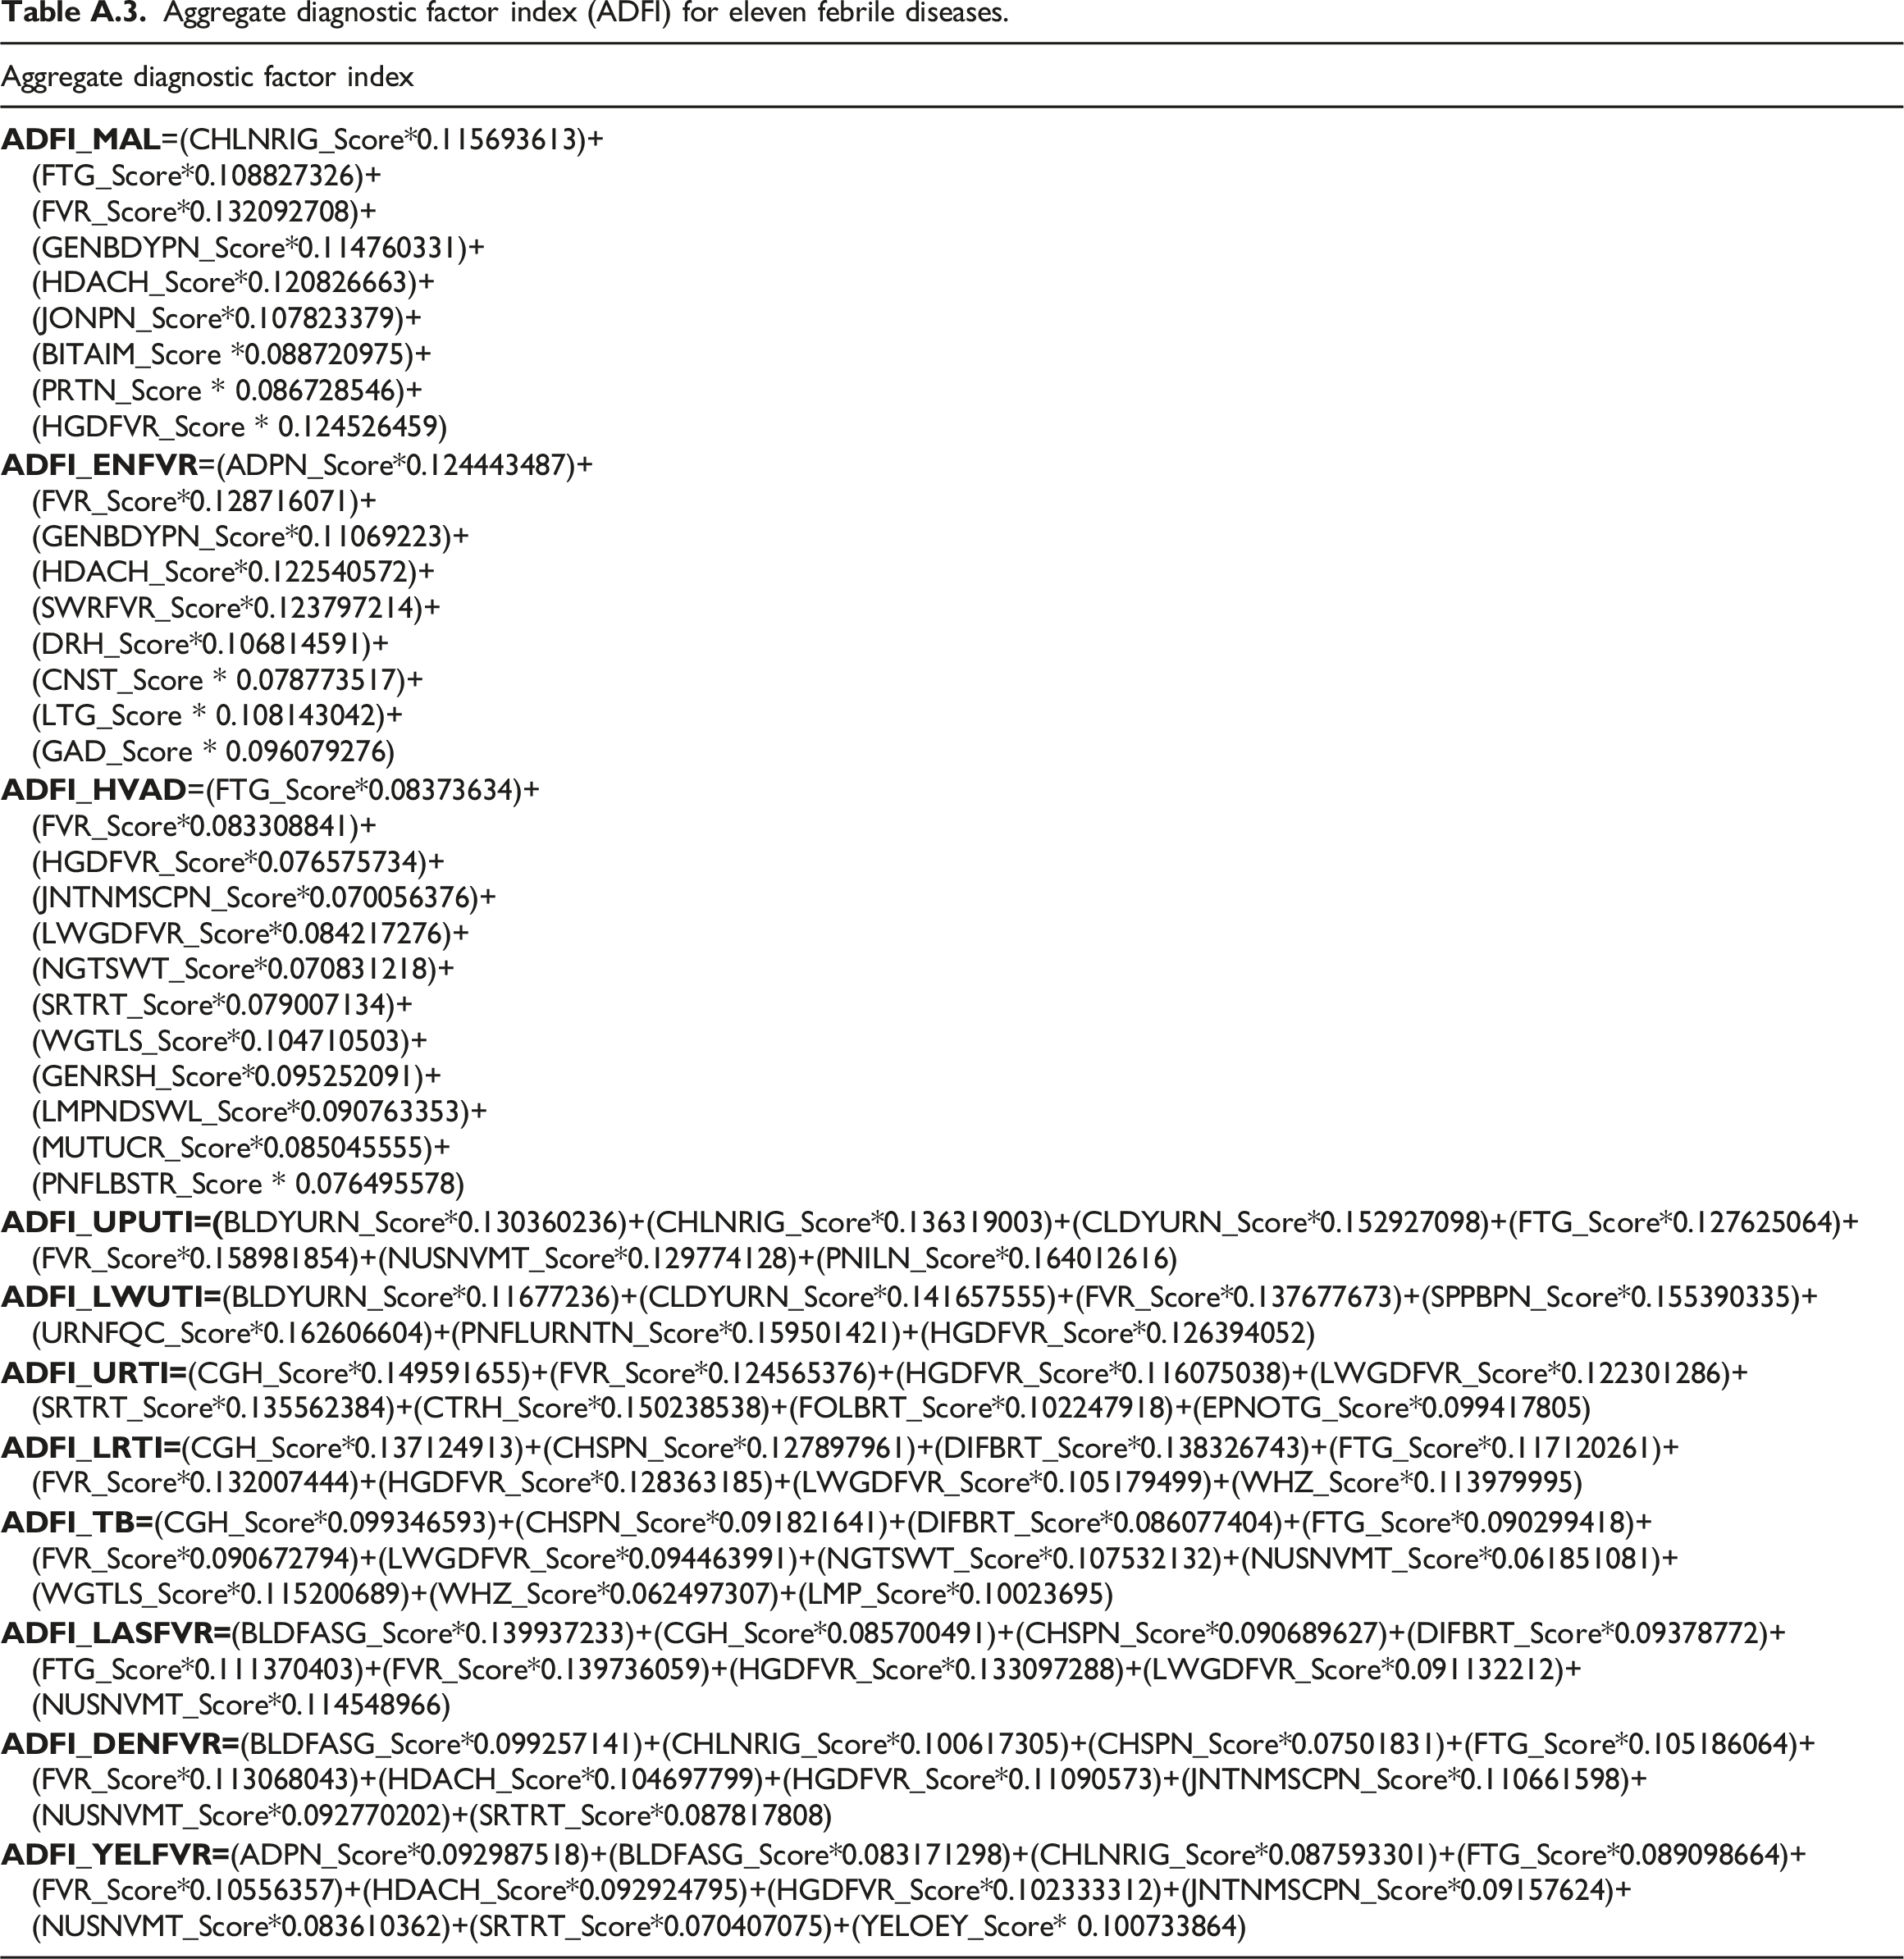
Aggregate diagnostic factor index
Normalized mean opinion score for MAL symptoms.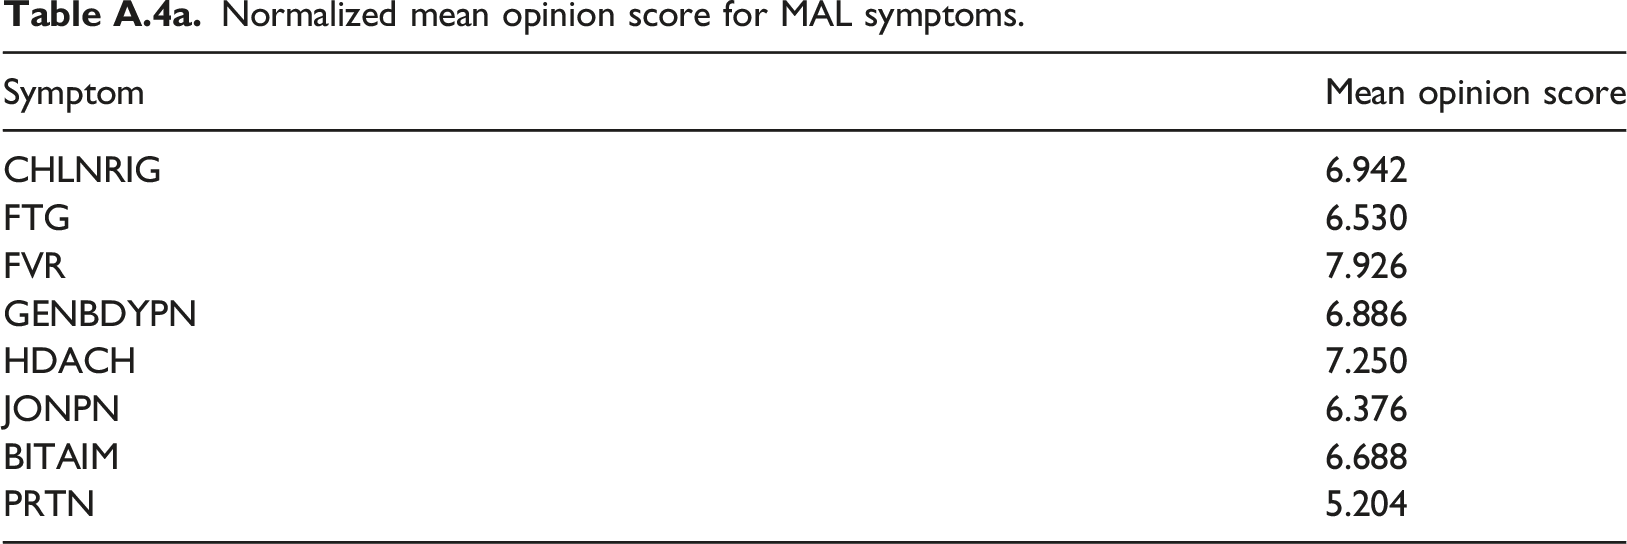
Symptom
Mean opinion score
CHLNRIG
6.942
FTG
6.530
FVR
7.926
GENBDYPN
6.886
HDACH
7.250
JONPN
6.376
BITAIM
6.688
PRTN
5.204
Symptom-by-symptom pair-wise comparison matrix for MAL.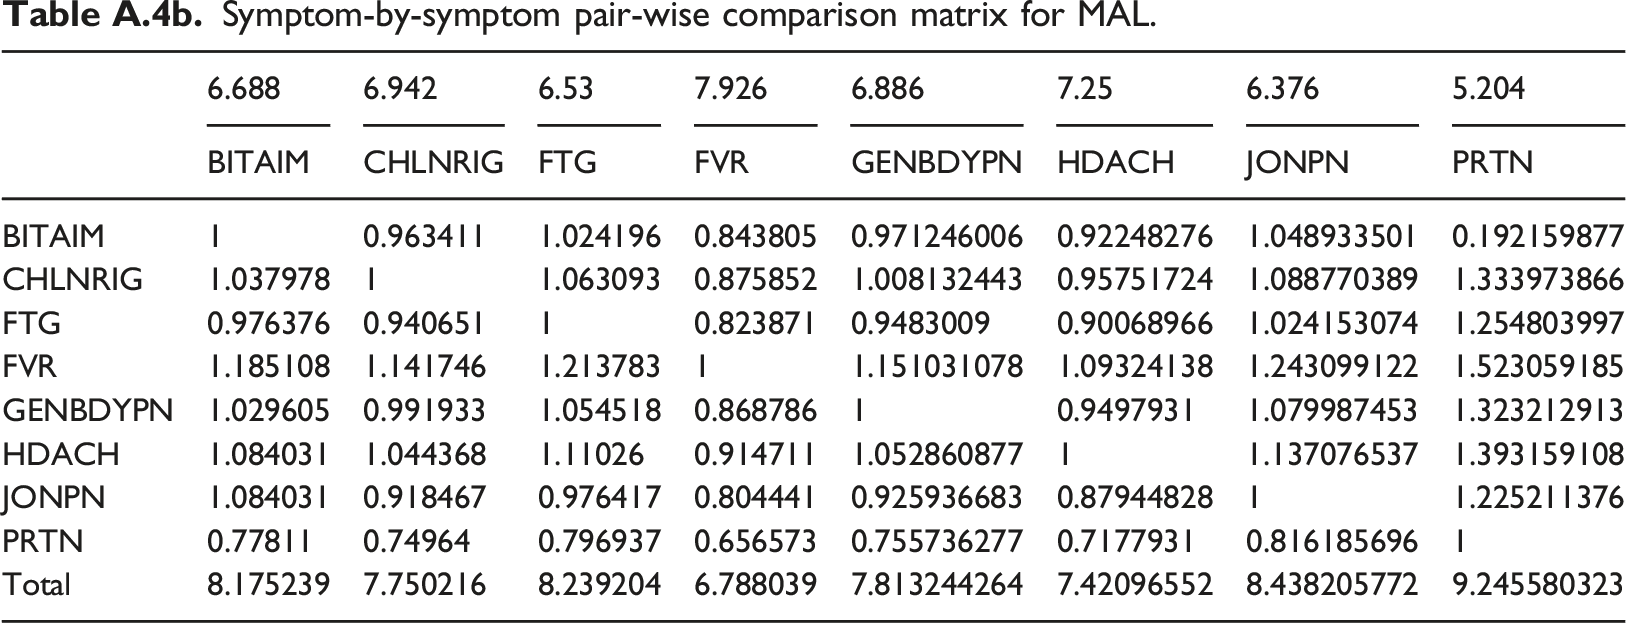
6.688
6.942
6.53
7.926
6.886
7.25
6.376
5.204
BITAIM
CHLNRIG
FTG
FVR
GENBDYPN
HDACH
JONPN
PRTN
BITAIM
1
0.963411
1.024196
0.843805
0.971246006
0.92248276
1.048933501
0.192159877
CHLNRIG
1.037978
1
1.063093
0.875852
1.008132443
0.95751724
1.088770389
1.333973866
FTG
0.976376
0.940651
1
0.823871
0.9483009
0.90068966
1.024153074
1.254803997
FVR
1.185108
1.141746
1.213783
1
1.151031078
1.09324138
1.243099122
1.523059185
GENBDYPN
1.029605
0.991933
1.054518
0.868786
1
0.9497931
1.079987453
1.323212913
HDACH
1.084031
1.044368
1.11026
0.914711
1.052860877
1
1.137076537
1.393159108
JONPN
1.084031
0.918467
0.976417
0.804441
0.925936683
0.87944828
1
1.225211376
PRTN
0.77811
0.74964
0.796937
0.656573
0.755736277
0.7177931
0.816185696
1
Total
8.175239
7.750216
8.239204
6.788039
7.813244264
7.42096552
8.438205772
9.245580323
Normalized symptom-by-symptom pair-wise comparison matrix for MAL.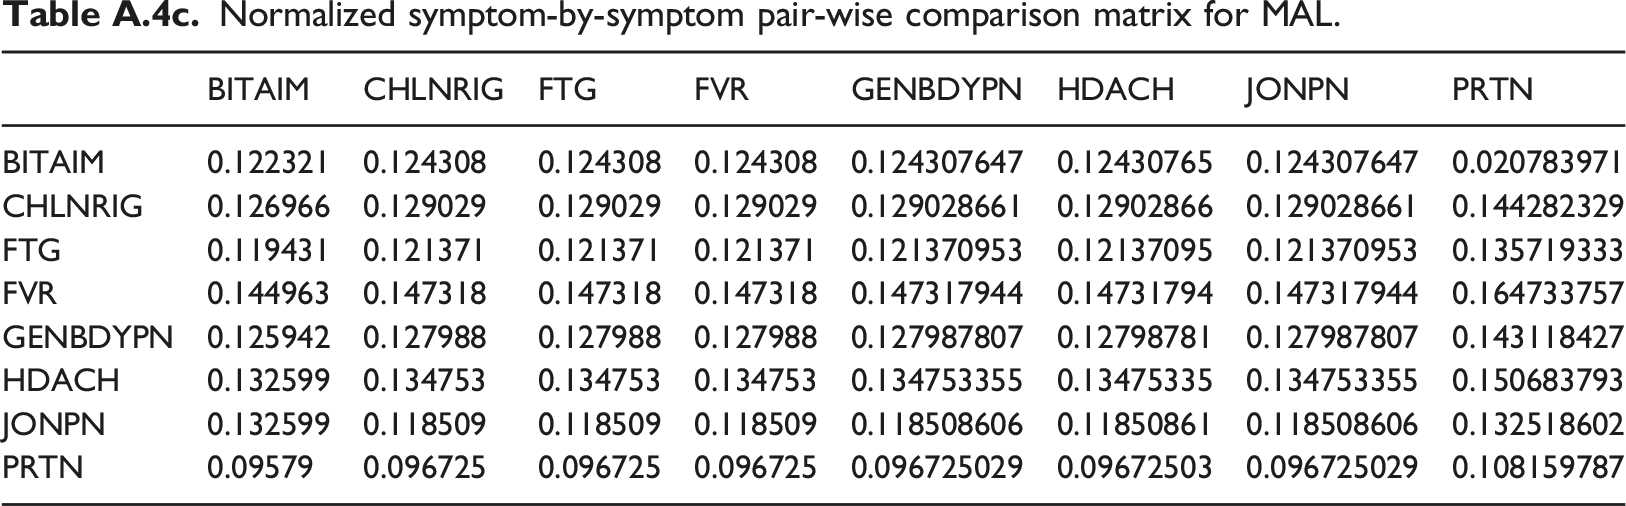
BITAIM
CHLNRIG
FTG
FVR
GENBDYPN
HDACH
JONPN
PRTN
BITAIM
0.122321
0.124308
0.124308
0.124308
0.124307647
0.12430765
0.124307647
0.020783971
CHLNRIG
0.126966
0.129029
0.129029
0.129029
0.129028661
0.12902866
0.129028661
0.144282329
FTG
0.119431
0.121371
0.121371
0.121371
0.121370953
0.12137095
0.121370953
0.135719333
FVR
0.144963
0.147318
0.147318
0.147318
0.147317944
0.14731794
0.147317944
0.164733757
GENBDYPN
0.125942
0.127988
0.127988
0.127988
0.127987807
0.12798781
0.127987807
0.143118427
HDACH
0.132599
0.134753
0.134753
0.134753
0.134753355
0.13475335
0.134753355
0.150683793
JONPN
0.132599
0.118509
0.118509
0.118509
0.118508606
0.11850861
0.118508606
0.132518602
PRTN
0.09579
0.096725
0.096725
0.096725
0.096725029
0.09672503
0.096725029
0.108159787
Weighted eigenvector for symptoms of MAL.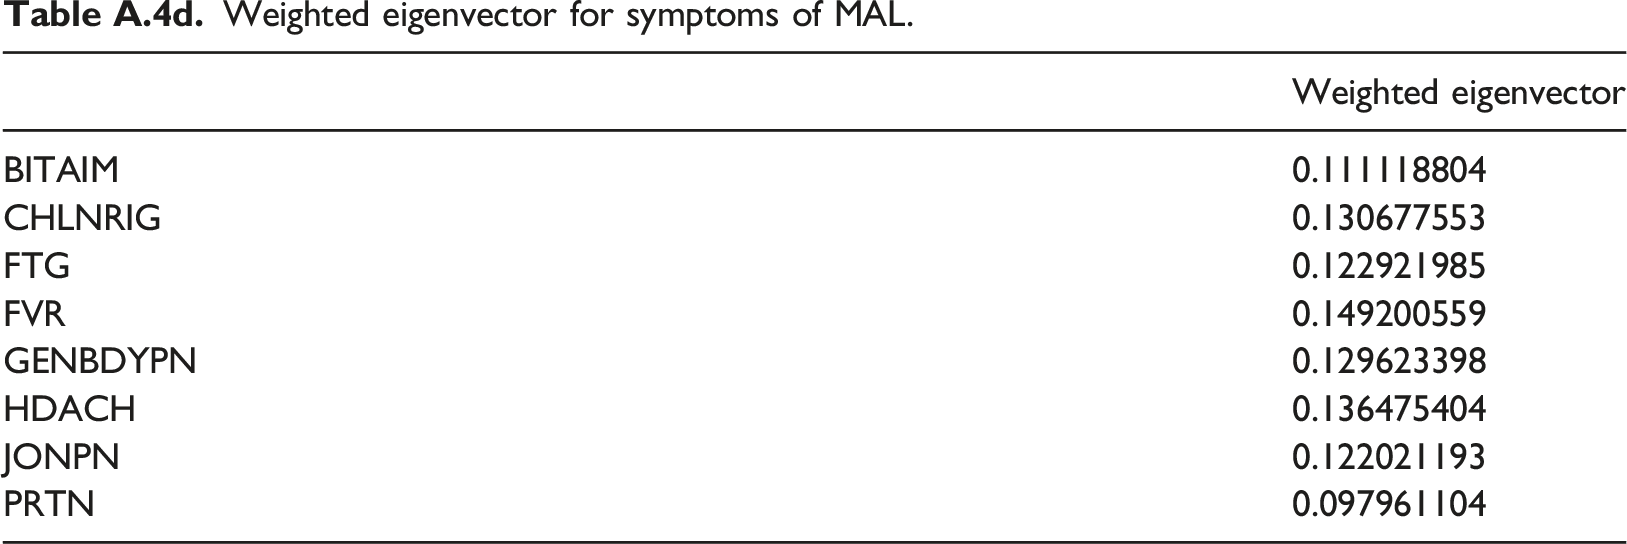
Weighted eigenvector
BITAIM
0.111118804
CHLNRIG
0.130677553
FTG
0.122921985
FVR
0.149200559
GENBDYPN
0.129623398
HDACH
0.136475404
JONPN
0.122021193
PRTN
0.097961104
Performance metrics for disease diagnosis.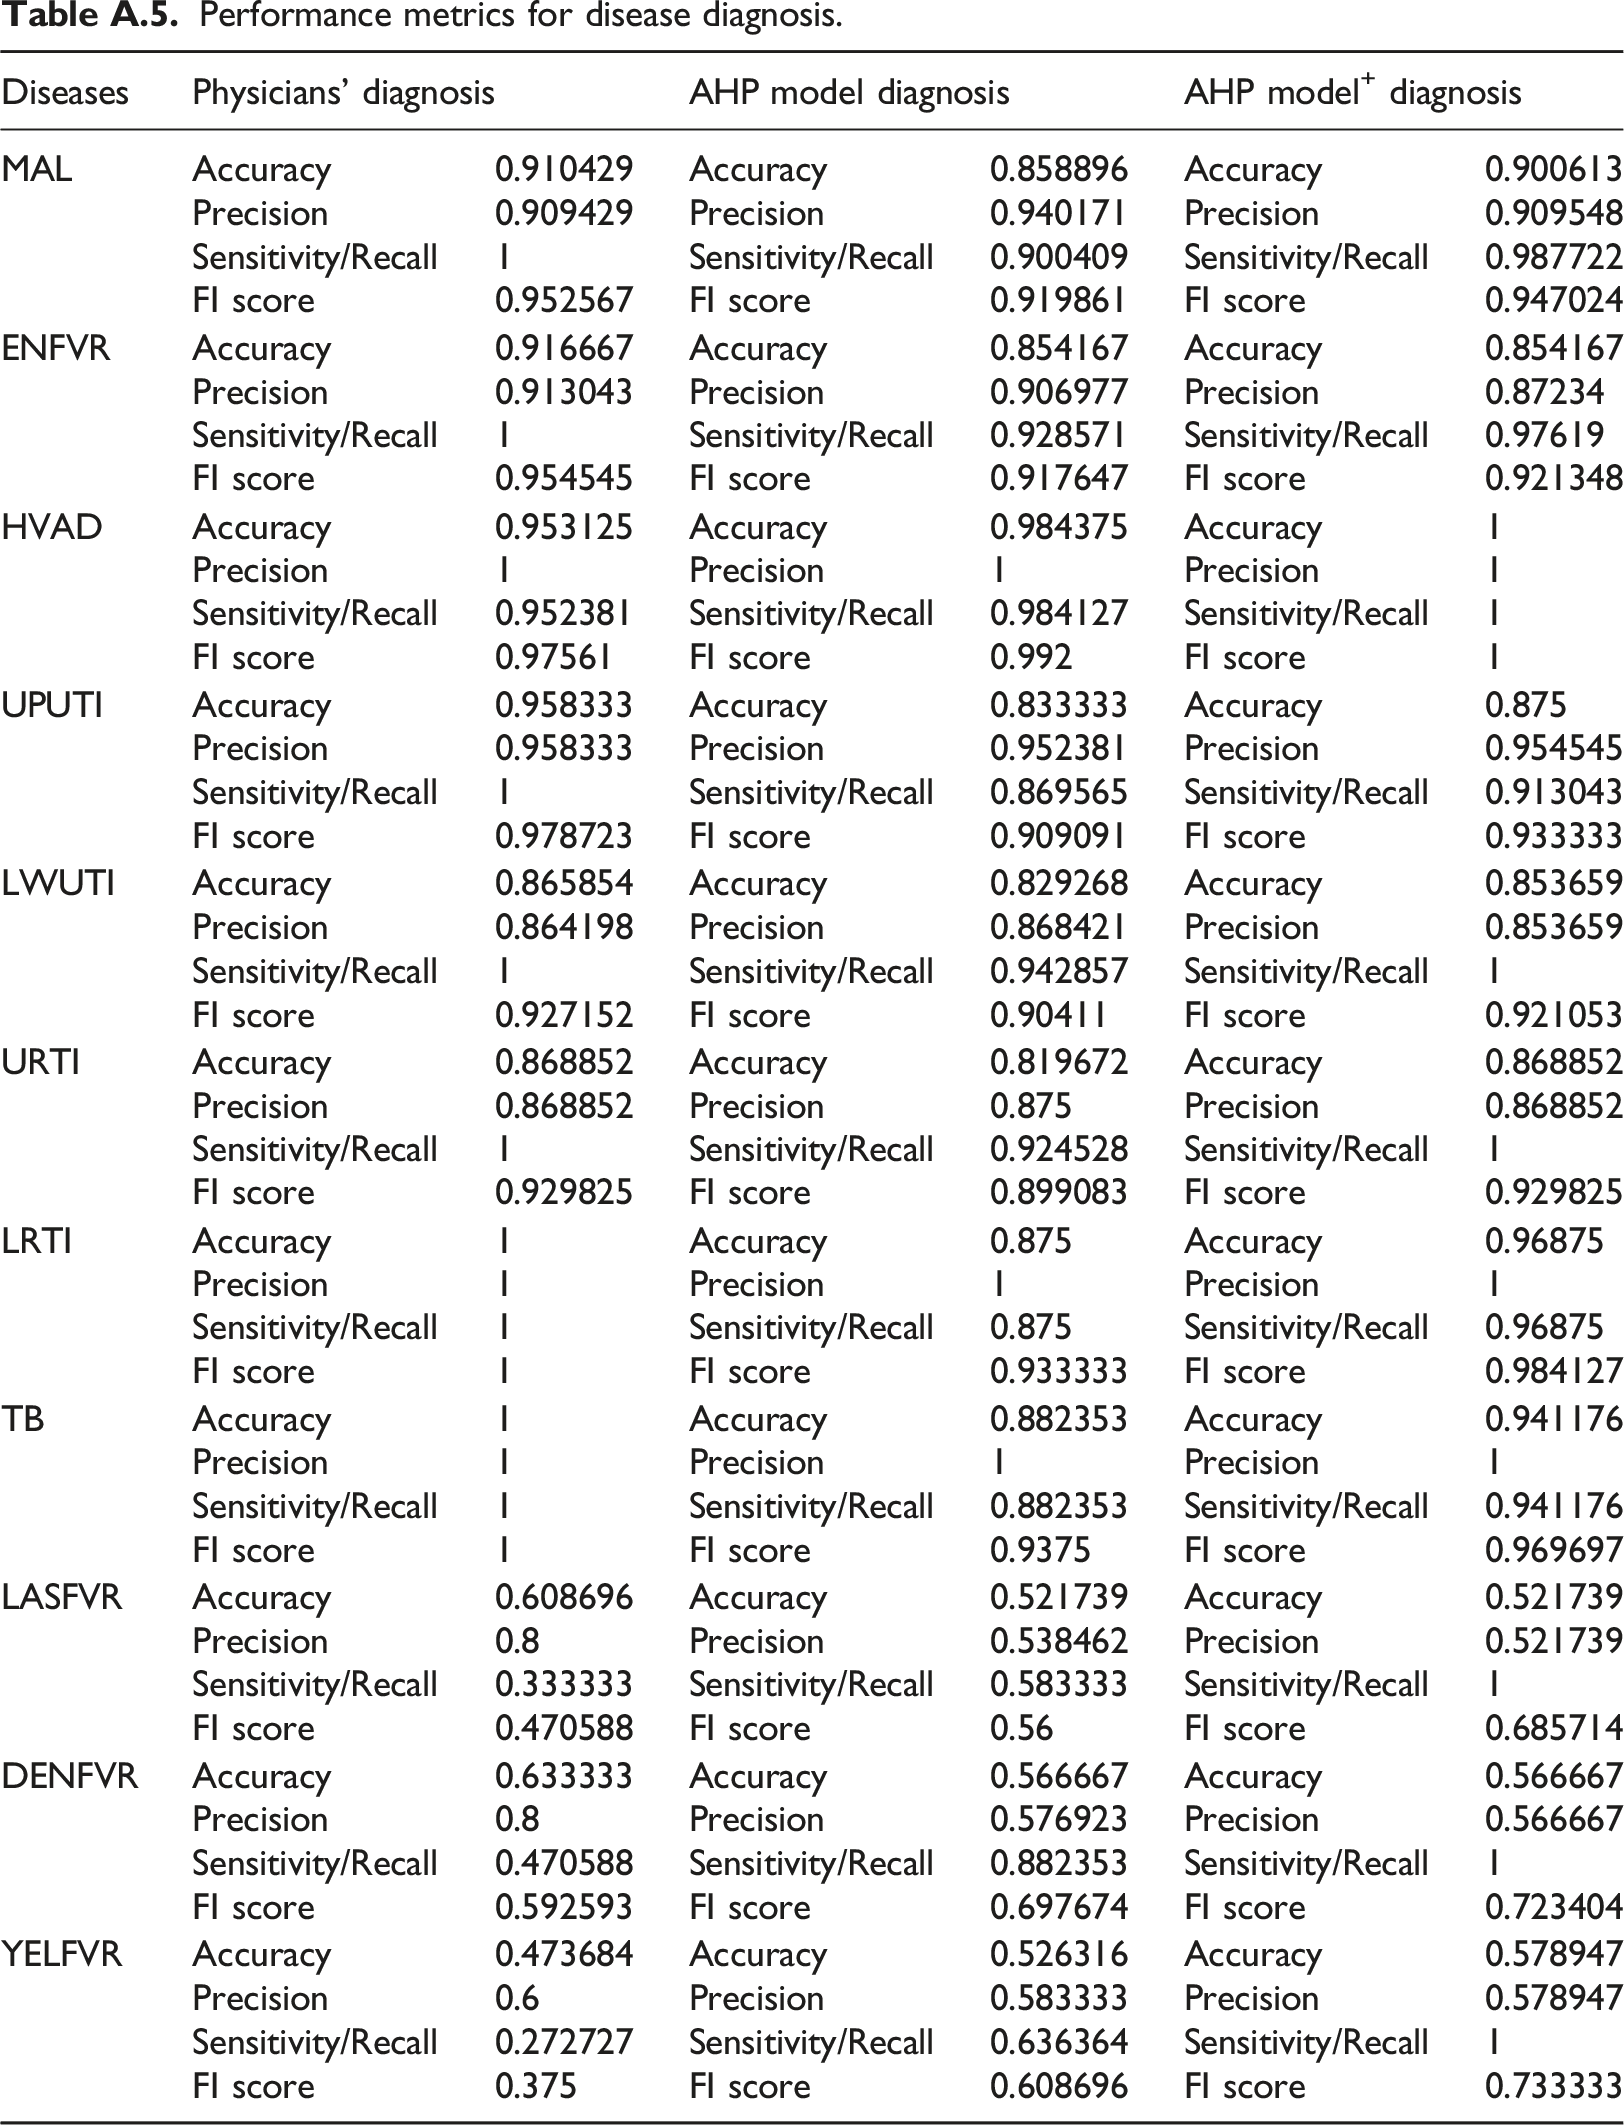
Diseases
Physicians’ diagnosis
AHP model diagnosis
AHP model+ diagnosis
MAL
Accuracy
0.910429
Accuracy
0.858896
Accuracy
0.900613
Precision
0.909429
Precision
0.940171
Precision
0.909548
Sensitivity/Recall
1
Sensitivity/Recall
0.900409
Sensitivity/Recall
0.987722
FI score
0.952567
FI score
0.919861
FI score
0.947024
ENFVR
Accuracy
0.916667
Accuracy
0.854167
Accuracy
0.854167
Precision
0.913043
Precision
0.906977
Precision
0.87234
Sensitivity/Recall
1
Sensitivity/Recall
0.928571
Sensitivity/Recall
0.97619
FI score
0.954545
FI score
0.917647
FI score
0.921348
HVAD
Accuracy
0.953125
Accuracy
0.984375
Accuracy
1
Precision
1
Precision
1
Precision
1
Sensitivity/Recall
0.952381
Sensitivity/Recall
0.984127
Sensitivity/Recall
1
FI score
0.97561
FI score
0.992
FI score
1
UPUTI
Accuracy
0.958333
Accuracy
0.833333
Accuracy
0.875
Precision
0.958333
Precision
0.952381
Precision
0.954545
Sensitivity/Recall
1
Sensitivity/Recall
0.869565
Sensitivity/Recall
0.913043
FI score
0.978723
FI score
0.909091
FI score
0.933333
LWUTI
Accuracy
0.865854
Accuracy
0.829268
Accuracy
0.853659
Precision
0.864198
Precision
0.868421
Precision
0.853659
Sensitivity/Recall
1
Sensitivity/Recall
0.942857
Sensitivity/Recall
1
FI score
0.927152
FI score
0.90411
FI score
0.921053
URTI
Accuracy
0.868852
Accuracy
0.819672
Accuracy
0.868852
Precision
0.868852
Precision
0.875
Precision
0.868852
Sensitivity/Recall
1
Sensitivity/Recall
0.924528
Sensitivity/Recall
1
FI score
0.929825
FI score
0.899083
FI score
0.929825
LRTI
Accuracy
1
Accuracy
0.875
Accuracy
0.96875
Precision
1
Precision
1
Precision
1
Sensitivity/Recall
1
Sensitivity/Recall
0.875
Sensitivity/Recall
0.96875
FI score
1
FI score
0.933333
FI score
0.984127
TB
Accuracy
1
Accuracy
0.882353
Accuracy
0.941176
Precision
1
Precision
1
Precision
1
Sensitivity/Recall
1
Sensitivity/Recall
0.882353
Sensitivity/Recall
0.941176
FI score
1
FI score
0.9375
FI score
0.969697
LASFVR
Accuracy
0.608696
Accuracy
0.521739
Accuracy
0.521739
Precision
0.8
Precision
0.538462
Precision
0.521739
Sensitivity/Recall
0.333333
Sensitivity/Recall
0.583333
Sensitivity/Recall
1
FI score
0.470588
FI score
0.56
FI score
0.685714
DENFVR
Accuracy
0.633333
Accuracy
0.566667
Accuracy
0.566667
Precision
0.8
Precision
0.576923
Precision
0.566667
Sensitivity/Recall
0.470588
Sensitivity/Recall
0.882353
Sensitivity/Recall
1
FI score
0.592593
FI score
0.697674
FI score
0.723404
YELFVR
Accuracy
0.473684
Accuracy
0.526316
Accuracy
0.578947
Precision
0.6
Precision
0.583333
Precision
0.578947
Sensitivity/Recall
0.272727
Sensitivity/Recall
0.636364
Sensitivity/Recall
1
FI score
0.375
FI score
0.608696
FI score
0.733333