
Abstract
Diagnostic complexity is an important contextual factor affecting a variety of medical outcomes. Existing measurements of diagnosis complexity either rely on crude proxies or use fine-grained measures that employ indicators from proprietary data that are not readily available. Hence, the study of this important construct in fields such as medical informatics has been hampered by the difficulty of measuring diagnostic complexity. This article presents a novel approach for conceptualizing and operationalizing diagnostic task complexity as a multi-dimensional construct, which employs the readily available International Classification of Diseases codes from medical encounters in hospitals and uses Analytic Hierarchical Process methodology. We demonstrate the reliability of the proposed approach and show that despite using a relatively simple procedure, it is able to predict readmission rates just as well as (or even better) than some of the sophisticated measures that have been used in recent studies (namely, the LaCE score index).
Keywords
Introduction
Complexity of medical diagnosis is an important contextual factor that can impact a variety of outcomes in the medical domain, including quality of care during the medical encounter as well as hospitalization outcomes such as readmission rates. 1 Diagnosis task complexity is a crucial moderator variable that can explain the link between physicians’ use of information systems and patient outcomes.2–6 Notwithstanding the importance of this construct, complexity in general has proven to be an elusive construct to measure across various settings. 7
In particular, conceptualization and measurement of diagnostic complexity in medical settings is especially challenging due to the unpredictable nature of doctor–patient encounters and the multitude of contextual factors that make an encounter more or less complex. This difficulty is further exacerbated by the sheer volume of data captured about a clinical encounter between a patient and a doctor. 3 Existing approaches to measuring diagnosis complexity either rely on crude proxies such as the number of diagnoses and risk of complications or alternatively employ techniques that use a wide array of indicators (as in the case of the severity index, Elixhauser and Charlson/Deyo Methods of Comorbidity Measurement,8,9 or the LaCE score index10,11). The methods that use a large number of clinical indicators (anywhere from 15 to 40 indicators) are not always readily available to practitioners and researchers. Critically, these more elaborate measures are still proxies for complexity as they all measure constructs specifically meaningful for clinical use (such as severity of illness, comorbidity index among others).
Hence, the primary objective of this article is to suggest a middle-ground approach for operationalizing and measuring medical diagnosis complexity. We develop this approach in a manner that captures the multidimensionality of the diagnosis task complexity construct, yet requires a simpler procedure when compared to the complicated procedures that are employed to produce metrics such as those mentioned above.
Moreover, our approach relies on data that are commonly available, namely, the International Classification of Diseases (ICD) diagnosis codes, a system of coding patient–physician encounters to record diagnoses. The use of ICD codes has advantages over other indicators captured in hospitals’ computerized systems. Past research has shown that accuracy of hospitals’ data for previous comorbidity codes tend to be very poor for a variety of reasons. 12 The factors contributing to the unreliability of these comorbidity data include poor IT infrastructure leading to lack of information sharing, financial pressures (for better remuneration by insurance companies) leading to dysfunctional coding of co-morbidities, among others.10,13,14 This difficulty is further exacerbated by the absence of adequate electronic data exchange between the Electronic Medical Record (EMR) and other clinical departments (lab, radiology, and referral systems). 15 In contrast, ICD codes are recorded at the time of patient–physician encounter and thus are less susceptible to these concerns.
ICD codes have been employed to measure an array of clinical constructs in the medical domain, including task complexity. For example, the Elixhauser and Charlson methods 16 uses ICD diagnosis codes for comorbid conditions (the presence of other diseases in addition to the primary disease the patient came in to get treated) that are present before the patient encounter takes place. It is important to note that many of the methods that employ ICD codes are primarily interested in broader clinical outcomes for the patients or hospitals and are not intended to produce a metric for the particular medical encounter. For example, the primary objective of the Charlson method is to predict mortality of the patient in a specific time span. Few approaches that attempted to characterize patient–physician encounter have relied on an array of indicators beyond ICD codes, such as diagnosis and physiological indicators (e.g. the severity index) or medications data from pharmacy systems (e.g. the chronic disease score).
Using a procedure that employs the Analytic Hierarchical Process (AHP) methodology, we are able to “translate” ICD codes into measures for several theoretical dimensions of complexity (namely, diagnostic difficulty, the amount of work done, and risk of complications). The proposed procedure is relatively simple and requires few resources. Given that task complexity is a key construct in the medical informatics field,17,18 offering a straightforward approach to measuring the construct along various dimensions has the potential to advance research in the area, for example, by enabling future research to explore the linkage between task complexity and a variety of outcomes (e.g. quality of care or electronic health records (EHR) adoption).
The second objective of this article is to present the use of a research methodology—AHP—to informatics scholars, using the conceptualization, operationalization and measurement of diagnostic complexity as an example. AHP is a multi-criteria decision making (MCDM) method that is very flexible and easy to use. It structures a problem hierarchically over multiple levels of criteria that are often conflicting and subjective. 19 This AHP procedure begins with problem formulation/modeling. For example, this stage may entail examining complexity in terms of multiple levels of subjective and objective criteria (e.g. Ben-Assuli 20 ). The formulation stage is then followed by operationalization, measurement, and interpretation. AHP can be used in health technology assessment to give a quantitative dimension to physicians’ decisions or patients’ preferences for treatment endpoints. Although originally developed to support decision making, AHP may also play a role in identifying or prioritizing the net benefit of health interventions. AHP is also useful for policy makers in combining multiple clinical outcomes of healthcare interventions in an overall health economic evaluation.21,22 AHP may be particularly relevant in cases where different outcome measures lead to conflicting results about the best alternative to reimburse. As we later show, AHP is a very good candidate for assessing the complexity of medical diagnostic decisions. Furthermore, the AHP procedure can be generalized to other constructs in the informatics domain, and our hope is that the description here will offer scholars in the field with a quantitative approach for assessing a host of phenomena.
In what follows, we first highlight the importance of the diagnostic complexity construct and review empirical studies of patient outcomes to stress the challenges associated with the measurement of this multifaceted construct. We then introduce the AHP method and show how it can be employed to derive from commonly available ICD codes a score for the diagnostic complexity of doctor–patient encounters along several key dimensions (diagnostic difficulty, the amount of work done, and risk of complications). We present analyses demonstrating the internal consistency of our AHP-based complexity measures and show that when multiple independent assessors estimate complexity, the inter-rater agreement levels resulting from the AHP procedure are superior to those obtained through a standard Likert-type-scale assessment. To illustrate the effectiveness of our complexity scales, we demonstrate that they could serve to predict important clinical outcomes. In particular, we compare our AHP-based complexity measures to the LaCE score10,11 that was designed to predict the risk of readmission (L—length of stay, a—age of the patients, C—Charlson comorbidity score index, and E—number of previous emergency department (ED) encounters in the previous half year) and show that our scale—although simple to produce and require only ICD codes—performs just as well as the complex LaCE index. In order to promote future research in the area, we make public our data regarding the complexity scores—along the various dimensions—that associated with the ICD codes used in this study (high-level three-digit code categories for some of the most common codes).
In summary, our main goal is to demonstrate a novel approach for conceptualizing and operationalizing diagnostic task complexity as a multi-dimensional construct, as well as to show that this AHP-based approach can be used to tackle similar multi-criterion problems in healthcare.
Background and significance
The task of medical diagnosis is complex and is prone to complications. 23 According to National Academies of Sciences and Medicine, 24 diagnostic errors have the potential to severely harm patients, and thus, it is essential that the diagnosis process be improved. As Angus et al. 25 explain, complex diagnosis tasks are often associated with clinical side effects or complications, thus placing a burden on the healthcare budget.
Task complexity
Historically, task complexity has been conceptualized in a multitude of ways that typically consist of dimensions such as amount of work to be done, degree of difficulty, degree of task structure, and novelty of work. 26 Campbell 7 argued that uncertainty and degree of task structure play an important role in making a task more or less complex. He made the case that when conceptualizing complexity, attention needs to be paid to factors such as the presence of multiple paths to the desired end-state, the presence of multiple desired end-states, the presence of conflicting interdependence, and the presence of uncertainty (or probabilistic linkages).
Consistent with work done in other disciplines, there is a broad consensus in medical research that complexity is a multi-dimensional construct. However, not enough measures of complexity have been established in the clinical domain.27–29 Typically, clinical measures have tended to emphasize the number of chronic conditions, medications, and even the use of medical resources/costs as a proxy for complexity.28,29 Furthermore, commonly used proxies are not always accurate.30,31 Kimberlin and Winterstein 30 argue that in medical research, there is a need to better align theoretical concepts (e.g. complexity) with proxy measures in appropriate contexts so that they are reliable and valid.
Revisiting the AHP method
AHP is a multi-criteria method for organizing and analyzing complex decisions.19,32–34 The AHP method, developed by Saaty, 19 is aimed at solving problems with a large number of variables and is particularly useful when dealing with a combination of quantitative and subjective elements. The AHP model takes into account a judgment rather than an objective measurement and assigns a meaning to the priorities made by the decision maker. The AHP procedure serves to structure the decision problem into a hierarchy reflecting the underlying values, goals, and objectives of the decision makers. 35 While AHP has been used in a handful of studies in the clinical context in the healthcare domain, 33 to the best of our knowledge, it has not been employed in the medical informatics field at the intersection of healthcare and technology, despite its potential.
AHP constitutes a measurement and comparison tool that determines the substitutability between pairs of criteria which relate to a decision-making process. Specifically, when using AHP, the decision maker compares one pair of factors at a time, instead of scoring each factor directly (e.g. rating the element on a Likert-type scale). Without a rigorous method such as AHP, the decision outcome is prone to biases. 36
Multiple comparisons between pairs of factors can lead to inconsistencies, 37 such as the primacy effect, the recency effect, and the bandwagon effect (where people express their opinions based on what they expect other people think). These inconsistencies within AHP are controlled for and measured by an inconsistency coefficient. Lane and Verdini 38 recommended taking a stringent view of inconsistencies when the inconsistency coefficient exceeds 10%, which is the standard applied in the case study here.
Diagnostic complexity: development of criteria
The first step in the AHP procedure entails problem formulation. In our context, we begin with a conceptualization of diagnosis complexity by decomposing the construct into different factors (as outlined below). We then show how our conceptualization can be operationalized with AHP by linking complexity to ICD codes.
One particularly relevant way of conceptualizing complexity in the clinical setting is to look to practice to see how providers are compensated for the provision of medical care. A widely used report from the Center for Medicare and Medicaid Services 39 specifically operationalizes the complexity of medical decision making based on (a) the number of diagnoses or management options, (b) amount and/or complexity of data to be reviewed, and (c) risk of complications and/or morbidity. This categorization is in line with extent theoretical frameworks. 40 The report uses these factors to derive an aggregate diagnostic complexity score along a continuum spanning four levels: straightforward, low complexity, moderate complexity, and high complexity (see Table 1). This complexity scale is widely used in hospitals throughout North America to reimburse medical providers by the government for the care rendered during a medical encounter.
Task complexity criteria (from CMS 40 ).
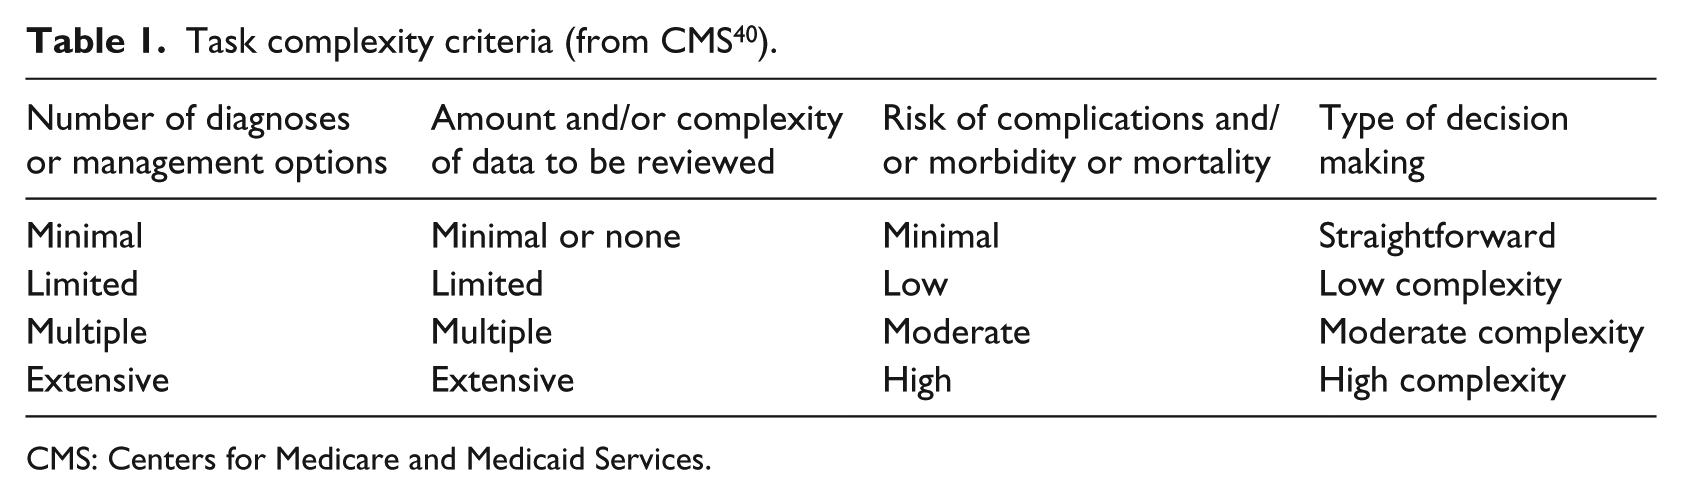
CMS: Centers for Medicare and Medicaid Services.
Synthesizing the complexity indicators fleshed out by Gill and Hicks 26 together with the guidelines provided by Centers for Medicare and Medicaid Services (CMS) in evaluating clinical complexity, our operationalization of medical diagnosis complexity focuses on the following three dimensions as the top-level criteria:
Diagnosis difficulty (e.g. a diagnosis can be harder to arrive at if the patient presents symptoms that suggest multiple candidates for diagnosis or if the patient presents symptoms that are contradictory);
The amount of work done in diagnosing;
Risk of complications or comorbidity (reflecting the importance of the decision).
While in the case of our operationalization of diagnosis complexity, this top-level conceptualization provided sufficient granularity, it should be noted that the AHP procedure allows for a further breakdown of the hierarchical structure, possibly descending multiple levels.
ICD codes and diagnosis complexity
We derived our diagnosis complexity metrics along the three dimensions mentioned above by turning to a commonly available, well-structured, standardized categorization schema (ICD), which is used to code and record medical diagnoses during doctor–patient encounters. The World Health Organization, the National Center for Health Statistics (NCHS), and the CMS have developed the “ICD” coding system, which has gone through a series of revisions and updates.41,42 The ICD coding system was designed to promote international comparability in the collection, processing, classification, and presentation of mortality statistics. It assigns codes to both diagnoses and procedures associated with hospital utilization in the United States (and around the world) and is the dominant standard for billing and morbidity indexing in the United States. This reporting responsibility makes the assignment of ICD codes a necessity for most or all healthcare organizations, and the ICD codes are commonly used in EHR as a means of recording the nature of the medical encounter (note that the ICD diagnoses coding scheme is most relevant to our investigation).
The availability of coded data has led to the use of ICD codes for research involving clinical records, where typically these codes are used to identify the incidence of a specific condition. Frequently, the data derived from the code are used to compute simple statistics—for example, the prevalence of specific conditions such as cancer types or sepsis in order to utilize them in clinical research.43–45 For example, Calle et al. 44 investigated the putative role of obesity in increasing the risk of death in different types of cancers, where the latter was computed using ICD codes. The primary limitation of this approach is that it does not allow for a direct mapping between ICD codes and constructs such as diagnosis task complexity. An alternative methodology aims at developing measures for more general constructs by utilizing ICD codes. For example, scoring systems have been developed to evaluate the severity of a patient’s injuries using ICD codes. 46 However, this approach requires additional granular details to map a particular ICD code to a construct category (e.g. high severity). Because of the extensive data collection and manual effort required in developing such a scheme, data owners often choose not to make it freely available, thus limiting the potential for research in this area.
Here, we advocate a middle ground, where we map ICD codes to a theoretically grounded construct—in our particular case, diagnosis complexity—by relying on ICD codes alone. One immediate outcome of this straightforward approach for mapping of codes to constructs is that the mapping scheme is made publicly available. Our ICD code construct mapping employs a rigorous and relatively underused methodology known as AHP.
Methods and results
This section describes the various steps in applying the AHP method including problem formulation, articulation of decision hierarchy, construction of pair-wise comparison matrices, consistency validation, and the computation of AHP score. In addition, we demonstrate the effectiveness of the AHP scales and compare their consistency against those of standard Likert-type scale ratings.
Using AHP to derive diagnosis complexity score: a brief demonstration of the AHP method
To arrive at a diagnostic complexity score for patient encounters, we apply the following steps (for a detailed description of the AHP procedure, see Supplemental Material Appendixes A and B):
Step 1: formulate the problem
In this step, we identified the problem as the need to evaluate the diagnostic complexity of patient encounters so that we can use it in empirical studies to evaluate a panoply of issues such as EHR system use and quality of care. This step was discussed in more detail in section “Background and significance”.
Step 2: conceptualize the problem by structuring the decision hierarchy
Next, to derive a conceptualization of task complexity, we consulted a number of resources including the vast literature on task complexity and studies on diagnostic complexity in medicine, as well as practical guidelines. The result of this process was a three-dimensional conceptualization of diagnosis task complexity made up of diagnostic difficulty, the amount of work done, and risk of complications. We further evaluated the face validity of this conceptualization by interviewing experts in the area (four physicians in different specializations).
Step 3: construct sets of pair-wise comparison matrices
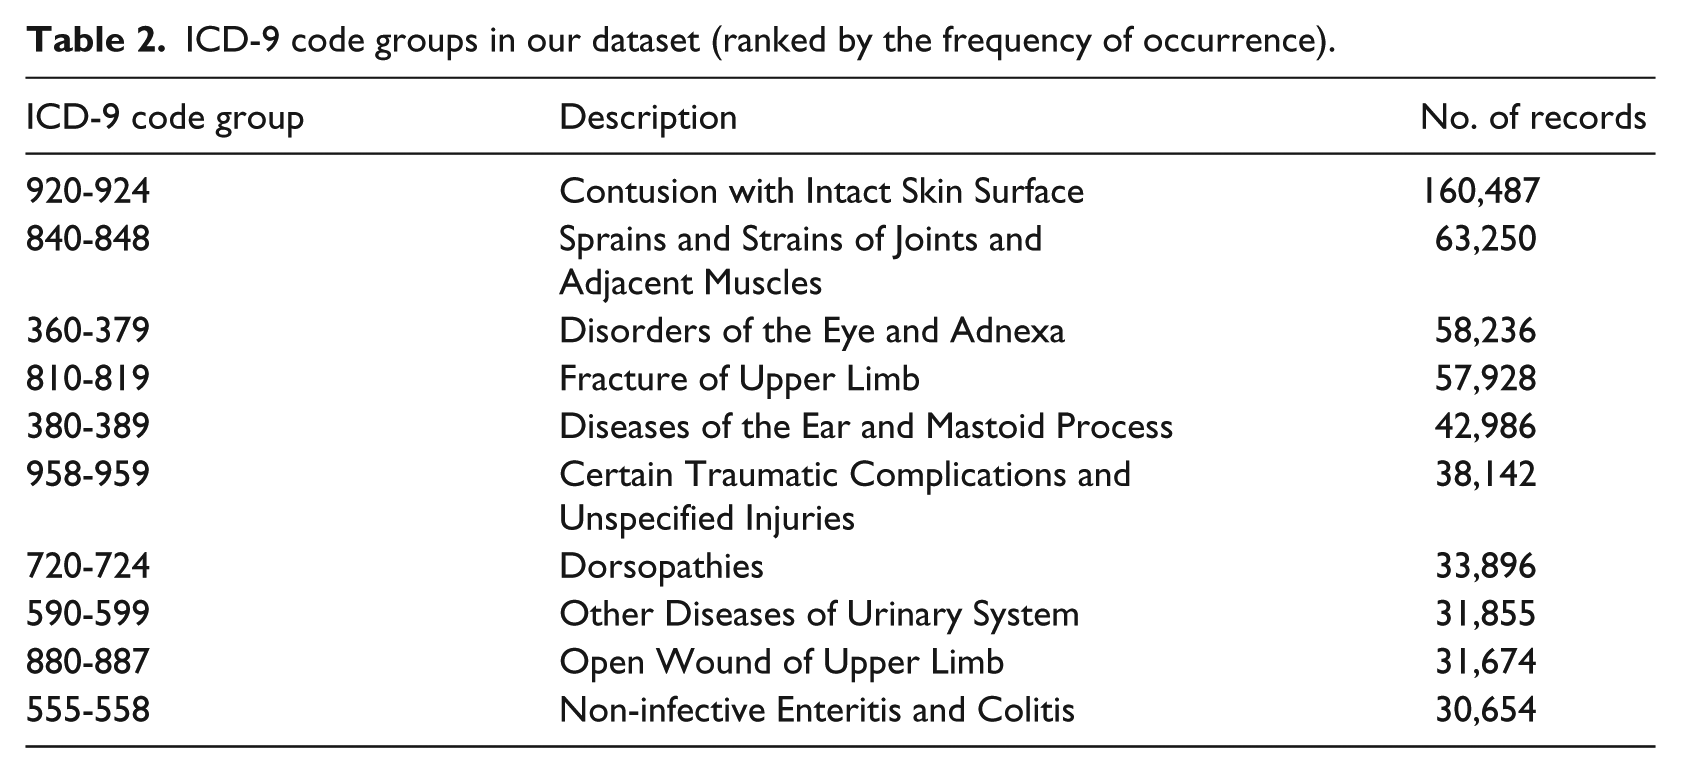
In this step, we relied on the International Classification of Diseases (9th Revision; ICD-9) codes associated with each patient record to evaluate the complexity of each diagnosis. We employed a large database of ED referrals. Although the EDs experience enormous pressure and constraints on manpower resources, there are positive findings for improved financial outcomes when EHR were implemented in EDs. 47 The log-files were made up of data collected from seven main hospitals, all owned by the primary Health Maintenance Organization (HMO) in Israel, over a period of 4 years. The EDs in these hospitals use an EHR over a Health Information Exchange (HIE) network platform to share medical information from points of care operated by their affiliated health suppliers. We worked with the 10 most common codes in our dataset, as listed in Table 2. The mapping of ICD-9 codes onto these complexity dimensions involved a labor-intensive manual procedure employing the AHP technique (which yielded a final complexity score for each ICD code group).
ICD-9 code groups in our dataset (ranked by the frequency of occurrence).
We then recruited experts to help convert the ICD codes into a diagnosis complexity scale. We asked four senior physicians to participate in the study (all with extensive ED experience in the hospitals included in our sample). Each physician was first informed about the aim of the study. Then, to generate an aggregate complexity construct, they were provided with definitions of the three complexity dimensions and were asked to directly compare each of these dimensions in terms of their importance, as shown in the figures below (Figure 1(a) and (b)). The physicians were asked use a computer-controlled sliding scale to indicate the relative importance of each dimension (on a scale of 9).
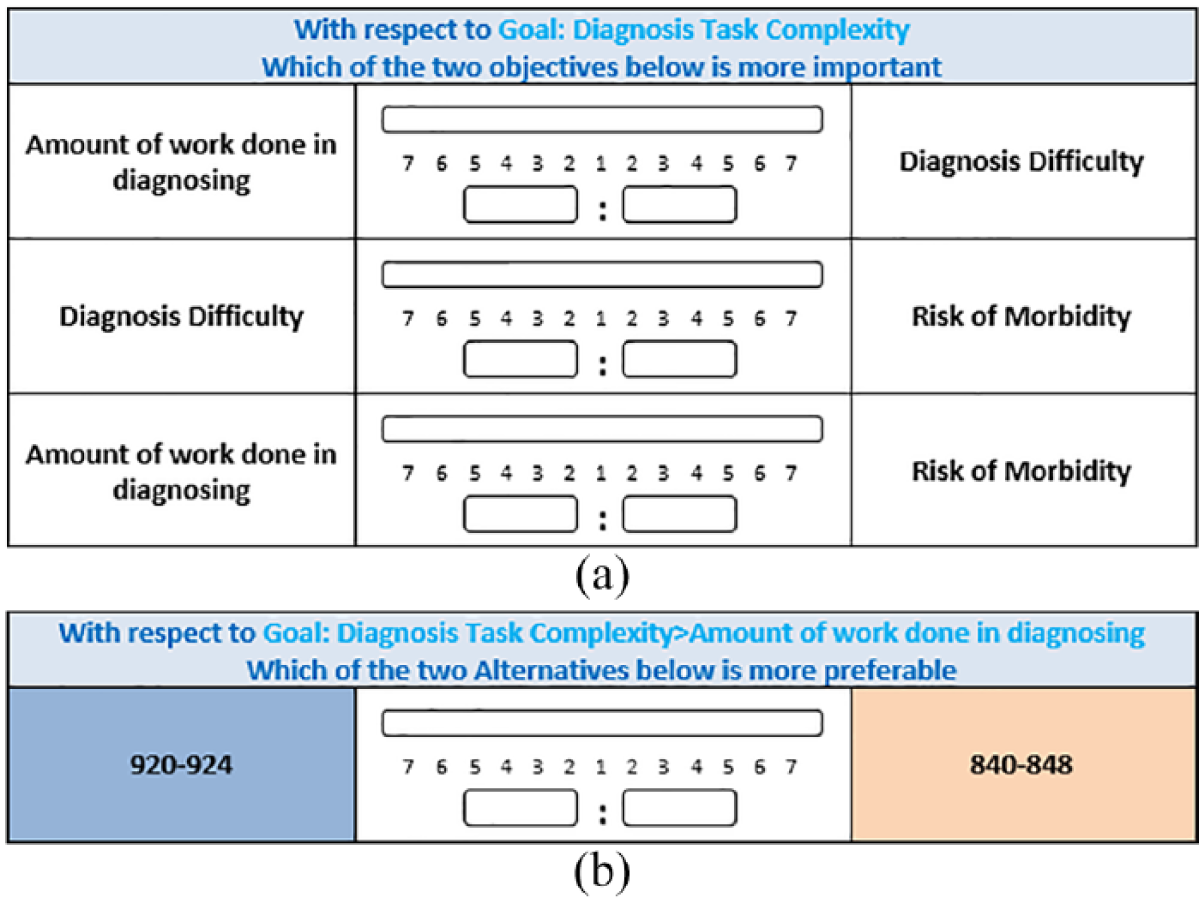
(a) Screenshot of the scale used to compare the relative importance of the three dimensions of diagnosis task complexity. (b) Screenshot of the scale used to compare the relative importance of one of the ICD codes for one of the sub-dimensions: amount of work done.
The physicians were then handed 10 cards describing each of the ICD-9 code groups (for each group, its name and the list of specific codes it contained). For purposes of illustration, see Figure 2 for illustration of one ICD-9 code group.
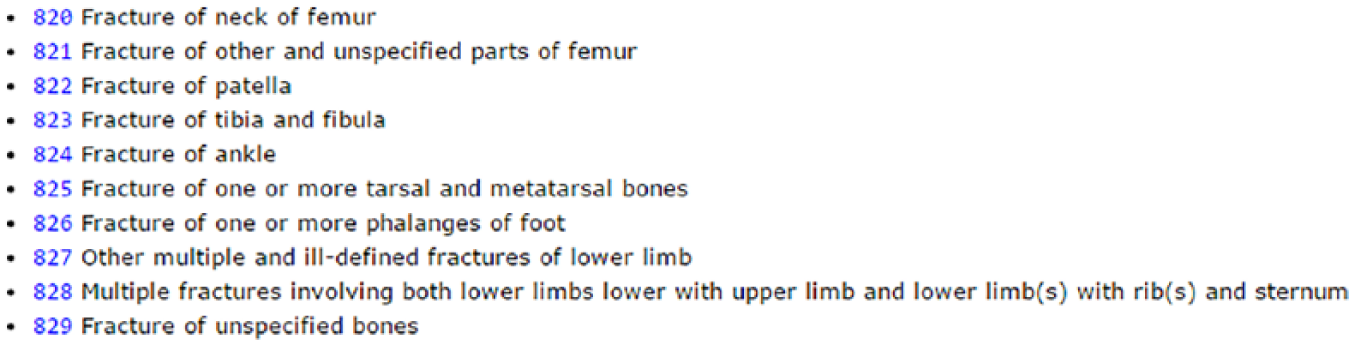
An example of a card (for “Fractures of Lower Limb; ICD code group 820-829) used in the AHP pair-wise comparisons of ICD code groups.
The physicians were then asked to compare each combination of codes in terms of the three complexity dimensions and record their comparisons. This resulted in three 10 × 10 matrices. The example below reproduces one such matrix that resulted from a comparison of the 10 ICD codes to each other in terms of one of the complexity factors (e.g. diagnosis difficulty). The ICD codes are listed in the top row in Figure 3. The physician made 45 direct comparisons for this one matrix).
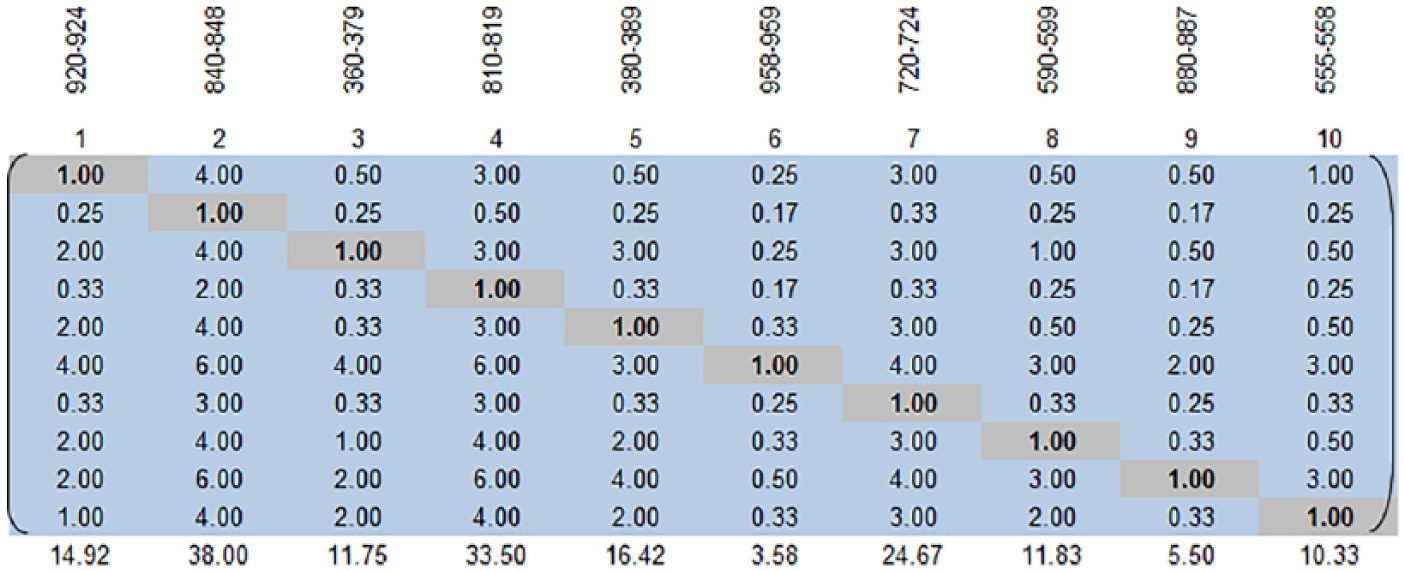
The resulting AHP matrix for the ten ICD codes (for a single assessor).
For example, the value of 3.0 in the (1 × 4) element of the matrix indicates that the participant thought that ICD code 840-848 was three times as important in determining diagnosis difficulty as ICD code 920-924. Given this entry, the software automatically computed the value for the transpose element (the relative importance of 920-924 compared to 840-848). The AHP method computes this by performing the simple calculation of 1/x; hence, 3 results in 0.33 for its transpose; 4 results in 0.25 that is rounded off to 0.3 for this illustration.
Step 4: check the ratings in the pair-wise comparison matrices for consistency
AHP then organizes the pair-wise comparisons in matrix form. A weighted average can eventually be used to compute a final weight (complexity score) for each ICD code. But before deriving this score, the ratings need to be tested for two types of consistency—an individual consistency measure that examines whether ratings by a single individual are internally consistent and a group consensus measure that examines ratings between individuals to arrive at a consensus.
At this stage, we transferred the pair-wise matrices from the “Expert Choice” software (http://expertchoice.com/) we used to perform the comparison to MS Excel. AHP produces an internal consistency metric by identifying when a subject’s pair-wise comparisons are not entirely in line with one another. We checked the consistency of all four experts’ answers on each dimension and found that their responses more than adequately met the criteria for an absence of inconsistencies in judgment. 48
We used Excel after adjusting the values to solve minor inconsistency problems using Bunruamkaew. 49 This method involves rating each decision alternative and assigning the weights for each criterion by developing a pair-wise comparison matrix for each criterion, normalizing the resulting matrix, averaging the values to get the corresponding rating, and then calculating and checking the consistency ratio after calculating the weighted average rating for each decision alternative.49–51 See Supplemental Material Appendix A for a more detailed information on these steps.
The physicians who mapped the ICD-9 codes to the complexity constructs all met the accepted tolerance level for inconsistencies in AHP (Diagnosis Difficulty: 5.0%–9.6%; Amount of Work: 5.1%–9.8%; and Risk of Complications: 2.3%–8.7%), thus providing us with reliable scores for diagnosis complexity. We then analyzed the consensus between the four different assessors to find the following consensus levels (calculated by AHP): Difficulty: 66.9%; Amount of Work: 71.7%; and Risk: 67.5%. Based on the accepted interpretation for inter-agreement metrics (such as Kappa or intra-class correlation coefficients (ICC)), a consensus of 0.6–0.8 is interpreted as “High Agreement.”52,53
Step 5: use these pair-wise comparison matrices to compute the final score
Once the measures for each criterion had been calculated independently, AHP can aggregate these scores into the higher level complexity construct. We used the Brunelli et al. 48 procedure to aggregate the complexity dimensions (amount of work done, diagnostic difficulty, and risk of complications) into a single aggregate construct. 54
We then calculated the geometric prioritization row geometric mean method (RGGM) for each participant based on the literature 54 (see Supplemental Material Appendix B). RGGM is a prioritization method that computes the final priority order for alternatives. We computed the weighted scores using the pair-wise comparisons of all respondents across the ICD-9 diagnoses for each dimension using the process in Xu 55 (Figure 4). The consolidated calculation is based on the geometric mean of the participants as shown below (n: the number of criteria; Xi: decision values per criterion, and Wi: weighted matrix per criterion).
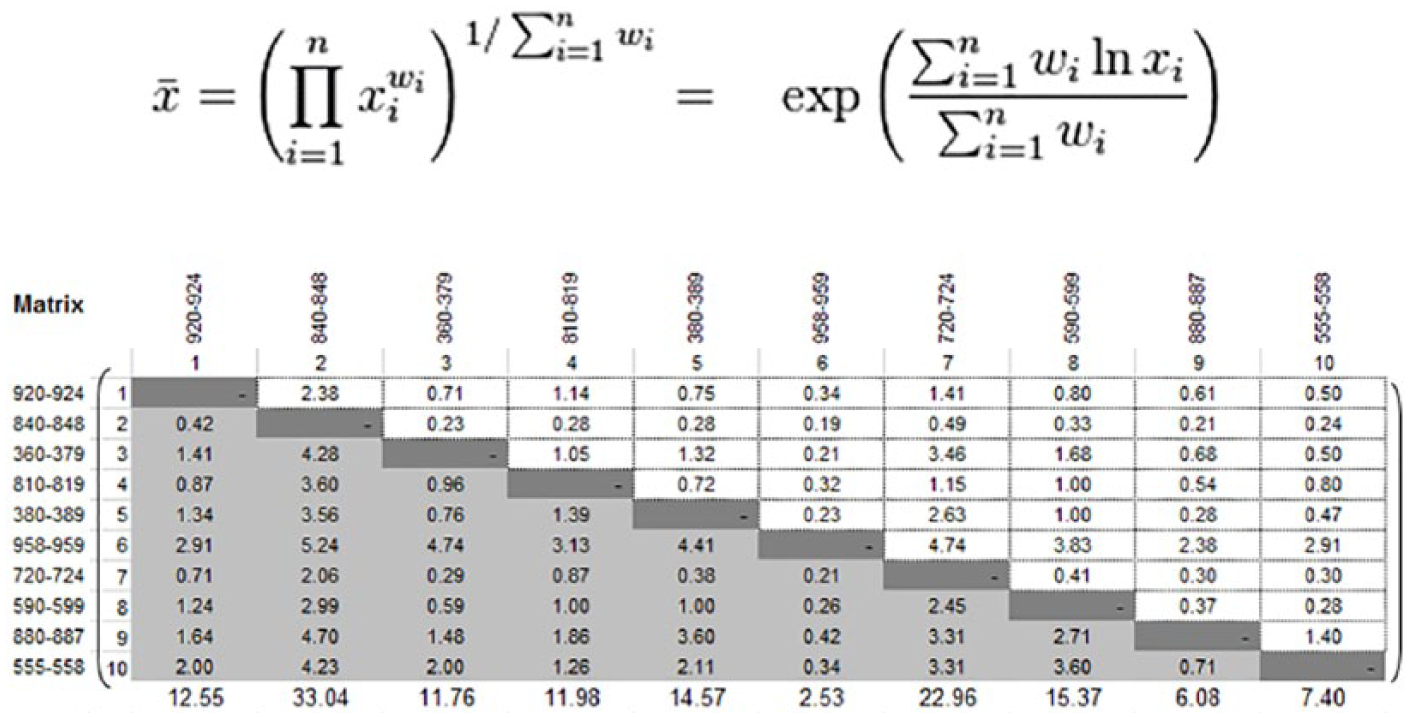
The weighted calculation of all assessors.
We finally arrived at the weights by calculating the geometric prioritization (RGGM) of the different diagnoses for each dimension according to all respondents, including normalization according to Dong et al. 54 Figure 5 shows the final weights (see Supplemental Material Appendix B for the calculation steps).
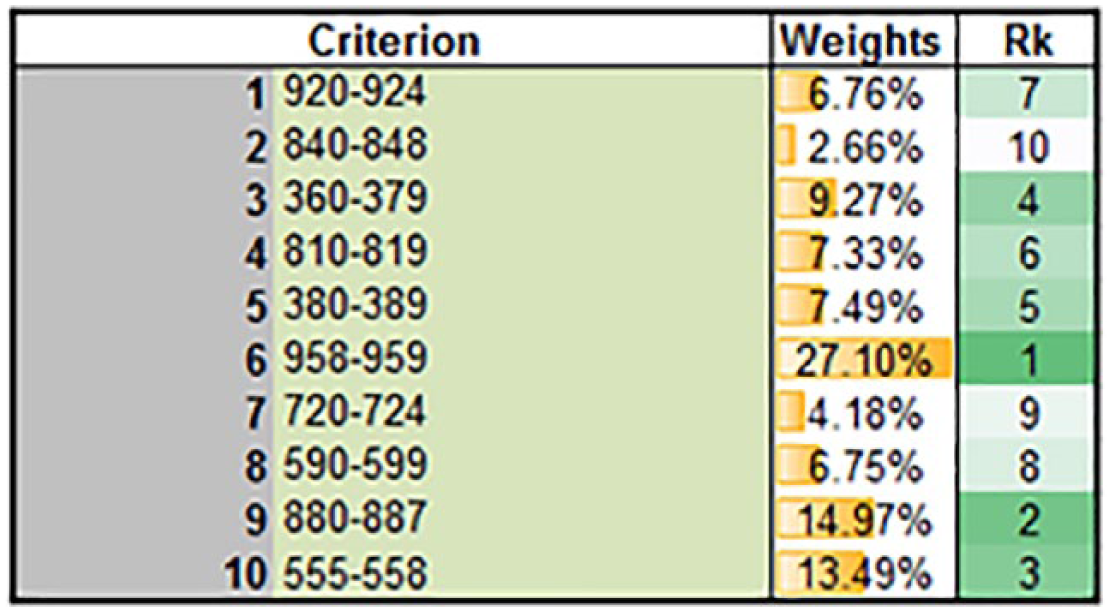
RGGM output for all diagnoses according to all respondents.
After verifying the level of consensus (see Supplemental Material Appendix B) across all physicians, we calculated the AHP complexity score for each ICD-9 code as the average of the four assessors. To complete the analysis, each patient record was associated with a diagnosis complexity score based on the AHP score for the ICD-9 code in that patient’s record. This complexity score can now be used to hypothesize the relationship between diagnostic complexity and a host of critical constructs in the health information technology (HIT) field (EHR use, task complexity, as well as other relevant antecedents and other outcome variables such as quality of care).
Demonstrating the effectiveness of our AHP-based complexity scales
A key conjecture to our study is that our AHP-based scales of diagnosis task complexity provide a middle ground: on one hand, they rely on few data sources (namely, the commonly available ICD codes), and on the other hand, they are effective in the sense that they can replace the more sophisticated measures that are used in the literature. Thus, we computed from our data the LaCE score and compared it against the AHP-based measure in terms of its ability to predict a common outcome measure: readmission rates. The LaCE index10,11 has been developed to identify patients at high risk of hospital readmission, so they can be targeted for interventions aimed at reducing the rate of readmission. 56 Computing the LaCE score demands additional effort for collecting more data (as explained in the Introduction section), whereas all the information needed for our AHP-based complexity index (namely, ICD codes) are publicly available. Our analysis shows that the correlation between LaCE and readmission rates was 0.008 (this figure is in line with findings from other studies that have found weak impact of LaCE on readmissions 57 ). In comparison, the correlation for our AHP-based complexity index was substantially higher 0.017 (both correlations, although quite weak, were statistically significant, p value <0.001). This analysis demonstrates the usefulness of our approach for developing a task complexity index.
Analysis of inter-rater agreement: comparison AHP against Likert-type scale ratings
The analysis presented above demonstrates that for each of our study’s assessors independently, AHP scores (for the various complexity dimensions) were internally consistent. The additional analysis presented in this sub-section is intended to test the inter-rater agreement (or consistency) between the assessors. As a baseline, we asked our assessors to rate the complexity (along the various dimensions) of each of the ICD codes using a 5-point Likert-type-scale. We then compared inter-rater agreement levels between AHP and Likert-type scales for the same set of assessors. As can be seen in Table 3, for all three complexity dimensions, AHP-based scales yielded substantially higher agreement levels when compared to the Likert-type scale, in terms of both Cronbach’s alpha and ICC.
Inter-rater agreement comparison AHP versus Likert-type over all three complexity dimensions.
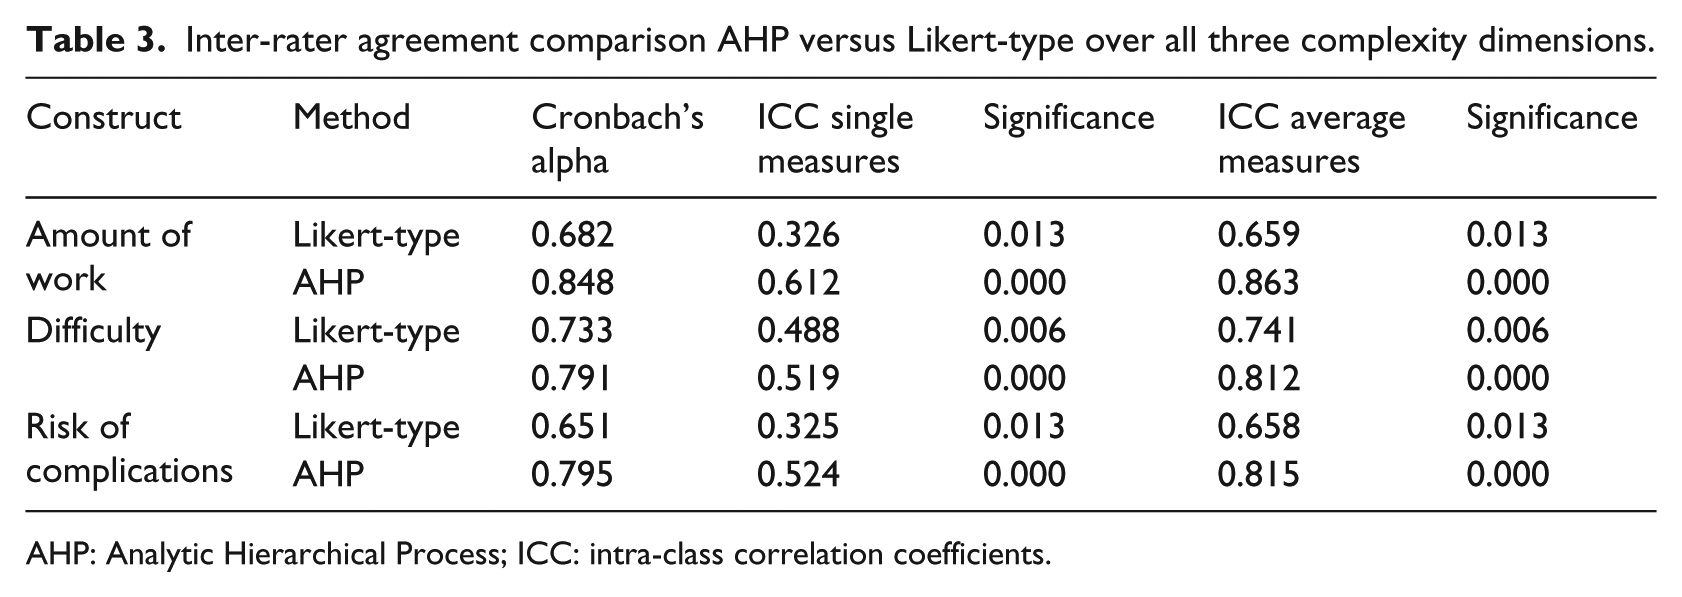
AHP: Analytic Hierarchical Process; ICC: intra-class correlation coefficients.
Discussion
Task complexity has always been a critical antecedent in explaining task performance.7,26 With respect to clinical encounters between physicians and patients, the diagnostic complexity of that encounter should be a critical variable in explaining clinical outcomes. However, task complexity in general and diagnostic complexity in particular have always been difficult constructs to operationalize. Existing approaches to measuring diagnosis complexity either rely on very crude proxies or alternatively employ an extensive set of indicators from proprietary data that are not readily available to practitioners and researchers and are still indirect proxies to measure complexity. As a consequence of the difficulty of measuring diagnostic complexity, the application of this important construct has been limited.
We proposed a promising middle-ground approach to conceptualizing and measuring diagnosis complexity, which captures the various facets of this construct, yet requires relatively little manual effort and relies on readily accessible data. We reviewed research on diagnosis complexity as well as the ways in which expert physicians characterize these clinical encounters. Based on this exploration, we conceptualized complexity as a multi-dimensional construct comprised of diagnosis difficulty, the amount of work done in diagnosing and risk of complications/comorbidity. The importance of our work lies in linking this conceptualization of complexity to ICD codes. We accomplish this by using an under-utilized research method—AHP. We demonstrate that our AHP-based scales of diagnosis complexity is a useful predictor of readmission rates and could effectively be used to replace commonly used measurements of the clinical process, such as LaCE score index. By making our complexity scores for the most common ICD codes publicly available, we hope to facilitate future research that is interested in understanding the antecedents and consequences of diagnosis task complexity.
We provided a short demonstration of how to use the AHP method with the hope that practitioners will come to realize the potential of this approach, potentially applying it in a variety of medical domain to solve a range of problems that can be structured hierarchically. We used the AHP method to assign complexity scores for 10 high-level ICD codes. Since AHP requires experts to provide comparisons among the different options (i.e. the ICD categories), the number of comparisons increase exponentially with the number of options. Thus, the usefulness of this approach is limited by the amount of manual labor. In our case, we employed this method to assign scores for the most popular ICD codes, which accounted for a significant portion of the records in our data. Applying AHP to problems that include a large number of options (and require many comparisons) would require the investment of substantial effort.
In conclusion, despite the importance of the diagnostic complexity construct, to date scholars and practitioners alike struggled with its measurement. Existing measurements of diagnosis complexity either rely on crude proxies or alternatively use fine-grained measures that employ indicators from difficult-to-come-by proprietary data. This study proposed a relatively simple approach for estimating diagnosis complexity by relying on readily available ICD codes and a process based on the AHP method. The findings from our study—complexity scores along three important dimensions for a set of very common ICD codes—could be used in future research that attempts to link diagnosis complexity to other constructs.
AHP is a rigorous MCDM method that works by structuring a problem hierarchically over multiple layers of criteria, making it possible to compare criteria that can often appear subjective (e.g. diagnosis difficulty and risk of complications). Although AHP is not a new approach and has been applied before in the medical domain (e.g. to make decisions on patient participation, diagnosis, technology evaluation, and healthcare policy33,58) and beyond (e.g. to operationalize project complexity where project complexity59,60), its application has been rather limited. Medical research is challenged by the difficulty of assessing a variety of subjective phenomena. By demonstrating the value of the AHP method and providing a guide on how to use it, we hope to open the door for future research would apply AHP to the measurement of hierarchically structured constructs in the medical domain.
Supplemental Material
Appendix_AHP_15092018_Revised – Supplemental material for The use of analytic hierarchy process for measuring the complexity of medical diagnosis
Supplemental material, Appendix_AHP_15092018_Revised for The use of analytic hierarchy process for measuring the complexity of medical diagnosis by Ofir Ben-Assuli, Nanda Kumar, Ofer Arazy and Itamar Shabtai in Health Informatics Journal
Footnotes
Declaration of conflicting interests
The author(s) declared no potential conflicts of interest with respect to the research, authorship, and/or publication of this article.
Funding
The author(s) received no financial support for the research, authorship, and/or publication of this article.
Supplemental material
Supplemental material for this article is available online.
References
Supplementary Material
Please find the following supplemental material available below.
For Open Access articles published under a Creative Commons License, all supplemental material carries the same license as the article it is associated with.
For non-Open Access articles published, all supplemental material carries a non-exclusive license, and permission requests for re-use of supplemental material or any part of supplemental material shall be sent directly to the copyright owner as specified in the copyright notice associated with the article.