
Abstract
Heart failure is a clinical syndrome that occurs when the heart is too weak or stiff and cannot pump enough blood that our body needs. It is one of the most expensive diseases due to frequent hospitalizations and emergency room visits. Reducing unnecessary rehospitalizations is also an important and challenging task that has the potential of saving healthcare costs, enabling discharge planning, and identifying patients at high risk. Therefore, this paper proposes a deep learning-based prediction model of heart failure rehospitalization during 6, 12, 24-month follow-ups after hospital discharge in patients with acute myocardial infarction (AMI). We used the Korea Acute Myocardial Infarction-National Institutes of Health (KAMIR-NIH) registry which included 13,104 patient records and 551 features. The proposed deep learning-based rehospitalization prediction model outperformed traditional machine learning algorithms such as logistic regression, support vector machine, AdaBoost, gradient boosting machine, and random forest. The performance of the proposed model was accuracy, the area under the curve, precision, recall, specificity, and F1 score of 99.37%, 99.90%, 96.86%, 98.61%, 99.49%, and 97.73%, respectively. This study showed the potential of a deep learning-based model for cardiology, which can be used for decision-making and medical diagnosis tool of heart failure rehospitalization in patients with AMI.
Keywords
Introduction
Heart failure (HF), also known as congestive heart failure (CHF), is a clinical syndrome caused by a structural or functional cardiac abnormality, resulting in reduced cardiac output or elevated intracardiac pressure. 1 Medical conditions such as coronary artery disease, heart attack, high blood pressure, diabetes, and even coronavirus disease-19 (COVID-19) can lead to HF.2–4 It is one of the most expensive clinical syndromes due to frequent hospitalizations and emergency room visits. 5 The incidence of HF and its resulting mortality rate will continue to increase, as the population ages. 6 Consequently, the economic burden is rapidly increasing worldwide due to the increase in the prevalence of HF. 7 Rehospitalization after hospital discharge is expensive and mostly preventable, 8 thus reducing unnecessary rehospitalizations is an important task in the modern medical field. The occurrence of HF is also common in patients with acute myocardial infarction (AMI). 9 The prediction of HF rehospitalization in patients with AMI has the potential of saving healthcare costs, enabling discharge planning, and identifying patients at high risk of rehospitalization.
So far, many researchers have proposed the prediction models of rehospitalization using electronic health records10–19 and briefly summarized as follows. Philbin et al. 10 designed a simple risk score to identify an individual’s risk of rehospitalization for CHF since the rate of rehospitalization is high after hospital discharge. They used the multiple regression methods to divide a total of 42,731 black or white segregated patients into low, intermediate, and high-risk groups for readmission based on the administrative data sources on all 1995 hospital discharges in New York State. Their results showed that the patients' characteristics, hospital features, processes of care and clinical outcomes may be used to estimate the risk of hospital readmission for CHF. Formiga et al. 11 developed a readmission risk score (RRS) model to predict patients’ likelihood of 30-day and 90-day hospital readmission for HF. A total of 679 patients were included, and the 30-day c-statistic was 0.649 (95% CI 0.574–0.723) and the 90-day 0.621 (95% CI 0.560–0.681). They aimed to assess the first RRS outside of the USA for predicting readmission in patients aged 50 or more admitted to a public tertiary care teaching hospital in Barcelona, Spain. Tabak et al. 12 used 1,195,640 patients’ records from 70 hospitals to develop an early readmission risk model. The readmission risk model was derived from a multivariable logistic regression model as an integer score system. Their early readmission risk score had a c-statistic of 0.69 and the c-statistic improved to 0.72 when adding the administrative variables to the model. Wang et al. 13 aimed to validate the accuracy of the LACE index, length of stay (L), acuity of the admission (A), comorbidity of the patient (C), and emergency department use in the duration of 6 months before admission (E), in CHF patients. Multivariate logistic regression was developed to determine the association between clinical variables and the hospital unplanned readmissions. They concluded that the LACE index may not accurately predict the unplanned readmissions within 30 days after hospital discharge in CHF patients. Zolfaghar et al. 14 predicted the risk of readmission for the real-world CHF patient records in collaboration with Multicare Health Systems (MHS). The dataset was provided by MHS and included 16,000 patients with 76 attributes. They extracted and integrated additional important factors (such as income) from National Inpatient Dataset (NIS) and designed multiple classification algorithms for readmission prediction using distributed analytics platform Mahout. They applied the logistic regression and random forest algorithms and the performance was 58.39% and 77.96%, respectively. Bakal et al. 15 implemented a prediction and risk evaluation model for both HF and all-cause rehospitalizations for up to 5 years of follow-up using a population-based cohort of 40,667 patients’ data. First, they generated a model adjusted for age, sex, length of stay, acuity of admission, Charlson index, which provided a weighted score based on the number and type of comorbidities, and the number of emergency department visits in the 6 months prior. Second, a multi-state model was developed when patients were assumed to be in one of four states: (1) Community-dwelling; (2) In-hospital with HF as the main diagnosis; (3) In hospital for another reason; or (4) Dead. Avishek et al. 16 implemented a predictive analytical approach to identify patients prone to readmission and reduce the number of avoidable readmissions mainly caused by patient non-compliance to medication instruction or early discharge from the hospital. Their study recommended an optimized gradient boosting method with 98.50% prediction accuracy. Kruse et al. 17 proposed models for HF admissions and admission rates using regression and tree-based models. They used anonymized data of 55 attributes and a sample size of 100,000 instances which represented 10 years of data collected from 130 US hospitals. The best predictive model for the number of diagnoses was an extremely randomized tree ensemble (extra tree) with an R2 score of 0.86, and for the HF admission rate, spatial lag models using first-order Queen criteria were best with an R2 score of 0.81. Tong et al. 18 compared several existing approaches including LACE, Stepwise regression, Lasso regression, and AdaBoost on the 30-day all-cause readmission risk of patients with data sizes varying from 2500 to 80,000. Their result showed that the LACE had moderate discrimination power with the area under the receiver operating characteristic curve (AUC) around 0.65–0.66, which was improved to 0.73–0.74 when additional variables from EMR were considered. The STEPWISE method had a slightly lower AUC (0.734) compared to LASSO (0.737) and AdaBoost (0.737). Recently, Wang et al. 19 tried to use deep learning (DL) method to predict the hospitalizations, worsening HF events, and 30-day and 90-day readmissions in patients with HF. They used the data of adult HF with reduced ejection fraction (HFrEF) patients from the IBM® MarketScan® Commercial and Medicare Supplement databases between 1 January 2015 and 31 December 2017. A total of 47,498 HFrEF patients were included, and the best AUCs in predicting 30- and 90-day readmissions in all adult patients were 0.597 and 0.614, respectively. An AUC of 0.861 was attained for prediction of 90-day readmission in patients aged 18–64. For all outcomes assessed, the DL approach outperformed traditional machine learning (ML) models.
However, there are some challenging issues in the previous works on the prediction of HF rehospitalization. First, the previous prediction models relied on statistical or traditional ML algorithms. The biggest advantage of DL over traditional ML algorithms is that it can learn nonlinear relationships between variables from large datasets with unknown distributions. The DL algorithms learn high-level features from the data in an incremental manner which eliminates the process of feature selection. Whereas, in traditional ML algorithms, features that need to be applied are identified by the domain experts or some feature selection techniques. Second, existing models only predict the rehospitalization for a short term such as 1 month or 3 months.11,13,18,19 Third, most of the previous studies are developed from western population data whose characteristics are different from those of the Asian population,20–23 and more research should be conducted in the aging population of Asia. Fourth, hyperparameters of the previously proposed models were mostly hand-tuned. Hyperparameters are being overlooked in many of the existing research while they can gradually increase the predictive performance of ML and DL models. Therefore, this paper proposes a DL-based prediction model of HF rehospitalization during 6, 12, 24-month follow-ups after hospital discharge in patients with AMI using a hyperparameter optimization framework.
Methods and materials
Experimental design
The overall flowchart of the experimental process is shown in Figure 1. Our experimental design for the prediction model of rehospitalization during 6, 12, 24-month follow-ups after hospital discharge can be divided into six parts. First, we extract the experimental data from the raw Korea Acute Myocardial Infarction Registry-National Institutes of Health (KAMIR-NIH) dataset. Second, we preprocess the experimental data with data cleaning, missing values imputation, data normalization approaches, and then split the dataset into the training, validation, and test datasets with a ratio of 60%, 20%, and 20%, respectively. Third, we oversample the minority class using the Adaptive Synthetic (ADASYN)
24
algorithm to balance the training dataset. Fourth, a deep neural network (DNN) model and five popularly used ML models such as logistic regression (LR), support vector machine (SVM), AdaBoost, gradient boosting machine (GBM), and random forest (RF) algorithms are trained on the original imbalanced and balanced training dataset. Hyperparameters are tuned by the hyperparameter optimization framework Optuna. Fifth, all trained models are evaluated on the test dataset by calculating evaluation metrics such as accuracy, the AUC, precision, recall, specificity, and F1 score. Finally, the result of the DNN model is compared with other prediction models. The remaining sections will describe these experimental processes in detail. General overflow of the experimental process.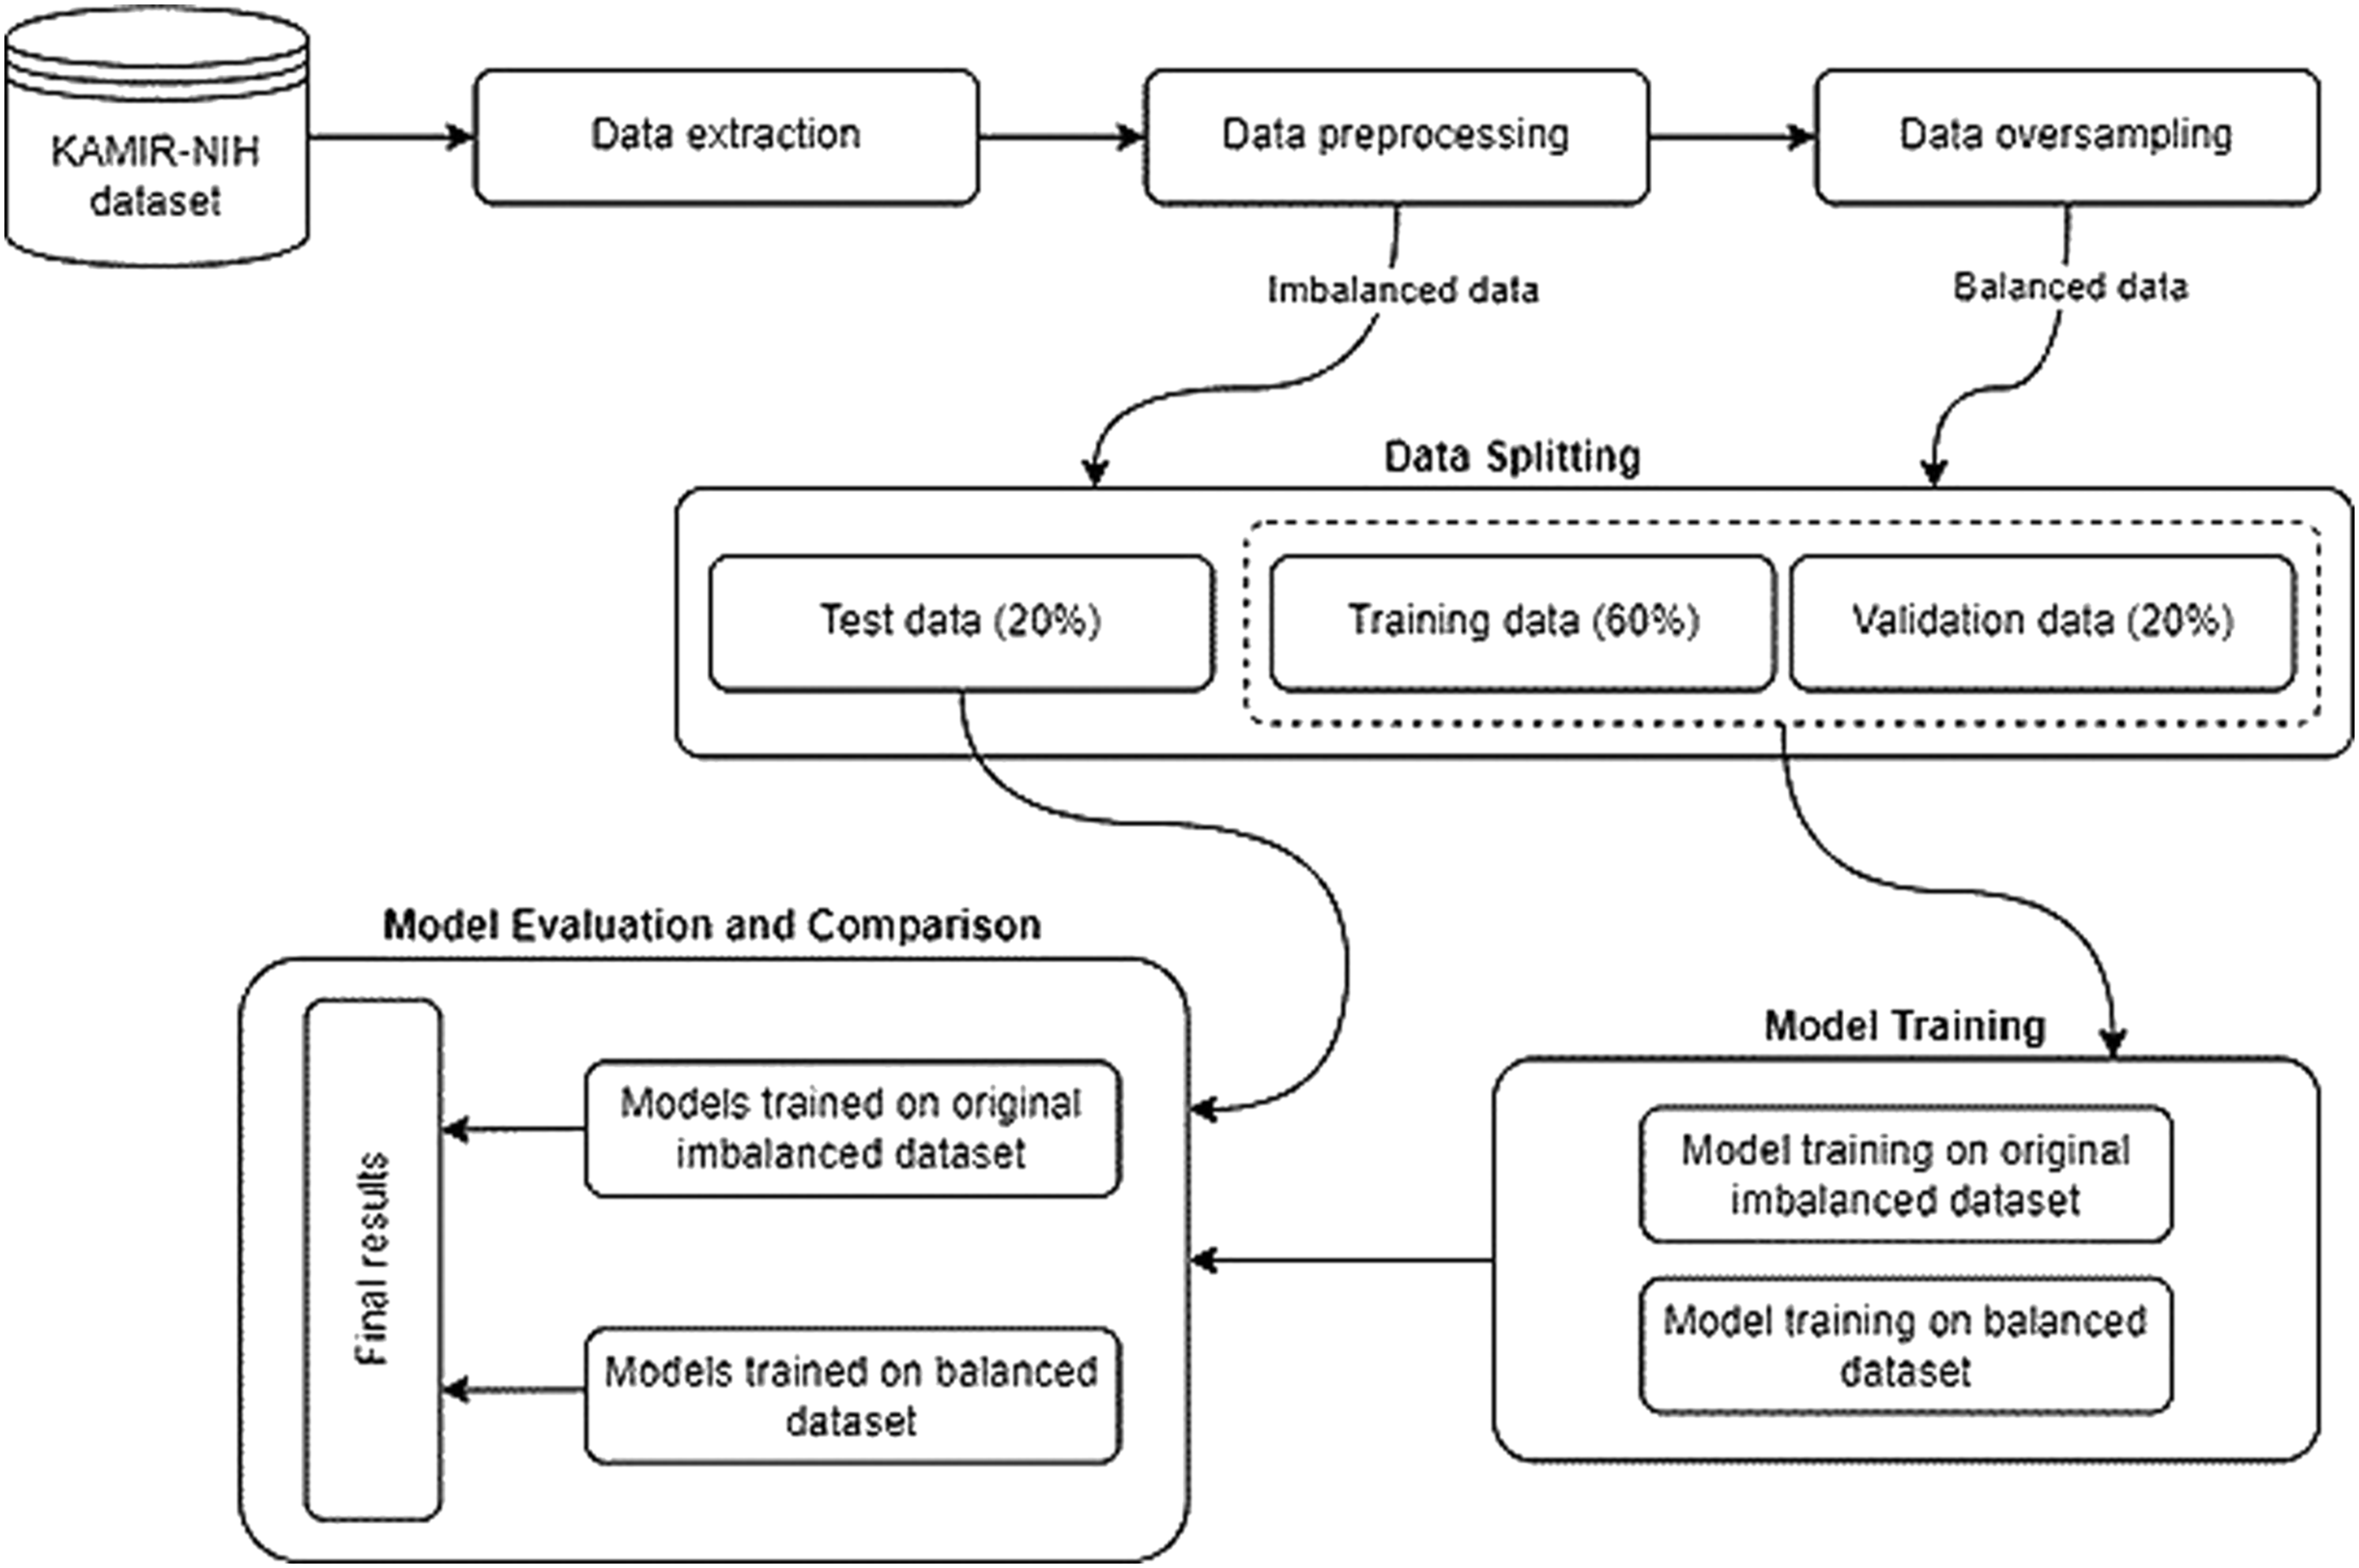
Data source
Registries are the main source of real-world data on severity, causes, treatment, long-term management, and outcomes for the patients hospitalized. 25 We used the KAMIR-NIH dataset, which can describe the characteristics and clinical outcomes of patients with AMI in South Korea. This registry has been used for research in recent years and the data collection process has been fully described elsewhere.23,26 It was collected from 52 hospitals and consists of 13,104 records with 551 attributes enrolled in KAMIR-NIH from November 2011 to December 2019. Data was collected by the trained study coordinators with the standardized protocol, and the consent was obtained for all patients enrolled in the study. The dataset includes hospital administrative, inpatient, and outpatient data such as demographics, past medical history, admission, and discharge evaluation data, electrocardiographic findings, laboratory findings, coronary angiogram findings, medication information, complications during hospitalization, and follow-up data, etc. Follow-up data were collected during 6, 12, 24-months after hospital discharge. The occurrences of major adverse cardiac events (MACE) such as cardiac and non-cardiac death, myocardial infarction (MI), re-percutaneous coronary intervention (re-PCI), coronary artery bypass graft (CABG), cerebrovascular event, and HF rehospitalization were recorded during the follow-ups. Our prediction model focuses on the prognosis of the HF rehospitalization during 6, 12, 24-month follow-ups after hospital discharge.
Data extraction and preprocessing
First of all, the features such as medication information (e.g., drug dosage) and datetime attributes (e.g., admission date, discharge date, etc.) are excluded from the original dataset. In addition, the patients who died during the hospitalization (N = 504) are excluded from the population. Patients with no follow-up information during 6-month (N = 318), 12-month (N = 619), and 24-month (N = 652) are also excluded. The detailed data extraction process is shown in Figure 2. After data extraction, 11,011 patient records with 191 features are selected for the experiment. Data extraction process.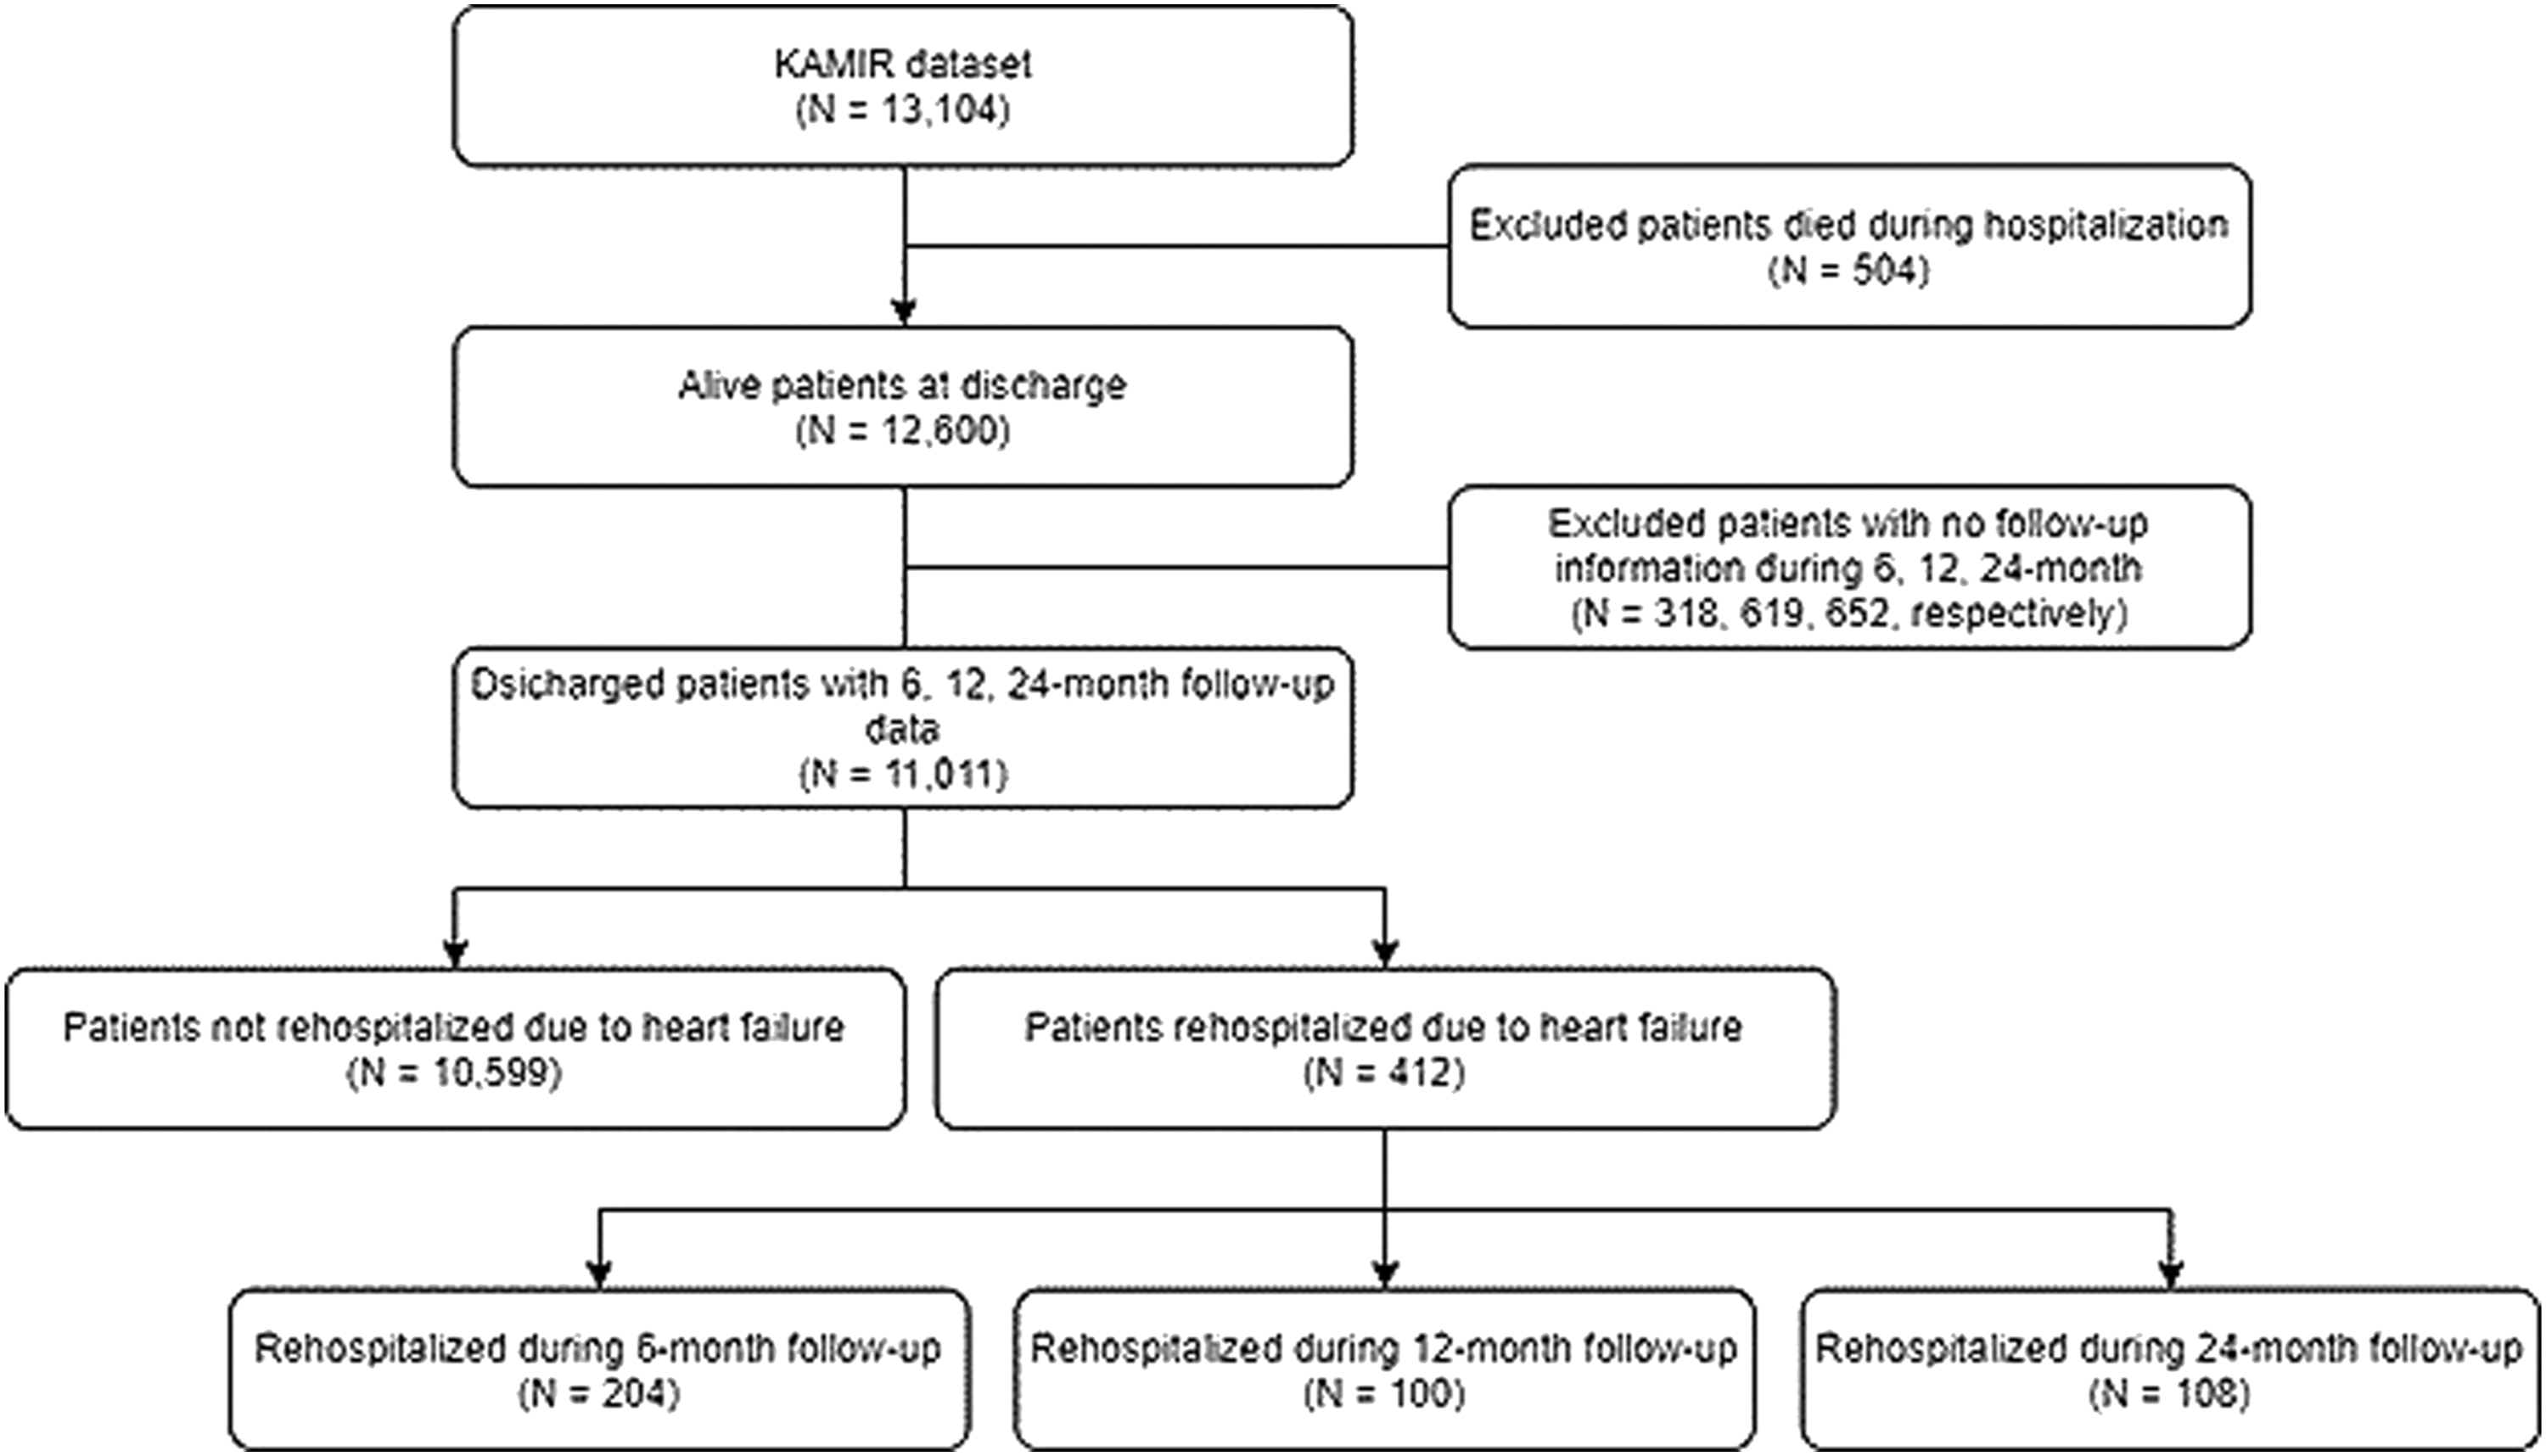
Furthermore, the extracted data is preprocessed. The missing values are imputed by the mean for the numeric data and imputed by the most frequent value for the categorical data. Then the categorical variables that can be subdivided are subdivided into independent classes, according to the one-hot encoding rule. The continuous variables are scaled to have zero mean and unit variance. The standard score

Finally, the dataset is split into training, validation, and test dataset with the ratio of 60%, 20%, and 20%, respectively. All models are trained on the training dataset. The validation dataset is used during the training of the DL model to evaluate the loss and other metrics. The test dataset is completely unused during the training phase and is only used at the end to evaluate how well the model generalizes to new data. This is especially important with imbalanced datasets where overfitting is a significant concern from the lack of training data.
Learning from the imbalanced dataset
From the selected data of 11,011 records, patients rehospitalized due to the HF represent only about 3.74% (412 records), which is highly imbalanced. For the imbalanced learning problem, oversampling which is a kind of data-level approach is widely used. The oversampling methods can be categorized into random oversampling and synthetic oversampling. The random oversampling method chooses random samples from the minority class and replicates them to increase the size of a minority class sample. On the other hand, synthetic oversampling methods such as ADASYN
24
generate new synthetic samples for the minority class. These algorithms are considered as a more ideal approach since it creates new synthetic data instead of replicating them. Therefore, we used the ADASYN sampling method to deal with the data imbalance problem. The key idea of the ADASYN algorithm is to create new synthetic samples for each minority data example using density distribution. The resulting dataset after applying ADASYN will provide balanced class distribution and shift the decision boundary. In ADASYN, the new sample is generated by equation (2).

Hyperparameter optimization
Hyperparameters are the properties that can rule the entire training process of the ML and DL models. Choosing the appropriate hyperparameters is important since they directly control the behavior of training the model. It plays a key role in the success of neural networks, having a major impact on the performance of the model. We used the hyperparameter optimization framework Optuna 27 to tune the hyperparameters of the proposed DL model. Optuna is an efficient and easy-to-setup hyperparameter optimization framework. It allows users to construct the parameter search space dynamically and has an efficient implementation of both searching and pruning strategies. It also supports parallelization which hastens the optimization process. By using the Optuna, we can efficiently search large spaces of hyperparameters and prune unpromising trials for faster results. We used Asynchronous Successive Halving 28 for the pruning and Tree-structured Parzen Estimator 29 for the sampling algorithms.
Proposed deep learning-based prediction model
DNN is the extension of an artificial neural network having multiple hidden layers. The proposed prediction model is a DNN with four densely connected hidden layers with 330, 433, 511, 449 units for each of the four hidden layers which are obtained from the hyperparameter optimization process. The input layer receives all the input features and propagates them to the next layers. Rectified Linear Unit (ReLU) is used as the activation function for all hidden layers. Binary cross-entropy is used as the loss function. Adam algorithm, based on the stochastic gradient descent, is used for the model optimization. A dropout layer with 20% of drop rate is added after each hidden layer, and an early stopping technique is used to prevent overfitting. Finally, in the output layer, the sigmoid function is used as an activation function to get the final prediction results. The architecture of the proposed DL-based prediction model of rehospitalization is shown in Figure 3. The architecture of the proposed deep learning-based prediction model of rehospitalization.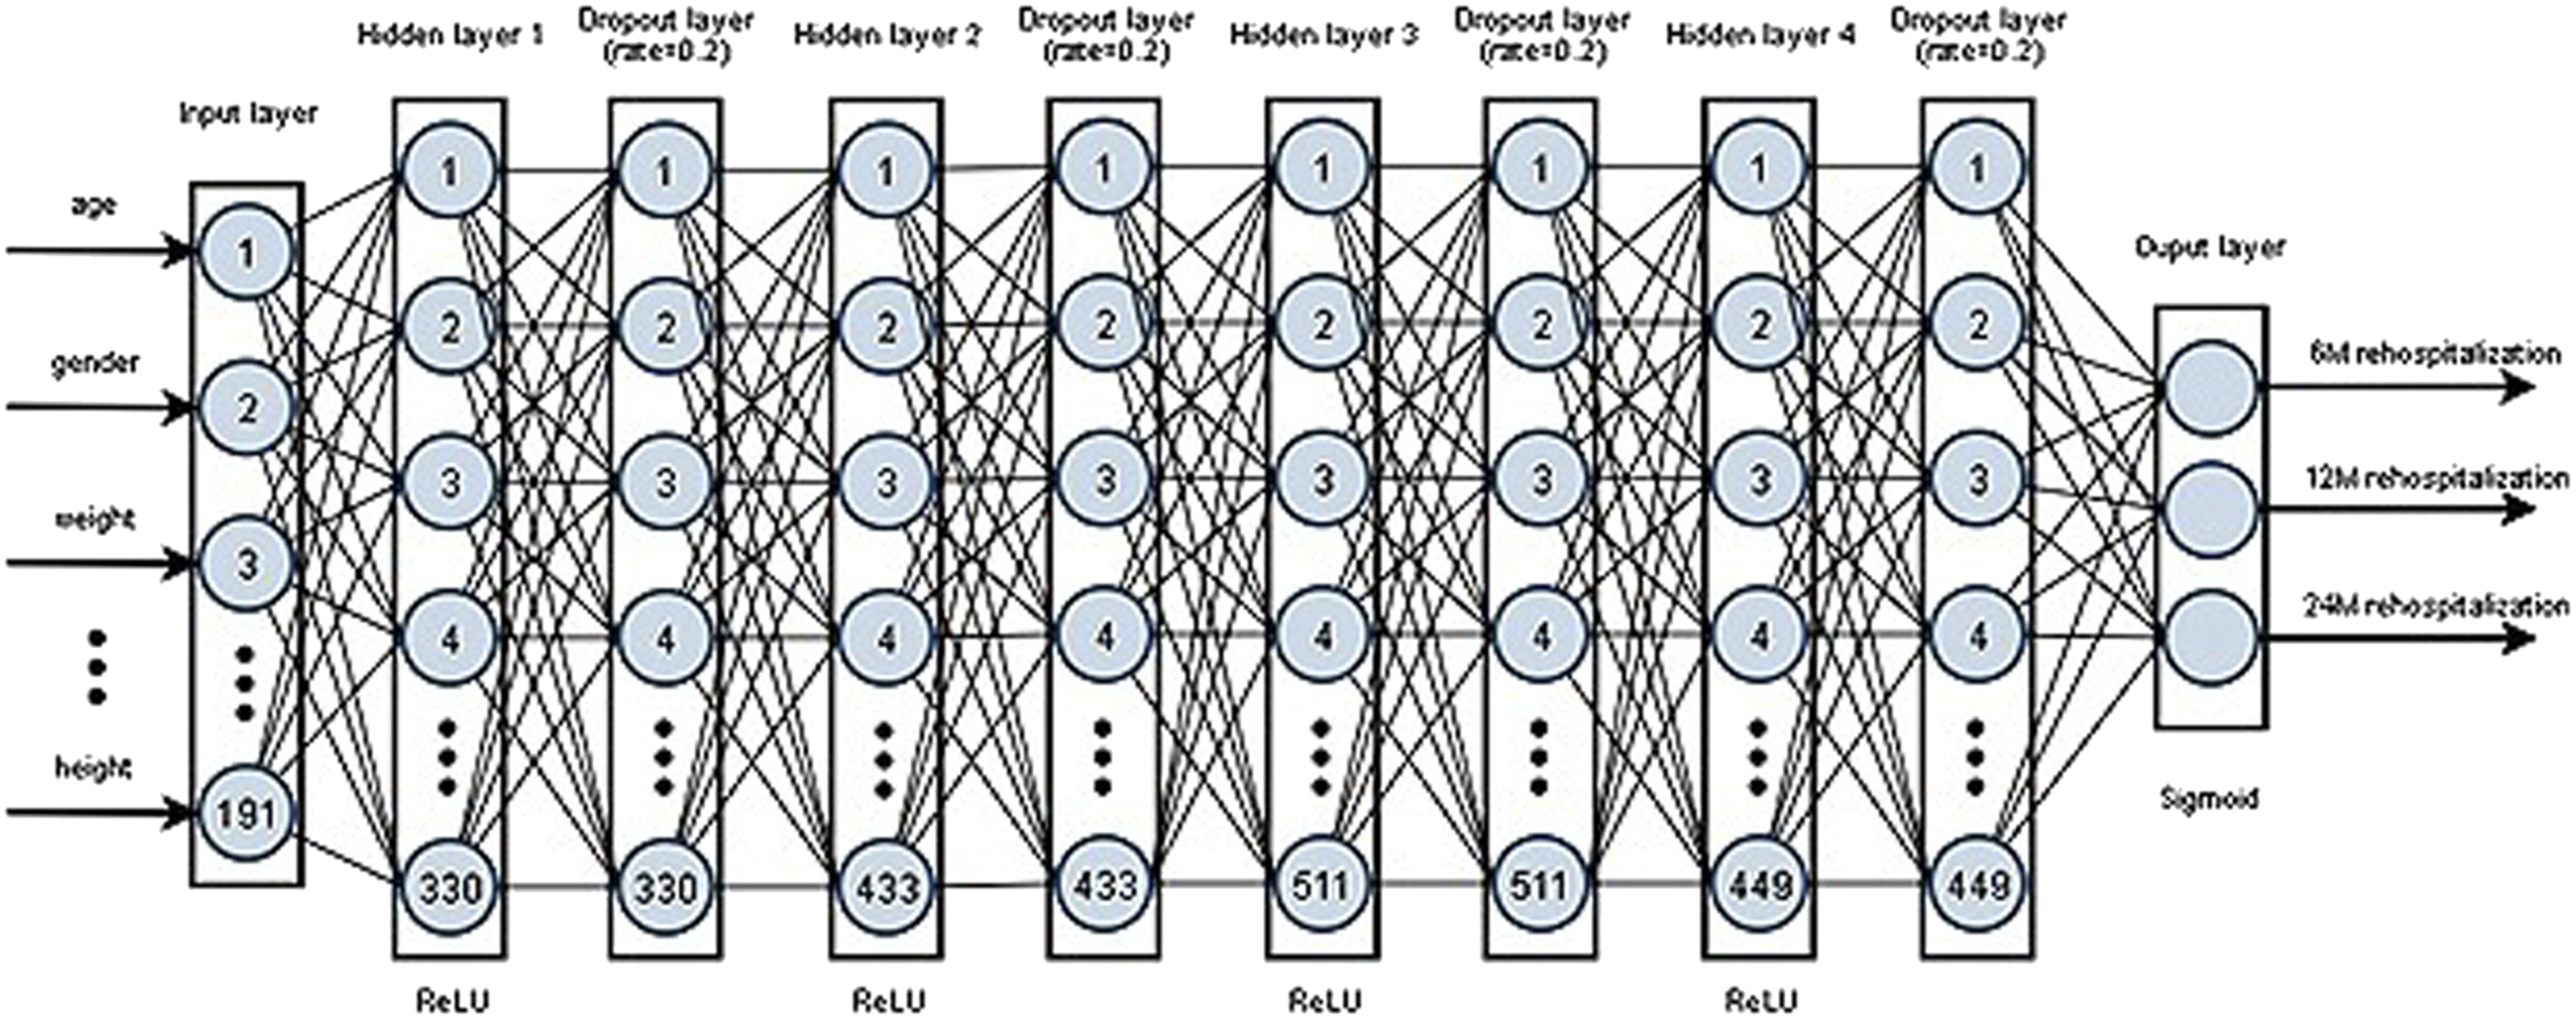
To compare the performance of the proposed DL model, we applied five popular ML algorithms namely: LR, SVM, AdaBoost, GBM, RF, and these algorithms are briefly explained as follows. LR 30 is an algorithm that is used for classification problems, despite the name as logistic regression. It uses the logistic function, also known as the sigmoid function, which is an S-shaped curve that can take any real-valued number and map it into a value between 0 and 1. Even though the output is a probability, it is widely used for classification problems with the use of threshold values. SVM 31 produces an optimal hyperplane that classifies the inputs into specific categories. Hyperplanes are defined by the support vectors and the optimal hyperplane is selected by maximizing the margin between the two classes. AdaBoost (short for Adaptive Boosting) 32 trains base classifiers sequentially each one tries to learn from the mistakes of previous weak classifiers. GBM 33 employs gradient descent algorithms on top of the boosting algorithm that defines and minimizes the loss function. RF 34 is an ensemble of decision trees that introduces extra randomness when growing trees instead of searching for the very best feature.
Multi-label classification
Possible outputs of the proposed model.
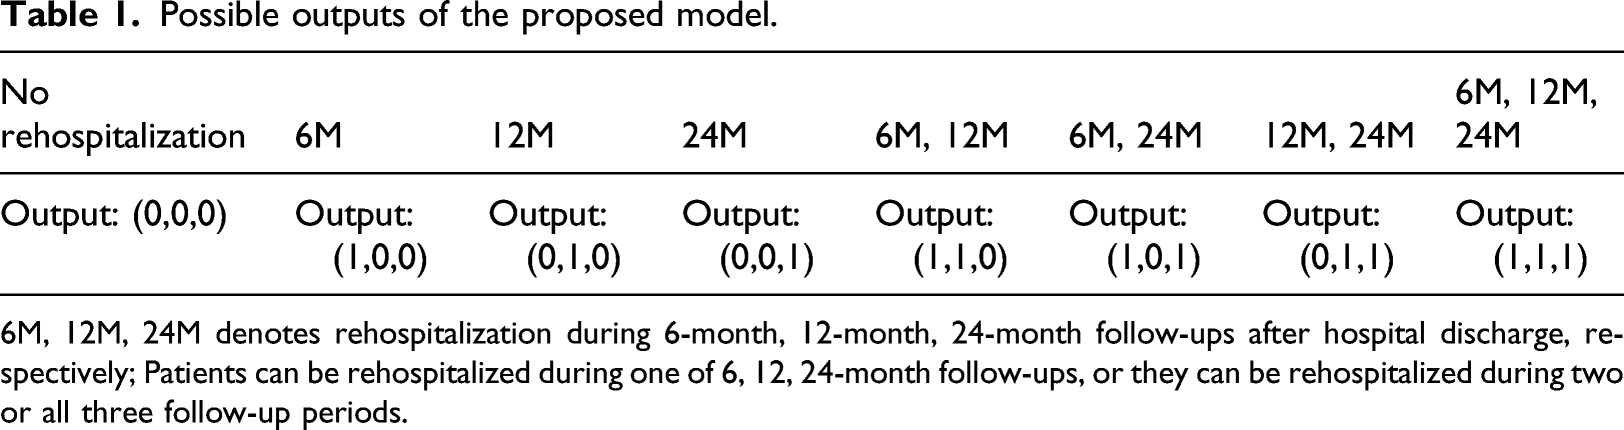
6M, 12M, 24M denotes rehospitalization during 6-month, 12-month, 24-month follow-ups after hospital discharge, respectively; Patients can be rehospitalized during one of 6, 12, 24-month follow-ups, or they can be rehospitalized during two or all three follow-up periods.
Performance evaluation methods
Confusion matrix.
TN: True Negative; TP: True Positive; FP: False Positive; FN: False Negative.
Evaluation metrics.
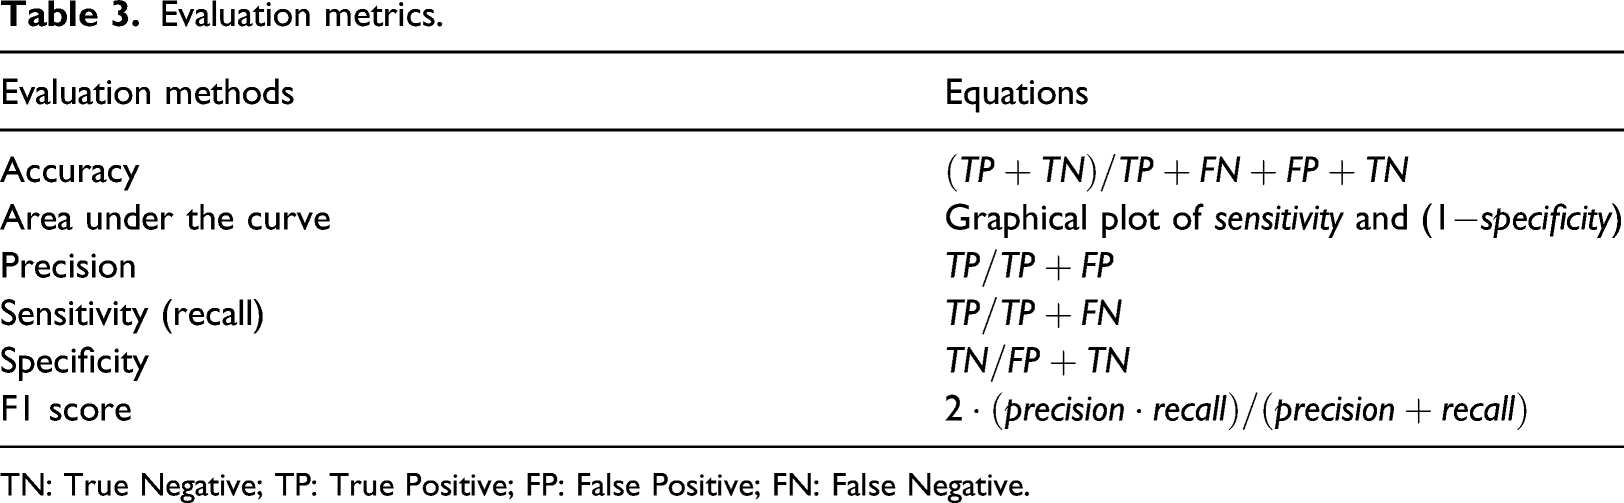
TN: True Negative; TP: True Positive; FP: False Positive; FN: False Negative.
Statistical analysis and implementation environment
In statistical analysis, the independent t-test was used for continuous variables and a Chi-Square test for categorical variables between two groups (patients rehospitalized vs. patients not rehospitalized). Continuous variables are represented as mean ± standard deviation and categorical variables as the percentage of the group. We implemented all the statistical analysis, data preprocessing, and model development using Python programming language (version 3.7) with free and open-source python libraries such as Optuna, 27 numpy, 35 pandas, 36 scipy, 37 matplotlib, 38 imbalanced-learn, 39 scikit-learn, 40 and tensorflow 41 (with keras).
Experimental results
Baseline characteristics
Baseline characteristics of the selected study population.
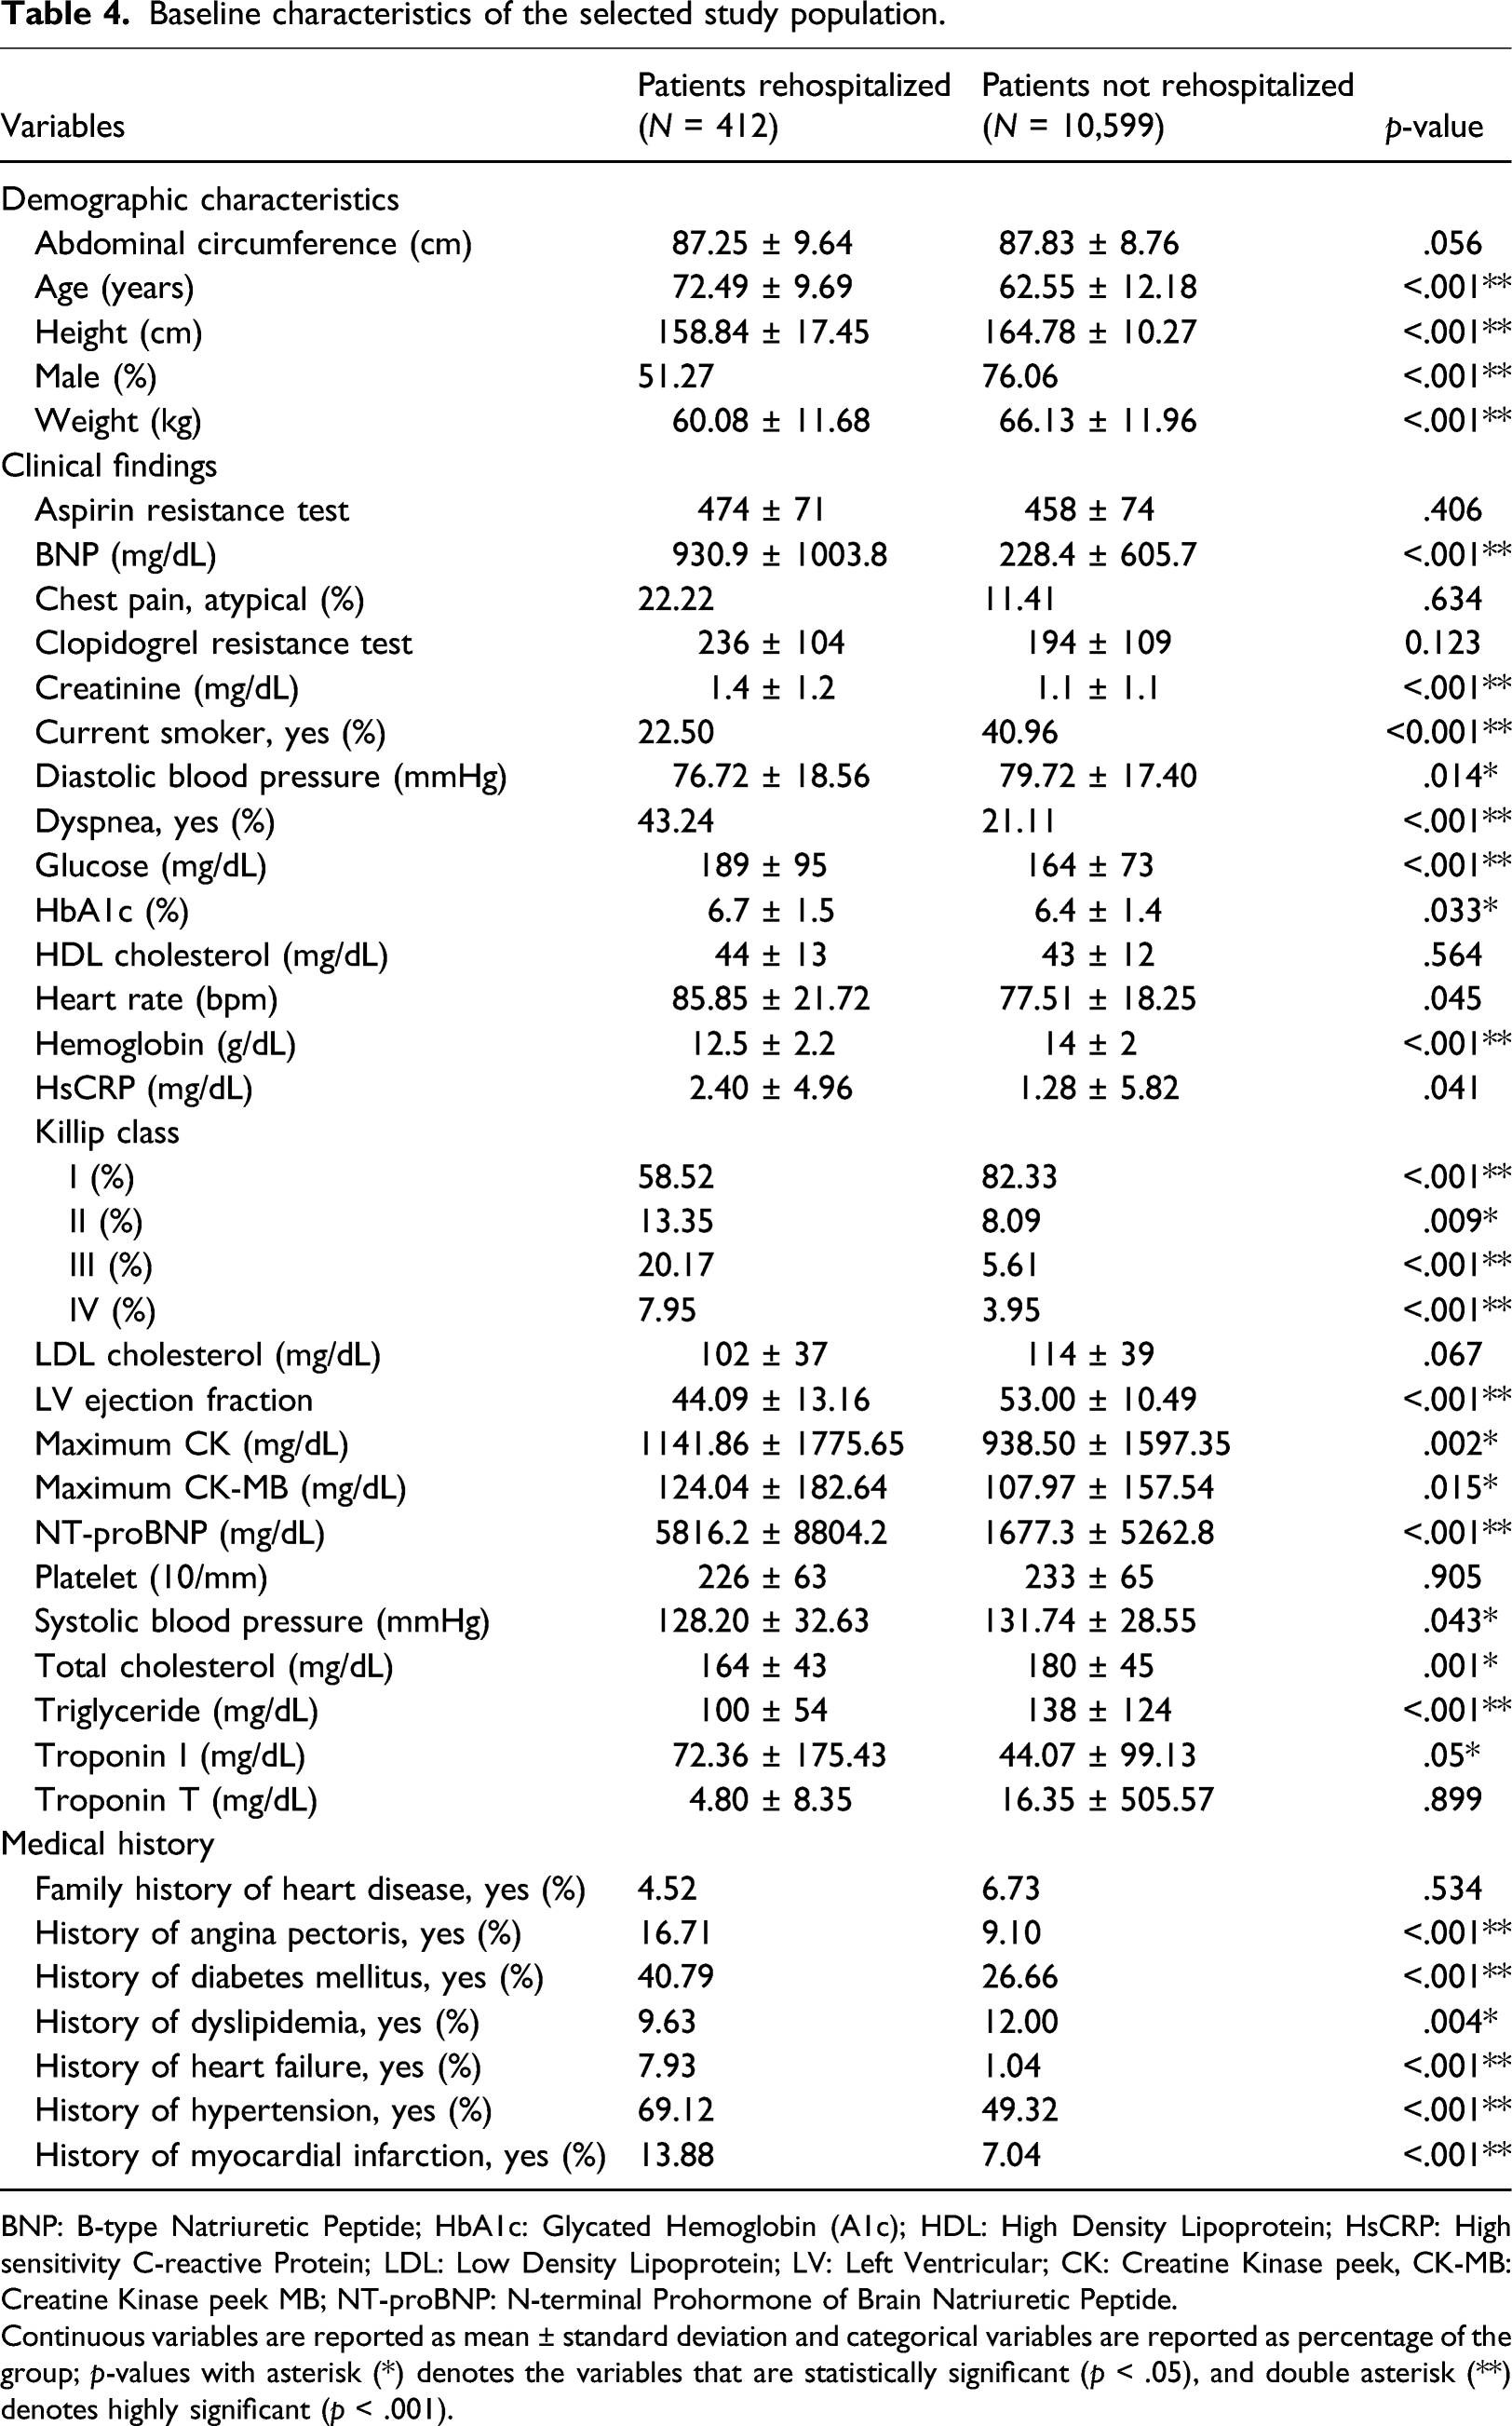
BNP: B-type Natriuretic Peptide; HbA1c: Glycated Hemoglobin (A1c); HDL: High Density Lipoprotein; HsCRP: High sensitivity C-reactive Protein; LDL: Low Density Lipoprotein; LV: Left Ventricular; CK: Creatine Kinase peek, CK-MB: Creatine Kinase peek MB; NT-proBNP: N-terminal Prohormone of Brain Natriuretic Peptide.
Continuous variables are reported as mean ± standard deviation and categorical variables are reported as percentage of the group; p-values with asterisk (*) denotes the variables that are statistically significant (p < .05), and double asterisk (**) denotes highly significant (p < .001).
Data oversampling results
We used the ADASYN data sampling approach to oversample the minority class. The oversampling technique helped avoid the bias towards the majority class during the training of ML models on imbalanced datasets, which was used only on the training data. Our target variables, rehospitalization during 6, 12, 24-month after hospital discharge, were highly imbalanced. Therefore, the minority classes were oversampled to balance the distribution. The minority class samples have been oversampled from 204, 100, 108 records to 3,971, 4,021, 3987 records, respectively.
Hyperparameter optimization results
Selected hyperparameters to tune were the learning rate, dropout rate, number of hidden layers, and number of units for each hidden layer. Hyperparameters were tuned by Optuna, and the optimal learning rate was 0.003, the dropout rate was 0.2, the number of hidden layers was 4, and the number of units for each of the hidden layers was 330, 433, 511, 449, respectively. Figure 4 showed the importance of the hyperparameters. The importance was represented by floating-point numbers that sum to 1.0 over the entire dictionary. The higher the value, the more important it is. The number of units for hidden layer four had the highest importance while the number of hidden layers had the lowest. Hyperparameter importance.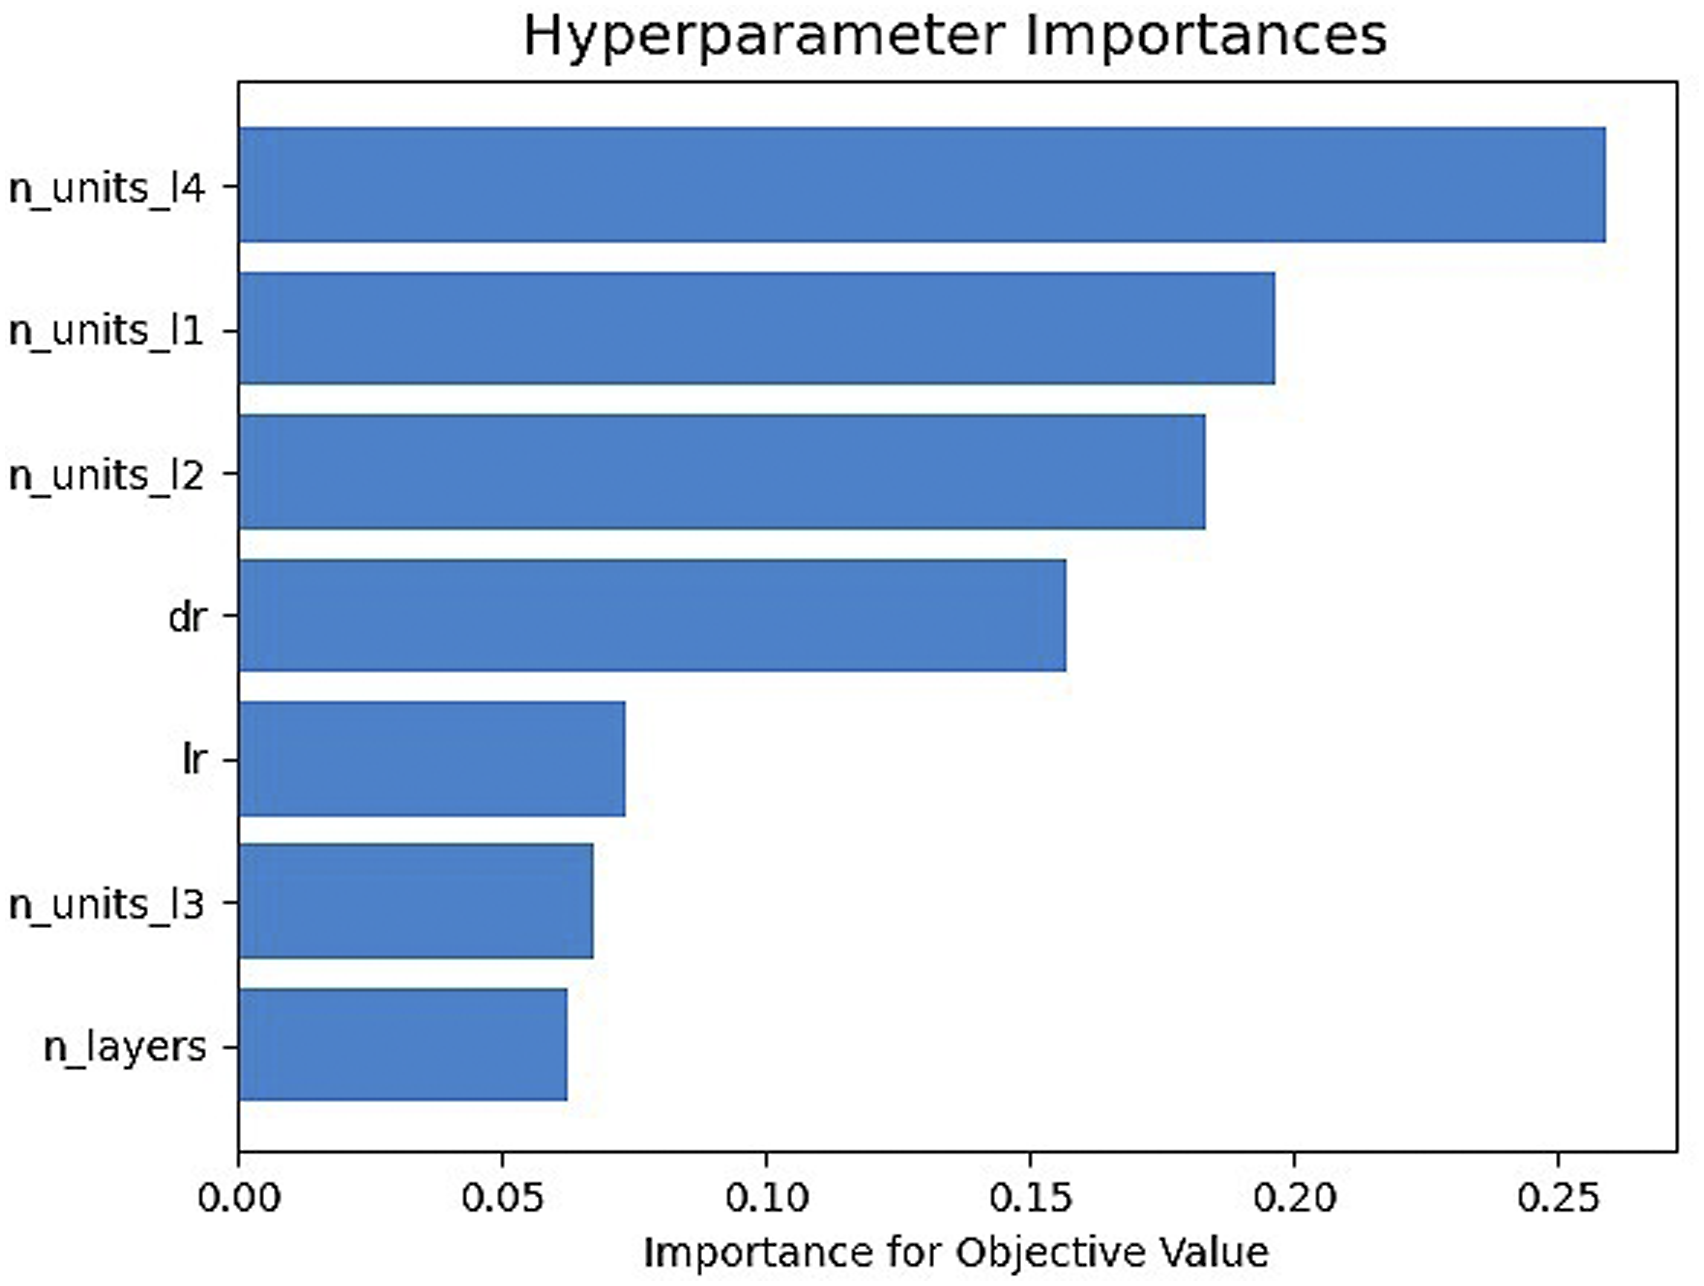
Performance comparison of prediction models
We compared the performance of our proposed model with five other traditional ML models. All models were trained on the original imbalanced and balanced training dataset, and all performance metrics were evaluated and reported on the test dataset. The detailed explanation of the results is given as follows.
Figure 5 showed the confusion matrix of the proposed DL-based prediction model of HF rehospitalization during (a) 6-month, (b) 12-month, and (c) 24-month follow-ups. The diagonal elements represent the number of points for which the predicted label is equal to the true label, while off-diagonal elements are those that are mislabeled by the classifier. The higher the diagonal values of the confusion matrix, the better the prediction model is, indicating many correct predictions. During 6-month rehospitalization, our model correctly predicted 2786 patients, and 37 patients were misclassified. Similarly, our model correctly classified 2815 patients and misclassified eight patients during both 12-month, and 24-month follow-ups. Confusion matrix of the proposed prediction model for rehospitalization during (a) 6-month follow-up; (b) 12-month follow-up; (c) 24-month follow-up.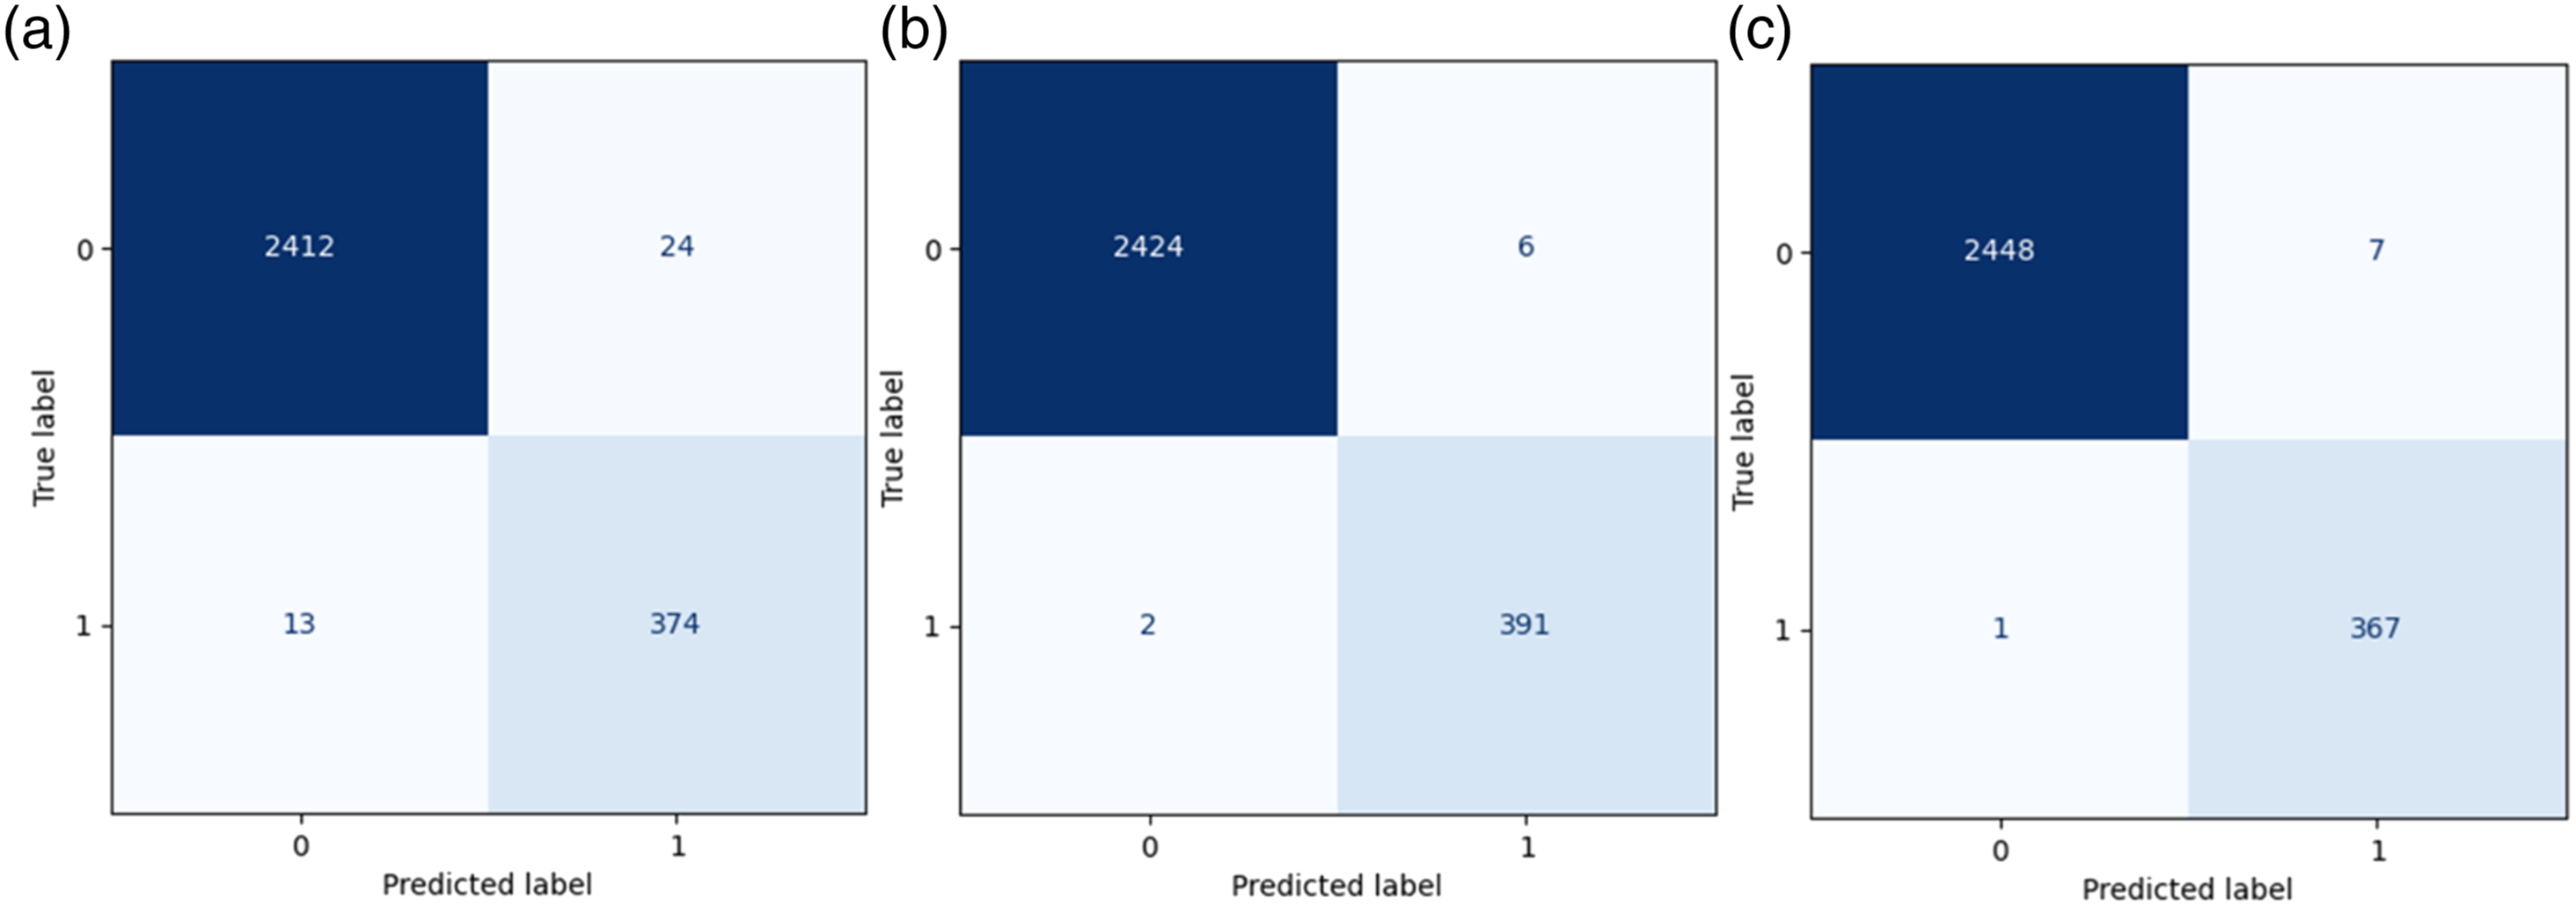
Performance comparison of the prediction models trained on original imbalanced data.
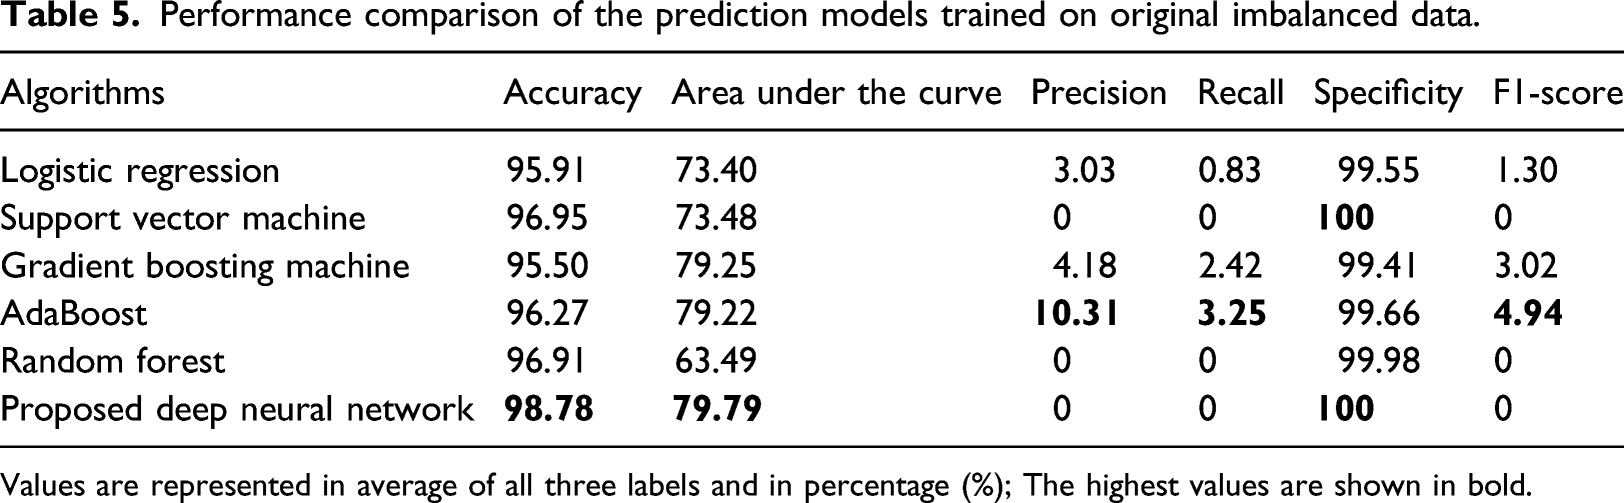
Values are represented in average of all three labels and in percentage (%); The highest values are shown in bold.
Performance comparison of the prediction models trained on balanced data.
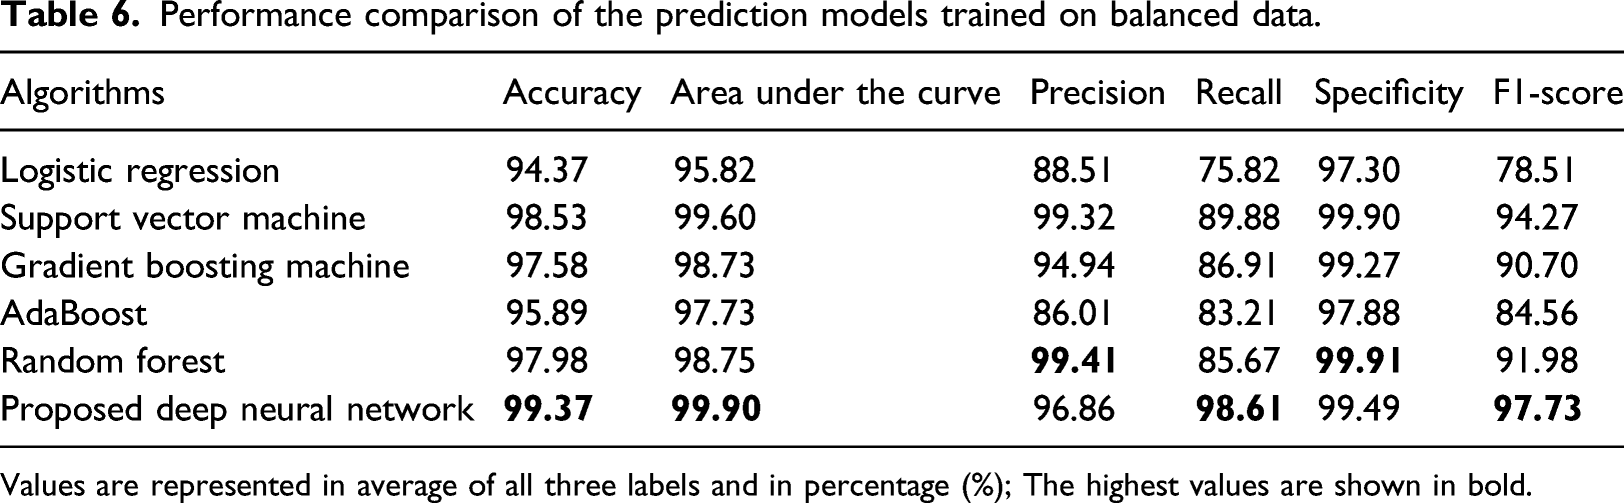
Values are represented in average of all three labels and in percentage (%); The highest values are shown in bold.
Performance comparison of the prediction models on balanced data during 6, 12, 24-month follow-ups.
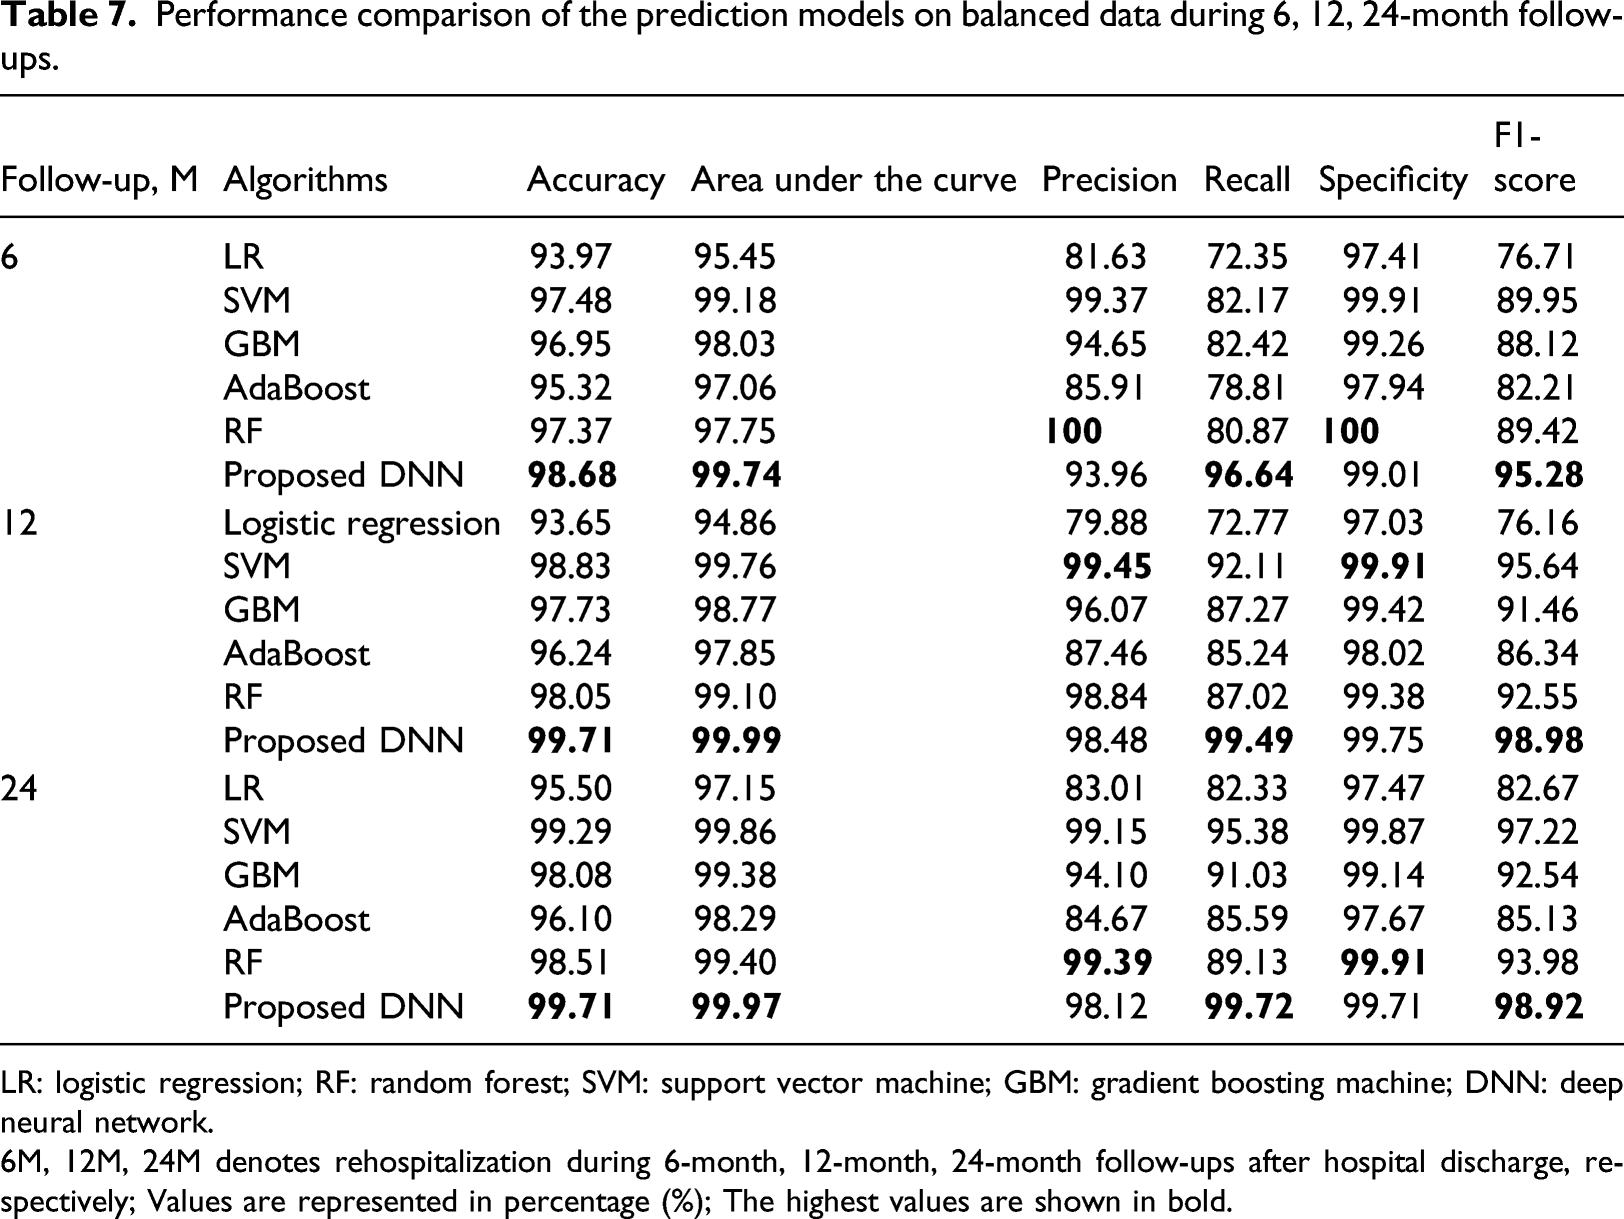
LR: logistic regression; RF: random forest; SVM: support vector machine; GBM: gradient boosting machine; DNN: deep neural network.
6M, 12M, 24M denotes rehospitalization during 6-month, 12-month, 24-month follow-ups after hospital discharge, respectively; Values are represented in percentage (%); The highest values are shown in bold.
Figure 6 showed the Precision-Recall curve (PR curve). Class 0, 1, two denotes rehospitalization during 6, 12, 24-month after hospital discharge, respectively. A PR curve is a plot of the precision on the y-axis and the recall on the x-axis for different thresholds, similar to the receiver operating characteristics (ROC) curve. PR-curve area for rehospitalization during 6-month was 96.82%, 12-month 98.81%, 24-month 98.36%, and the micro average of the PR-curve area was 98.06%. The PR curve plot can be more informative than the ROC curve plot when evaluating classifiers on imbalanced datasets. Precision-recall curve of the proposed model.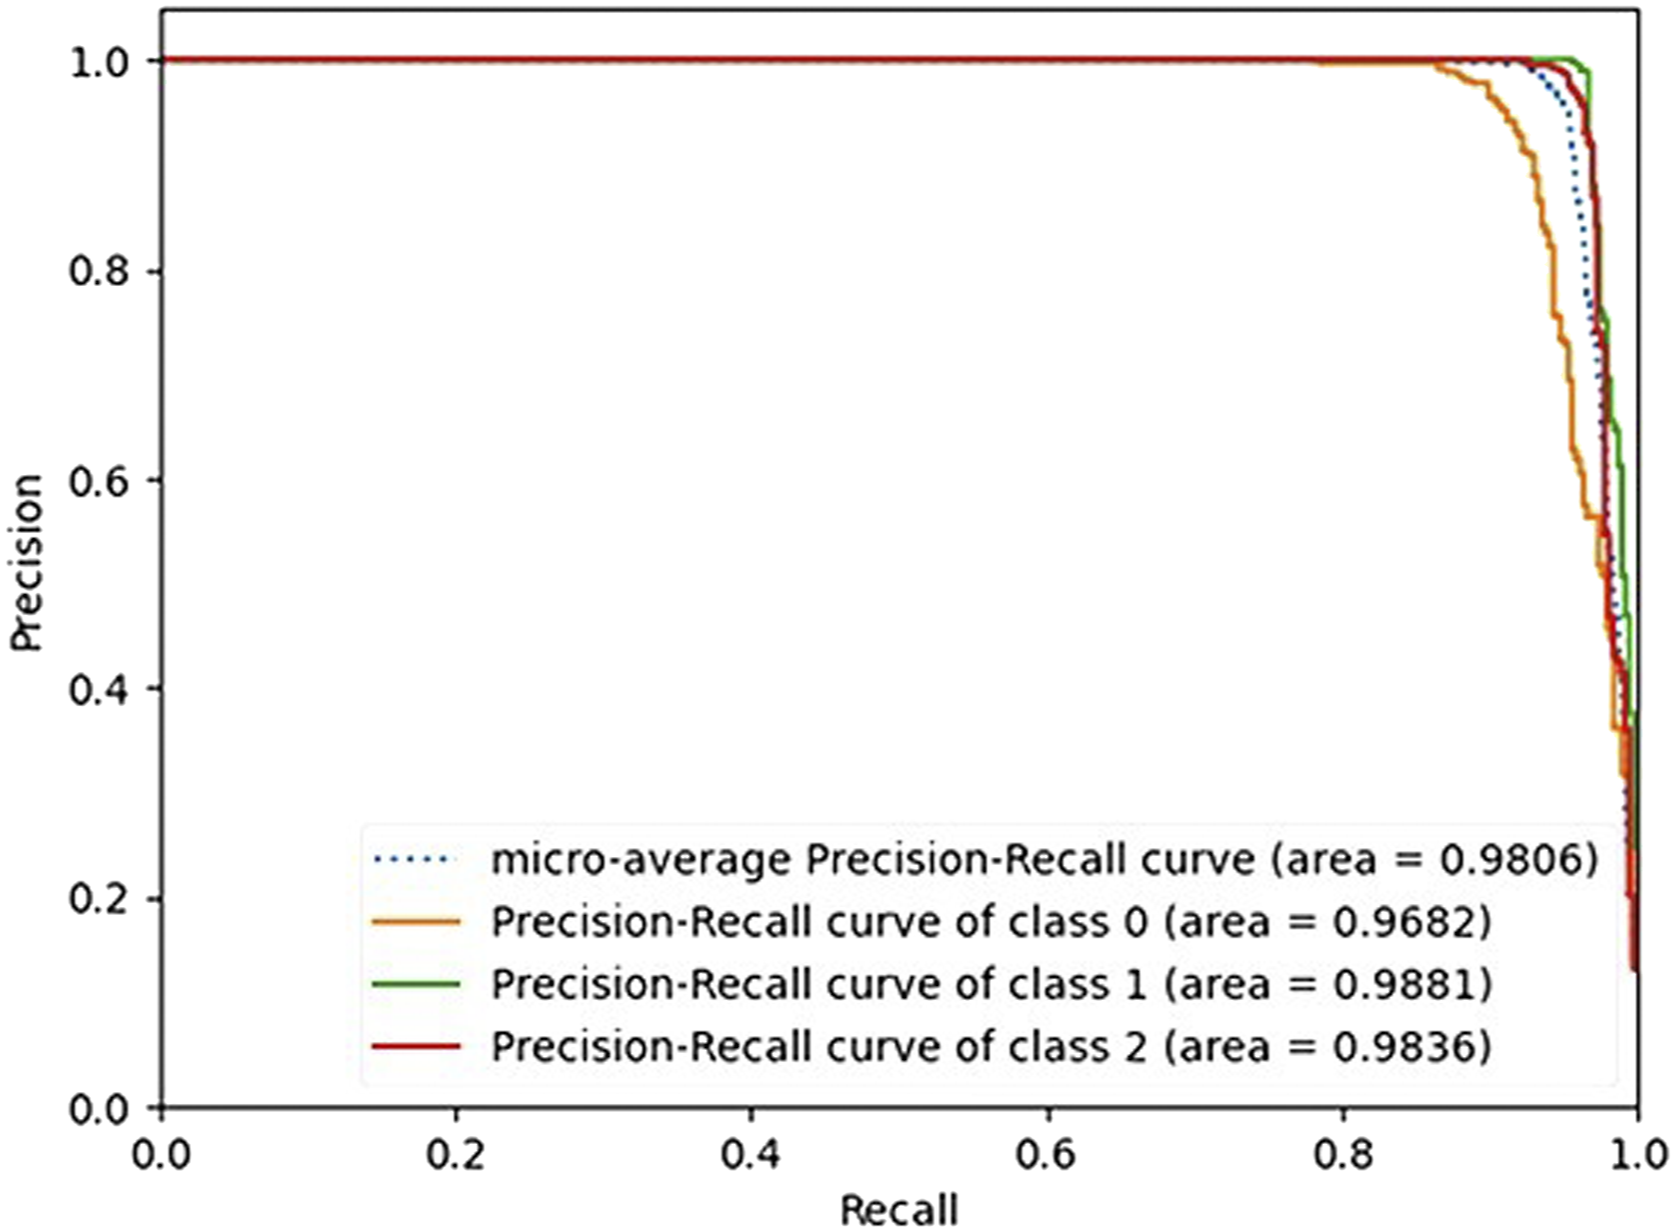
Figure 7 compared the performance of prediction models in terms of the ROC curve. The ROC curves are calculated by the macro average of all three labels which is a graph showing the performance of a classification model at all classification thresholds. A model that is 100% correct if it has an AUC of 1.0. Our proposed model got the highest AUC of 99.90%, whereas the lowest AUC was 95.83% for the LR model. Receiver operating characteristics curve comparison of the prediction models.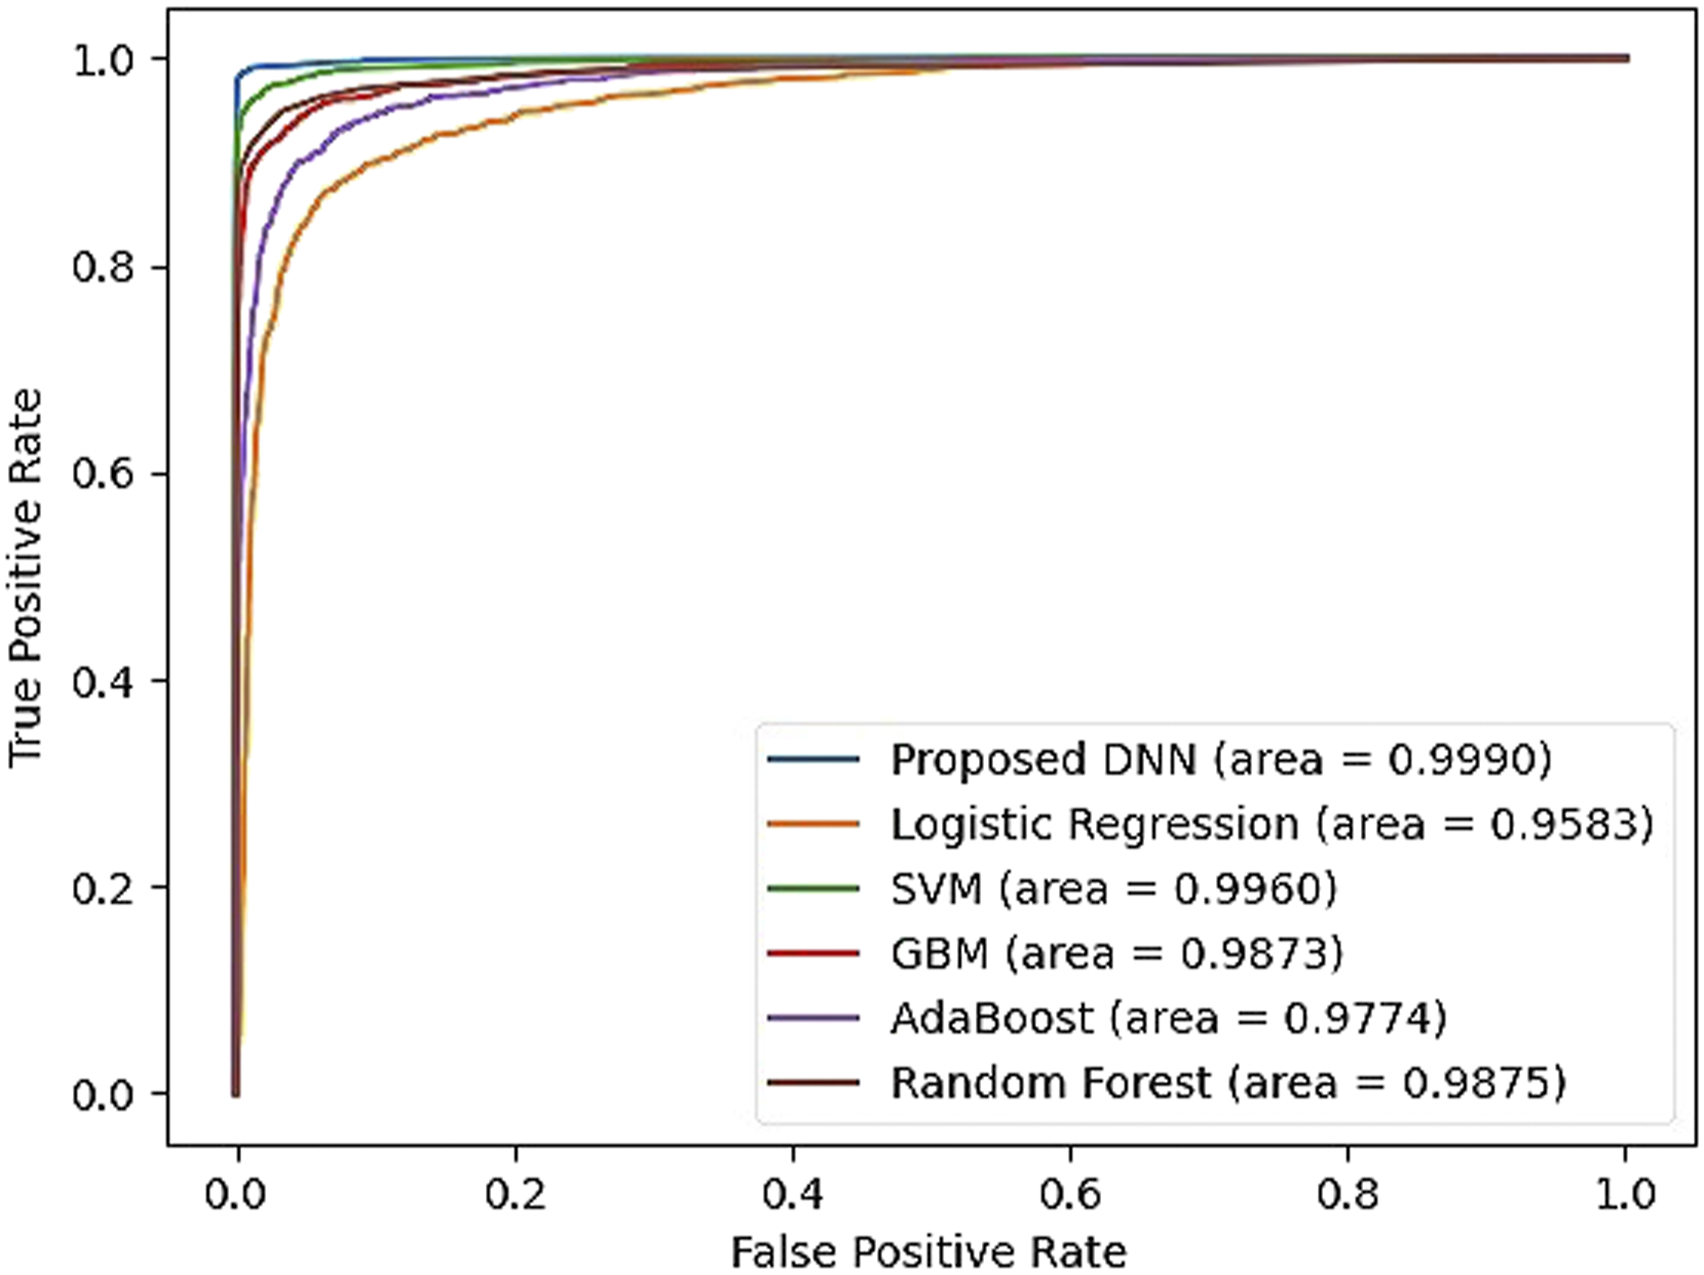
Discussion
Recently, DL approaches have shown improvements over traditional ML models in many research areas such as image classification tasks,42,43 speech recognition, 44 image generation, 45 machine translation, 46 and game-playing.47, 48 In this research, we proposed a DL-based prediction model for HF rehospitalization during 6, 12, 24-month after hospital discharge. We showed the effectiveness of the DL model by comparing it with other traditional ML algorithms on a real-world dataset of Korean patients with AMI.
First, we used the KAMIR-NIH dataset which was highly imbalanced. Therefore, we balanced the class distribution using ADASYN oversampling technique. The minority class samples have been oversampled from 204, 100, 108 records to 3,971, 4,021, 3987 records, respectively. The results were poor on imbalanced data in terms of AUC, precision, recall, and F1 score, which are important metrics in an imbalanced learning problem. The reason is that the models could not learn from the data because of the lack of examples in the minority class. After oversampling, the performances of all prediction models were significantly improved.
Furthermore, we used the hyperparameter optimization framework Optuna to tune the hyperparameters of the proposed DL model. As a result, the optimal hyperparameter for the learning rate was 0.003, dropout rate 0.2, the number of hidden layers 4, and the number of units for each of the hidden layers was 330, 433, 511, 449, respectively. We also found the importance of hyperparameters. The most important hyperparameter was the number of units for hidden layer 4, followed by the number of units for hidden layer 1, number of units for hidden layer 2, dropout rate, learning rate, number of units for hidden layer 3, and the least important hyperparameter was the number of the hidden layers.
Finally, we compared the proposed model with highly popular ML algorithms such as LR, SVM, AdaBoost, GBM, and RF. All models were evaluated by the evaluation metrics of accuracy, AUC, precision, recall, specificity, and F1 score. The results showed that our proposed model trained on the Korean AMI dataset provided the best overall performance, and more accurate prediction of HF rehospitalization during all 6, 12, 24-month follow-ups. During the 6-month follow-up, the performance of the proposed model showed an accuracy of 98.68%, AUC 99.74%, precision 93.96%, recall 96.64%, specificity 99.01%, and F1 score 95.28%. The proposed model outperformed all ML models in terms of accuracy, AUC, recall, and F1 score. On the other hand, the RF algorithm showed the highest performance in terms of precision 100% and specificity 100%, but the accuracy, AUC, recall, and F1 score (97.37%, 97.75%, 80.87%, and 89.42%, respectively) were comparatively low. During the 12-month follow-up, our proposed model showed an accuracy of 99.71%, AUC 99.99%, precision 98.48%, recall 99.49%, specificity 99.75%, and F1 score 98.98%. SVM showed the highest precision and specificity (99.91% and 99.45%), but other metrics like accuracy, AUC, recall, and F1 score (98.83%, 99.76%, 92.11%, and 95.64%, respectively) were lower than the proposed model. During the 24-month follow-up, the performance of the proposed model was the accuracy, AUC, precision, recall, specificity, and F1 score of 99.71%, 99.97%, 98.12%, 99.72%, 99.71%, and 98.92%, respectively. Precision and specificity were the highest in RF (99.39% and 99.91), but the accuracy, AUC, recall, and F1 score (98.51%, 99.40%, 89.13%, and 93.98%, respectively) were lower than the proposed model. Performances of the other models were average accuracy, AUC, precision, recall, specificity and F1 score of (94.37%, 95.82%, 88.51%, 75.82%, 97.30%, and 78.51%) in LR, (97.58%, 98.73%, 94.94%, 86.91%, 99.27%, and 90.70%) in GBM, and (95.89%, 97.73%, 86.01%, 83.21%, 97.88%, and 84.56%) in AdaBoost, respectively.
However, there were some potential limitations in this research although we had a good performance on our proposed DL model. First, the dataset used for the experiment was highly imbalanced. Even though we oversampled the dataset, this process may introduce the bias problem. Second, the proposed model may not be ideal for western patients and the results may vary for other populations because it is trained on the Korean AMI dataset. Finally, DL models are data-hungry, but we were only able to include 11,011 patient records.
Conclusion
This paper proposed a DL-based prediction model for the HF rehospitalization during 6, 12, 24-month follow-ups after hospital discharge. We showed the effectiveness of the DL model by comparing it with other traditional ML algorithms on a real-world dataset of Korean patients with AMI. According to the result of this research, our finding is that the DL-based approach was more accurate than the traditional ML models and can be useful for decision making and medical diagnosis in cardiology. This study can help the future development and deployment of decision-making and medical diagnosis tools in cardiology. Further research is needed to address the downside of data sampling and incorporate more data.
Footnotes
Acknowledgements
The authors would like to thank to Korea Acute Myocardial Infarction Registry (KAMIR); a nationwide, multicenter data collection registry; to provide us multicenter data for our experiments.
Author contributions
Bat-Ireedui Bat-Erdene designed and implemented the mortality prediction model framework and prepared the manuscript. Huilin Zheng performed the data preprocessing, model implementation, and manuscript preparation. Sang Hyeok Son helped in data preprocessing, and model implementation. Jong Yun LEE performed the method and framework design, experiment coordination, and manuscript preparation. All authors give their final approval of the submitted manuscript.
Declaration of conflicting interests
The author(s) declared no potential conflicts of interest with respect to the research, authorship, and/or publication of this article.
Funding
The author(s) disclosed receipt of the following financial support for the research, authorship, and/or publication of this article: This research was supported by Basic Science Research Program through the National Research Foundation of Korea (NRF) funded by the Ministry of Education (2017R1D1A1A02018718), and the MSIT (Ministry of Science and ICT), Korea, under the Grand Information Technology Research Center support program (IITP-2022-2020-0-01462) supervised by the IITP (Institute for Information & communications Technology Planning & Evaluation).
Ethical approval and consent to participate
All participants in this study were guaranteed anonymity. Our experimental datasets and results are authentical and real. The proposed prediction model of heart failure rehospitalization was limited on Korean people and cannot be applied to other racial groups directly. The experimental datasets are confidential and available with the permission of Korea Acute Myocardial Infarction Registry (KAMIR) on reasonable request.