
Abstract
This study examined the cost of medical insurance for “sepsis” treatment in Taiwan. We applied statistical tests, cost control charts, and C5.0 decision trees using the define, measure, analyze, improve and control (DMAIC) process to mine data on Diagnosis-Related Groups (DRGs) and clinics that reported expense anomalies and disposal costs. Analyzing 353 valid samples (application fees) from four DRGs, 70 clinics, and 15 input variables, abnormalities in application fees for adults (age ≧18 years old) with comorbidities or complications was significant (95% confidence interval) in one DRG and nine clinics. Four input variables (ward charge, treatment fee, laboratory fee, and pharmaceutical service charge) had a significant impact. Improvements or controls should be prioritized for three clinics (Nos. 49, 44, and 14) and two input variables (treatment and laboratory fees). This model can be replicated to ascertain excess medical expenditures and improve the efficiency of medical resource use.
Keywords
The define, measure, analyze, improve and control (DMAIC) process was driven by combining control charts and decision trees. The DMAIC process was employed to analyze National Health Insurance expenses. Data on DRGs and clinics that reported expense anomalies and disposal costs was mined. A way to reduce abnormal expenses in the NHI was provided.Highlights
Introduction
Several studies1–5 have focused on the challenges and problems faced worldwide by National Health Insurance (NHI) schemes in healthcare payment systems, because they are linked to the steady and sustainable development of the NHI system and the quality of people’s medical resource use. In Taiwan, government legislation regulates the mandatory inclusion of all nationals in the social insurance system, 6 which has been in force since March 1, 1995. Most local healthcare institutions have been incorporated into the NHI system, which provides Taiwanese citizens with access to insurance and reduces the huge financial burden of healthcare payments for the public. Taiwan’s NHI provides good accessibility, wide population coverage, short waiting times, and relatively low costs, although an increase in long-term financial stress is one of its major weaknesses. 7 Therefore, some studies have focused on the efficiency of Taiwan’s NHI and improvements to the system.8–11 Although Taiwan’s NHI is a robust social welfare system, its fund has incurred long-term losses. Thus, how to improve the efficient use of the NHI fund to reduce losses, while maintaining the quality and level of medical care, has become an urgent issue that needs to be addressed.
To achieve effective control of medical expenses,12,13 the NHI implemented in Taiwan follows the international Diagnosis-Related Groups (DRGs) payment system method, modified to suit Taiwan. The payment system of Taiwan’s (Tw)-DRGs seeks to achieve effective control by managing application payment and clinical pathways,
7
and to standardize the Code of Medical Conduct to improve the quality of care available to the people and reduce the wastage of medical resources. With the introduction of Tw-DRGs 4.0 by the Central Health Insurance Department of Taiwan’s Ministry of Health and Welfare, patients are first classified based on the diagnosis of the disease, then by the type of surgery—subdivided further into surgical or no surgical treatment—and then according to several attributes, such as the patient’s gender, age, and weight, discharge status, and complications or comorbidities. Except for special cases, the quota payment criteria for the remaining conditions in the same group are consistent, as illustrated in Figure 1. Framework diagram of Tw-DRGs. Tw-DRGs, Taiwan’s diagnosis-related groups. Source: national health insurance administration, ministry of health and welfare (2009).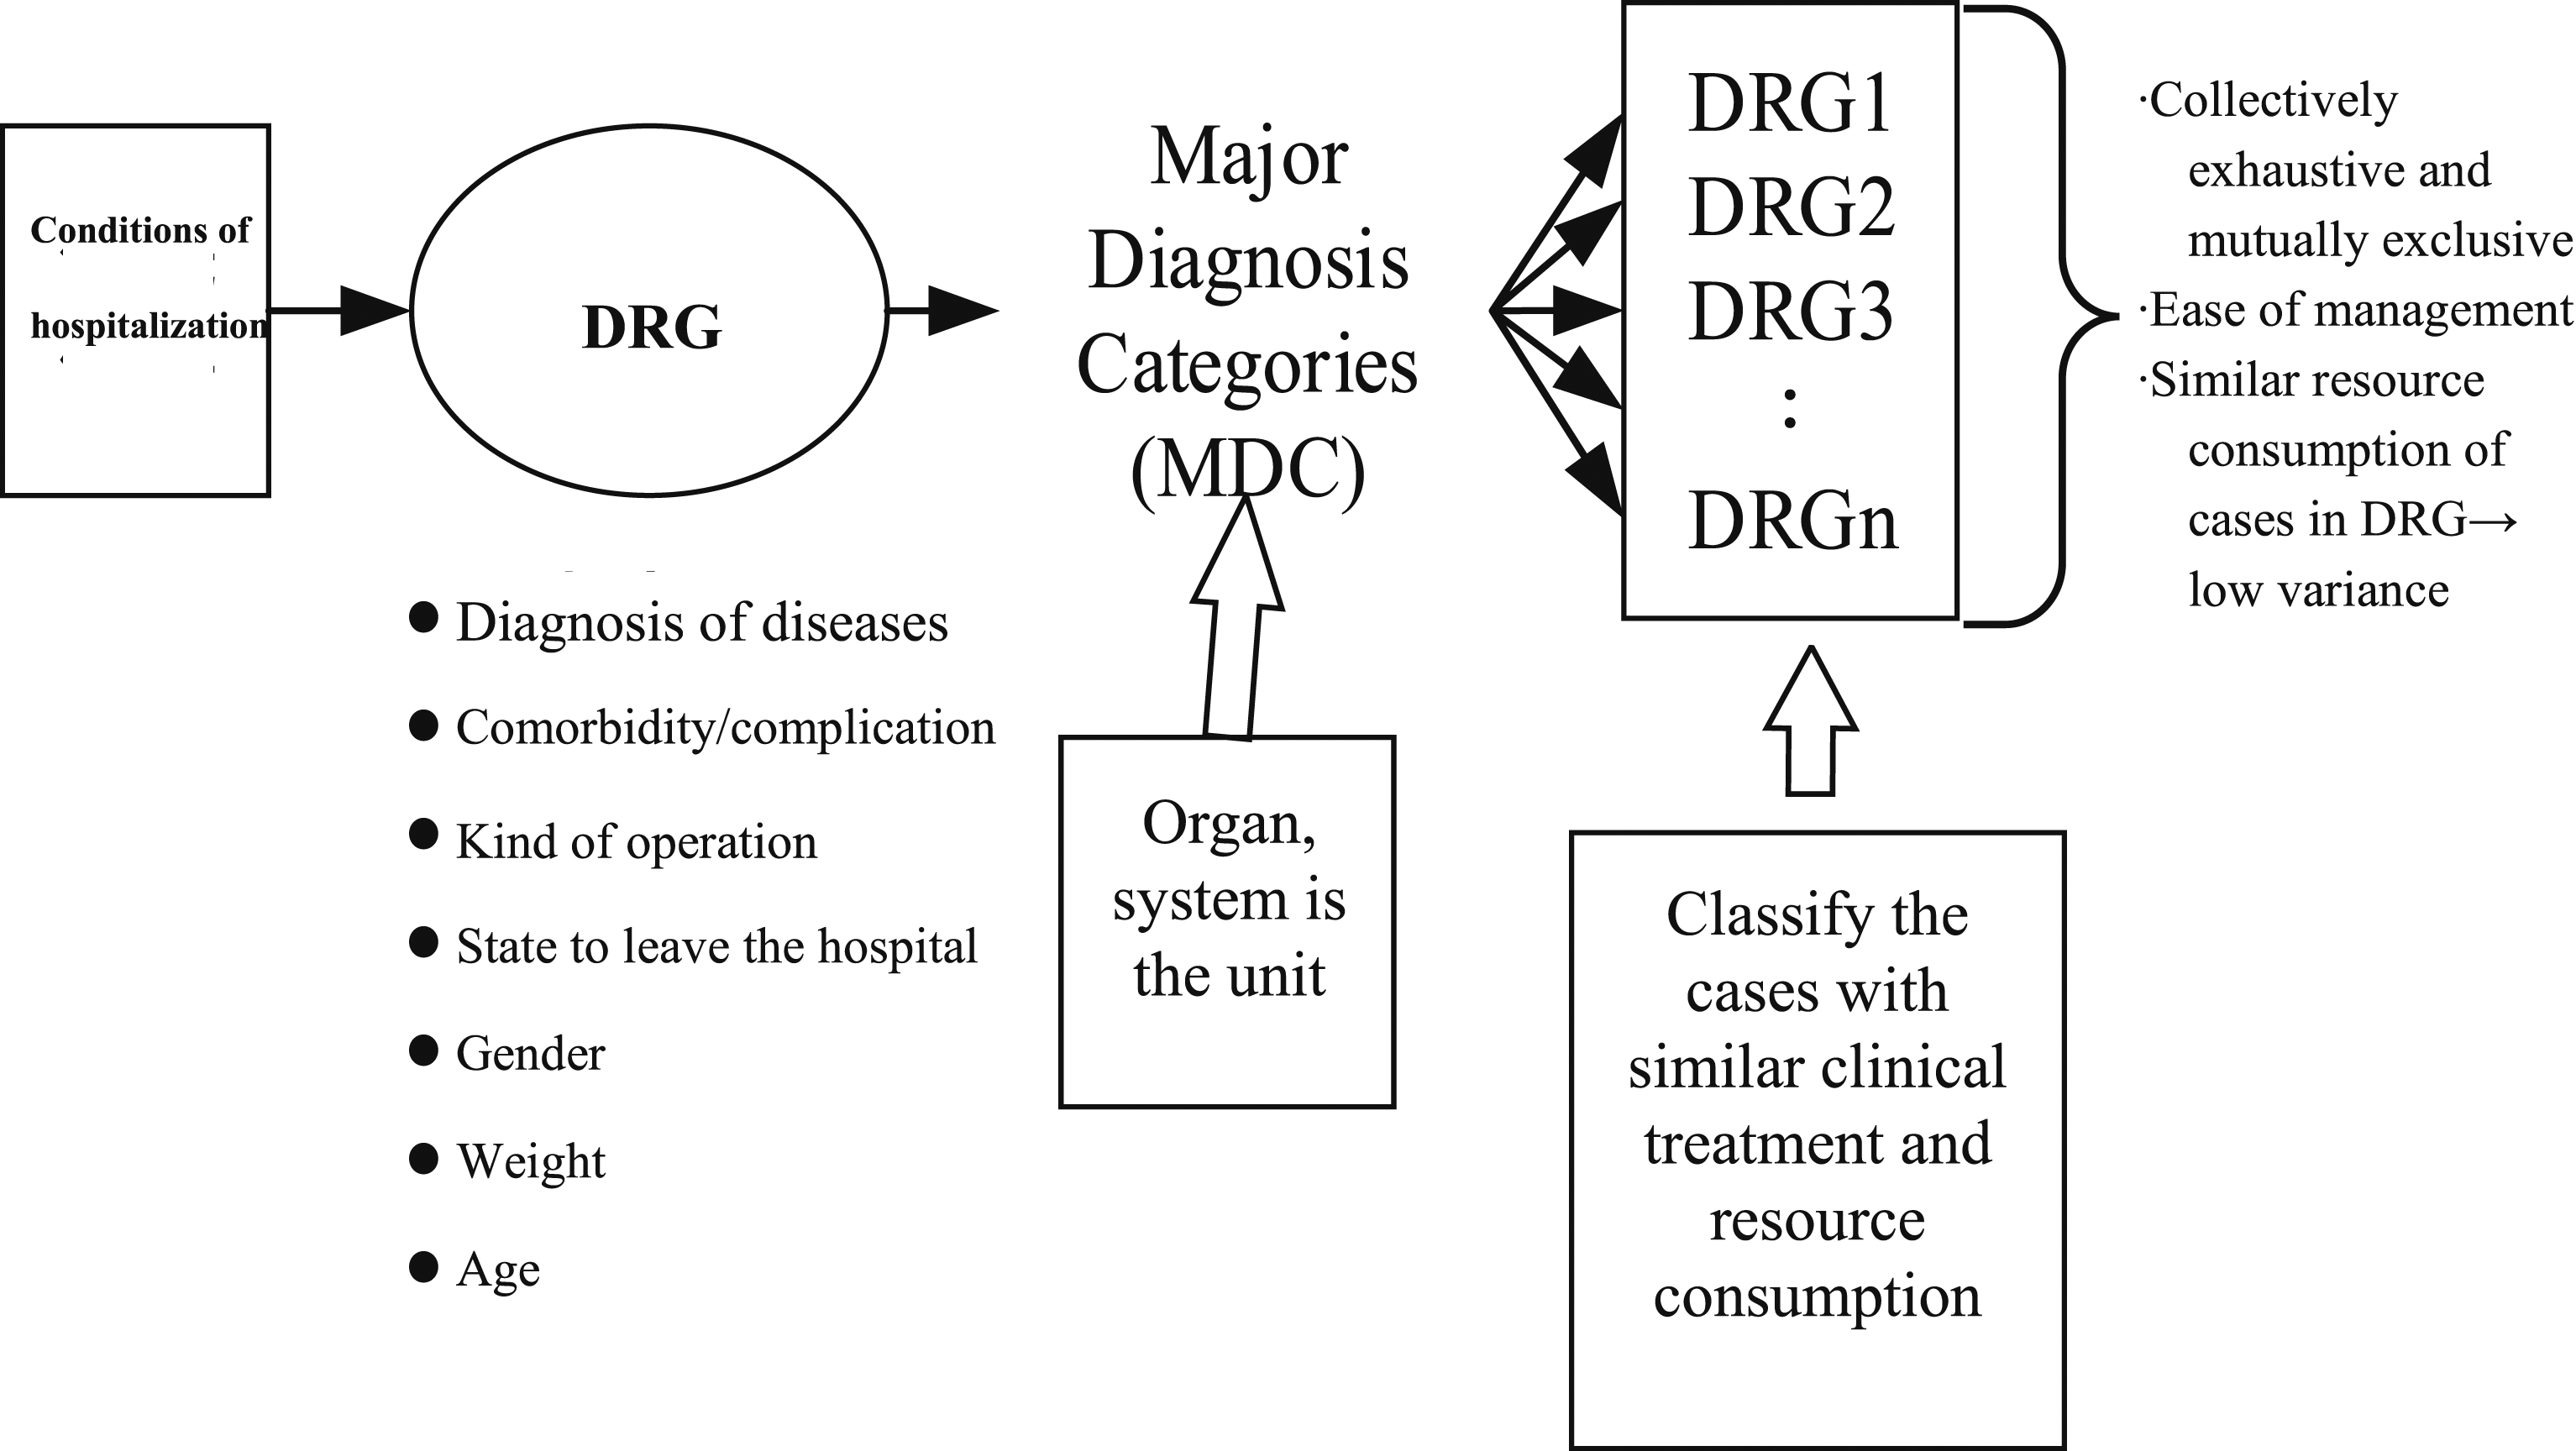
Digital medicine uses digital tools to upgrade medical practices to high-definition and personalized medicine. 14 In the age of the Internet, it can be used as a healthcare technology and practice for health professionals, as well as an application and interface for treating patients. 15 Many digital medical practices have been used in the study of healthcare technologies. For example, digital medicine planning 16 was developed for sensor-enabled drugs to detect the point at which a patient is taking the drug. There is also the ability to digitize human physiology using biosensors that track complex physiological systems. 14 There are also applications where digital drugs are administered to patients that send signals to worn patches, and have been successfully used for kidney transplantation, diabetes, hypertension, and hypercholesterolemia. 17 A study 18 explained that medical professionals can improve the quality and effectiveness of healthcare by incorporating many new medical devices through digital health applications.
Data mining has been widely used in various fields19–21 and employs big data to extract or mine useful or hidden information. 22 This method may be applied to extract useful information from a large database storing large amounts of data. Common data mining methods include artificial neural networks, 23 genetic algorithms, 24 and decision trees. 25 A decision tree26,27 is one of the tools used to classify data algorithmically to divide confused and disordered data under the same or similar conditions and to determine the data classification path as an instrument for analysis and prediction. A decision tree is an inductive learning process which can extract hidden and meaningful information from a large body of information and convert it into useful knowledge that users can use to conduct research. 26 The rules for the completion of these classifications are rendered after a tree structure comprising related parts such as nodes, branches, and leaf nodes. The most widely used decision tree algorithms are ID3, CART, C4.5, C5.0, and CHAID. A decision tree created with the C5.0 algorithm has the advantages of a fast classification speed, strong learning ability, and simple structure, and can provide more accurate and efficient results. 28 Therefore, in this study, we used a C5.0 decision tree as the analytical method.
Data on application payments for sepsis provided by a hospital were used as an example to analyze the application fees in different clinics. By understanding the relationship between application fees and clinics, we can identify abnormal problems and attempt to improve them. In this study, we aimed to understand the relationship between application fees and clinics as well as to identify abnormal problems and mechanisms for improvement. The research procedure was implemented through the define, measure, analyze, improve, and control (DMAIC) method, which initially defines a reasonable range for inter-clinic application fees and their index values. The aim was to collect valid data on application fees for sepsis, tracked using an application fee control chart, to identify outliers beyond control limits. SPSS 20.0 statistical software was utilized for statistical analysis and the C5.0 algorithm was used to establish a tree structure chart of the “sepsis” application fee for analysis, from which we ascertained the important variables and potential rules affecting medical application fees, determined the reasons for abnormal application fees, and designed methods to improve them. Thus, this study began with the principle of maintaining the quality of medical care as much as possible while controlling costly samples. Based on this expectation, without loss of generality, each application was controlled at the 95% confidence level of the average application fee. The objective of this study was to identify abnormal application fees (significant level setting by 5%) from sepsis data based on the upper and lower regulatory boundaries and to explore the differences in application fees among individual clinics to control the wastage of medical resources. In the anomalous sample, when the application fee was reduced to the average with appropriate improvements, the application fee for these anomalous cases could reduce by at least 47.5%.
Define, measure, analyze, improve and control processes for improving systems are widely used in industrial production29–32 and hospital management.33–35 The DMAIC process begins by defining problems, identifying the main causes, and proposing relevant solutions. This is supported by the implementation of the Lean Six Sigma (LSS) DMAIC methodology to improve healthcare quality performance. 36 This approach has been implemented in outpatient procedures to improve effectiveness and reduce costs in the field of medical technology. 33 LSS has been applied to improve the quality and cost of pharmaceutical manufacturing 37 and the treatment process of cancer patients to reduce the time spent in hospitals. 38
In the past, focus on the NHI was on sources and funding methods 1 as well as sustainability.1,5 In particular, there is a relationship between the NHI and out-of-pocket expenses. 11 Differences in healthcare utilization between rural and urban areas, 10 emphasis on improvements in health insurance implementation systems, 9 and adjustments to premium policies’ focuses 8 have been discussed. These studies did not track and control for the outcomes of the NHI’s medical disposal costs. In addition, the DMAIC method is widely used in the manufacturing industry to improve the manufacturing process and reduce production costs.30–32 This method is used to improve the implementation of medical technologies 34 to improve the effectiveness (quality) and efficiency of surgical procedures, 33 but is not used to reduce medical expenditure. Improving the effectiveness (quality) and efficiency of surgical procedures 33 have not been used to reduce healthcare costs.
In this study, we attempted to improve the healthcare payment mechanism in Taiwan’s NHI system by identifying abnormalities in healthcare payments, determining the factors that caused these abnormal payments, and proposing specific development and control practices for hospitals in the future as a reference for improvement and quality monitoring. The architecture of the DMAIC process on which this study is based is depicted in Figure 2. Architecture of the DMAIC process. DMAIC: define, measure, analyze, improve and control; CI: confidence interval; DRGs: diagnosis-related groups.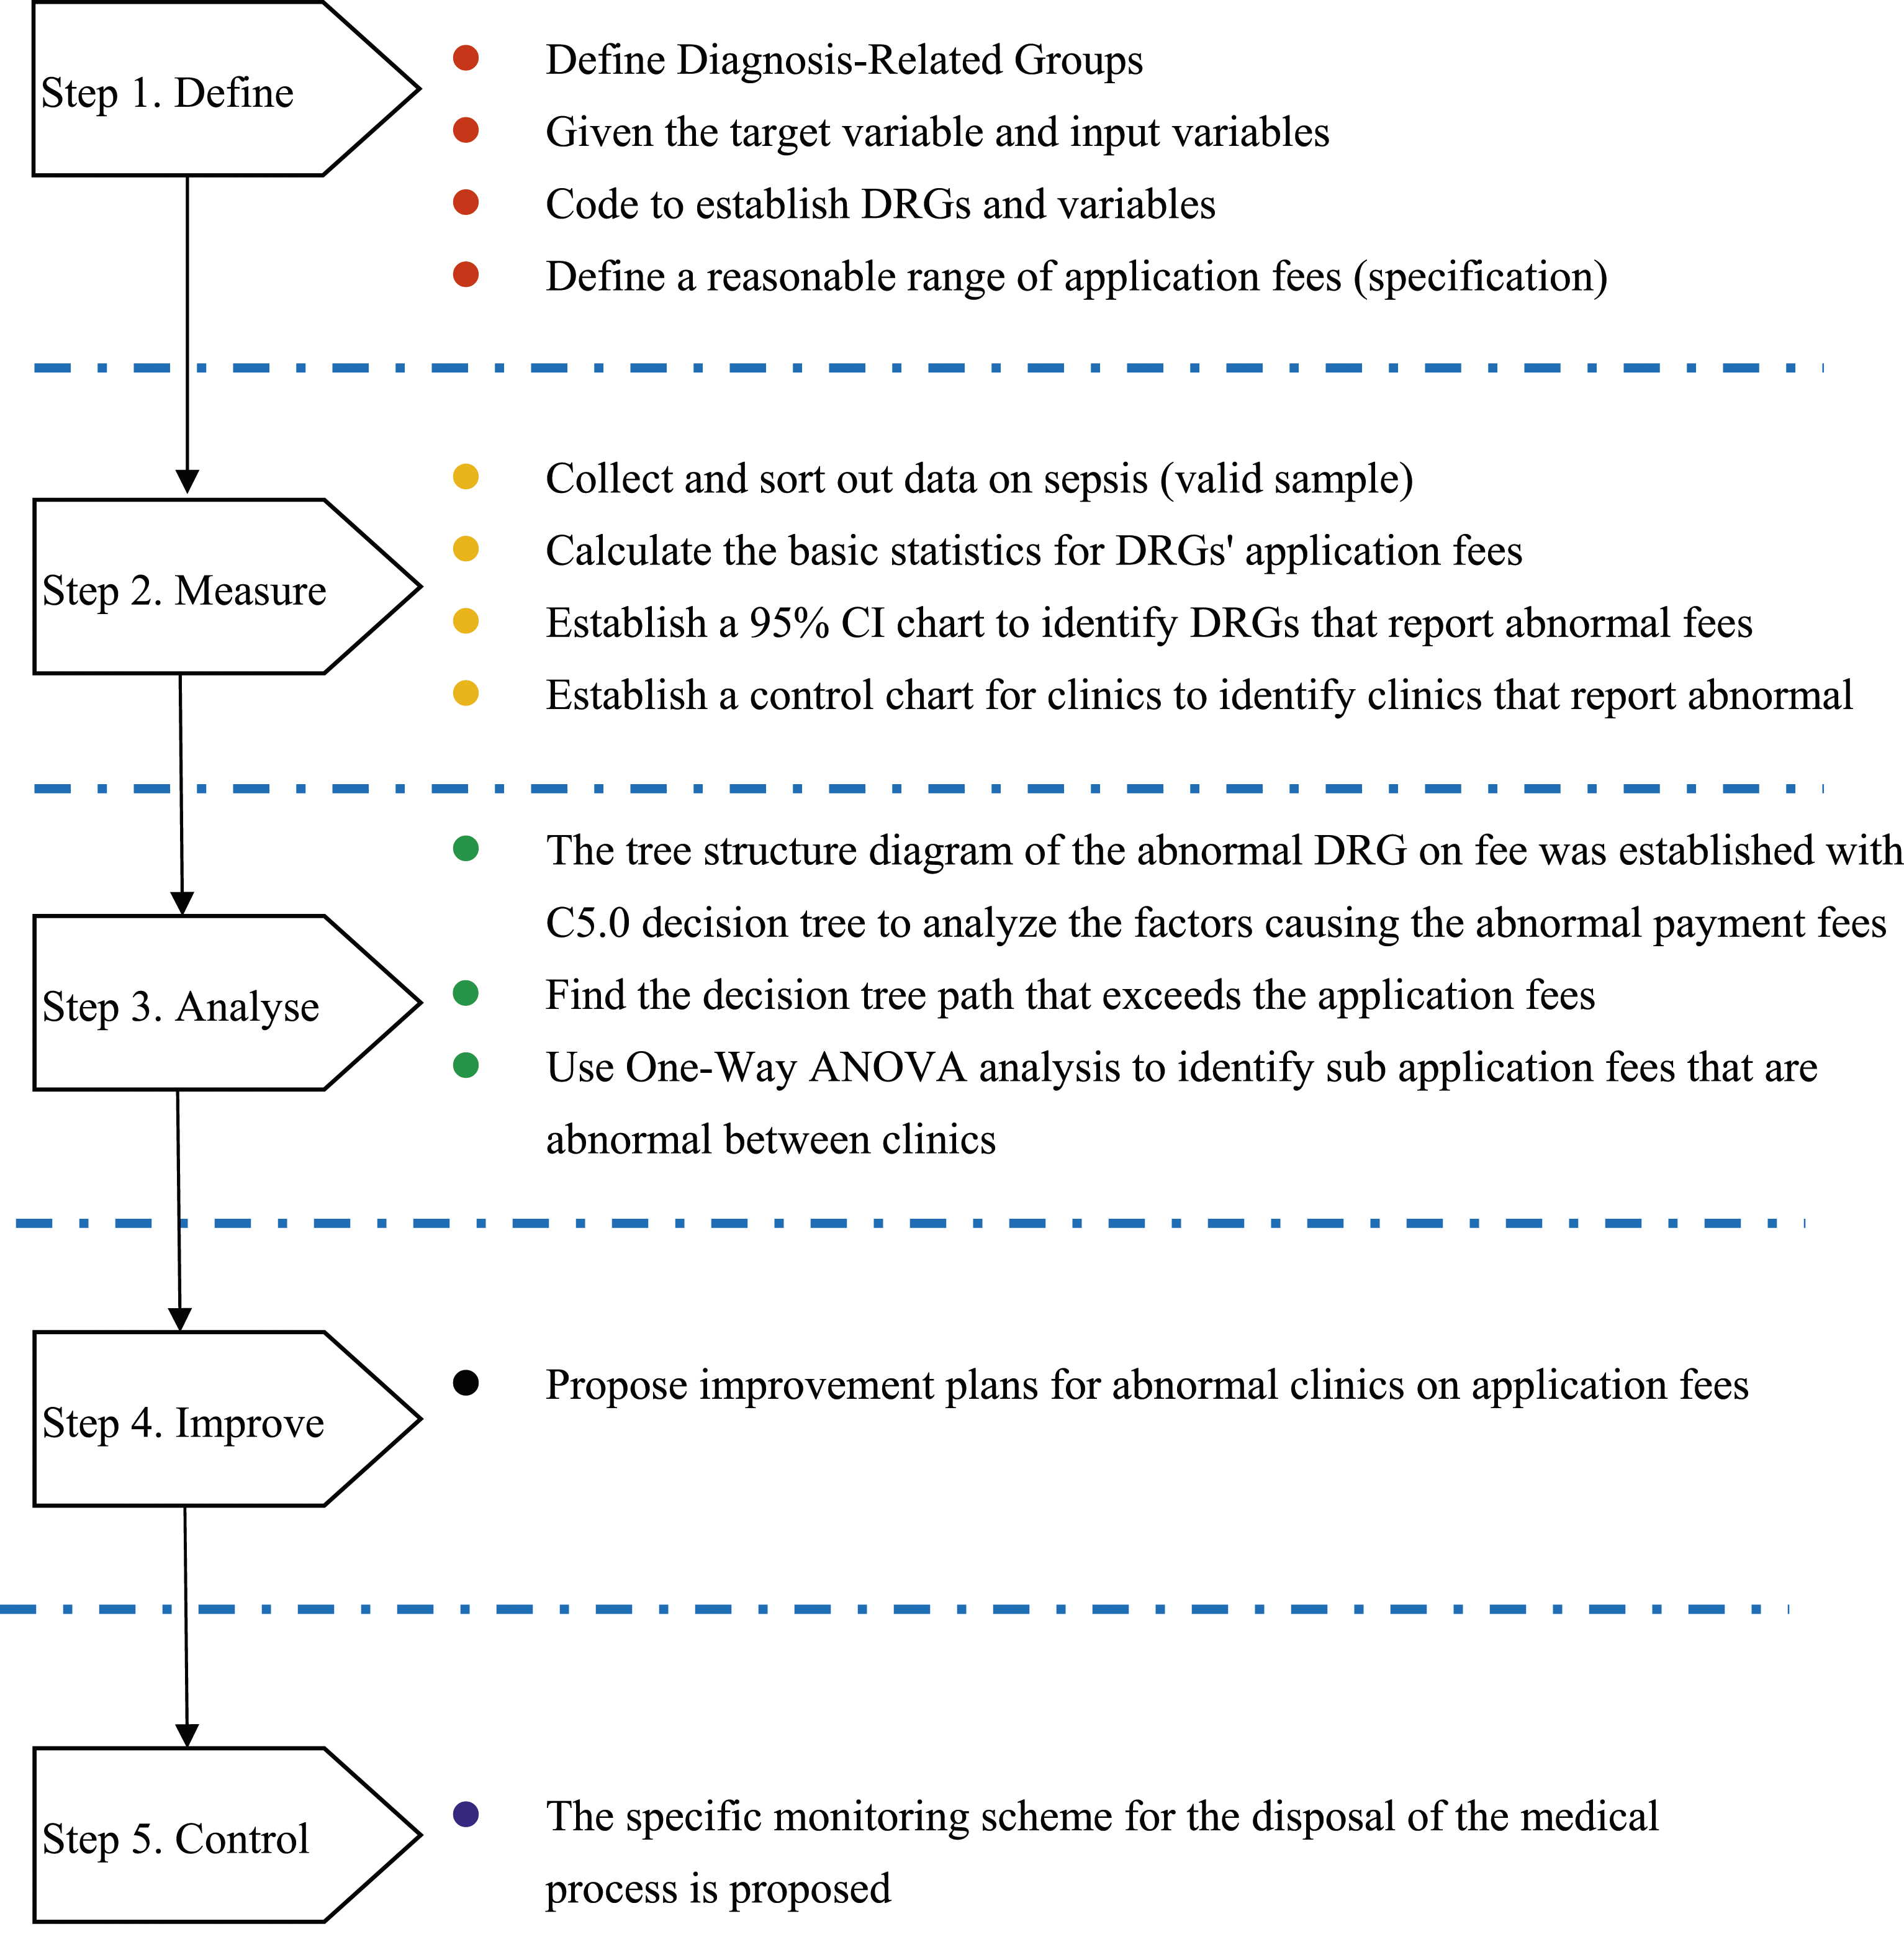
Analysis based on the DMAIC process
Healthcare efficiency is related to the profitability of health insurance funds under Taiwan’s NHI fund, which has long been incurring losses. Therefore, unusual utilization of medical application fees (which exceed the filing limit) must be identified to suggest improvement strategies for reducing waste and increasing the efficiency of medical resource use. After review and improvement, medical resources can gradually be optimally allocated to safeguard the quality of medical care for the public when seeking medical treatment. This study is based on the DMAIC process and employs data mining and the C5.0 decision tree method for analysis. The remainder of this paper analyzes the abovementioned abnormal application fees in detail under the five components of the DMAIC process and recommends various improvement methods.
Define
Diagnosis-related groups
Definition of Tw-DRGs for sepsis and their codes.
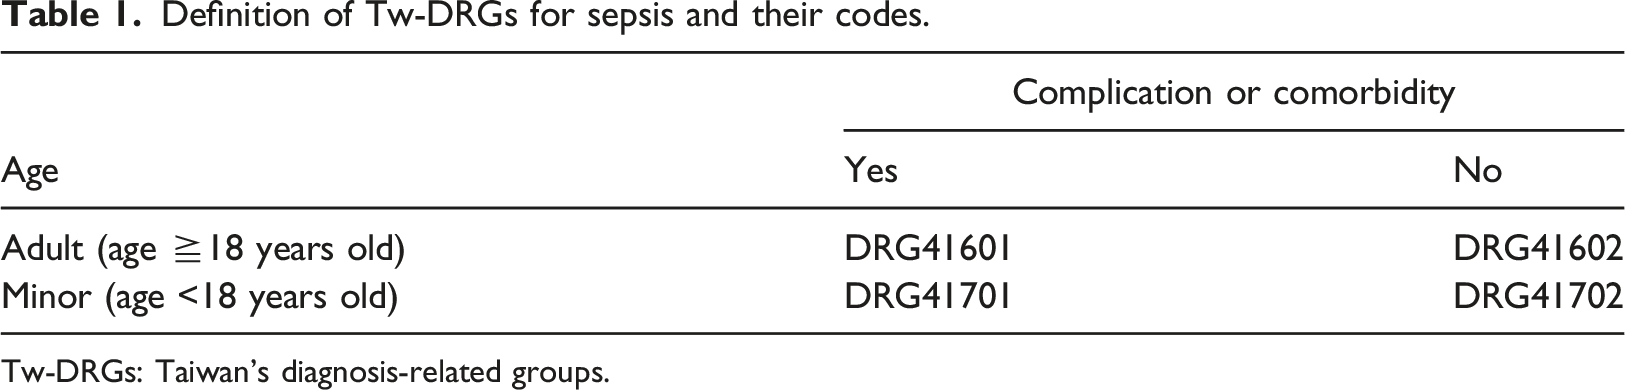
Tw-DRGs: Taiwan’s diagnosis-related groups.
Table 1 presents four DRGs: (1) DRG41601: sepsis, adults (age ≧18 years old), with comorbidity or complications; (2) DRG41602: sepsis, adults (age ≧18 years old), no comorbidity or complications; (3) DRG41701: sepsis, minors (age <18 years) with comorbidities or complications; (4) DRG41702: sepsis, minors (age <18 years), no comorbidities or complications.
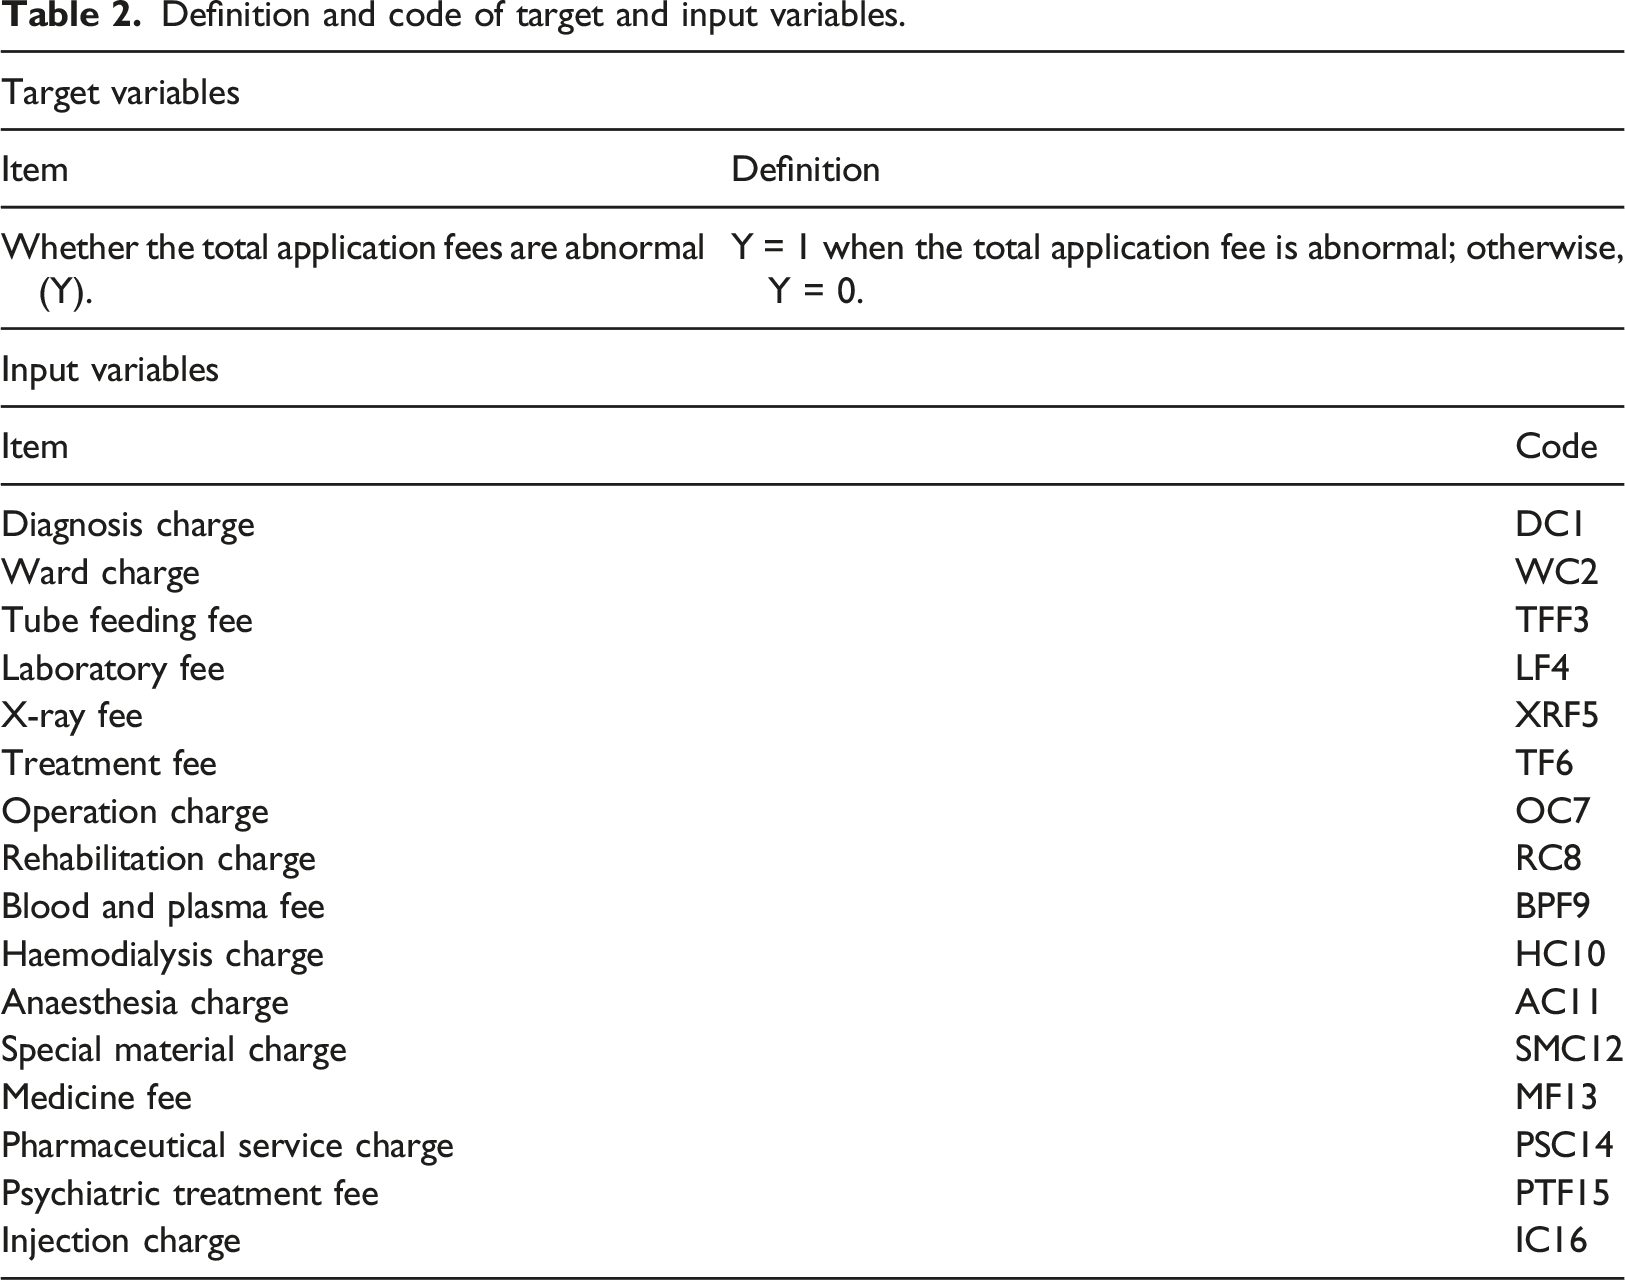
Target input variables
Definition and code of target and input variables.
Measure
Reasonable range and basic statistics of each application fee
Reasonable range and basic statistics for each application fee (N = 353).
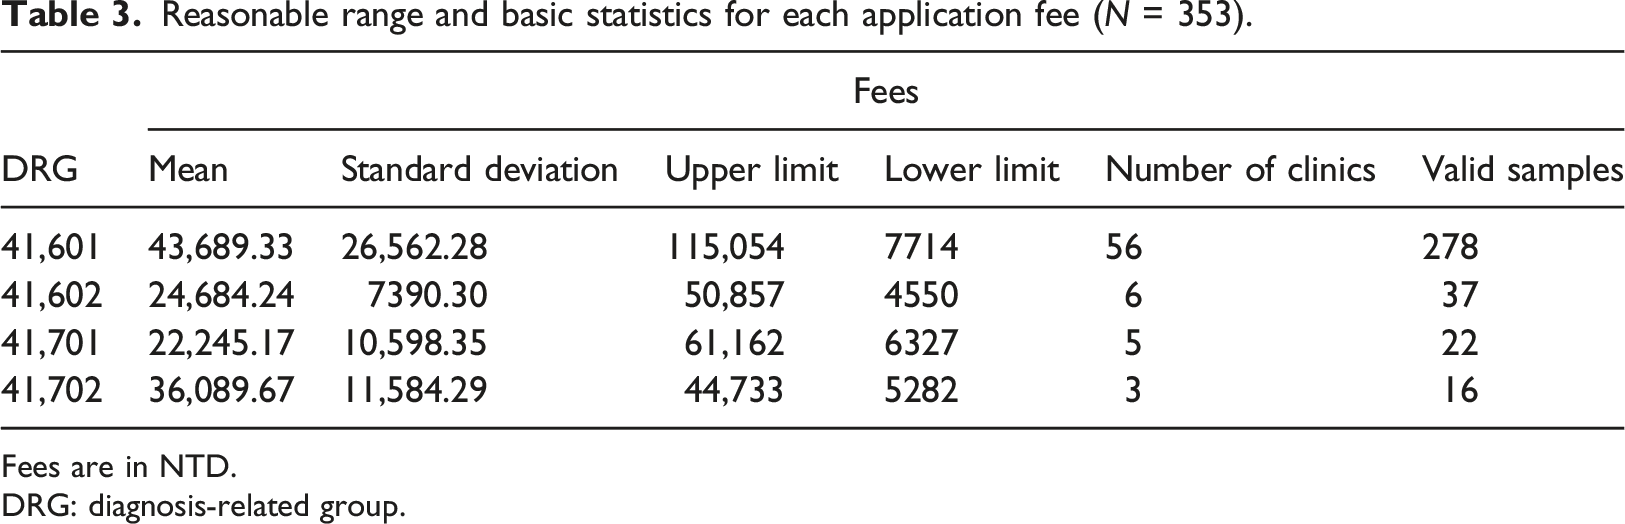
Fees are in NTD.
DRG: diagnosis-related group.
95% confidence interval chart
We calculated the 95% confidence interval (CI) based on the mean and standard deviation of each application fee for the DRGs (Table 3 and Figure 3). Figure 3 illustrates the regions in which most application fees (95% probability) are likely to fall for the four DRGs. Simultaneously, the application fees of the four DRGs were analyzed to reveal which DRG had significant differences compared to the other three groups (the DRG application fee had significant differences if the 95% CI for one DRG did not overlap with the 95% CI for the other DRGs). Figure 3 demonstrates that the 95% CI for the four DRGs, DRG41601, DRG41602, DRG41701, and DRG41702, are recorded as [−8492.27, 95,870.93], [10,166.00, 39,202.48], [1424.71, 43,065.63], and [13,332.33, 58,847.01], respectively. As is evident from Figure 3, the 95% CI for the application fee for the four DRGs overlapped. Therefore, there is insufficient evidence to demonstrate significant differences in the averages of the four DRGs. In addition, the 95% CI of the application fee in DRG41601 covered a significantly larger area than that of the other three groups, which may reflect significant differences in the individual application fees in DRG41601. This result illustrates that individual samples in DRG41601 may have high application fees, and thus DRG41601 may have some individual abnormal application fees. 95% CI chart of each application fee for DRGs. CI: confidence interval; DRGs: diagnosis-related groups.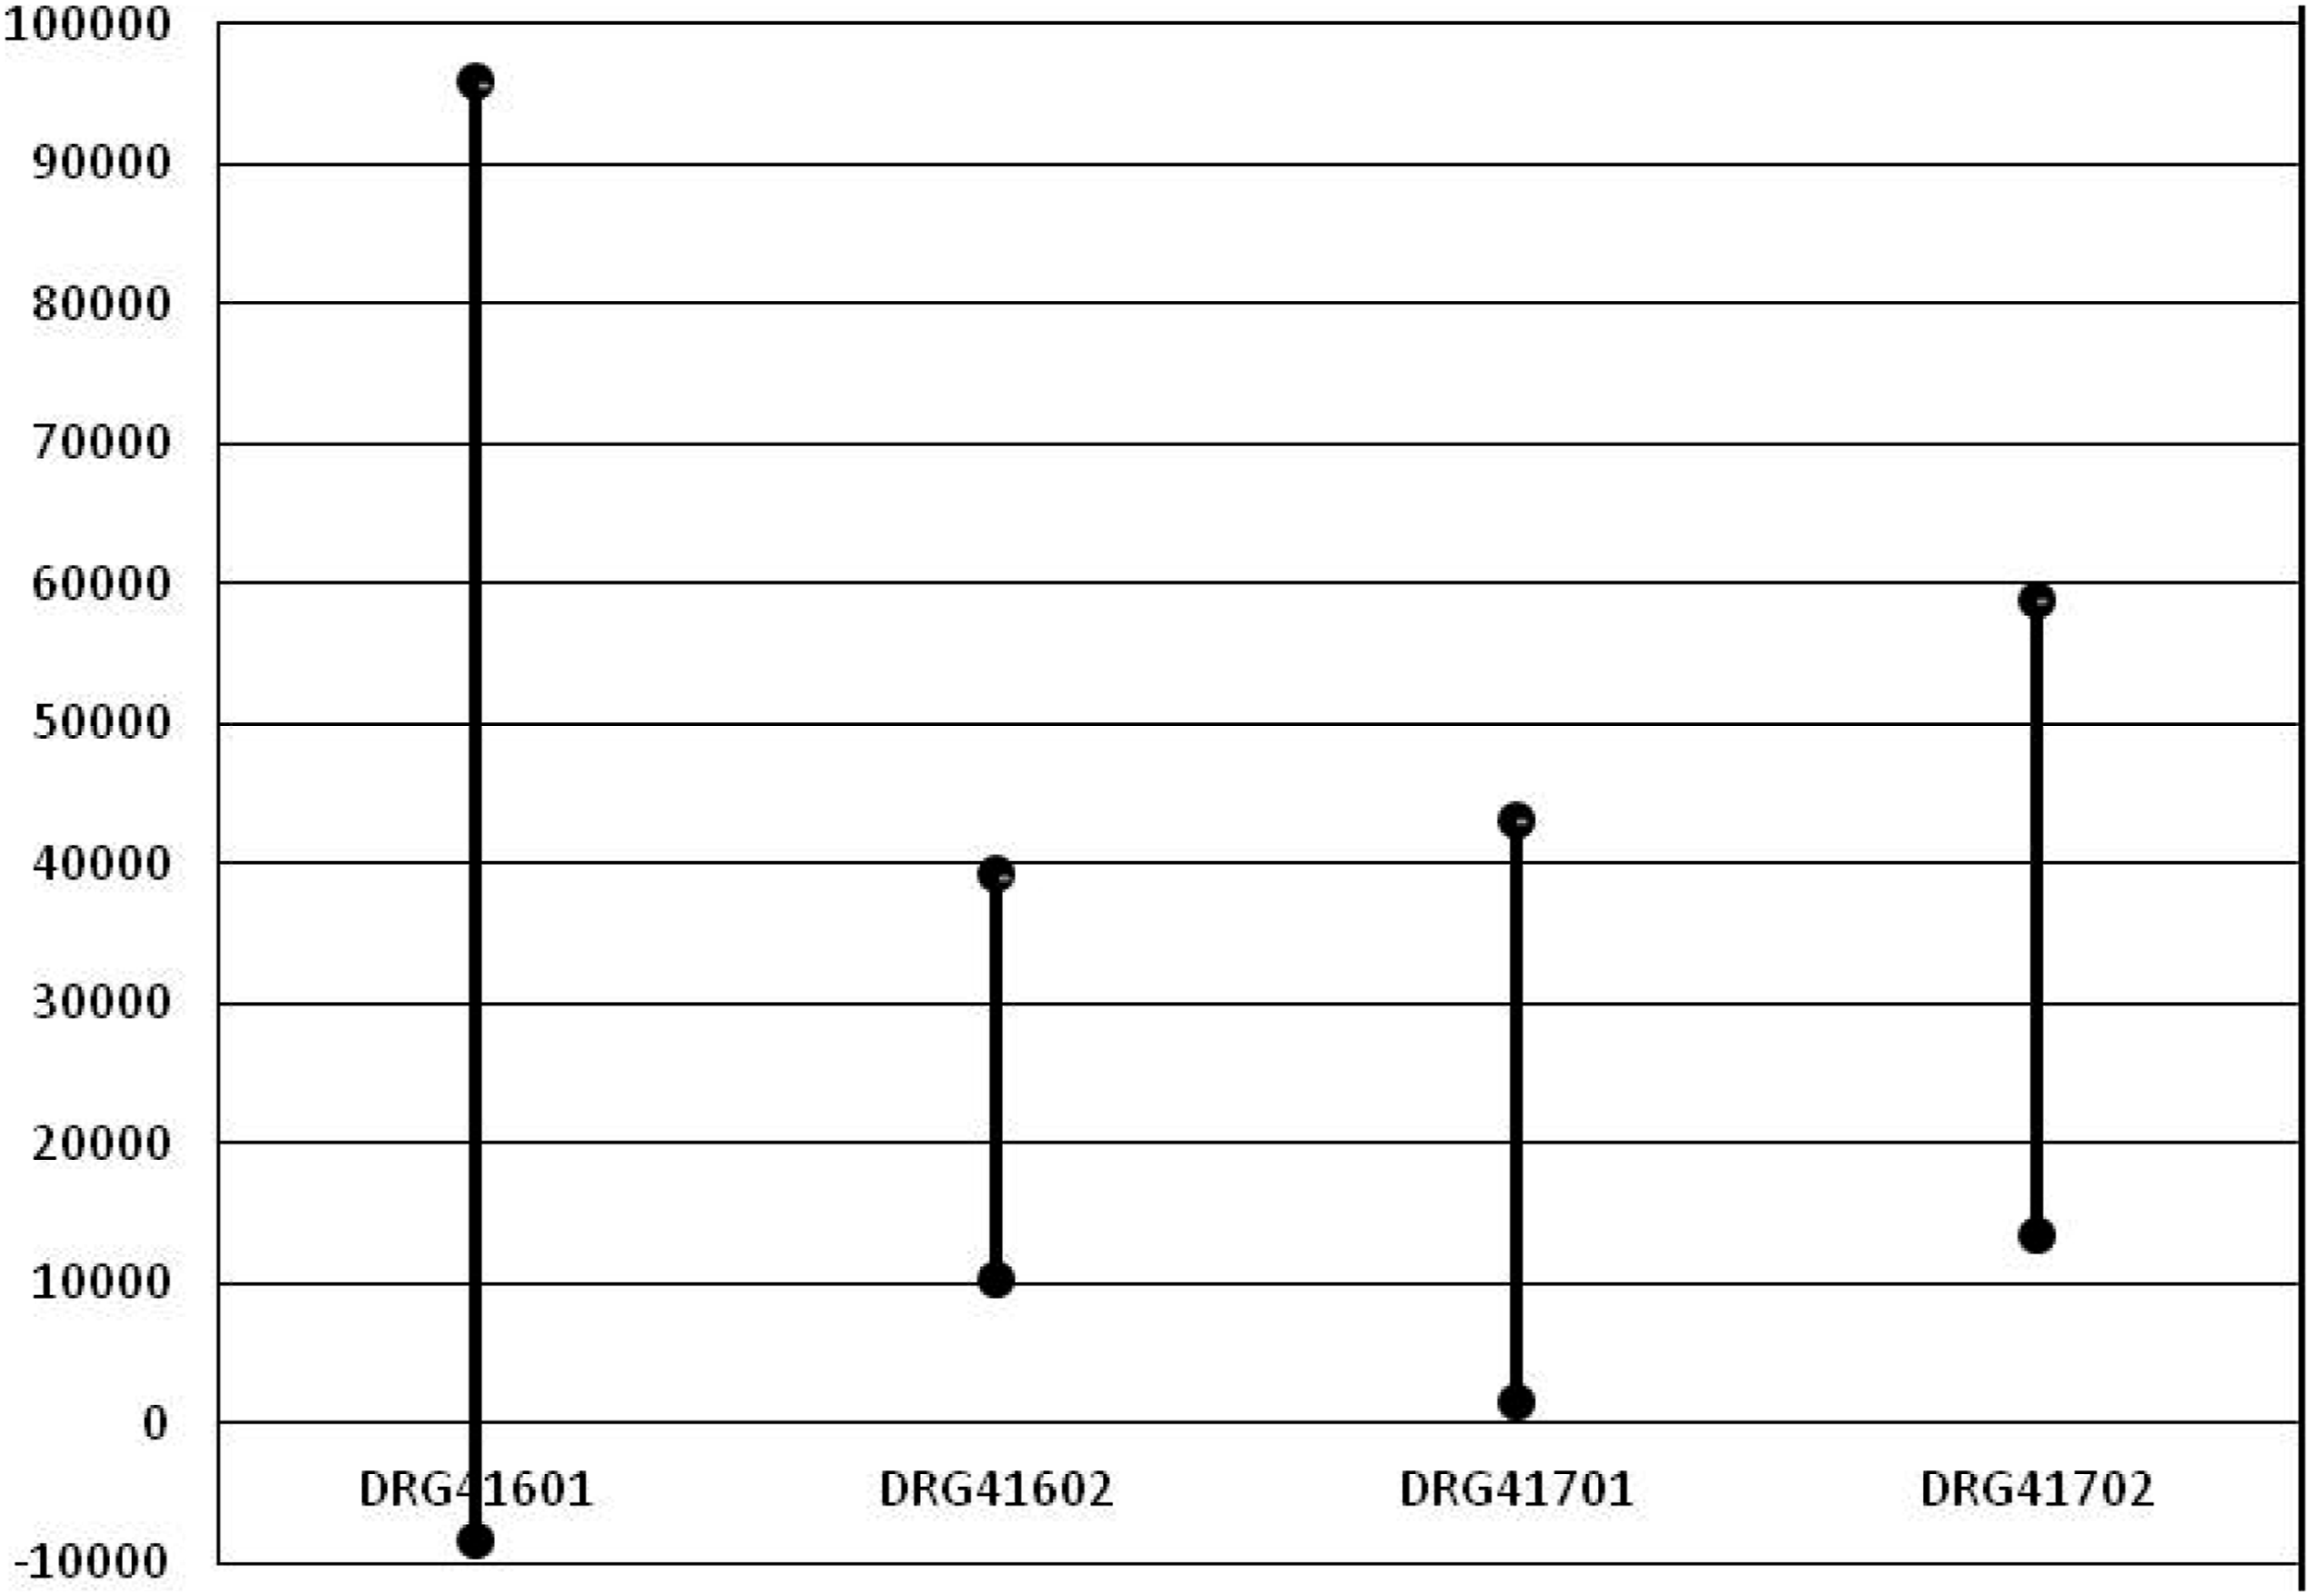
Control chart of the average application fees of clinics
Four cost control charts were developed based on the upper and lower limits of the application fees presented in Table 3, as well as the average application fees declared by clinics in the DRGs (see Figure 4). Figure 4 shows that among the cost control charts for the four groups, only DRG41601 (Figure 4(a)) had an average application fee exceeding the control upper limit, with nine clinics (Nos. 6, 9, 14, 38, 39, 41, 44, 49, and 55) having an abnormal average application fee. Based on the results of the 95% CI chart (larger CI) and the cost control chart (average application fee for abnormalities among the nine clinics), we expected DRG41601 to have anomalies in the application fee; thus, it needs further analysis, review, and improvement. Therefore, further analysis of the application fee of DRG41601 was conducted through the C5.0 decision tree to identify specific causes and propose improvement methods. Cost control chart of the average application fee on the four DRG clinics. DRGs: diagnosis-related groups. (a) DRG 41601. (b) DRG 41602. (c) DRG 41701. (d) DRG 41702.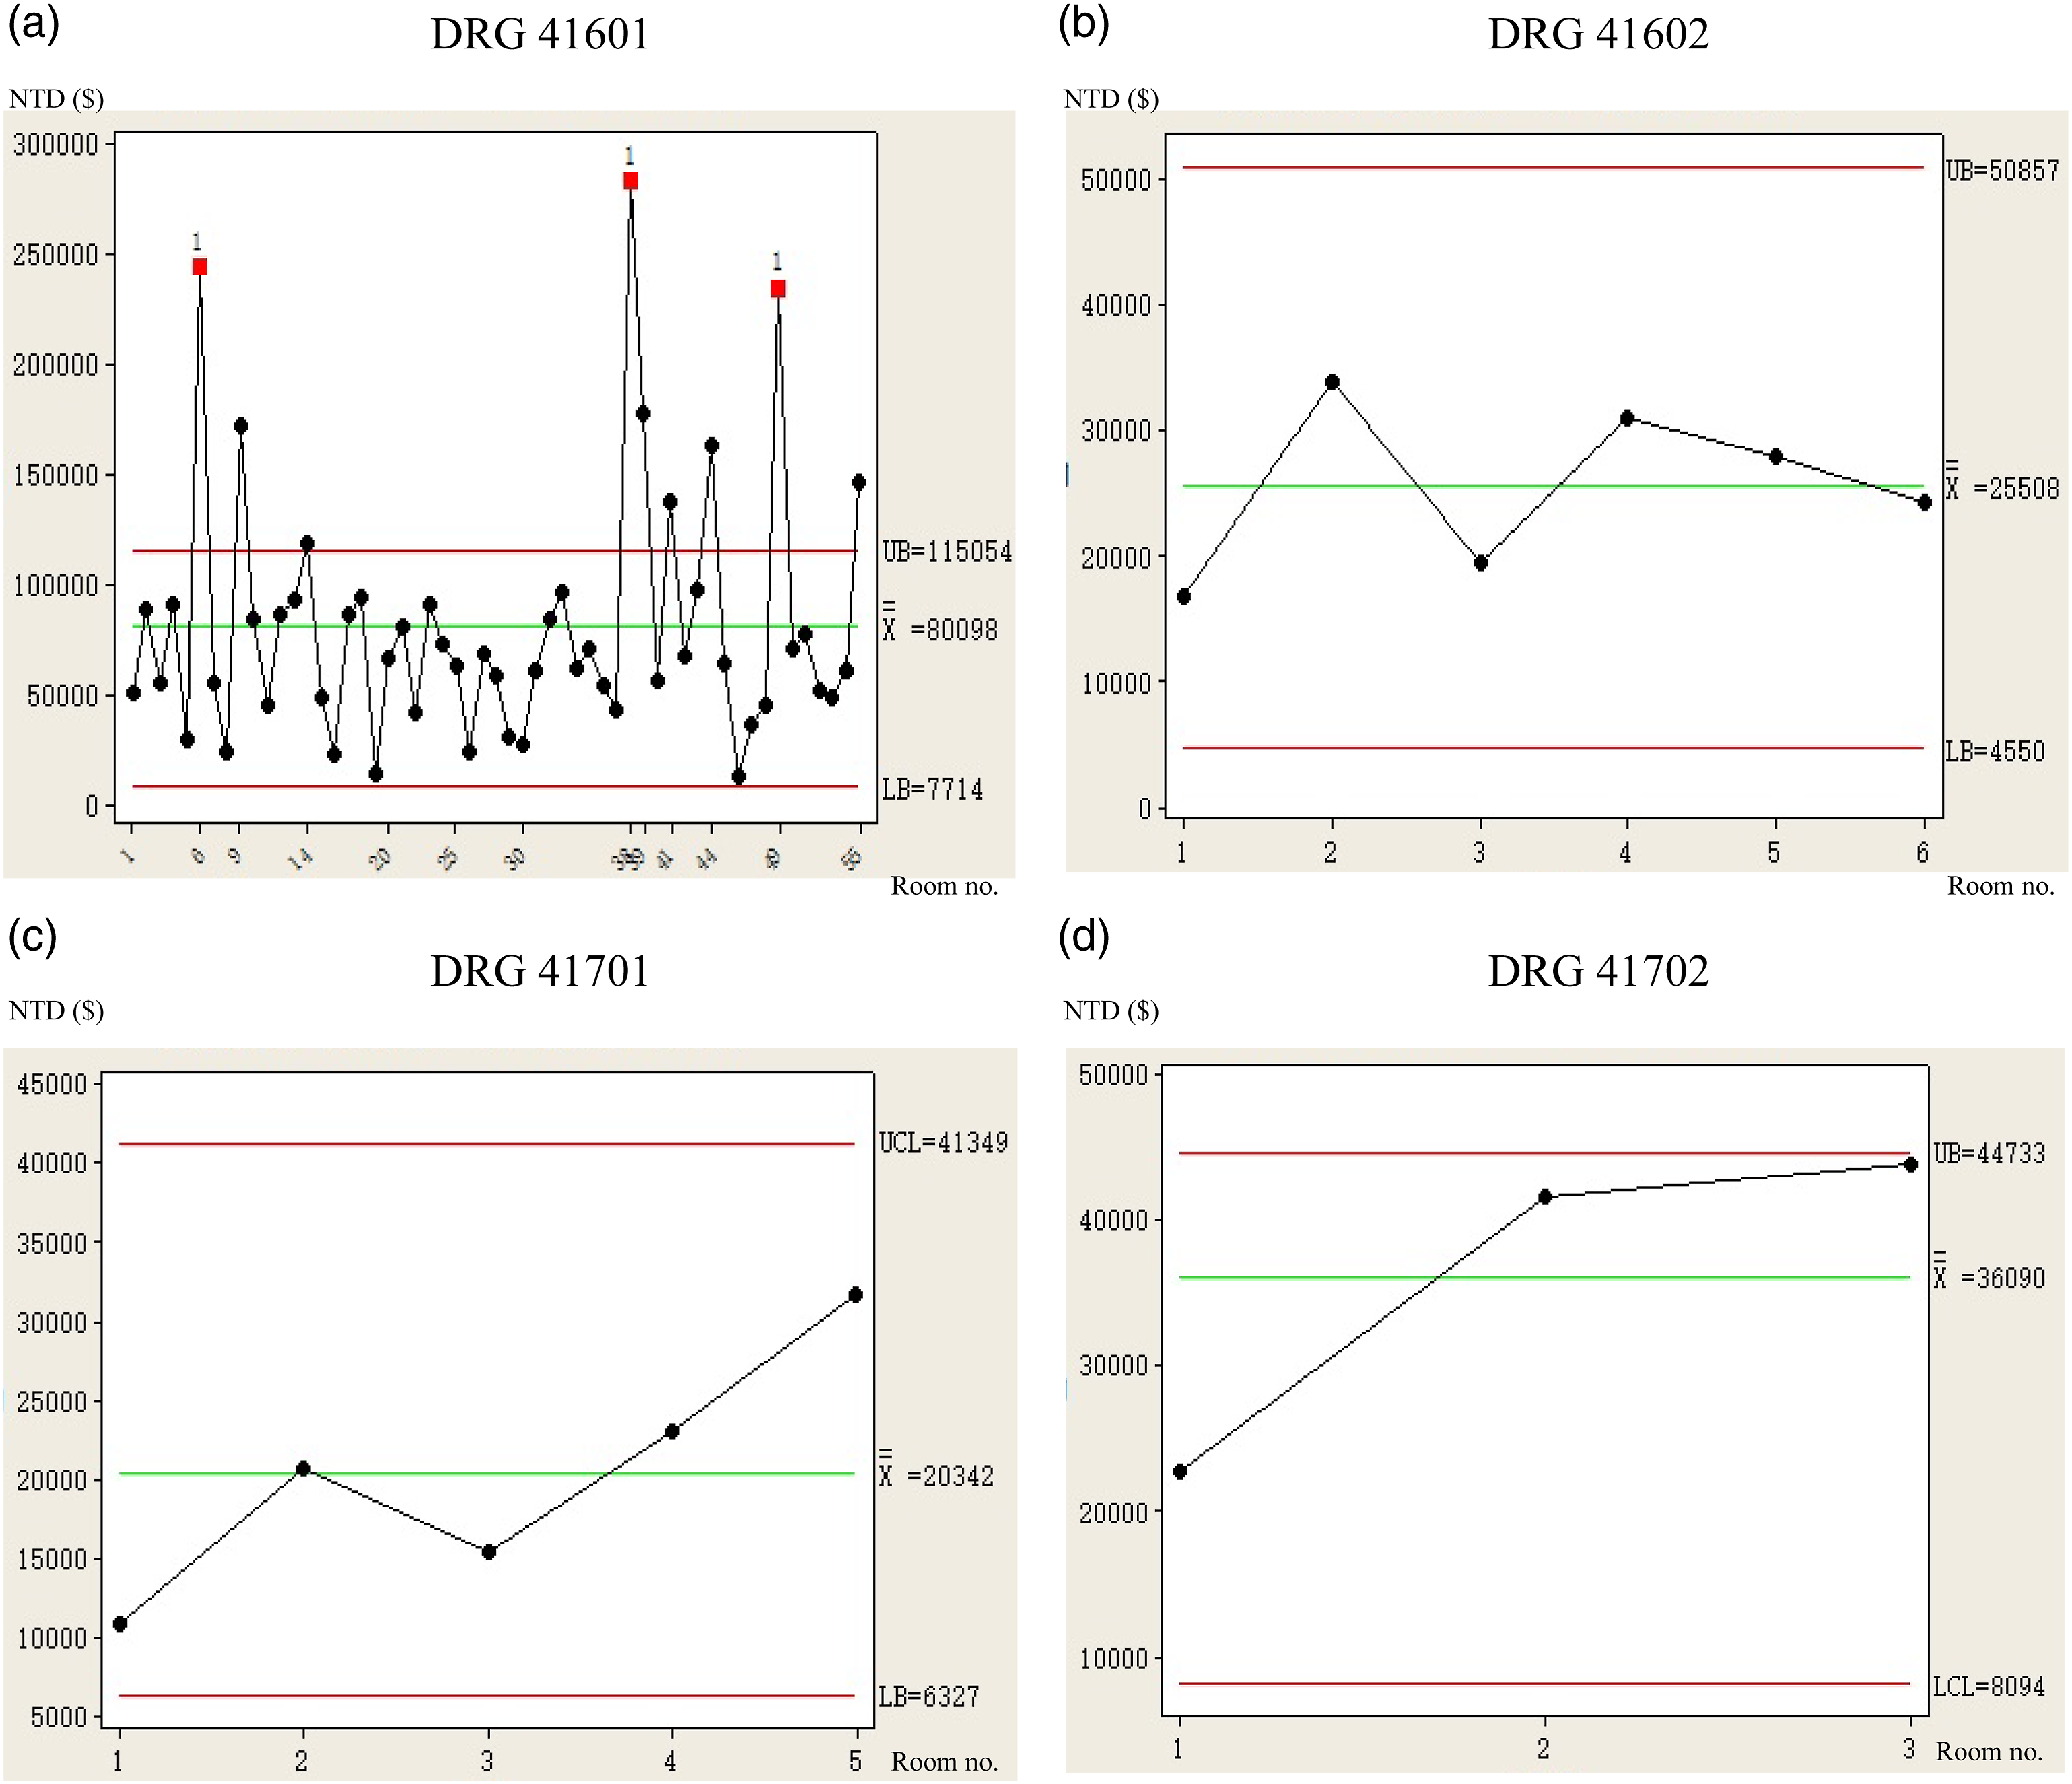
Analyse
C5.0 decision tree analysis
Based on the results of the 95% CI graph (Figure 3) and cost control chart (Figure 4(a)), the causes of anomalies in the application fees of DRG41601 were further analyzed, mainly through the C5.0 decision tree for the DRG41601 sample. The organization of the main rules and processes of the algorithm of the C5.0 decision tree is illustrated in Figure 5 and includes the following steps: Process of C5.0 decision tree setting.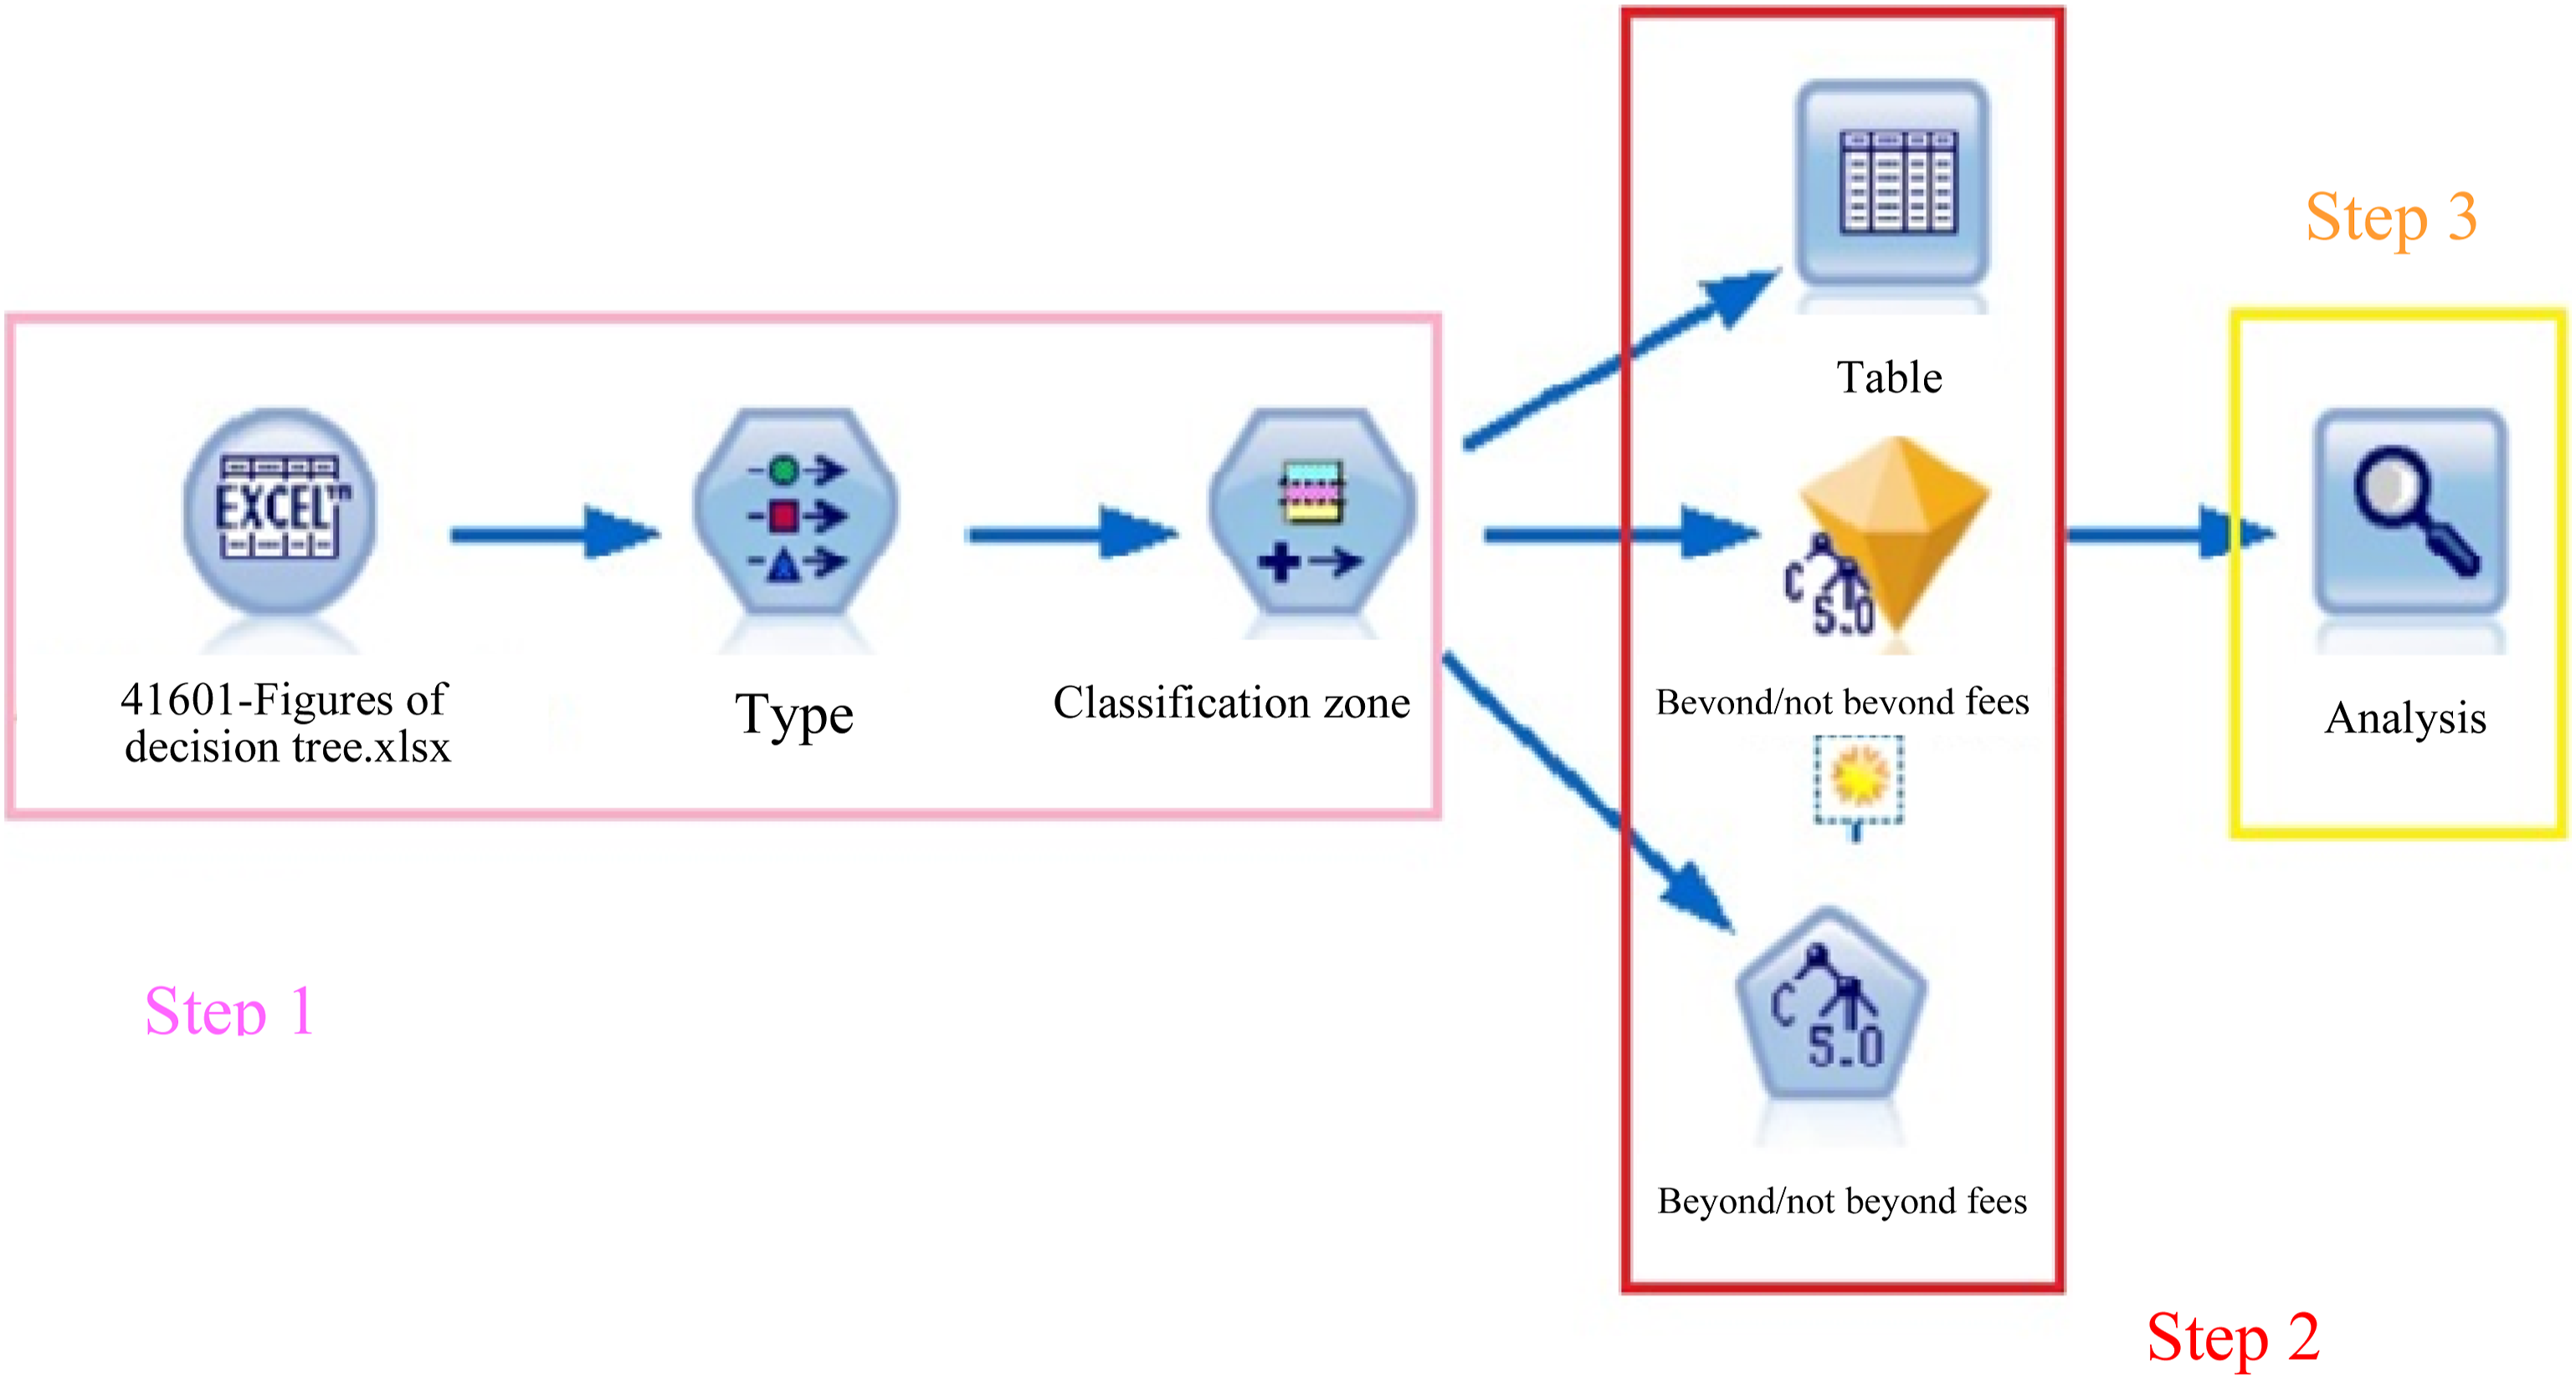
The target variable set in Table 2 was Y (whether the total application fee is abnormal). When the upper limit on the total application fee was exceeded, that is, when the application fee was abnormal, Y = 1; otherwise, Y = 0. In addition, the input variables were based on the diagnosis charge (DC1), ward charge (WC2), tube feeding fee (TFF3), laboratory fee (LF4), X-ray fee (XRF5), treatment fee (TF6), operation charge (OC7), rehabilitation charge (RC8), blood and plasma fee (BPF9), haemodialysis charge (HC10), anaesthesia charge (AC11), special material charge (SMC12), medicine fee (MF13), pharmaceutical service charge (PSC14), psychiatric treatment fee (PTF15), and injection charge (IC16).
After the input and target variables were set, the C5.0 decision tree algorithm was used to execute the program. The standard algorithm automatically produced the rules of classification and finally formed a tree structure diagram.
Analysis of the tree’s judgment accuracy was conducted.
Figure 6 shows the structure of the tree. The locations of the nodes in each hierarchy of the C5.0 decision tree indicate the important factors affecting the target variable Y (whether the total application fee is in order) and demonstrate that the ward charge is higher than the medicine fee, the medicine fee is higher than the pharmaceutical service charge and treatment fee, the pharmaceutical service charge is higher than the hemodialysis charge, and the treatment fee is higher than the laboratory fee. Thus, ward charges, medicine fees, pharmaceutical service charges or treatment fees, hemodialysis charges, and laboratory fees were major factors (ordered in terms of importance) affecting anomalies in the application fee. Tree structure diagram.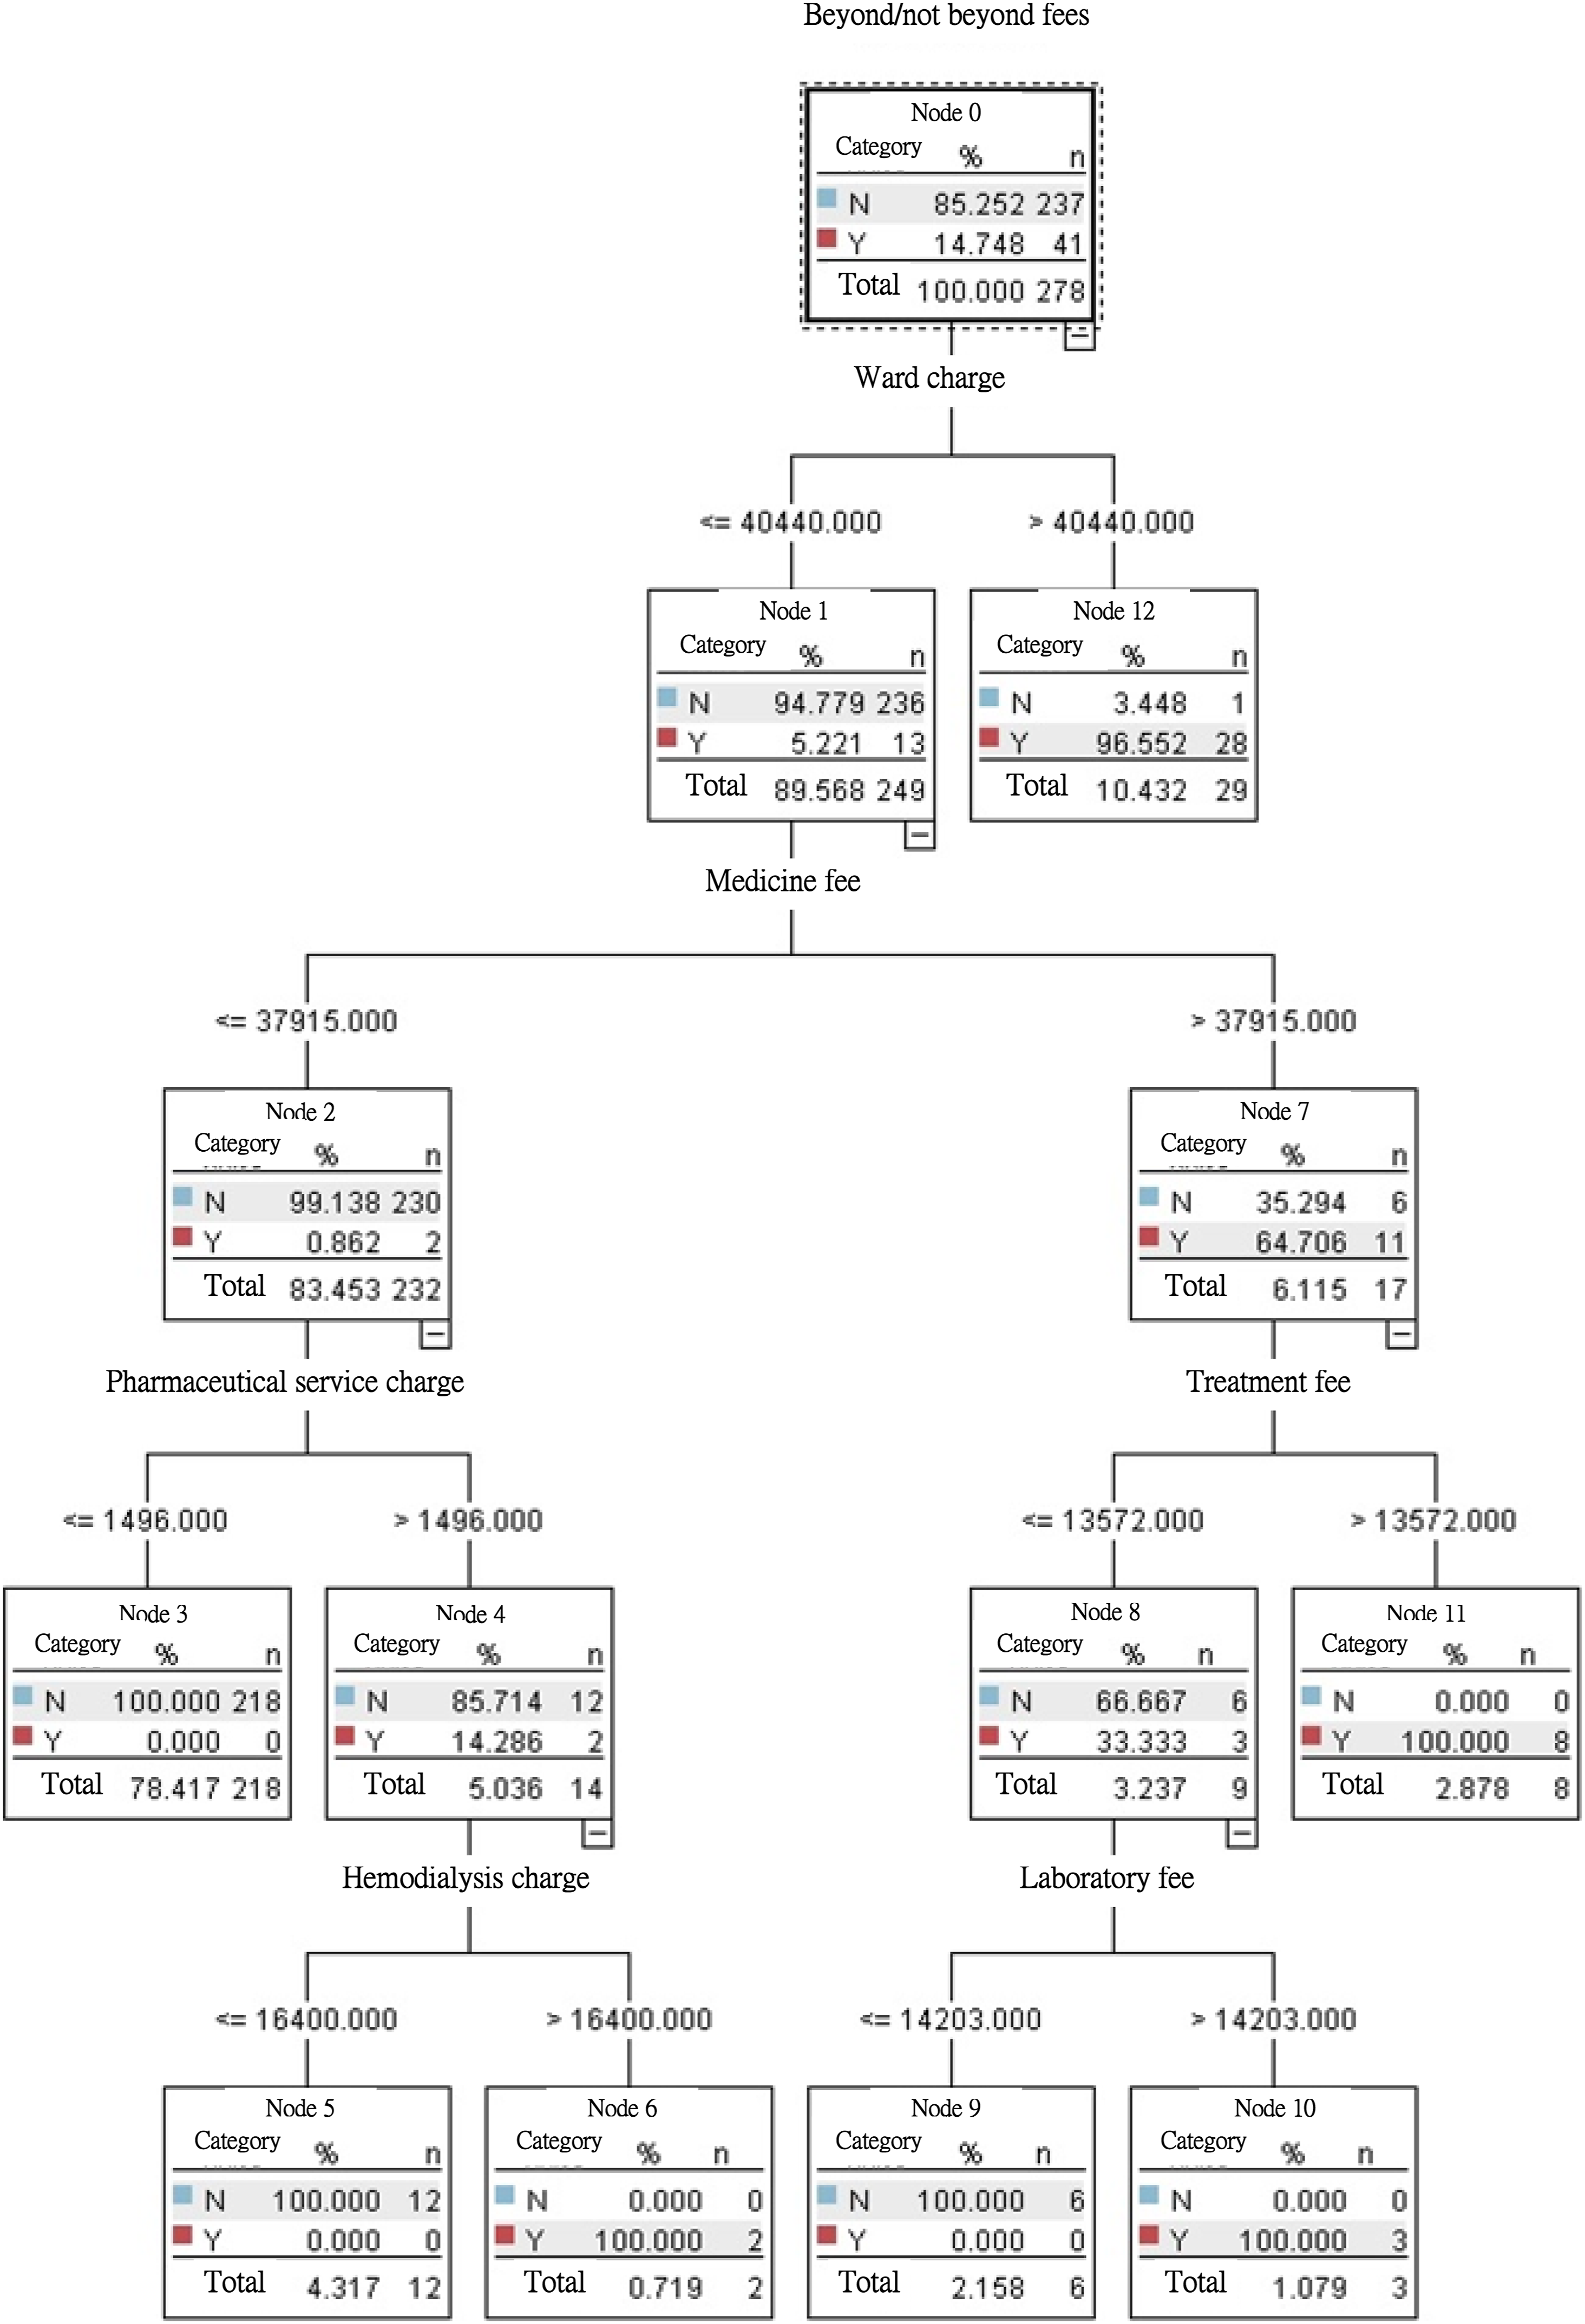
In Node 0, the percentage of samples (N = 278) in which anomalies were found (the application fee exceeded the upper limit) was 14.748% (N = 41), whereas the percentage of non-anomalies in the sample was 85.252% (N = 237). In addition, the first branching was performed by Node 0, which reveals that if the ward charge was less than or equal to NTD 40,440 (Node 1), the proportion of anomalies was only 5.221%; if the ward charge was greater than NTD 40,440 (Node 12), the proportion of anomalies was as high as 96.552%. This result demonstrates that the “ward charge” was the first factor causing anomalies (the application fee exceeded the upper limit).
The second branching was performed by Node 1, and indicates that if the medicine fee was less than or equal to NTD 37,915 (Node 2), the proportion of anomalies was only 0.862%. In addition, if the medicine fee was greater than NTD 37,915 (Node 7), the proportion of anomalies could reach 64.706%, indicating that a medical fee exceeding the upper limit (NTD 37,915) was the second factor causing anomalies.
The third branching was performed by Node 7 (right) and implies that if the treatment fee was less than or equal to NTD 13,572 (Node 8), the proportion of anomalies was 33.333%. In addition, if the treatment fee was greater than NTD 13,572 (node 11), the proportion of anomalies could reach 100%.
The third branching was performed by Node 2 (left), and illustrates that if the pharmaceutical service charge was less than or equal to NTD 1496 (Node 3), the proportion of anomalies was 0.000%. In addition, if the pharmaceutical service fee was greater than NTD 1496 (Node 4), the proportion of anomalies could reach 14.286%.
The fourth branching was performed by Node 8 (right) and shows that if the laboratory fee was less than or equal to NTD 14,203 (Node 9), the proportion of anomalies was 0.000%. In addition, if the laboratory fee was greater than NTD 14,203 (Node 10), the proportion of anomalies could reach 100%.
The fourth branching was performed by Node 4 (left) and indicates that if the hemodialysis charge was less than or equal to NTD 16,400 (Node 5), the proportion of anomalies was 0.000%. In addition, if the hemodialysis charge was greater than NTD 16,400 (Node 6), the proportion of anomalies could reach 100%.
Path analysis of the decision tree
Application fees for anomalies in the path of the decision tree.
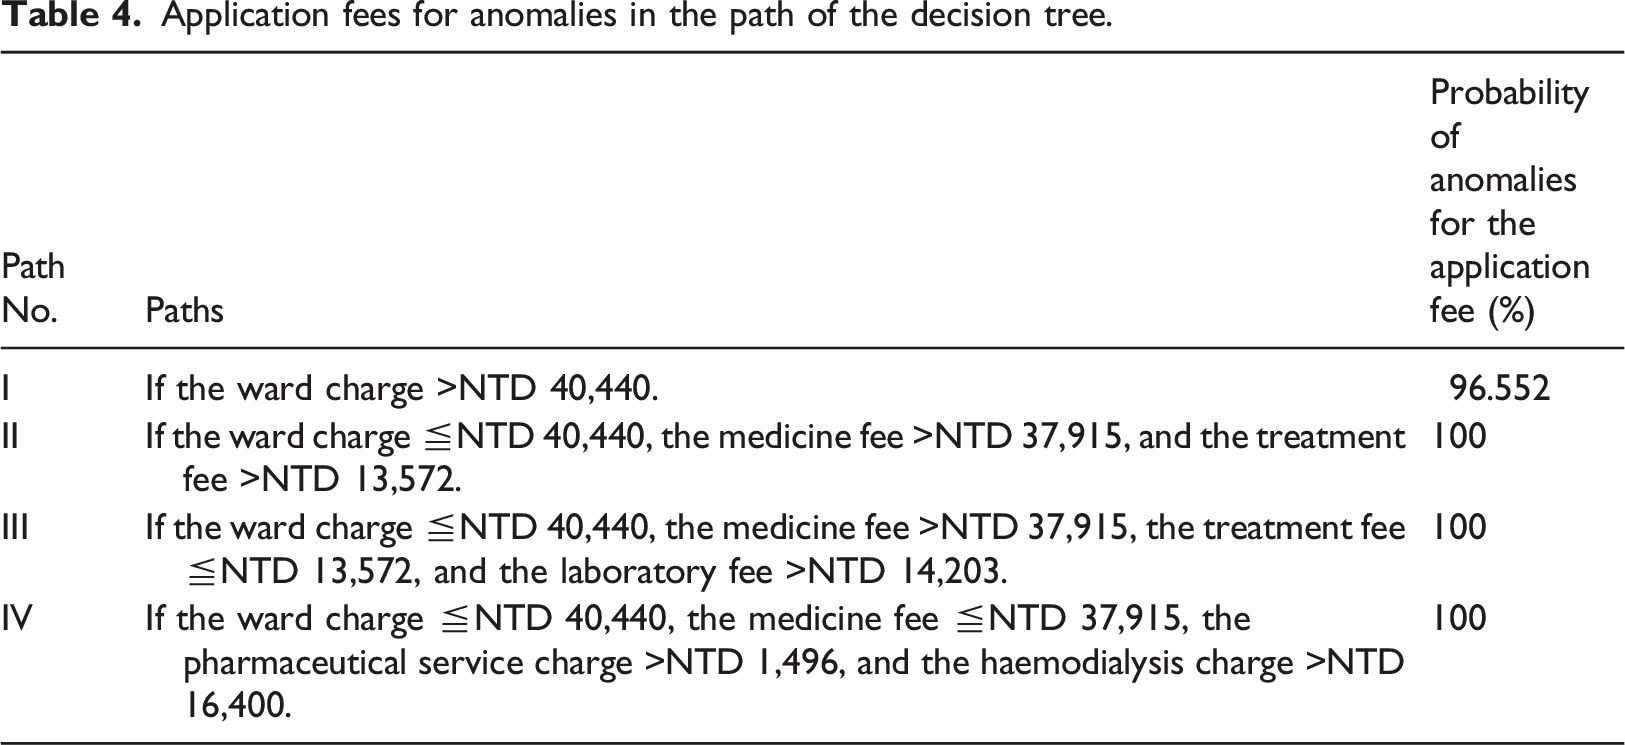
Rules of the application fee anomalies for DRG41601: I. When the ward charge was greater than NTD 40,440, the probability of an application fee anomaly was 96.552%. II. When the ward charge was less than or equal to NTD 40,440, the medicine fee was greater than NTD 37,915, and the treatment fee was greater than NTD 13,572, then the probability of an application fee anomaly was 100%. III. When the ward charge was less than or equal to NTD 40,440, the medicine fee was greater than NTD 37,915, the treatment fee was less than NTD 13,572, and the laboratory fee was greater than NTD 14,203, then the probability of an application fee anomaly was 100%. IV. When the ward charge was less than or equal to NTD 40,440, the medicine fee was less than NTD 37,915, the pharmaceutical service charge was greater than NTD 1496, and the hemodialysis charge was greater than NTD 16,400, then the probability of an application fee anomaly was 100%.
Analysis of differences in sub-application fees among DRG41601 clinics
Based on the results shown in Figure 6, six input variables, namely ward charge, medicine fee, treatment fee, laboratory fee, pharmaceutical service charge, and hemodialysis charge, were found to affect the target variables (application fee anomalies). We further sought to understand whether the impact of the six input variables (subapplication fees) on DRG41601 clinics differed significantly. We employed a one-way analysis of variance (ANOVA) to determine which input variables (subapplication fees) significantly affected anomalies and may form the basis for sustained tracking and improvement.
Analysis of differences in sub-application fees between DRG41601 clinics.
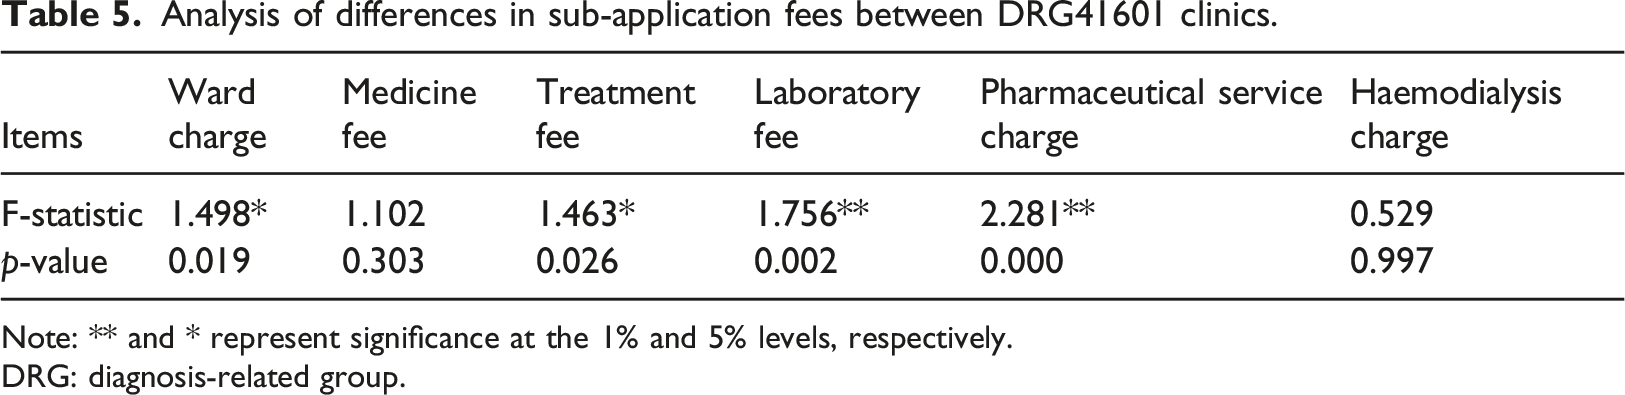
Note: ** and * represent significance at the 1% and 5% levels, respectively.
DRG: diagnosis-related group.
Improve
Organization of important information obtained in the measure and analysis process.
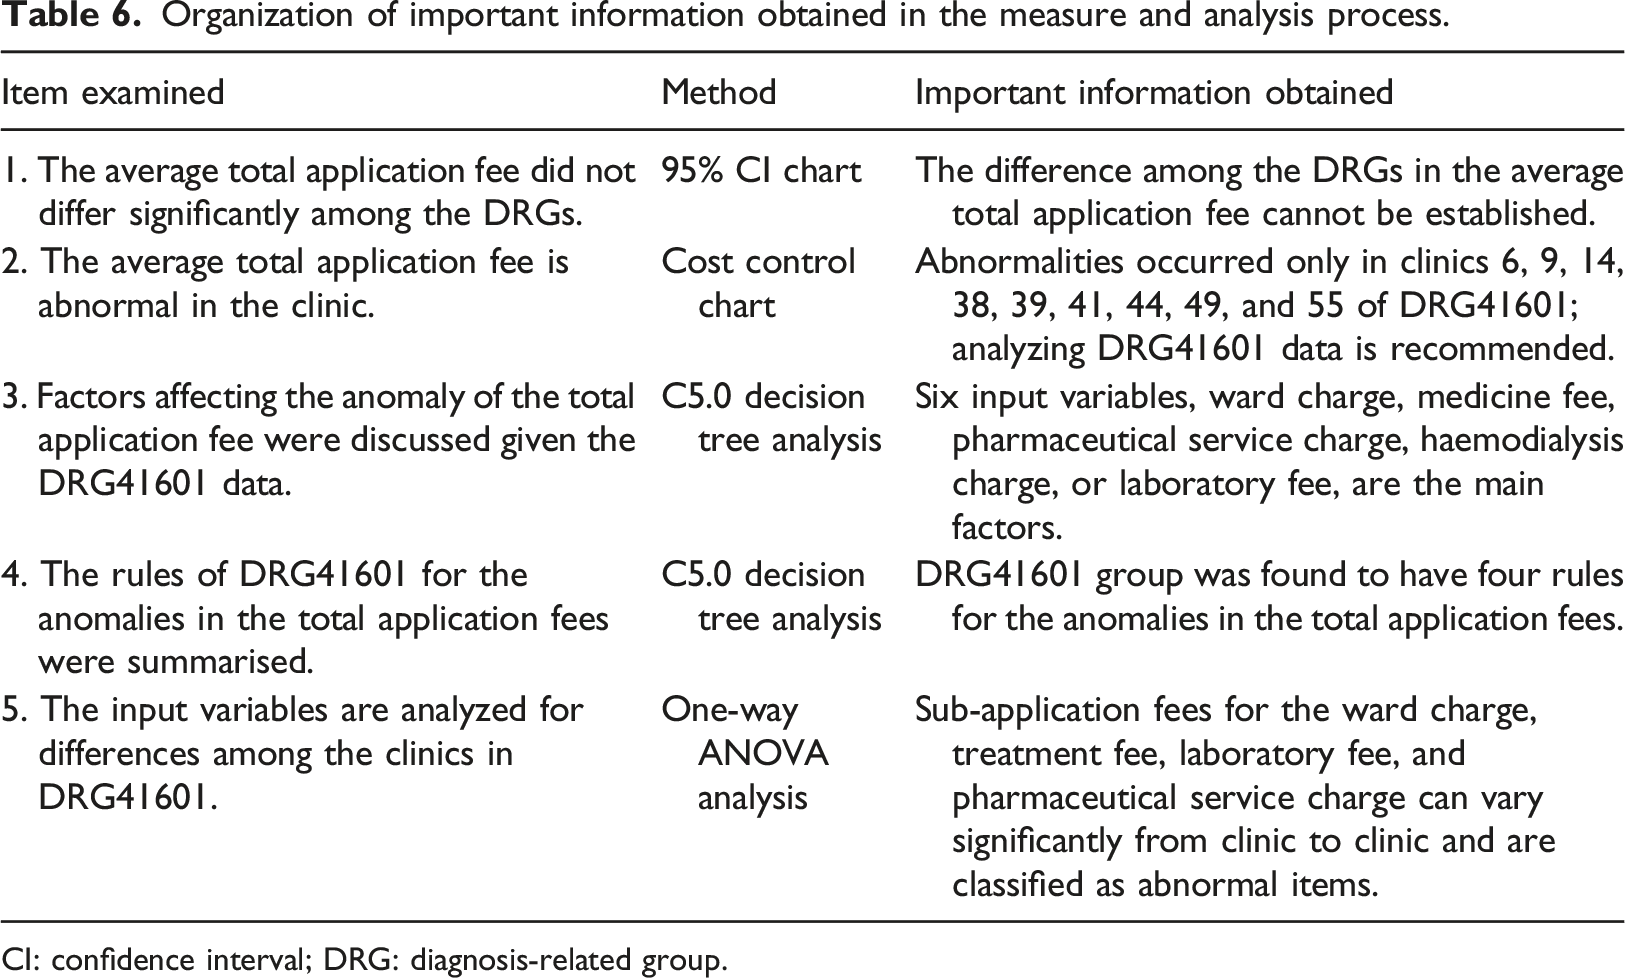
CI: confidence interval; DRG: diagnosis-related group.
Abnormal sub-application fee and the proportion of the total amount of the sub-application fee (%) in DRG41601 clinics.
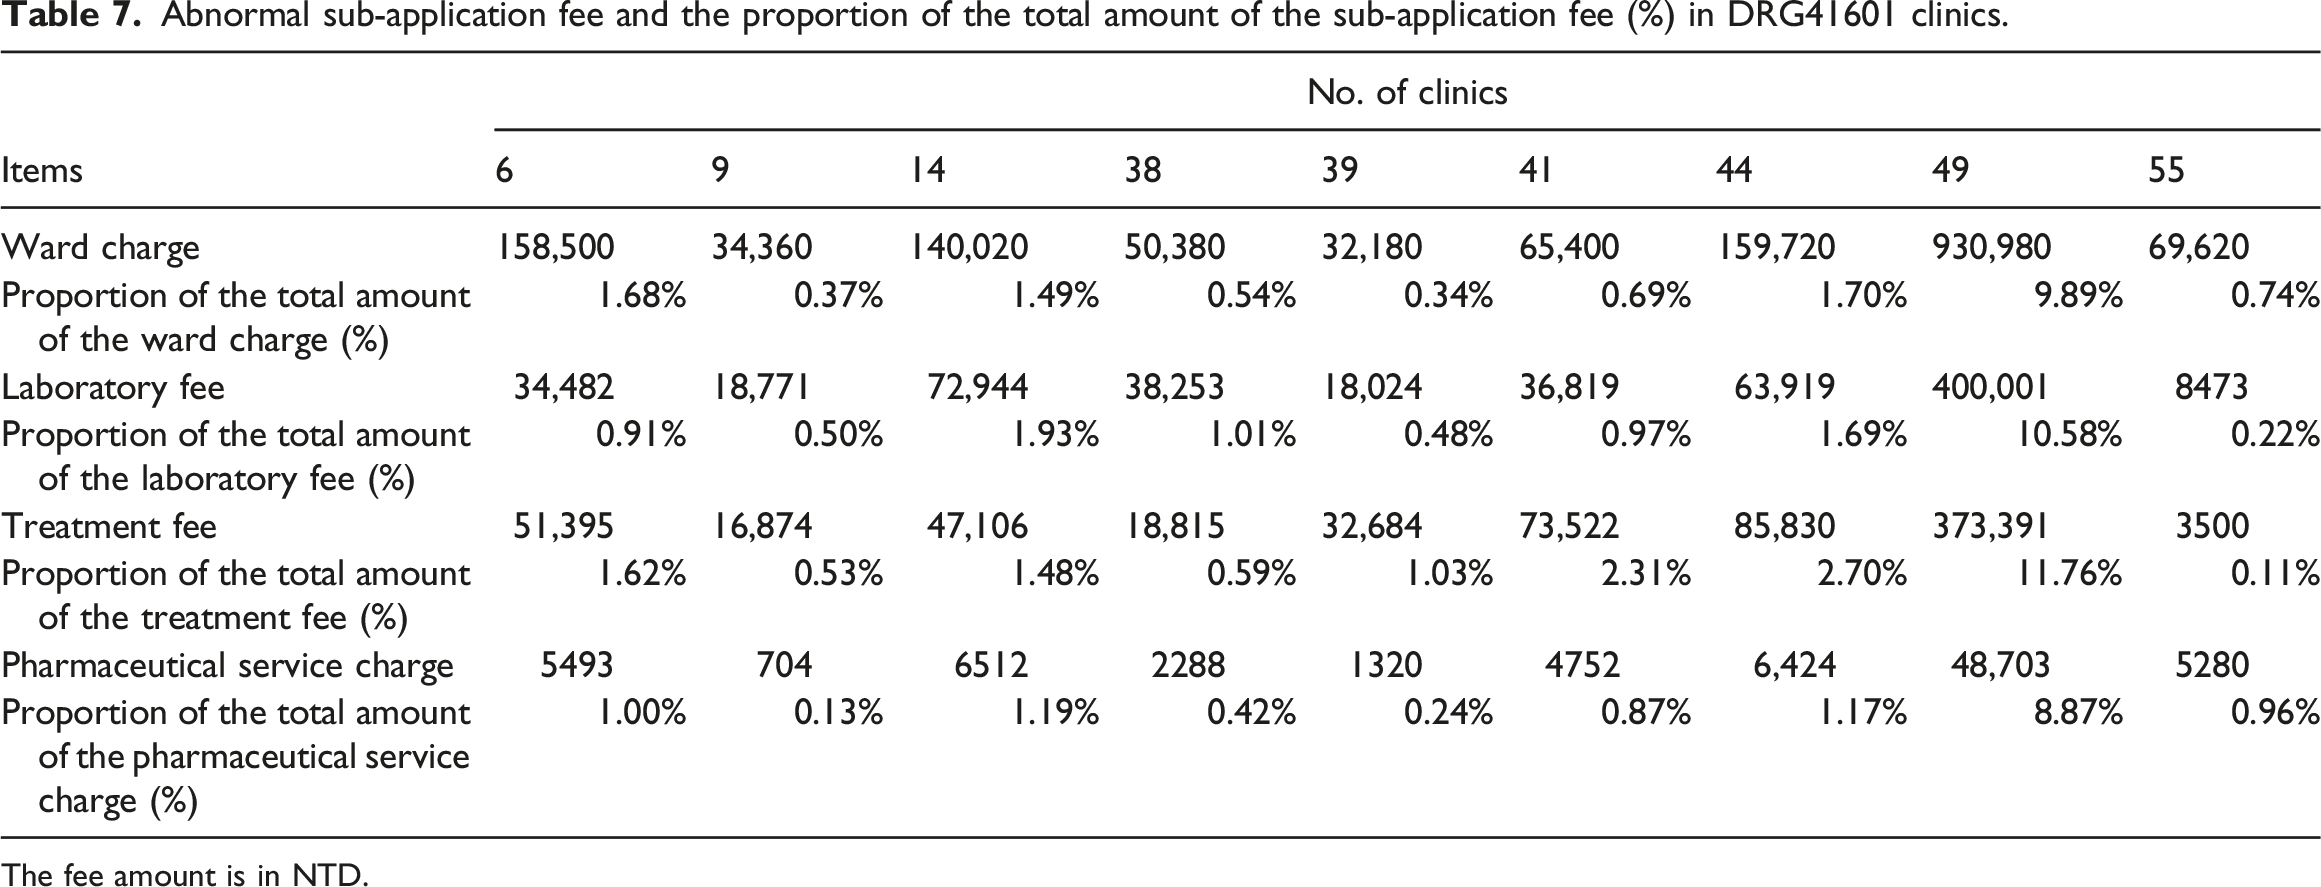
The fee amount is in NTD.
Score sheet of the priority control order for abnormal items on DRG41601.
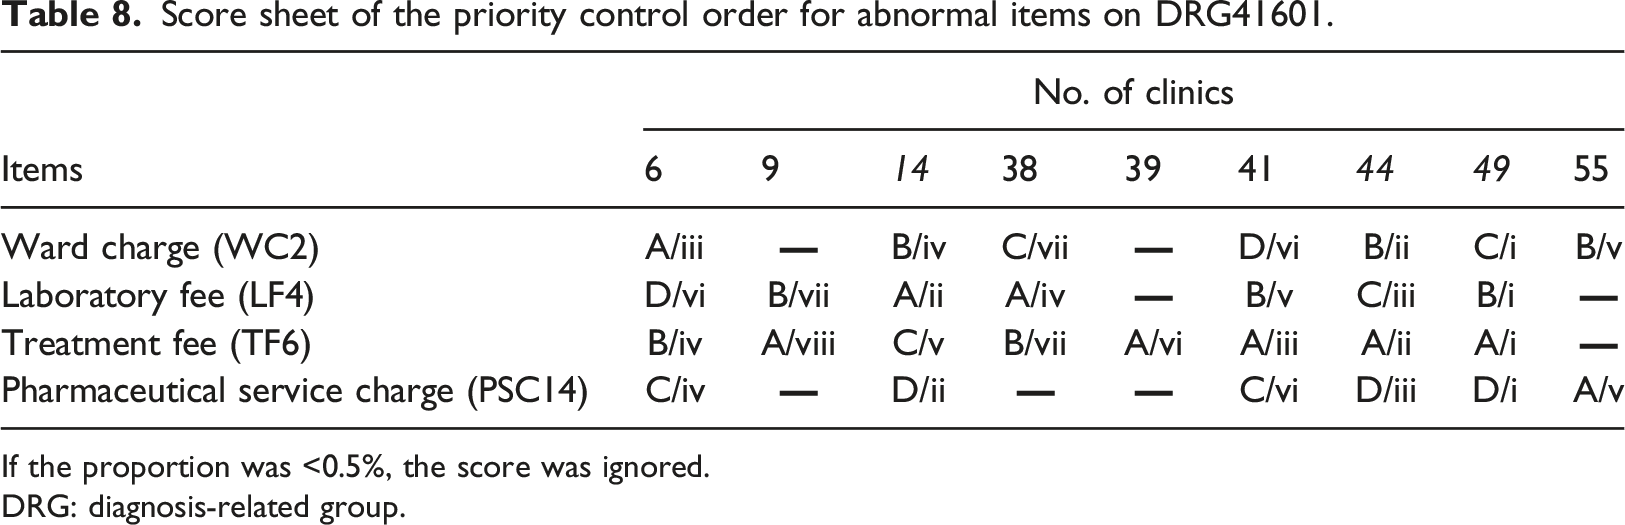
If the proportion was <0.5%, the score was ignored.
DRG: diagnosis-related group.
Table 8 illustrates that the order of improvement among abnormal clinics in DRG41601 is as follows. (1) Clinic 49 had four sub-application fees rated i, indicating that ward charges, laboratory fees, treatment fees, and pharmaceutical service charges are all in urgent need of active improvement and control. (2). Clinic 44 has two ratings of ii and iii, indicating the four sub-application fees require improvement and control. (3) Clinic 14 had two ratings of ii for laboratory fees and pharmaceutical service charges. In addition, the order in which items with abnormal subapplication fees need to be improved is as follows: (1) For the treatment fee, five As and two Bs were obtained, indicating that seven clinics were listed as first- or second-priority improvement items. (2) For the laboratory fee, two As and three Bs were obtained, indicating that five clinics were listed as having the highest or second highest priority for improvement. The scoring results in Table 8 can be used as a reference for DRG41601 to improve abnormal clinics and sub-application fees, and further prioritize the improvement in overspending application fee items to control medical declaration costs.
Control
Control is a plan that builds the key factors of management. Process control is maintained during the operation process, and various control charts are used to ensure that the improved operation process can operate effectively and stably, and achieve continuous improvement. We focused on improving the subapplication fees for anomalies found in DRG41601, in order of treatment fees and laboratory fees, based on the results in Table 8. Based on the description of the control phase in Figure 2, this study proposes specific monitoring schemes for the disposal of medical processes. First, through in-depth interviews with clinic staff and a Cause and Effect Chart, key factor analysis of the treatment fee (Figure 7) and laboratory fee (Figure 8) was conducted. Cause & effect chart based on exorbitant treatment fees. Cause & effect chart based on exorbitant laboratory fees.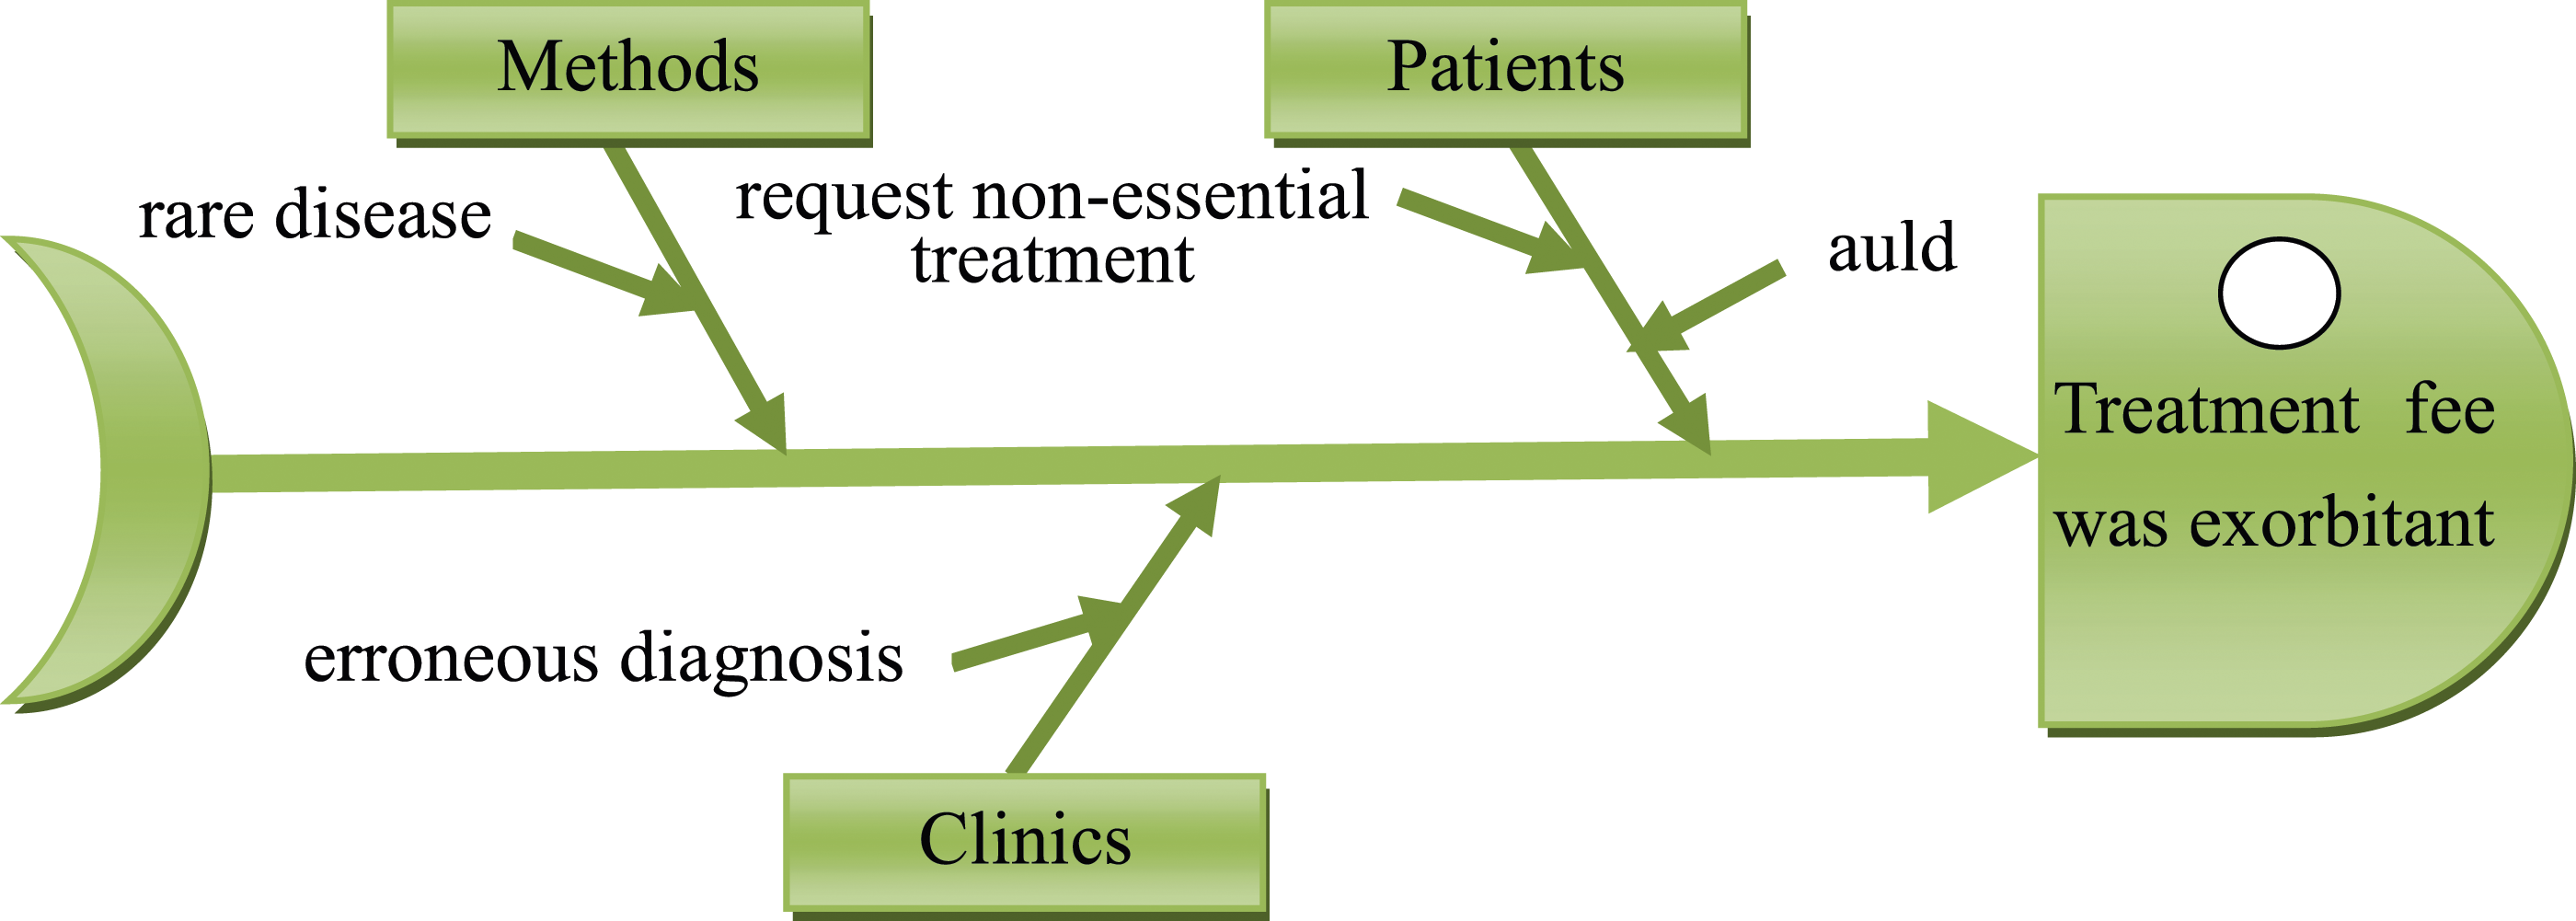
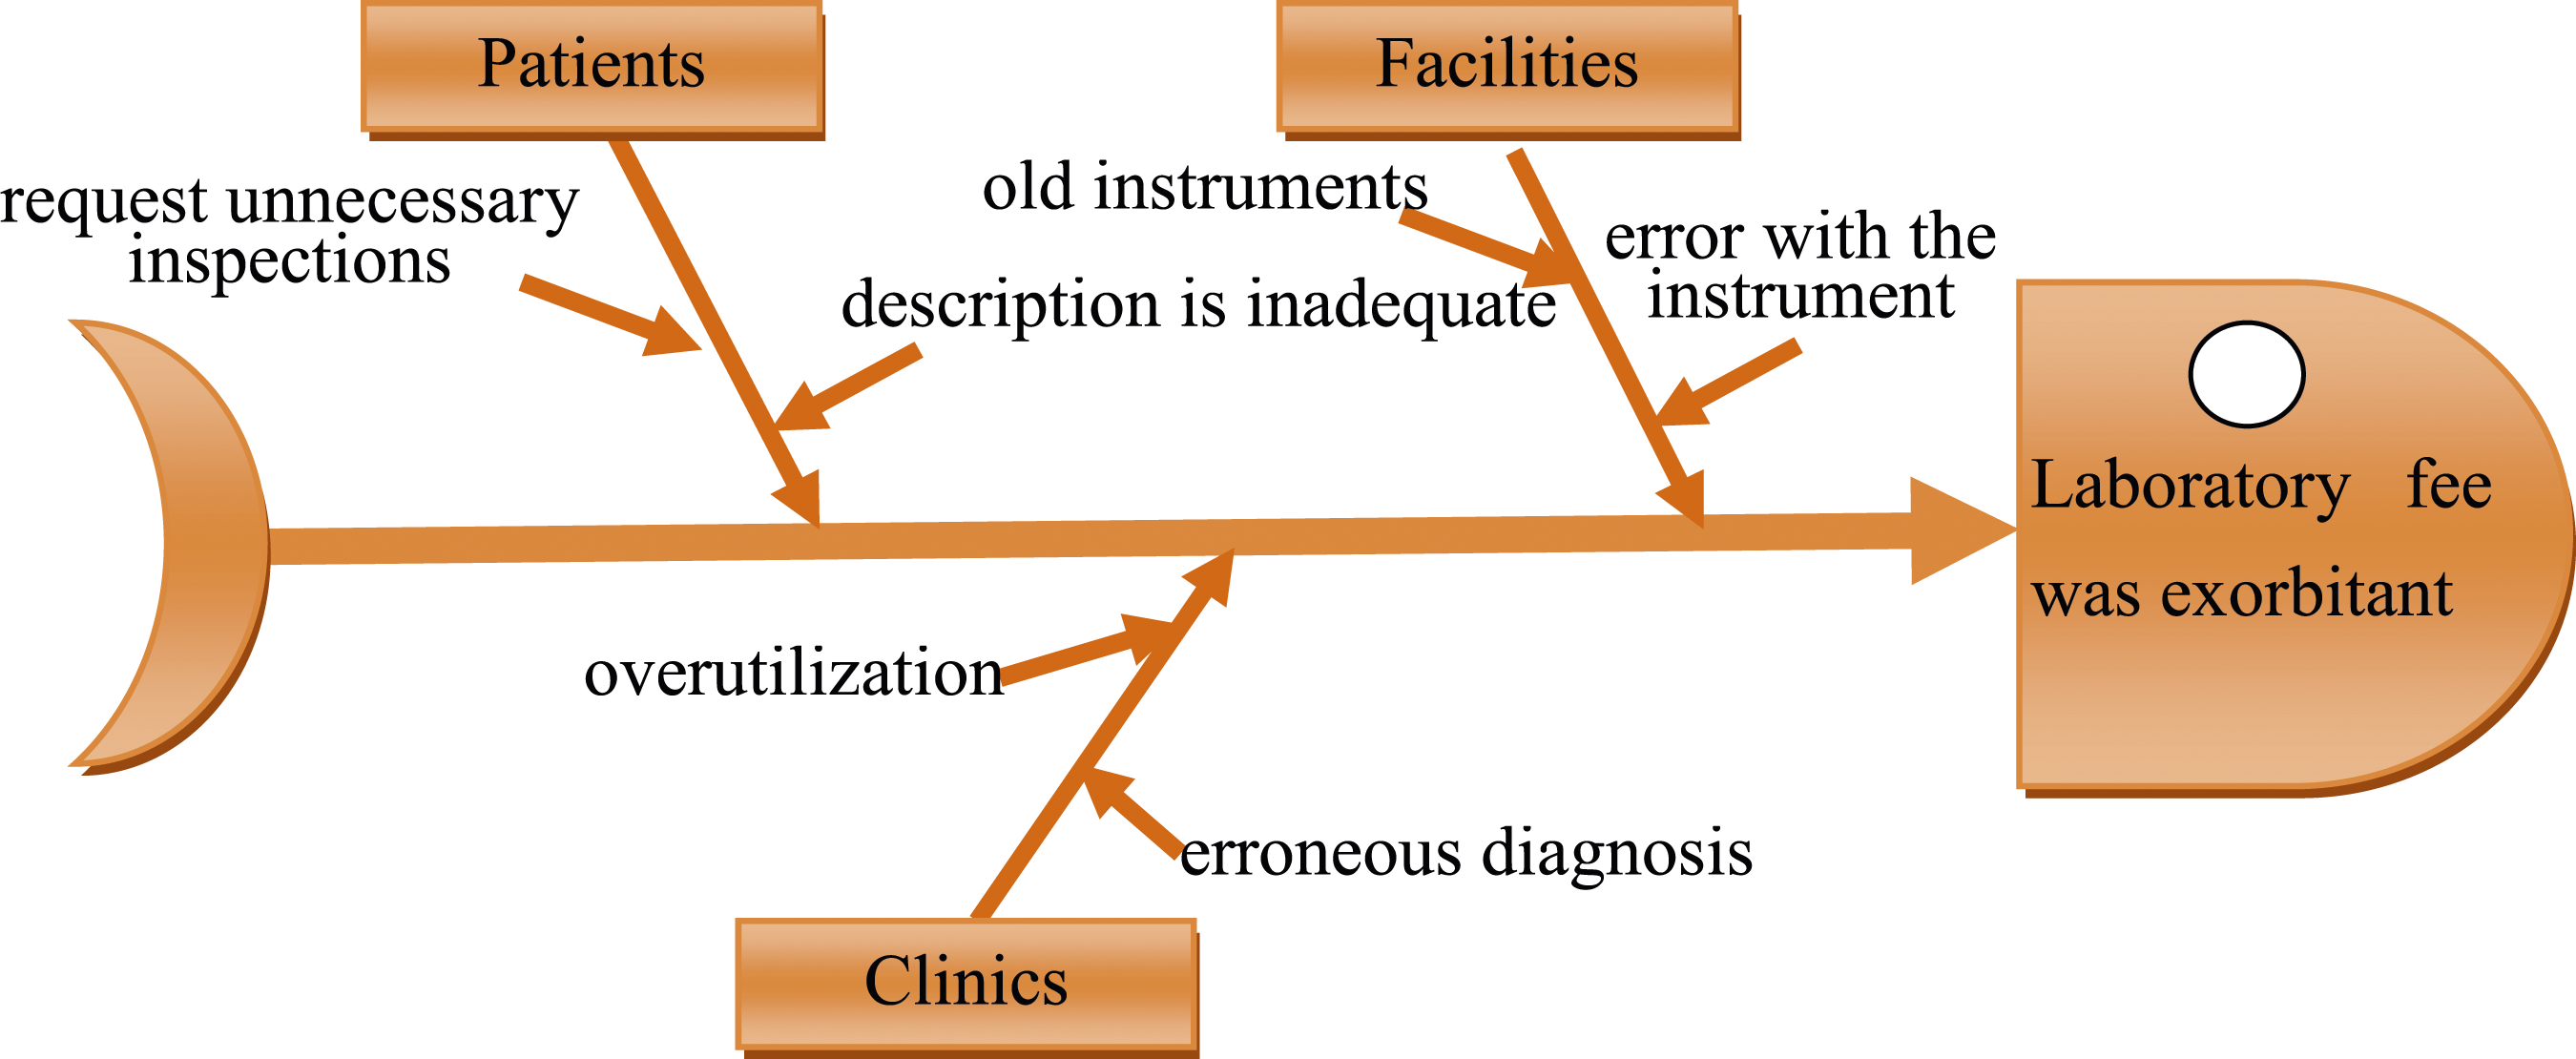
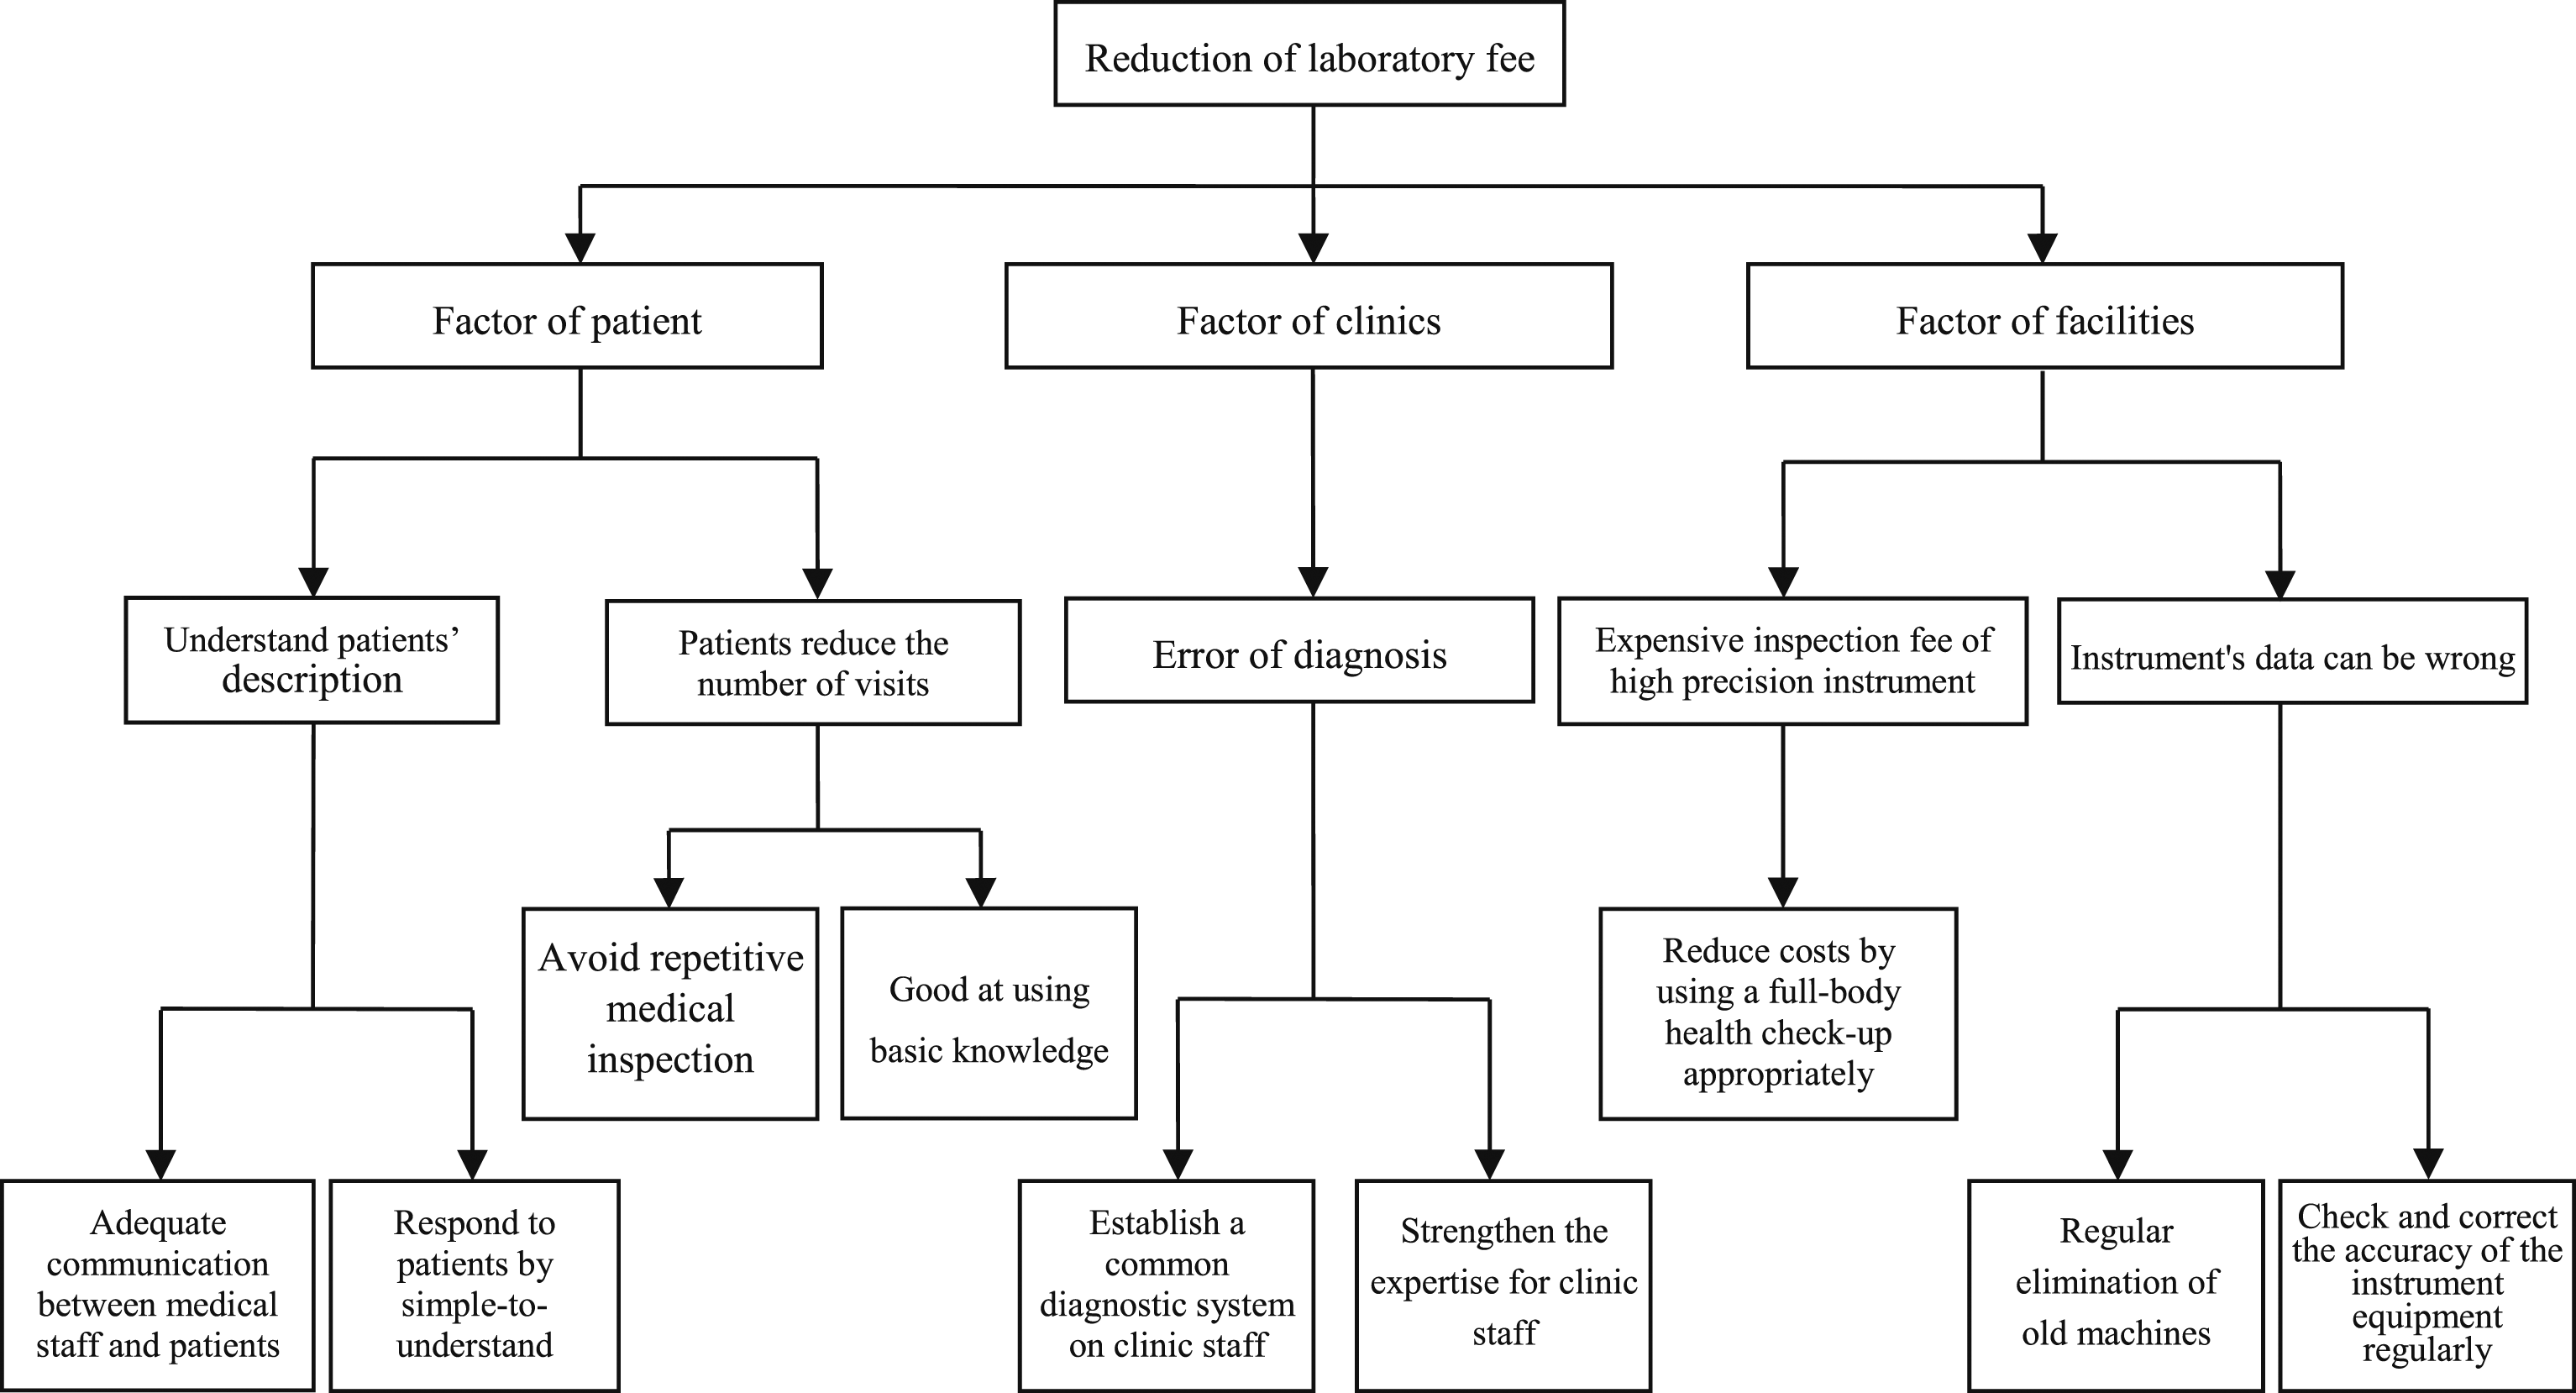
Figures 7 and 8 show the treatment and laboratory fees’ Cause and Effect Analysis. Further use of a system diagram to provide countermeasures for the improvement of key factors (Figures 9 and 10), that is, treatment fees and laboratory fees, were specifically standardized. This approach is expected to reduce medical costs and improve the efficiency of medical care in clinics. Countermeasure figure of the treatment fee. Countermeasure figure of the laboratory fee.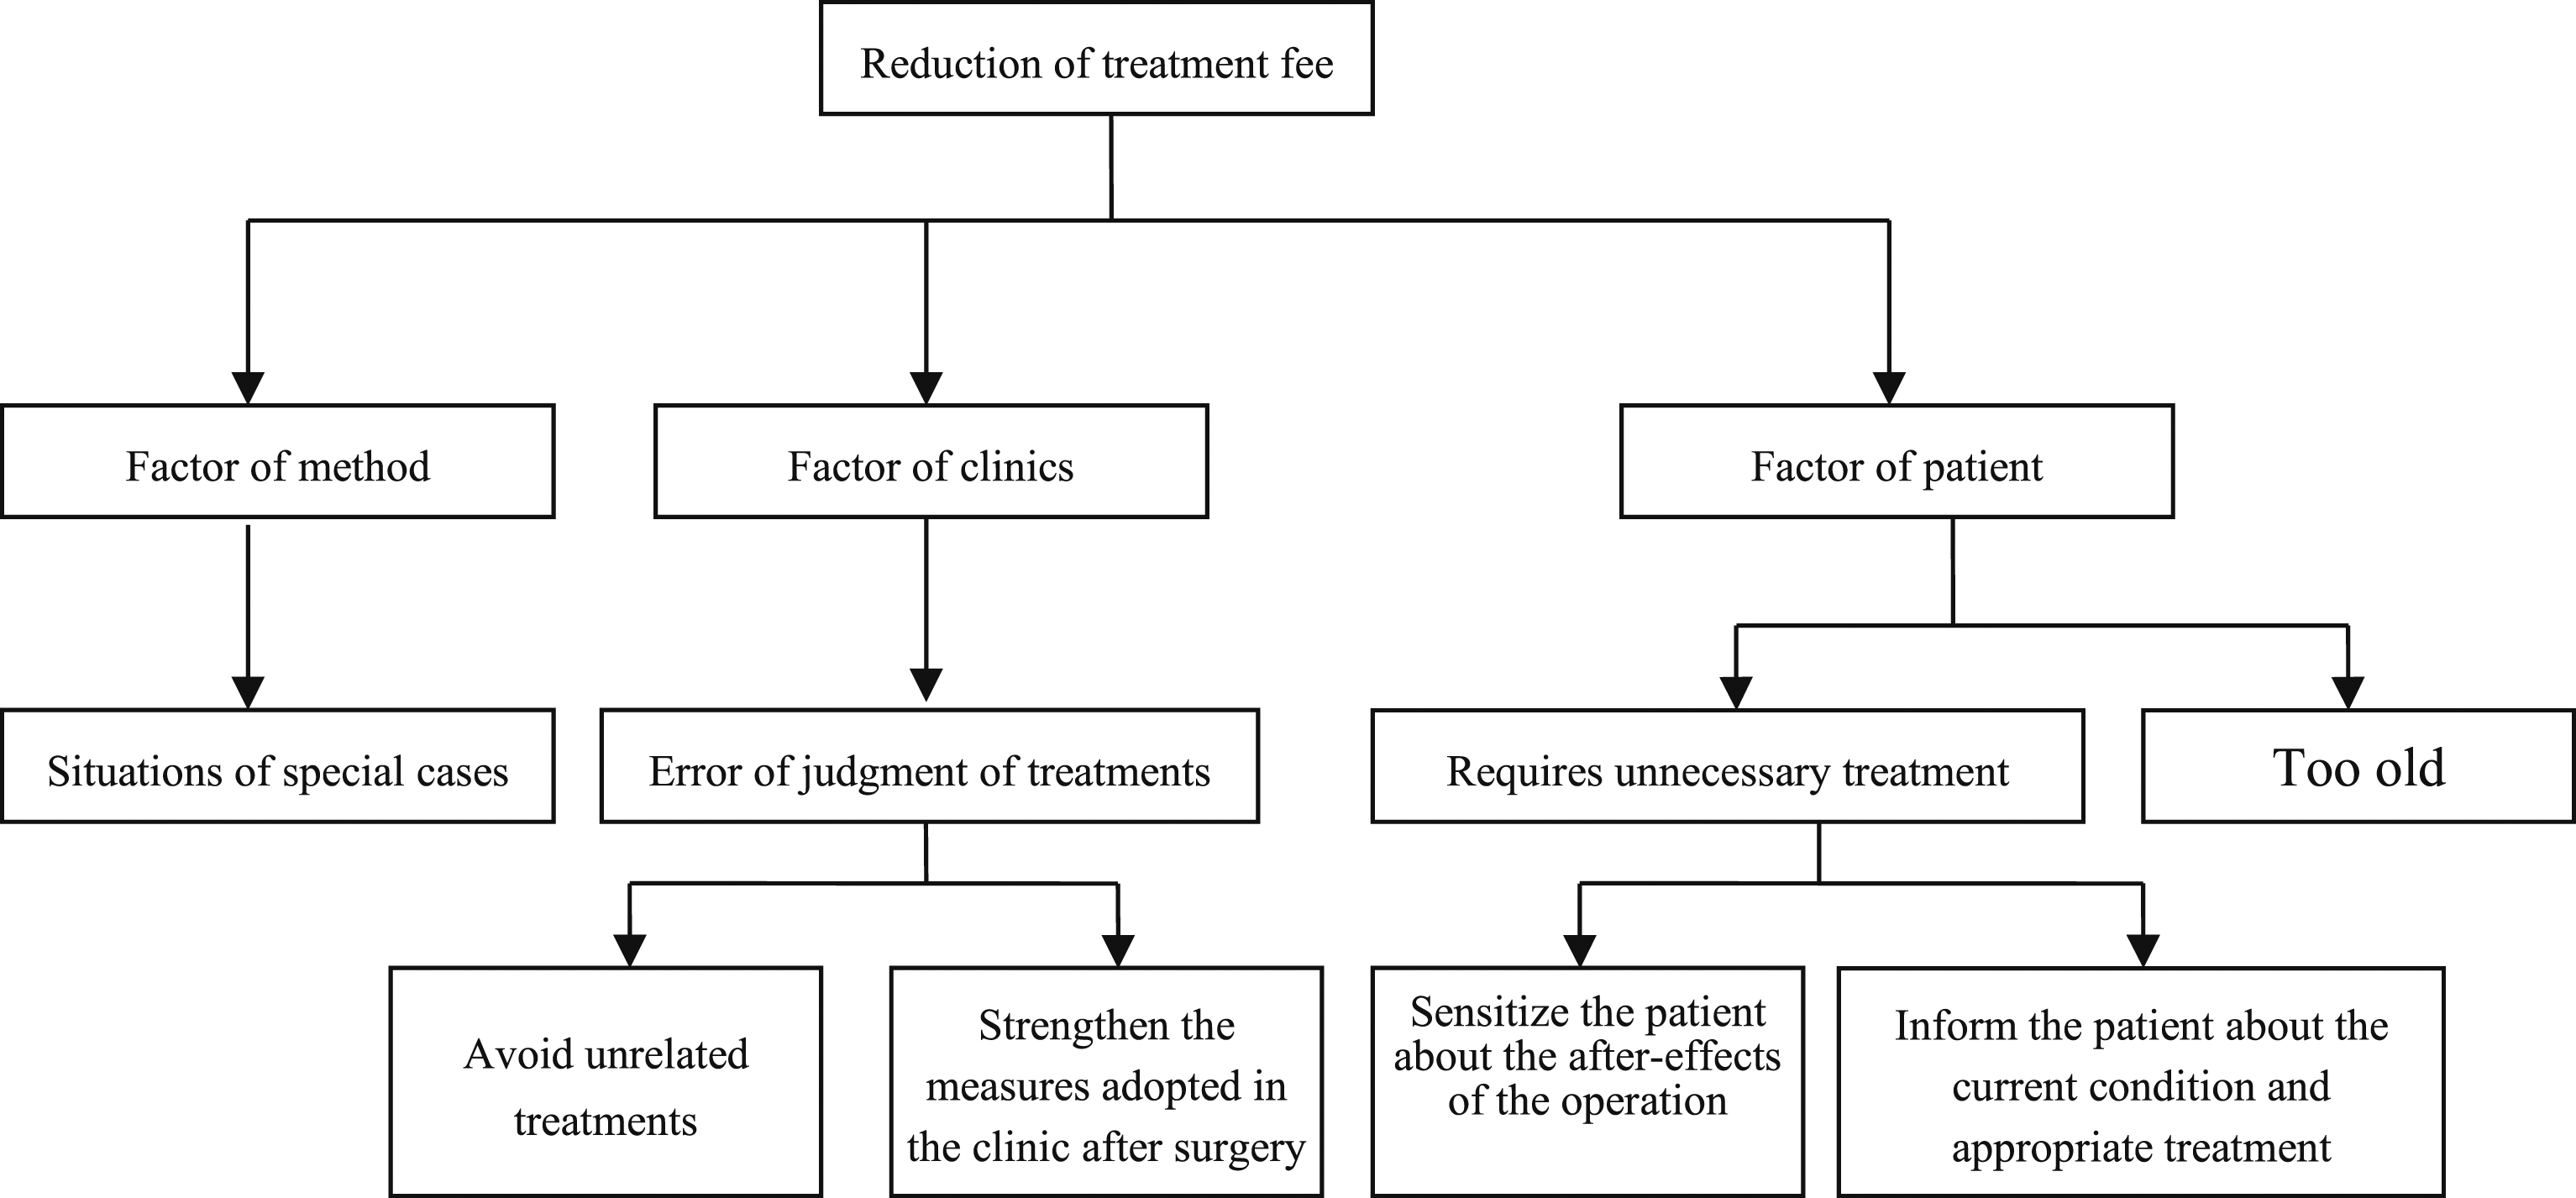
Countermeasure figure of the treatment fee
Figure 9 classifies the improvement of treatment fees according to various factors, such as methods, clinics, and patients. According to the guidelines of this countermeasure figure, training courses in the clinic can be strengthened, and the number of errors in disposal can be reduced. Promoting basic knowledge of drugs and surgery in the public can reduce unnecessary problems and solve patient concerns.
Countermeasure figure of laboratory fee
Figure 10 classifies the improvement of laboratory fees according to facility, clinic, and patient factors. According to the guidelines of this countermeasure figure, strengthening training courses in clinics can reduce the number of misdiagnoses. The number of misdiagnoses and errors can be reduced by reducing equipment and facility abuse and regular checking of instruments. Timely promotion of the basics of care can reduce unnecessary examinations and the wastage of medical resources.
Discussion and conclusions
Discussion
Based on the above empirical analysis and results, further discussion and suggestions are necessary. First, we used quality control charts to manage the cost of application fees for public healthcare in Taiwan’s NHI and used the improved analysis method of the DMAIC process to explore the problem of application fees exceeding the upper limit to reduce the overuse of medical resources. The analytical model used in this study can be expanded to the DRGs of other diseases in the future and can help effectively control unreasonable medical application costs. For example, the top 10 diseases covered by health insurance include chronic kidney disease, type 2 diabetes, gingivitis, periodontal disease, dental caries, hypertension, antitumor treatments, respiratory failure, and chronic ischemic heart disease. More than NTD 150 billion in payouts are spent annually on these diseases. Simultaneously, a broader approach to data mining could be considered to address inefficiencies in the use of different medical resources in conjunction with the promotion of the correct use of medical resources among medical personnel and patients, so that the financial stress of the NHI fund may be alleviated.
Second, the DMAIC method was used to analyze the abnormal medical expenses of health insurance payments (over a 95% confidence level), and statistical testing, cost control charts, and decision trees were used in the evaluation process to further identify abnormal items of medical expense payments. However, owing to local laws and the health insurance application system, the verification data for this study were limited to the Health Insurance Bureau database. This is an offline and historical data-tracking management research report. In the future, online and real-time remote monitoring technology, artificial intelligence, and other digital innovations should be adopted as permitted by Taiwan’s laws. Simultaneously, zero-shot learning techniques can be used to address the limited training concerns of small samples in the algorithm to increase the prediction ability of the outsample. An attempt will be made to establish a financial information system and software for the online and real-time effective application of a health insurance benefit decision guidance system. This technology does not focus on the review and management of post-write-off expenses for study cases, but in the reimbursement system of intelligent medical insurance expenses that are more extensive, real-time, and rewarding.
Conclusions
In this study, we applied the DMAIC procedure as a means to improve medical application fees, using the “sepsis” data of a certain hospital in Taiwan as a case study. It mainly employed statistical tests and cost control charts for application fees combined with C5.0 decision tree excavation to determine abnormal application fees (over 95% confidence level) and factors thereof. We then reviewed and proposed specific practices and recommendations for improvement. This study extended the application of the concept of quality management control charts to medical application fees and integrated a C5.0 decision tree from data mining into the DMAIC process. This provides a possible method to address and improve the overuse of health resources, which can be replicated in the future as a mechanism to ease the financial pressures on the NHI’s fund.
This study found that abnormalities in application fees for adults (age ≧18 years old) with comorbidities or complications was over the 95% confidence level in one of the four DRGs and nine clinics, with the average application fees exceeding the upper limit. The application fees for all the clinics in the remaining three DRGs did not exceed the 95% confidence level (non-abnormalities). Therefore, we created a cost control chart for the abnormal DRG and found nine clinics where the application fees abnormally exceeded the upper limit (over a 95% confidence level). Based on the classification results of the C5.0 decision tree, we concluded that six items of sub-application fees and four rules of mining were the factors that affected the average application fee anomalies. Second, using a one-way ANOVA at a 5% level of significance, we found that there were significant differences between the four sub-items, ward charge, treatment fee, laboratory fee, and pharmaceutical service charge, which needed to be further managed and improved. The priority control order for abnormal clinics and subapplication fees was followed by a two-dimensional scoring rule. We recommend that the clinics listed in the abnormal DRG (DRG41601) be listed for improvement or control in the order of Clinics 49, 44, and 14. Furthermore, the sub-application fees listed as managed were treatment and laboratory fees. These results serve as a reference for improving clinical abnormalities and subapplication fees. Finally, a countermeasure analysis was performed on subapplication fees, focused on improvements such as treatment fees and laboratory fees as a control and mitigation mechanism for the inefficient use of medical resources, thus reducing unnecessary wastage of medical resources.
Footnotes
Acknowledgements
The authors thank Mr. Li-Wei Chen for his assistance in this study.
Author contributions
Yen-Chang CHEN and Ying-Sing LIU designed the study, analyzed the data, and wrote the manuscript. Shui-Chuan CHEN contributed to the study supervision and project administration. Yen-Chang CHEN was responsible for collecting and collating data. The authors read and approved the final manuscript.
Declaration of conflicting interests
The author(s) declared no potential conflicts of interest with respect to the research, authorship, and/or publication of this article.
Funding
The author(s) received no financial support for the research, authorship, and/or publication of this article.