
Abstract
Objectives
This study is designed to analyze the potential influencing factors of hyperlipidemia, and to explore the relationship between liver function indicators such as gamma-glutamyltransferase (GGT) and hyperlipidemia.
Methods
Data were derived from 7599 outpatients who visited the Department of Endocrinology of the First Hospital of Jilin University (2017–2019). A multinomial regression model is used to identify related factors of hyperlipidemia and the decision tree method is used to explore the general rules in hyperlipidemia patients and non-hyperlipidemia patients on these factors.
Results
The average of age, body mass index (BMI), systolic blood pressure (SBP), diastolic blood pressure, aspartate aminotransferase, alanine aminotransferase (ALT), GGT and glycosylated hemoglobin (HbA1c) in the hyperlipidemia group are higher than those in the non-hyperlipidemia group. In multiple regression analysis, SBP, BMI, fasting plasma glucose, 2-h postprandial blood glucose, HbA1c, ALT, GGT are associated with triglyceride. For people with HbA1c less than 6.0%, controlling GGT within 30 IU/L reduces the prevalence of hypertriglyceridemia by 4%, and for people with metabolic syndrome with impaired glucose tolerance controlling GGT within 20 IU/L reduces the prevalence of hypertriglyceridemia by 11%.
Conclusions
Even when GGT is in the normal range, the prevalence of hypertriglyceridemia increases with its gradual increase. Controlling GGT in people with normoglycemia and impaired glucose tolerance can reduce the risk of hyperlipidemia.
Introduction
With the changes of people's lifestyle, the incidence of hyperlipidemia is increasing year by year. Hyperlipidemia is a major risk factor for cardiovascular and cerebrovascular diseases,1,2 type 2 diabetes, 3 obesity, 4 some cancers, 5 etc. It can increase the risk of all-cause death from cardiovascular diseases by 1.7–8.2 times,6,7 and a 10% reduction in serum cholesterol level can reduce the risk of cardiovascular diseases by 40% at the age of 50. 8 Therefore, it is particularly important to identify the indexes related to blood lipid and pay attention to the changes of the indexes.
Hyperlipidemia is mainly affected by diet, exercise, genetics, smoking, blood glucose, hypertension, obesity, chronic kidney disease, hyperuricemia, 9 fatty liver and other factors. Among them, high-fat diet, 10 lack of exercise, obesity, type 2 diabetes are the main risk factors. The effects of high-fat diet, 10 obesity11,12 and blood glucose 13 on the risk of hyperlipidemia are relatively clear. In addition to the above risk factors, Suhad M's study suggests that elevated liver transaminase is not only closely related to type 2 diabetes, but also a risk factor for hyperlipidemia. 14 Alanine aminotransferase (ALT), aspartate aminotransferase (AST) and γ-GGT are often used as indicators of liver damage. Gamma-glutamyltransferase (GGT) exists in the epithelial cells of the liver and biliary tract and participates in the degradation of the extracellular antioxidant glutathione, 15 and is also considered as a marker of oxidative stress. 16 A growing body of evidence suggests that GGT levels are closely associated with stroke, 17 atherosclerotic cardiovascular disease,18–20 type 2 diabetes 21 and obesity. 22 Kazuhiko Kotani, Tang and Yuli et al. prove that GGT is closely associated with lipid metabolism, and GGT is significantly correlated with triglyceride and high-density lipoprotein.23–25 However, some studies have not been clear about the correlation between GGT and blood lipid. Different studies have different conclusions on the relationship between GGT and blood lipid, which may be caused by regional differences or the limited number of people included in the study.
This study incorporates the laboratory testing data of over 7000 outpatients for cross-sectional analysis, the objectives of this study are to identify the related factors of hyperlipidemia and to explore the influence of GGT and other liver function indicators on the prevalence of hyperlipidemia. This study also attempt to discuss the control goals needed to prevent hyperlipidemia.
Methods
Data sources
Data were obtained from 7599 outpatients who visited the Department of Endocrinology of the First Hospital of Jilin University (2017–2019). Basic information of the patients such as height and weight were collected through questionnaires, and blood samples were collected to obtain biochemical indicators and glycosylated hemoglobin (HbA1c).
Data cleaning
Due to a large number of missing values and outliers in the original data set, the data set is cleaned first to ensure the effectiveness and robustness of the subsequent analysis. For missing values, we delete the samples missing key factors, so as to obtain a relatively complete sample set. Outliers are those points that are far away from high-density groups in the sample space. From the perspective of statistics, if there are only a few sparsely distributed samples in a certain region in the sample space, it means that the probability of data falling in this region is very low in reality. Moreover, the proportion of such data in the whole data set is too small to be universal, so it is not within the scope of this study. The isolated forest method 26 is used to detect outliers.
The idea of isolated forest is to use a random hyperplane to cut the data space in two, then use a random hyperplane to cut each subspace, and perform the above steps recursively until there is only one data point in each subspace. Since outliers are usually far from high-density groups in the data space, these outliers are quickly divided into a separate subspace, while non-outliers require more cuts. In this way, outliers can be quickly distinguished. Isolated forest method can be roughly divided into two stages: (i) Construct t isolated trees in the form of binary trees to form isolated forest; (ii) Calculate the average height of every sample point in each tree, and calculate the score of abnormality.
To ensure that the outliers in each feature dimension can be fully detected, we choose to combine the features in pairs (age-BMI, SBP-Cre, ALT-AST, GGT-HbA1c) to construct four two-dimensional data spaces. In one two-dimensional space, we use random forest method to identify the outliers and delete the samples containing the outliers. Then the remaining data is detected and processed in the data space composed of the other two features until all the features are filtered.
The construction process of an isolated tree is described as follows: Randomly select
After the isolated forest is constructed, it can be used to evaluate the anomaly degree of each sample point in the data space. The calculation formula is:


The schematic diagram of random forest anomaly detection is shown in Figure 1. The overall processing flow of the data set is shown in Figure 2.

Outlier detection. Isolated forest acts on the two-dimensional data space composed of age-BMI, VSP-Cre, etc. The red points are scattered outside the green cluster and are the abnormal points identified by isolated forest.
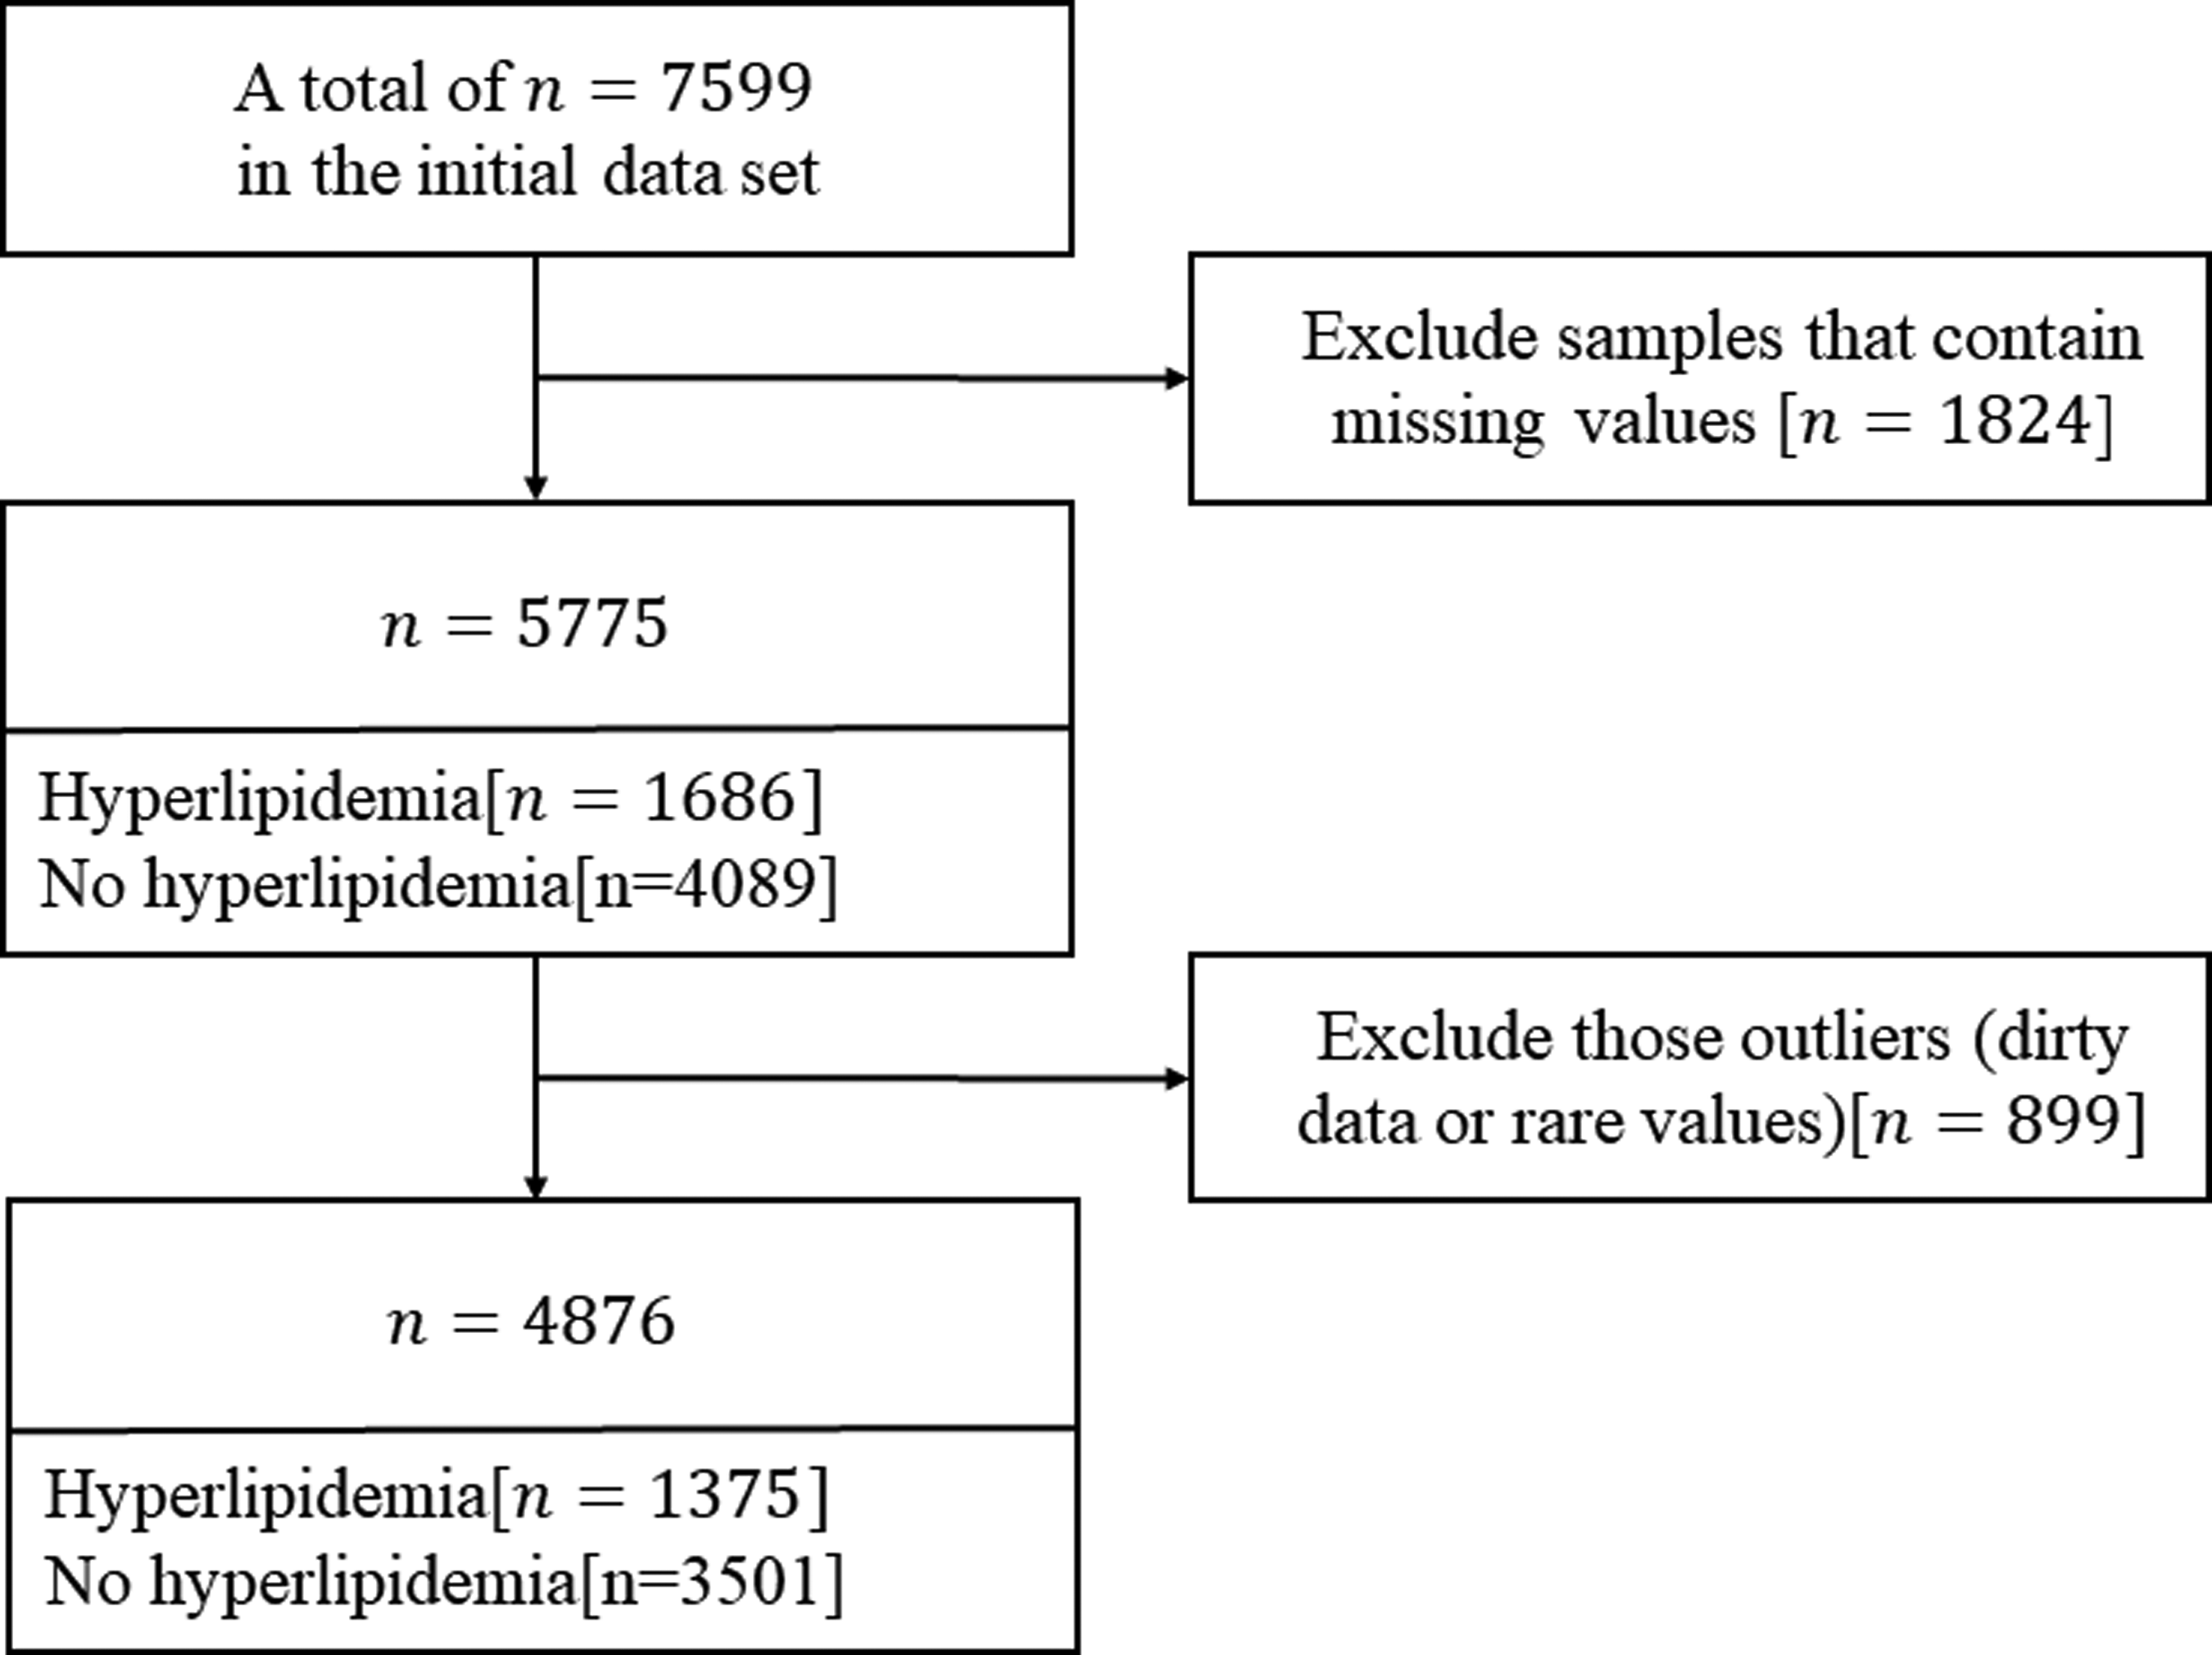
Flowchart of study population.
Decision tree
Since the prevalence of hypertriglyceridemia is the highest in the study population, and the relationship between hypertriglyceridemia and GGT and HbA1c is stronger, we explore the general rules of the above indicators in the non-hypertriglyceridemia population and try to give advice on maintaining health. We use the binary classification method of decision tree 27 to extract different rules of the two types of samples, and then screen and artificially modify the extracted rules to find the general rules of the non-hyperlipidemia population.
Decision tree is a common classification and regression method with tree structure. The classification process can be regarded as a set of if-then rules. Each node of the tree is a judgment condition, and the classification process is equivalent to starting from the root node of the tree model and judging at every node on the path until reaching the leaf node, that is, the classification process is completed. The judgment conditions on the path are combined to form a rule. Compared with the black-box characteristic of deep learning models such as neural networks, decision tree algorithm is still commonly used in medical, financial and other fields requiring high interpretability.
The decision tree generation process mainly includes the following two steps: (i) Feature selection: select one from the feature set as the split criterion for the current node, and there are multiple evaluation criteria for feature selection; (ii) Decision tree construction: according to the selected feature evaluation criteria, recursively generate child-nodes from top to bottom until the data set is inseparable.
The C4.5 algorithm is used here.
28
The algorithm uses the information gain rate as the feature selection criterion. The information gain rate is defined as:


Results
Study population
Of the remaining 4876 samples, 1375 (Figure 2) has hyperlipidemia with a prevalence of 28.2%, of which the prevalence rate of hypertriglyceridemia is the highest (20.8%). There is no statistical significance between the hyperlipidemia group and the non-hyperlipidemia group in terms of gender (P > 0.05) (Table 1). Compared with the non-hyperlipidemia group, the hyperlipidemia group has higher body mass index (BMI), systolic blood pressure (SBP), diastolic blood pressure (DBP), fasting plasma glucose (FPG), 2-h postprandial blood glucose (2hPG), ALT, AST, GGT, and the difference between the two groups in these indicators is statistically significant (P < 0.05). In the GGT quintile, 29 BMI, SBP, DBP, triglyceride (TG), and total cholesterol (TC) increased from the lowest quintile to the highest quintile, and high-density lipoprotein (HDL) showed an overall downward trend (Table 2). The higher the GGT, the higher the FPG and 2hPG, which is statistically significant (P < 0.05).
Baseline characteristics of the study population.

Data for continuous variables are expressed as mean ± standard deviation or mean (quartile range), and categorical variables are expressed as numbers(percentages). Obesity is defined as a body mass index ≥ 28 kg/m2. According to the diagnostic criteria for diabetes released by WHO in 2011, HbA1c can be used to diagnose diabetes, and the diagnostic cut-off point is HBA1C ≥ 6.5%. According to ADA standard, 5.7–6.4% HbA1c can be used as one of the diagnostic criterias for prediabetes.
Abbreviations: BMI: body mass index; SBP: systolic blood pressure; DBP: diastolic blood pressure; FPG: fasting plasma glucose; 2hPG: 2-h postprandial blood glucose; GGT: glutamyltransferase; ALT: alanine aminotransferase; AST: aspartate aminotransferase.
Characteristics of the study population by categories of GGT levels.

Effect of GGT on the prevalence of hyperlipidemia
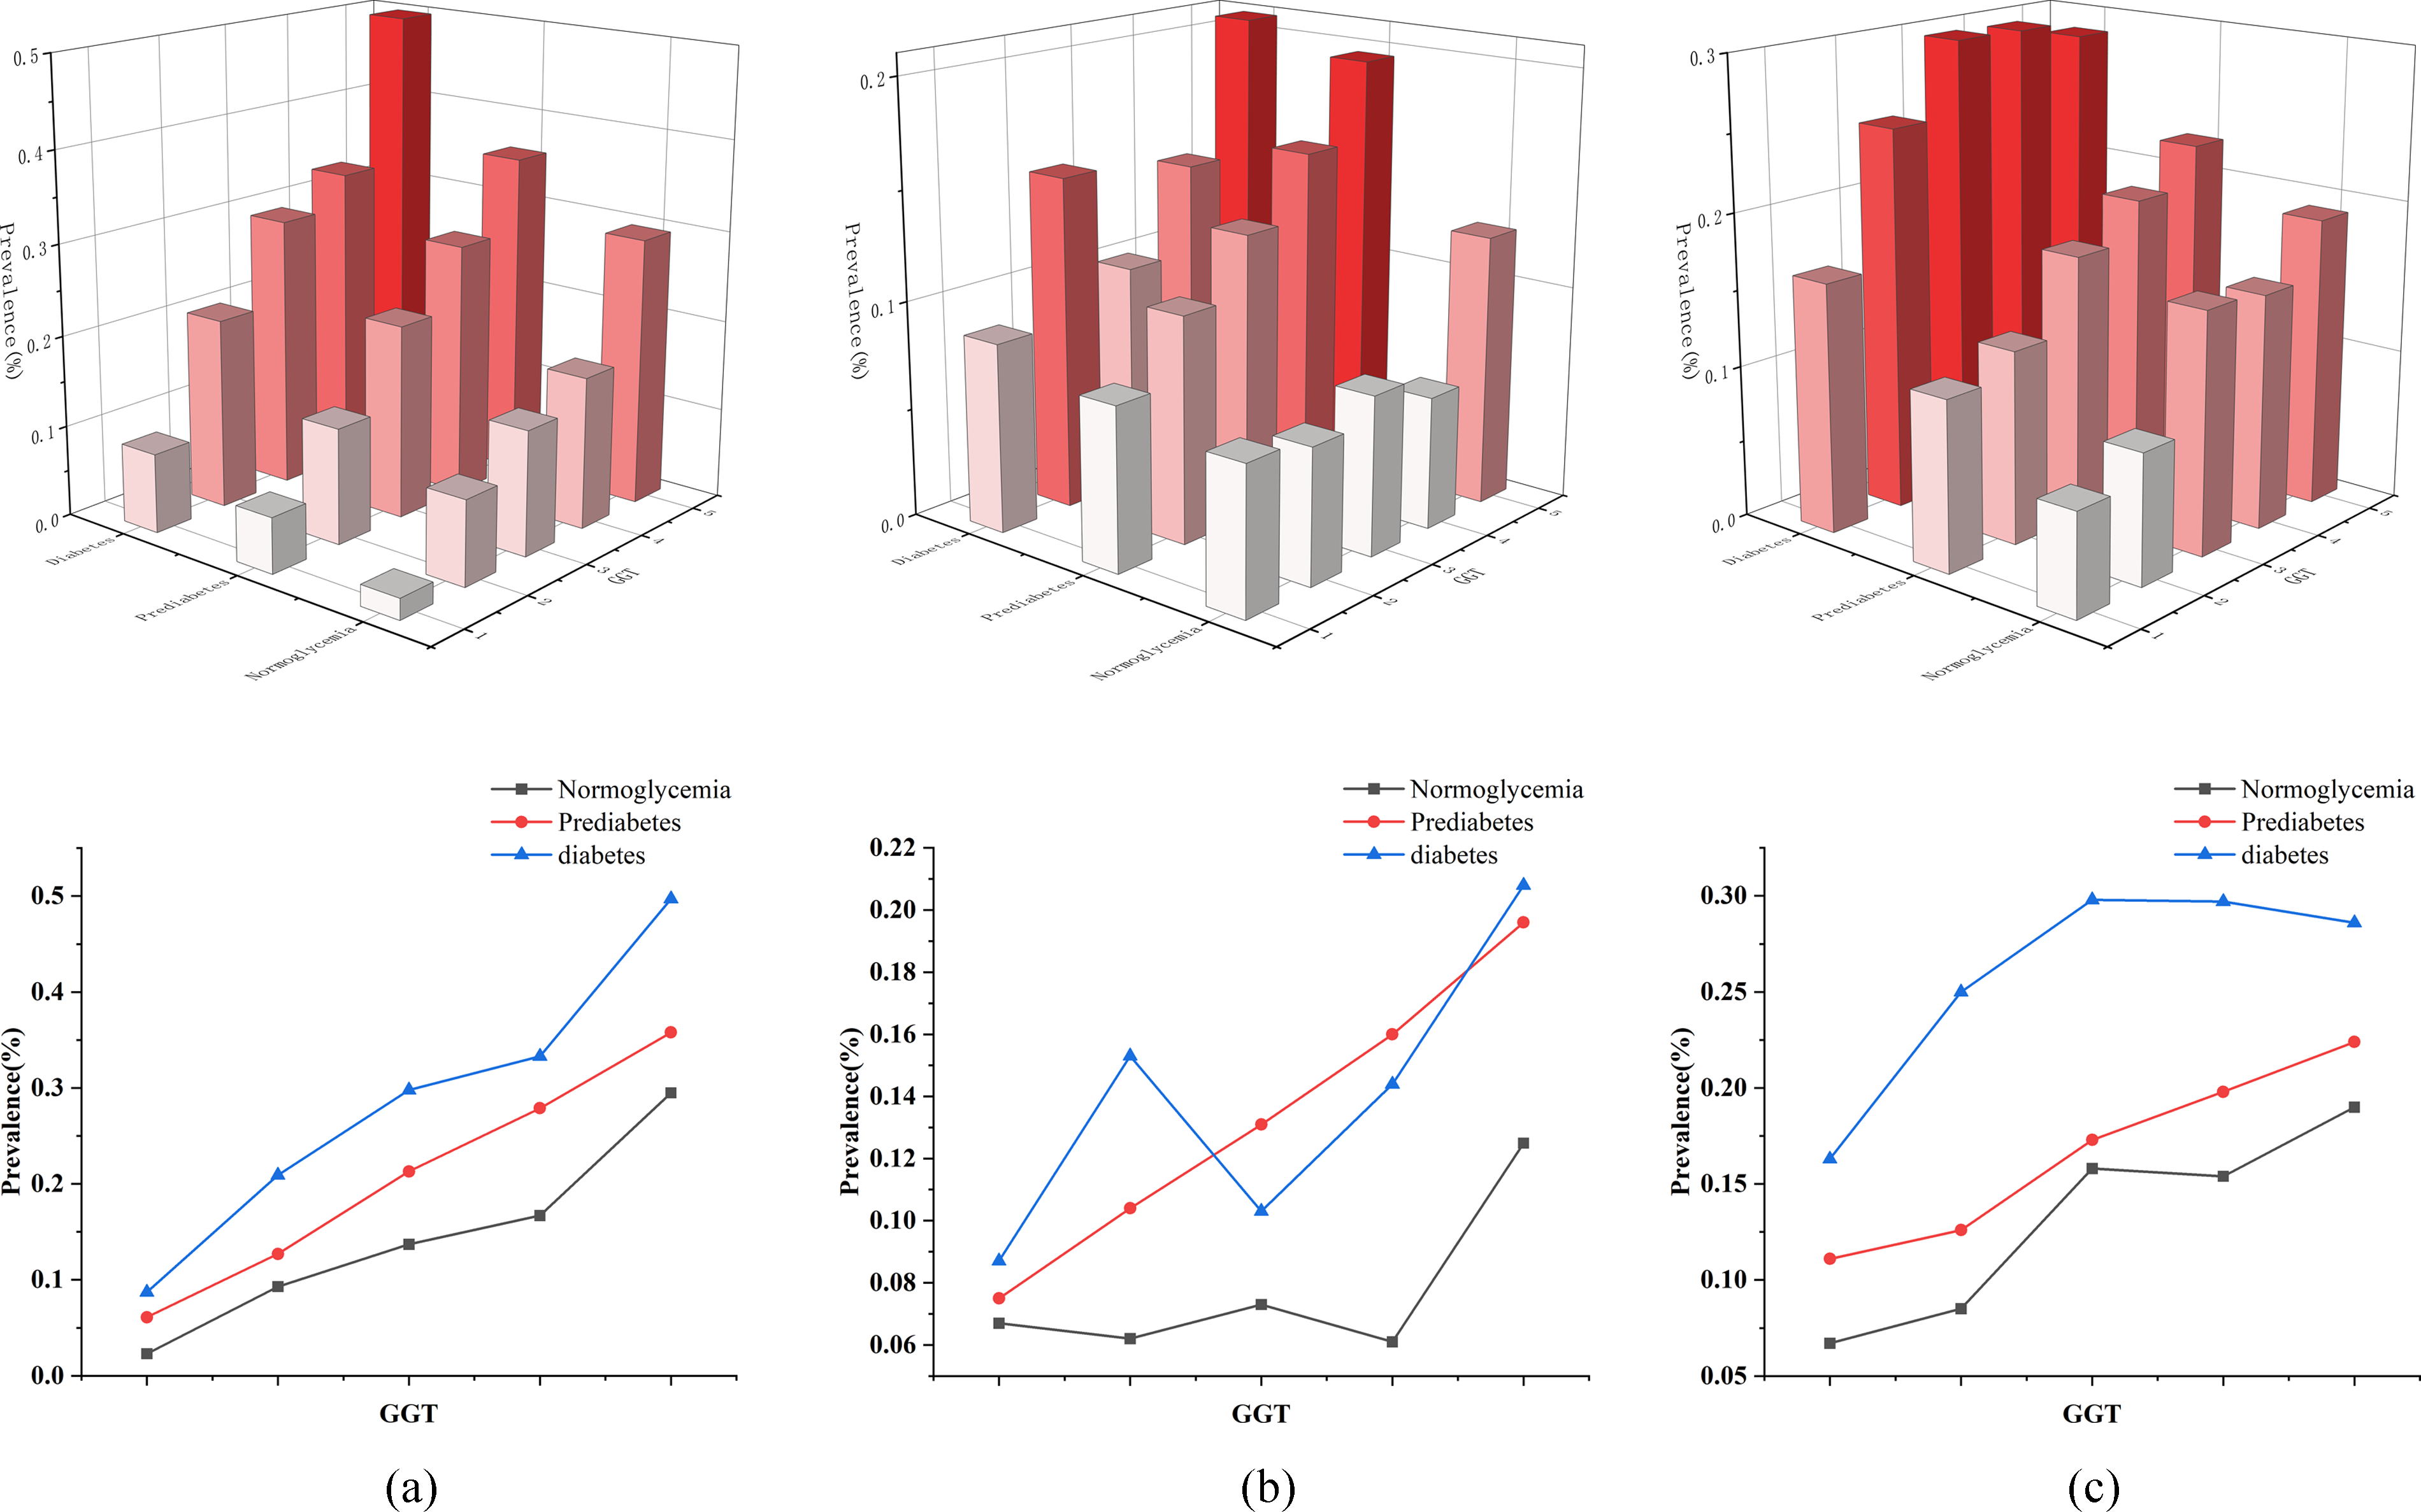
To explore the relationship between GGT and various types of hyperlipidemia, we divide the data set into ten roughly equal parts according to GGT and compare the prevalence of hyperlipidemia among each group (Figure 3(a)). With the progressive increase of GGT, the prevalence of hypertriglyceridemia, hypercholesterolemia and low-HDL increased, and the prevalence is statistically significant among the ten groups (P < 0.05). Compared with hypercholesterolemia and low-HDL, GGT has a more significant effect on the prevalence of hypertriglyceridemia, with the prevalence of hypertriglyceridemia in the highest decile of GGT 11 times higher as in the lowest decile (3.5% vs 38.9%). The effect of GGT on the prevalence of hypercholesterolemia and low-HDL is not significant, but the overall prevalence increases with increasing GGT, with the prevalence of hypercholesterolemia in the highest decile three times (6.9% vs 19.6%) and twice (9.4% vs 21.8%) as in the lowest decile, respectively. In addition to GGT, we also analyze the effects of ALT and AST on the prevalence of hyperlipidemia. Consistent with the above, the data set is divided into ten groups roughly equal according to ALT and AST respectively, and the prevalence of the three types of hyperlipidemia is statistically significant among the ten groups (P < 0.05). With the progressive elevation of ALT, the prevalence of hypertriglyceridemia and hypercholesterolemia gradually increases, and the prevalence of the highest decile of ALT is four times (10.8% vs 41.5%) and twice (7.4% vs 16.2%) of the lowest decile (Figure 3(b)). ALT is U-shaped associated with the prevalence of low-HDL. With the progressive elevation of AST, the prevalence of hypertriglyceridemia and hypercholesterolemia generally increases, with local fluctuations. The prevalence of the highest AST decile is about twice that of the lowest AST decile (15.2% vs 32%, 6.8% vs 15.1%) (Figure 3(c)). AST is U-shaped associated with the prevalence of low-HDL.

The influence of liver enzymes on the prevalence of three types of hyperlipidemia.
The combined effect of GGT and blood glucose on the prevalence of hyperlipidemia
Compared with the population with normoglycemia and the lowest GGT level, the prevalence of hyperlipidemia in the population with the highest GGT level and diabetes is significantly increased (Figure 4). This phenomenon is most pronounced in hypertriglyceridemia, and the prevalence has increased by about 22 times (2.3% vs 50%). The prevalence of hypertriglyceridemia corresponding to the quintile of GGT is observed under the same blood glucose state, and it is found that the effect of GGT on hypertriglyceridemia is independent of blood glucose, and the prevalence always increases with the increase of GGT, with statistical significance (P < 0.05). Under the same GGT level, the prevalence of hypertriglyceridemia in the diabetic group is always higher than that in the normoglycemia group, and the prevalence of hypertriglyceridemia in the prediabetic group is between them. With the same blood glucose status, the overall prevalence of hypercholesterolemia increases with the increase of GGT level, and fluctuates in the diabetic group, with statistical significance (P < 0.001 in the normoglycemia group; P = 0.002 in the prediabetic group; P = 0.003 in the diabetic group). In normoglycemia group and prediabetes group, the prevalence of low-HDL increases with the increase of GGT level, and the difference is statistically significant (P < 0.05). The prevalence of low-HDL is not statistically significant in the diabetic group.
The prevalence of hyperlipidemia under the combined influence of GGT and blood glucose.
Correlation analysis of various variables and triglyceride levels
We conduct a Spearman correlation analysis to quantify the correlation between various indicators and triglyceride levels, so as to select indicators with higher correlation for subsequent analysis.
Table 3 shows the results of Spearman's correlation analysis. Among them, SBP (
The correlation analysis results of triglycerides.

Table 4 shows the results of multiple regression analyses. SBP, BMI, FPG, 2hPG, HbA1c, ALT, GGT are significantly correlated with triglyceride.
Results of multiple regression analysis of triglycerides.

General rules in non-hypertriglyceridemia population
Figure 5 shows the classification decision tree constructed with the data of the study population as input. In order to measure the classification accuracy of decision tree, the ROC curve is drawn (Figure 6), and the model finally achieved an accuracy of 73.2%, indicating that the classification results and the rules formed by decision tree have certain reference value.

The decision tree. Orange nodules indicate hyperlipidemia and blue nodules indicate non-hyperlipidemia.

The ROC curve of decision tree classification model.
Table 5 shows the general rules of the non-triglyceride population extracted from the decision tree and manually modified. It can be seen that for people with HbA1c less than 6.0%, controlling GGT within 30 IU/L reduces the prevalence of hypertriglyceridemia by 4% compared with not controlling GGT (0.85 vs 0.89). For people with HbA1c between 6.0% and 6.5%, the effect of controlling GGT is more obvious. Controlling GGT within 30 IU/L reduces the prevalence of hypertriglyceridemia by 6%, and controlling GGT within 20 IU/L, the prevalence of hypertriglyceridemia decreases by 11%. Although the normal range of GGT is generally accepted to be below 54 IU/L, it can be seen from the previous analysis that when GGT is greater than 35 IU/L, the prevalence of hypertriglyceridemia has increased significantly, and the control of GGT is often neglected. Therefore, it is meaningful to control GGT for different groups with different blood glucose states.
General rules of the non-hypertriglyceridemia population extracted from the decision tree and manually modified.

Discussion
Hyperlipidemia, like diabetes, obesity, hypertension and non-alcoholic fatty liver disease, belongs to the category of metabolic syndrome and is a major risk factor for atherosclerotic cardiovascular disease, whose pathogenesis includes insulin resistance, oxidative stress, endothelial cell damage, inflammation, etc.30–32 We observe that BMI, blood glucose, blood pressure, ALT, AST and GGT in the hyperlipidemia group are higher than those in the non-hyperlipidemia group, and the prevalence of diabetes in the hyperlipidemia group is 1.7 times higher than that in the non-hyperlipidemia group, indicating that hyperlipidemia increases the risk of diseases related to metabolic syndromes, such as diabetes, obesity and hypertension.
In this study, the effects of ALT, AST and GGT on the prevalence of hypertriglyceridemia are analyzed. The prevalence of hypertriglyceridemia in the highest decile of ALT and GGT is 4 times and 11 times as in the lowest decile, indicating that GGT is more significant than ALT in the risk of hypertriglyceridemia. In the study, although GGT is at a normal range in most people, BMI, blood glucose and triglyceride gradually increased in the quintile of GGT, which is consistent with Giacomo Zoppini's study. 33 This study also confirms that GGT is significantly correlated with triglyceride level, and GGT has a significant impact on the prevalence of hypertriglyceridemia. GGT is significantly positively correlated with the prevalence of hypertriglyceridemia in both diabetic and non-diabetic populations, and further analysis proves that the effect of GGT on the prevalence of hypertriglyceridemia is independent of blood glucose. More and more evidence shows that the activity of GGT is closely related to metabolic disorders and is an independent predictor of metabolic syndrome and insulin resistance.34,35 In this study, GGT levels are related to the levels of metabolic factors such as blood glucose and blood lipids, which further proves the correlation between GGT and metabolic disorders. The underlying mechanism of the relationship between GGT and hypertriglyceridemia is not clear and may be related to the following reasons. First, GGT is a marker of oxidative stress. 36 Oxidative stress can occur in metabolic disorders such as hyperglycemia and hyperlipidemia, and the free radicals produced by oxidative stress consume glutathione, which induces the expression of GGT in the liver. Secondly, liver insulin resistance is an important pathogenesis of metabolic syndrome such as hyperlipidemia, diabetes mellitus and nonalcoholic fatty liver disease. GGT is a liver enzyme index closely related to liver steatosis such as fatty liver, so hyperlipidemia may increase GGT level. More studies are needed to clarify the mechanisms by which GGT levels are associated with an increased prevalence of hypertriglyceridemia.
Based on statistical methods and decision tree, this study find that GGT is an important biochemical indicator closely related to the prevalence of hypertriglyceridemia. Even if the GGT level is within the normal range, the prevalence of hyperlipidemia will increase gradually with the increase of GGT. Controlling GGT may reduce the prevalence of hypertriglyceridemia, thereby reducing the risk of cardiovascular diseases. Controlling GGT concentration within 30 IU/L in the normoglycemia group and 20 IU/L in the impaired glucose tolerance group can significantly reduce the prevalence of hypertriglyceridemia, suggesting that the incidence of hyperlipidemia can be prevented by controlling GGT level in the sub-health state.
Overall, this study demonstrates that even GGT levels in the normal range increase the risk of hypertriglyceridemia. At present, GGT detection is relatively standard and belongs to the detection scope of liver function, which is economical, simple and feasible. Therefore, GGT detection should be included in routine laboratory testing, and GGT level should be appropriately controlled for different populations to reduce the risk of hyperlipidemia.
Footnotes
Acknowledgements
The authors wish to thank the study participants for their contribution to the research, as well as current and past investigators and staff. The authors would specifically be grateful to the Science Technology Department of Jilin Province for its support.
Contributorship
All authors contributed substantially to the design of the study and the review of the data and the writing of the manuscript.
Declaration of conflicting interests
The author(s) declared no potential conflicts of interest with respect to the research, authorship, and/or publication of this article.
Ethical approval
The Institutional Ethics Committee at the First Hospital of Jilin University approved the study protocol. Written informed consent was obtained from each participant before data collection.
Funding
The author(s) disclosed receipt of the following financial support for the research, authorship, and/or publication of this article: This study is supported in part by the Science and Technology Development Plan Project of Jilin Province (grant number 20210101181JC).
Guarantor
Hongtao Bai.