
Abstract
The Integrated Clinical and Environmental Exposures Service (ICEES) provides open regulatory-compliant access to clinical data, including electronic health record data, that have been integrated with environmental exposures data. While ICEES has been validated in the context of an asthma use case and several other use cases, the regulatory constraints on the ICEES open application programming interface (OpenAPI) result in data loss when using the service for multivariate analysis. In this study, we investigated the robustness of the ICEES OpenAPI through a comparative analysis, in which we applied a generalized linear model (GLM) to the OpenAPI data and the constraint-free source data to examine factors predictive of asthma exacerbations. Consistent with previous studies, we found that the main predictors identified by both analyses were sex, prednisone, race, obesity, and airborne particulate exposure. Comparison of GLM model fit revealed that data loss impacts model quality, but only with select interaction terms. We conclude that the ICEES OpenAPI supports multivariate analysis, albeit with potential data loss that users should be aware of.
Keywords
Introduction
Electronic health record (EHR) data, while intended to serve an administrative function, offer a valuable resource for clinical and translational researchers. However, the regulatory and institutional restrictions placed on access to EHR data, while critical to protect patient privacy, often impose challenges to data dissemination for research purposes. To address such issues, several groups have developed approaches for openly exposing EHR data to support clinical and translational research, while preserving patient privacy and abiding by all federal and institutional regulations.1,2 One recent contribution is the Integrated Clinical and Environmental Exposures Service (ICEES).3–5 ICEES provides open regulatory-compliant access to EHR data and other sources of clinical data that have been integrated at the patient level with a variety of public exposure data. The data are accessible via an open application programming interface (OpenAPI). ICEES supports several use cases and cohorts and is equipped with basic tools for exploratory and bivariate analyses.
ICEES bivariate functionalities were recently extended to support multivariate analysis using the ICEES OpenAPI. 6 The approach was designed to be applied on a query-by-query basis, and data loss occurs due to regulatory constraints on the Open API. In particular, restrictions are placed on the creation of small cohorts (less than or equal to 10 patients), which cannot be accessed due to privacy concerns. Our preliminary work suggests that data loss is minimal; however, we did not systematically quantify data loss in our pilot work. With a growing number of available feature variables and a theoretically endless number of user queries, the analytic bounds of multivariate analysis using the ICEES OpenAPI are important to determine. A systematic comparison of the multivariate analytic capabilities achievable with data extracted from the ICEES OpenAPI versus the underlying, constraint-free source data is essential to quantify the impact of data loss, determine the analytic bounds of the open service, and inform multivariate model development.
In the present study, we systematically evaluate the robustness, validity, accuracy, and specificity of knowledge and assertions generated when applying a multivariate model to the ICEES OpenAPI. We first briefly describe the open approach that we developed to support multivariate analysis using the ICEES OpenAPI. 6 We then perform a comparative analysis on data extracted using the ICEES OpenAPI data versus the underlying, constraint-free source data and quantify data loss. We apply a multivariate model to both the data extracted from the ICEES OpenAPI and the underlying constraint-free source data, using a generalized linear model (GLM) to predict exacerbations of asthma, our driving use case, and we further investigate the presence of divergence in the GLM results. Finally, we discuss model robustness and the nuances of data loss, as well as methods for users to quantify data loss for queries submitted to the ICEES OpenAPI.
We focus on asthma as our driving use case, as asthma is exquisitely sensitive to environmental exposures. We include seven predictors in our GLM based on their demonstrated relationship to asthma in the literature. For instance, several groups5–9,11,12 have identified female sex and/or race as key demographic factors associated with asthma exacerbations. Obesity also is an established risk factor for asthma exacerbations.6,7,9 Moreover, exposure to high levels of airborne pollutants is a known trigger for asthma exacerbations.3,5,6,8,9,13 Likewise, close proximity to a major roadway or highway and residential density have been suggested to contribute to asthma exacerbations.8–10,14 Finally, we include prednisone as a predictor in our model because it is typically used to treat severe asthma 15 and thus is an acceptable proxy for asthma exacerbations.6,8,9
Methods and Statistical Plan
All study procedures were approved by the Institutional Review Board at the University of North Carolina at Chapel Hill.
Overview of Analytic Plan
ICEES was developed to support functionalities that allow users to dynamically define cohorts and explore univariate and bivariate relationships between feature variables. 3 We focused on sex, race, prescriptions for prednisone, diagnoses of obesity, airborne particulate matter exposure, residential proximity to a major roadway or highway, and residential density as potential predictors of asthma exacerbations, the primary outcome measure. We considered the existing ICEES cohort of UNC Health patients with asthma or related conditions. 3 Asthma exacerbations were defined as the annual number of emergency department (ED) or inpatient visits for respiratory issues in year 2010. Hereinafter, we use the term “post-API data” to refer to data extracted using the ICEES OpenAPI and “pre-API data” to refer to the underlying, constraint-free source dataset. We applied a GLM to both the pre-API data and the post-API data to systematically assess model robustness.
Pre-API Dataset
The ICEES asthma OpenAPI exposes integrated clinical and environmental data on ∼160,000 patients from UNC Health. 3 We selected seven features to generate a multivariate table: sex; race; prescriptions for prednisone; diagnoses of obesity; airborne particulate matter exposure; residential proximity to a major roadway or highway; and residential density. We focused on outcomes in year 2010 by filtering out patients who did not have any observations in the EHR during that year, using the ICEES feature variable “Active_In_Year.” Specifically, setting “Year = 2010” and “Active_ In_ Year = 1” will select only those patients who were active during the study period of interest, in this case, year 2010. We further filtered patients who were missing data on any of the feature variables of interest. The two filtering steps reduced the sample size for the pre-API dataset to N = 15,420 patients.
Post-API Dataset
The algorithm used to programmatically extract a multivariate dataset is described in detail in Fecho et al. 2021,
6
and a detailed technical design and overview of the ICEES OpenAPI is provided in Fecho et al. 2019.
3
Briefly, the algorithm must be applied to a specific use case question. In the example described here and in our prior work,
6
the question was: are sex, race, prednisone use, obesity, airborne particulate matter exposure, major roadway or highway exposure, and residential density significant predictors of asthma exacerbations, either independently or by way of interaction? The ICEES dynamic cohort creation functionality is then applied to generate separate subcohorts for each level of the primary outcome measure, in this case, the annual number of ED or inpatient visits for respiratory issues. For each subcohort, the ICEES bivariate contingency functionality is applied to examine the relationship between two feature variables for each level of the primary outcome measure. The dynamic cohort creation functionality is applied again to generate subcohorts based on combinations of each level of the primary outcome measure and each bivariate relationship. This process is then continued until all desired feature variables have been incorporated. The result is a multivariate table, with rows representing each combination of the primary outcome measure level and the feature variable level and with sample sizes for each row (Figure 1). This table can then be expanded such that a row with a sample size of N = 20 can be transformed to 20 rows with a sample size of N = 1 each. Thus, the output of the algorithm is a multivariate table, where each column represents one of the seven above-mentioned feature variables, with contingencies maintained across feature variables, and where each row represents an individual patient/observation. We applied the same filtering approach as we did to the pre-API data, in that we filtered the data by selecting “Year = 2010” and “Active_In_Year = 1” and removed patients who were missing data on any of the selected feature variables. The final sample size for the post-API dataset was N = 14,586. Excerpt from the ICEES eight-feature multivariate table (post-API data).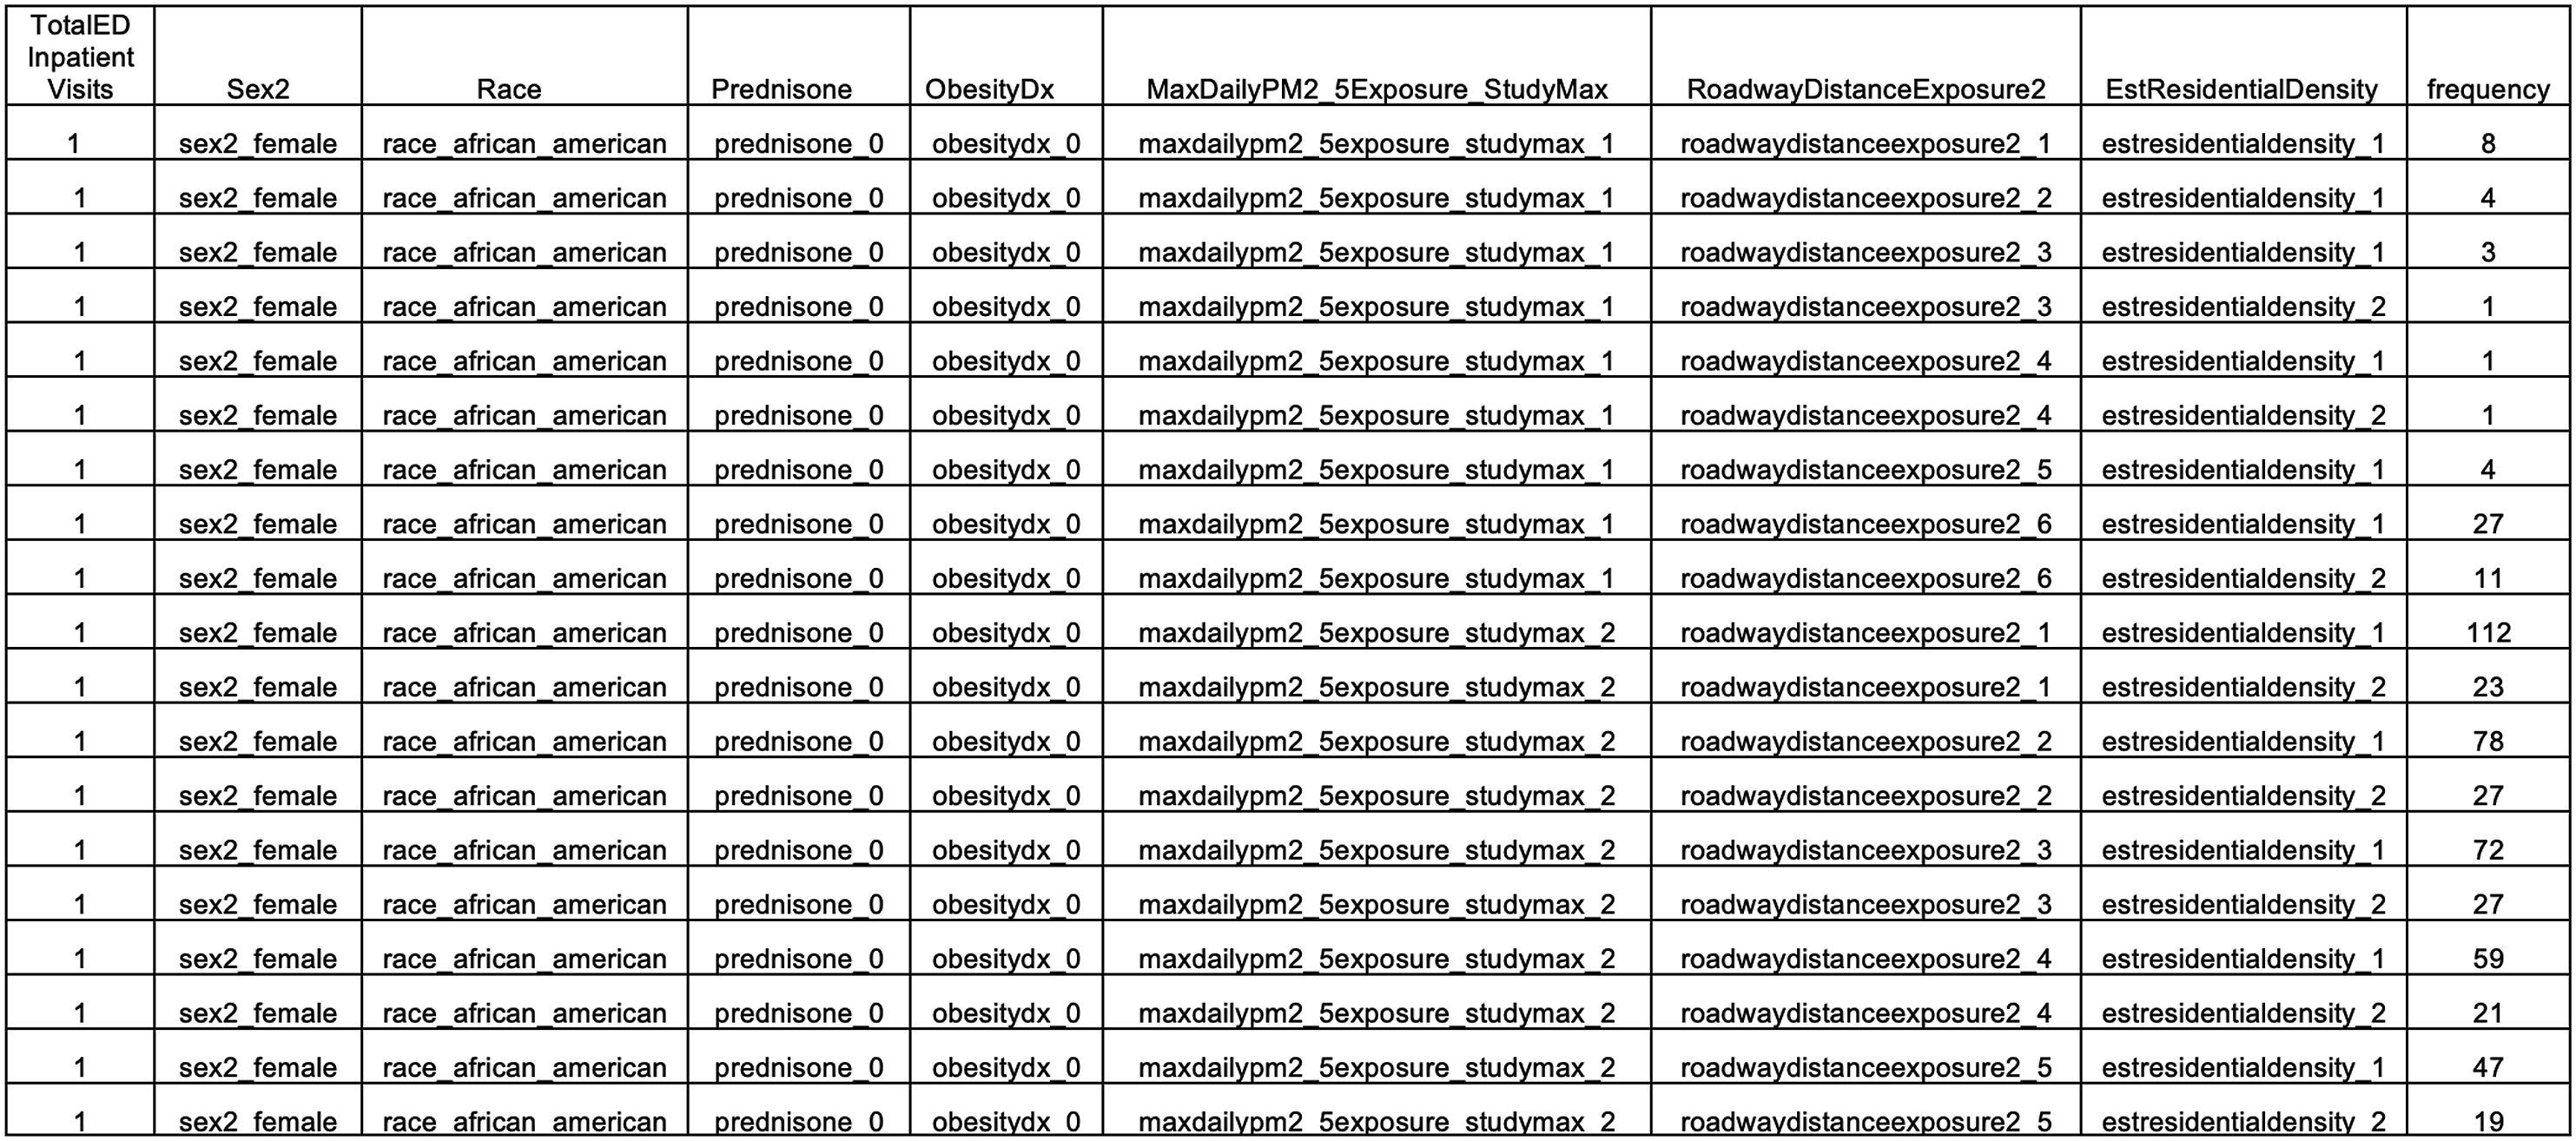
Quality Control and Summary Statistics
We first verified feature name and feature level consistency between the pre- and post-API datasets. After the datasets passed the consistency check, we then performed descriptive statistics. Specifically, we performed pandas inner and outer merge 16 to compare the pre- and post-API contingency tables, in terms of sample sizes at each feature variable level and overall. This step allowed us to quantify data loss and determine whether any feature variables were selectively impacted by the data loss inherent in the ICEES OpenAPI multivariate approach due to regulatory constraints that prevent the creation of cohorts ≤10 patients.
GLM Application
After quantifying data loss, we used R software to develop and apply a GLM model 17 to predict “TotalEDInpatientVisits” using the above-mentioned feature variables extracted from the pre- and post-API datasets. Given that the feature variable “TotalEDInpatientVisits” represents counts and is therefore ordinal and that the distribution was skewed towards lower “TotalEDInpatientVisits” (i.e. most patients do not visit an ED or inpatient clinic in any given year), we fit a negative binomial (NB) model to the data. 18 NB models have been shown to be well suited for such skewed count distributions. 19
Because we filtered by “Active_In_Year = 1,” “TotalEDInpatientVisits = 0” had fewer counts than “TotalEDInpatientVisits = 1,” which is generally inconsistent with the NB distribution. Hence, we filtered out patients/rows with “TotalEDInpatientVisits = 0” from the pre-API (N = 410) and post-API (N = 351) datasets in order to maintain the NB distribution. We then applied the GLM to the interactions and main effects. We applied an Analysis of Variance (ANOVA) to the results obtained from GLM model output, with α = 0.05.
We applied the Residual Diagnostics for Hierarchical (Multi-Level/Mixed) Regression Models DHARMa package from R 18 to the model results in order to evaluate if the NB model accurately fit the data and accounted for overdispersion. The DHARMa tool uses a simulation-based approach to generate quantile residuals for generalized linear mixed models, including NB GLM.18,19
After we obtained the ANOVA results for both datasets, we compared the coefficients, standard errors, and p values for one-way, two-way, and three-way interactions. If there was a discrepancy for any coefficient between the pre- and post-API datasets, then one would expect for there to be divergence between the corresponding frequencies in the underlying multivariate datasets. To assess the degree of divergence between the model output for the pre-API and post-API datasets, a Kullback-Leibler test and a Chi Square test were applied to the coefficients.
Results
We first quantified overall data loss. After filtering for Active_In_Year = 1 and removing patients/rows with missing observations, samples sizes were N = 15,420 for the pre-API dataset and N = 14,586 for the post-API dataset, thus indicating a loss of 834 patients/rows.
ANOVA on GLM model summary for one-way, two-way, and three-way interactions.
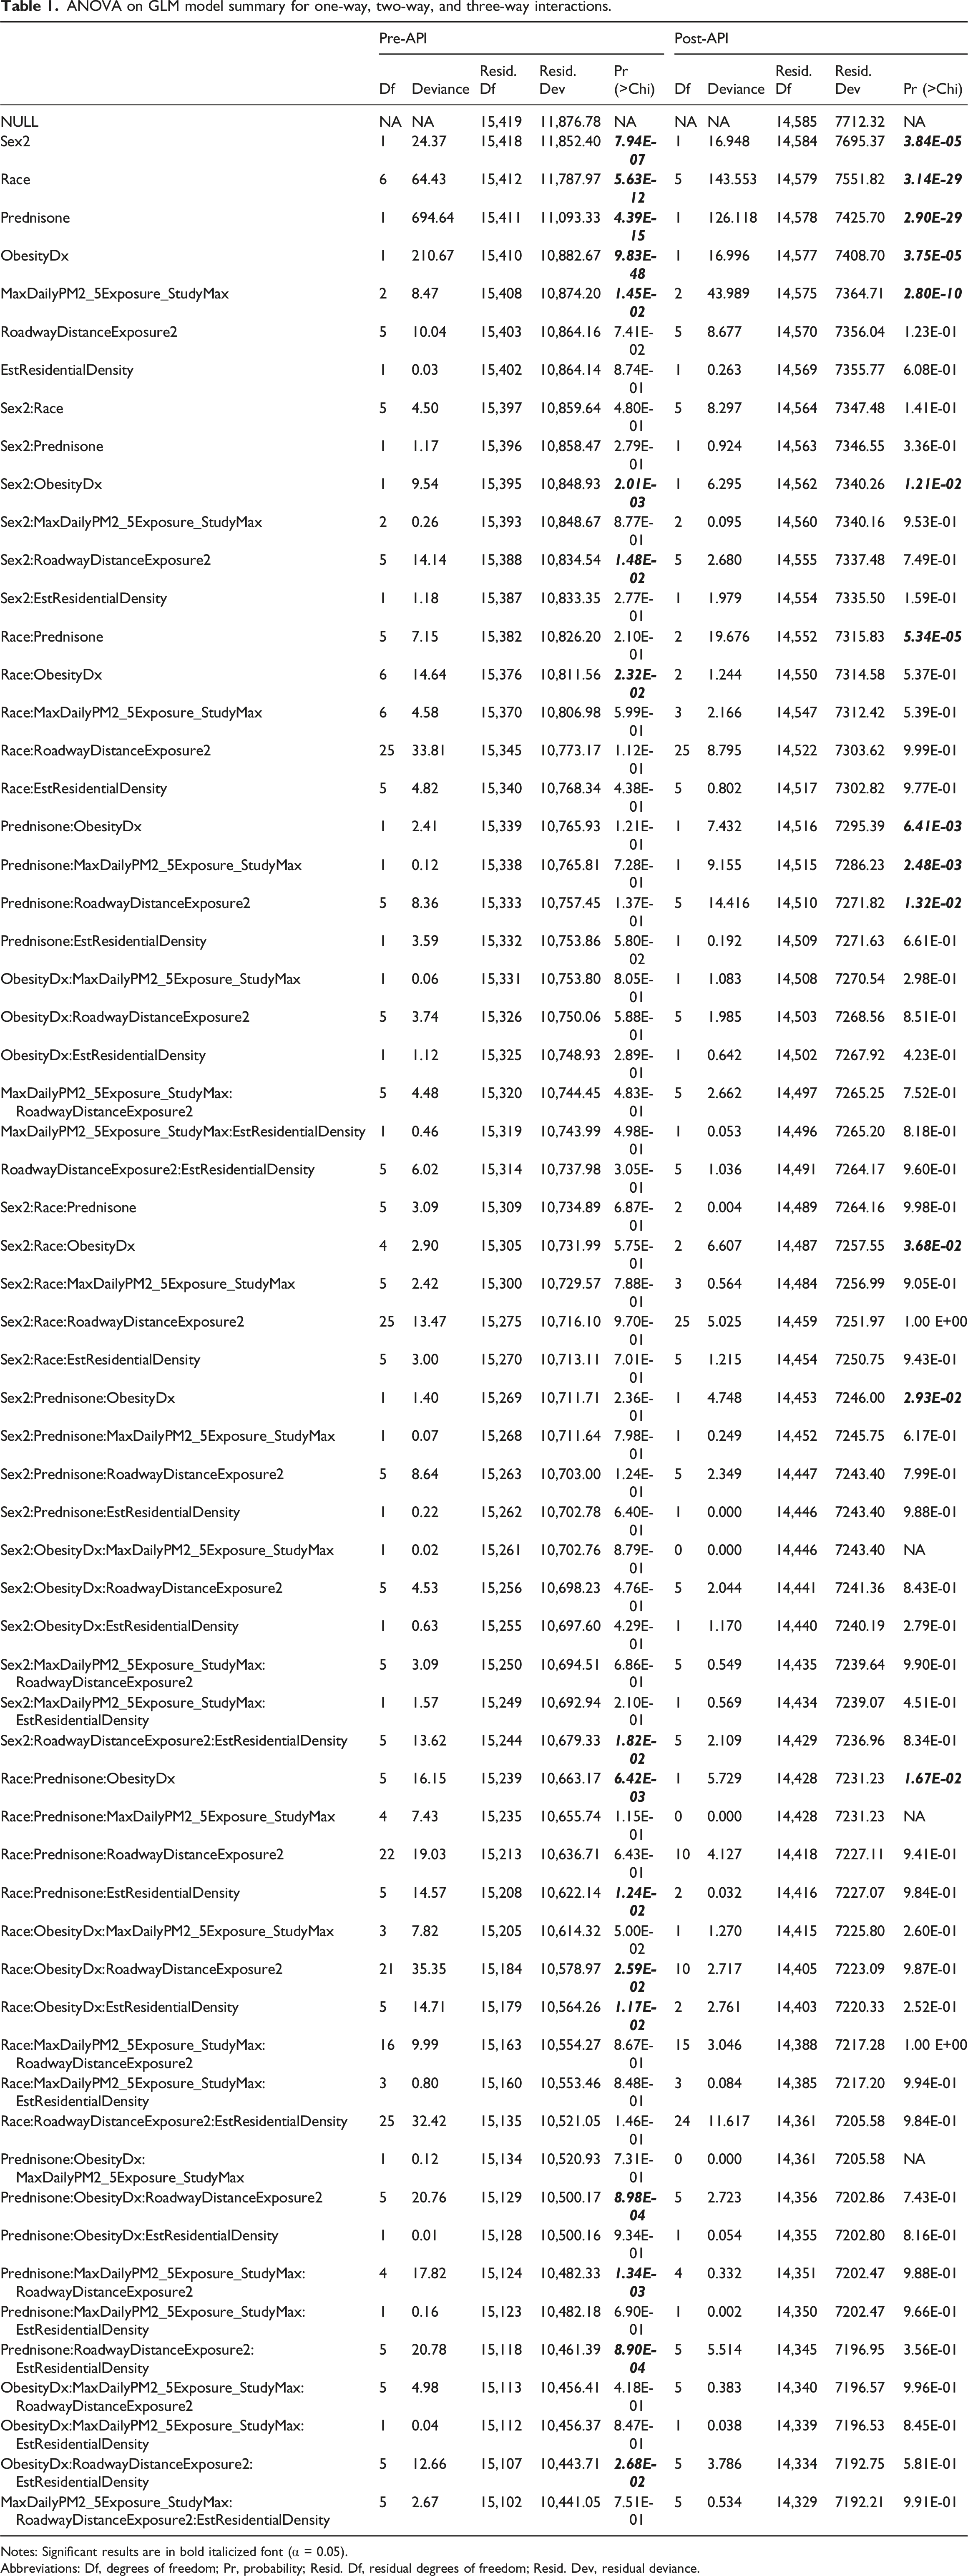
Notes: Significant results are in bold italicized font (α = 0.05).
Abbreviations: Df, degrees of freedom; Pr, probability; Resid. Df, residual degrees of freedom; Resid. Dev, residual deviance.
To better understand the model discrepancies and behavior, we examined interactions where only the pre-API model fit or only the post-API model fit was significant. A closer examination of the interaction model showed an imbalance in ObesityDx = 0 and ObesityDx = 1 across five of the seven racial categories (Asian, Native Hawaiian/Pacific Islander, American/Alaskan native, Other, Unknown), thus suggesting that this imbalance was likely the source of model divergence in the pre-API versus post-API model fits.
To balance the data, we collapsed Race to include only African Americans and Caucasians, comprising the majority of patients (85% in the pre-API dataset and 87% in the post-API dataset) and aligning with the approach we used previously.
5
We then refit the GLM model. We plotted p values for one-, two-, and three-way interactions for the GLM model with all races included and for the GLM model with races restricted to include only African Americans and Caucasian (Figure 2). Coefficient probabilities from one- (blue), two- (red), and three-way (grey) interactions in the GLM model for the pre-API dataset (PRE) plotted against the post-API dataset (POST) for (a) all races and (b) African Americans and Caucasians only. The significance of the model is shown by the different marker symbols. Squares denote that only the pre-API model fit is significant (Panel I); cross symbols denote that neither the pre- nor the post-API model fit is significant (Panel II); plus signs denote that only the post-API model fit is significant (Panel III); and dots denote that both the pre- and post-API model fits are significant (Panel IV). The significance level was set at α = 0.05. Chi = Chi Square; Pr = probability.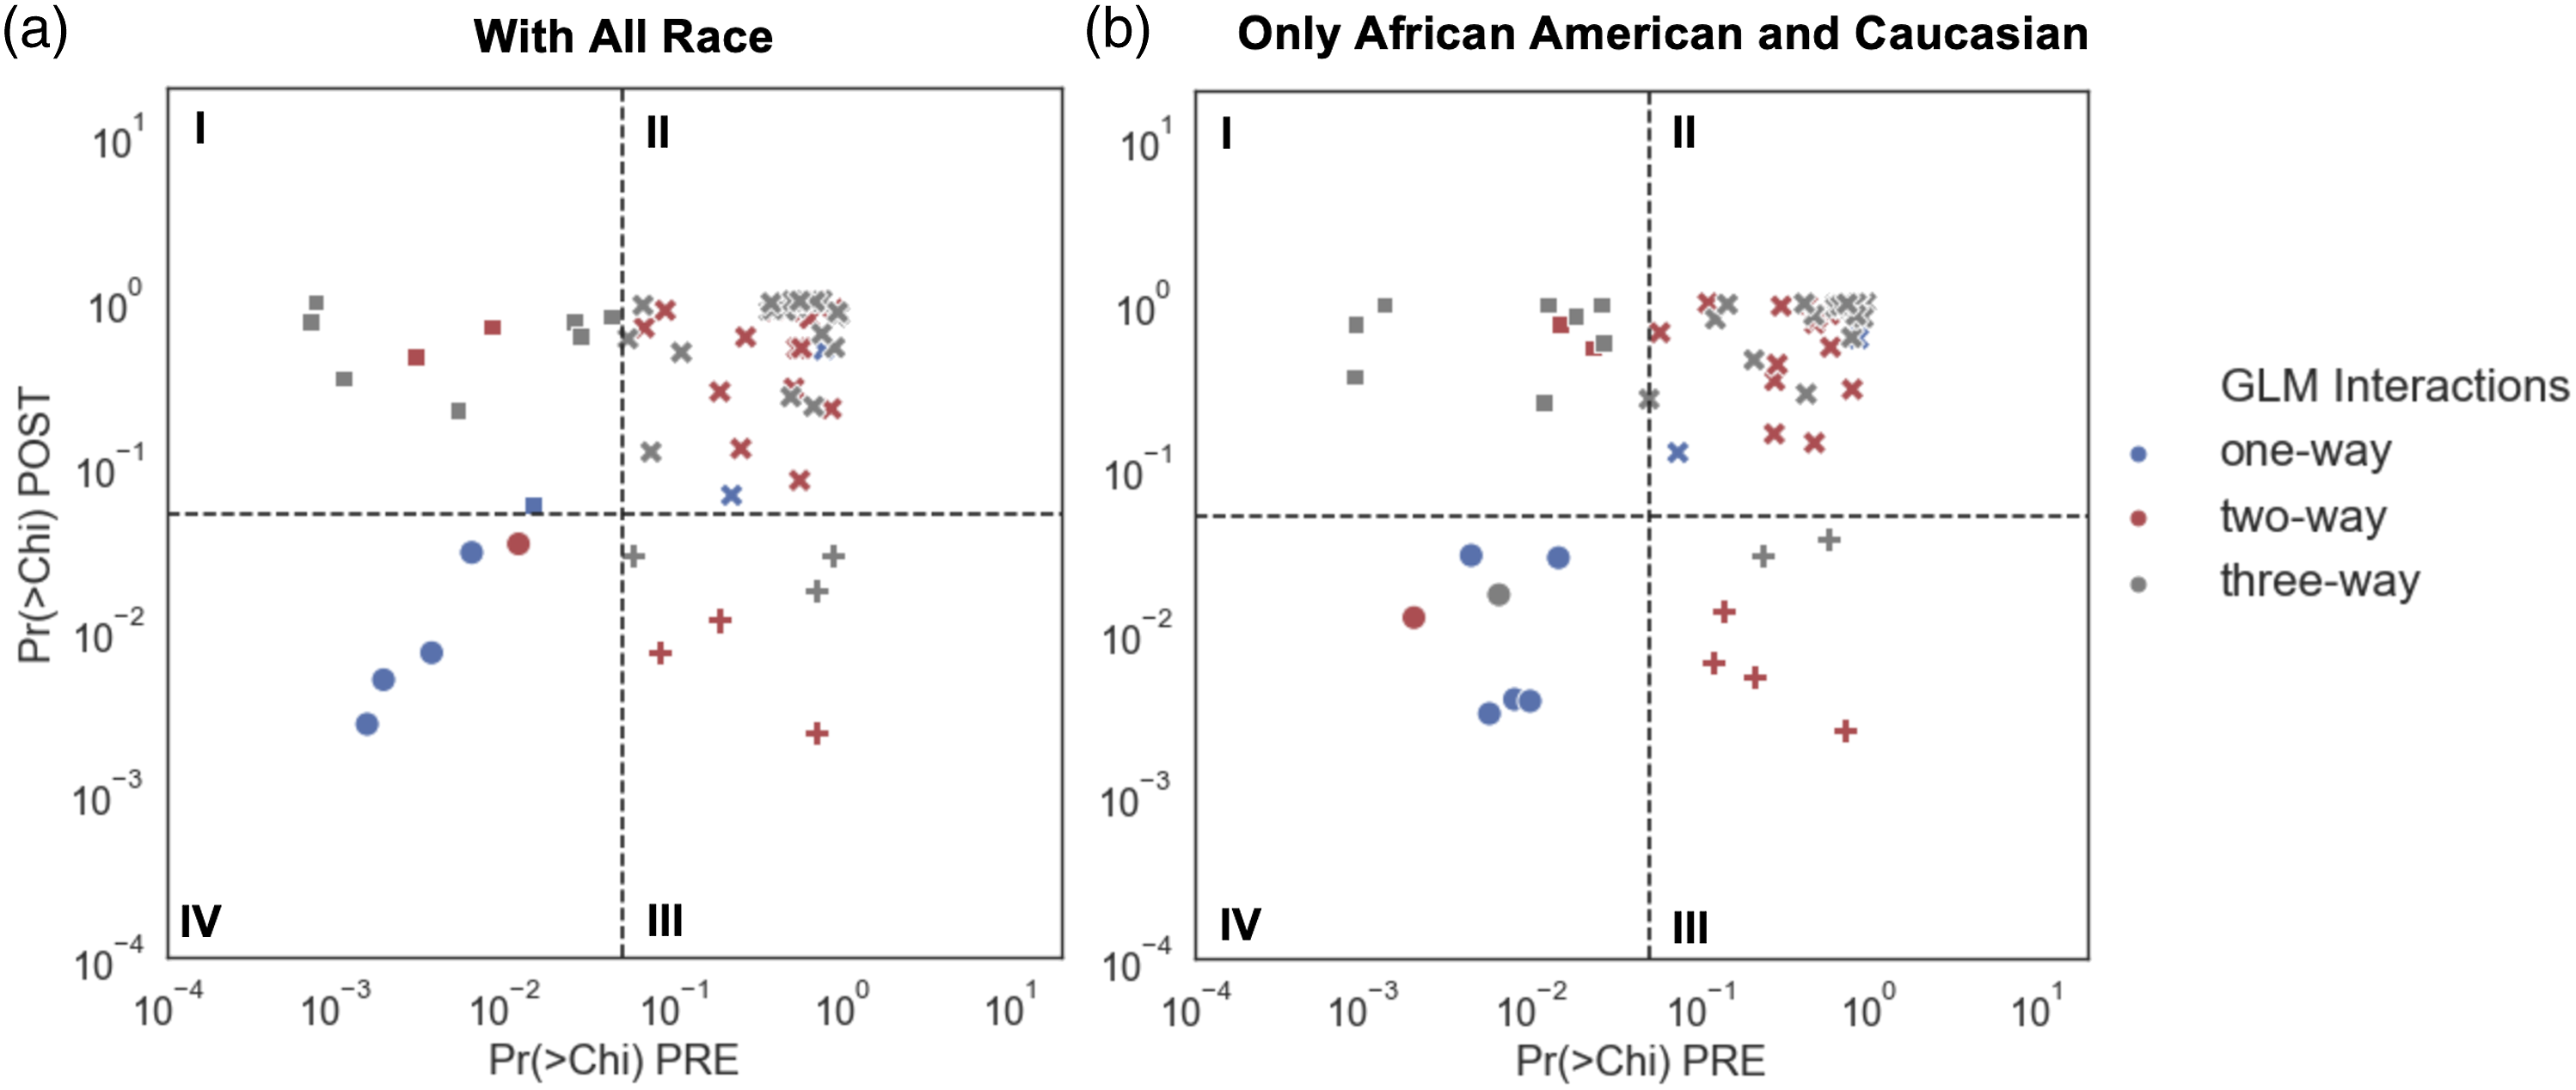
When we examined coefficients in the GLM model with African Americans and Caucasians only, we found that one-way interactions or main effects were significant for Sex2, Prednisone, ObesityDx, and MaxDailyPM2_5Exposure_StudyMax in both the pre-API and post-API datasets. Race was significant only for the pre-API model fit.
One two-way interaction was significant for both the pre-API and post-API model fit, Sex2:ObesityDx. None of the three-way interactions were significant after collapsing the race category. As with the model with all races included, ten interactions were significant only for the pre-API model fit, and six interactions were significant only for the post-API model fit.
We further examined model discrepancy by looking at frequencies for a second non-significant two-way interaction with Race, namely, Race:RoadwayDistanceExposure2. We selected these two variables because Race showed a significant main effect in the GLM, whereas RoadwayDistanceExposure2 did not. Thus, Race:RoadwayDistanceExposure2 was considered an appropriate comparison to further assess model discrepancy. We examined frequencies in the pre-API versus post-API datasets and focused on the balanced datasets with African Americans and Caucasians only (Figure 3). We found that the pre-API and post-API frequencies were not significantly different. Frequency scatter plot for Race:RoadwayDistance2 in pre-and post-API datasets.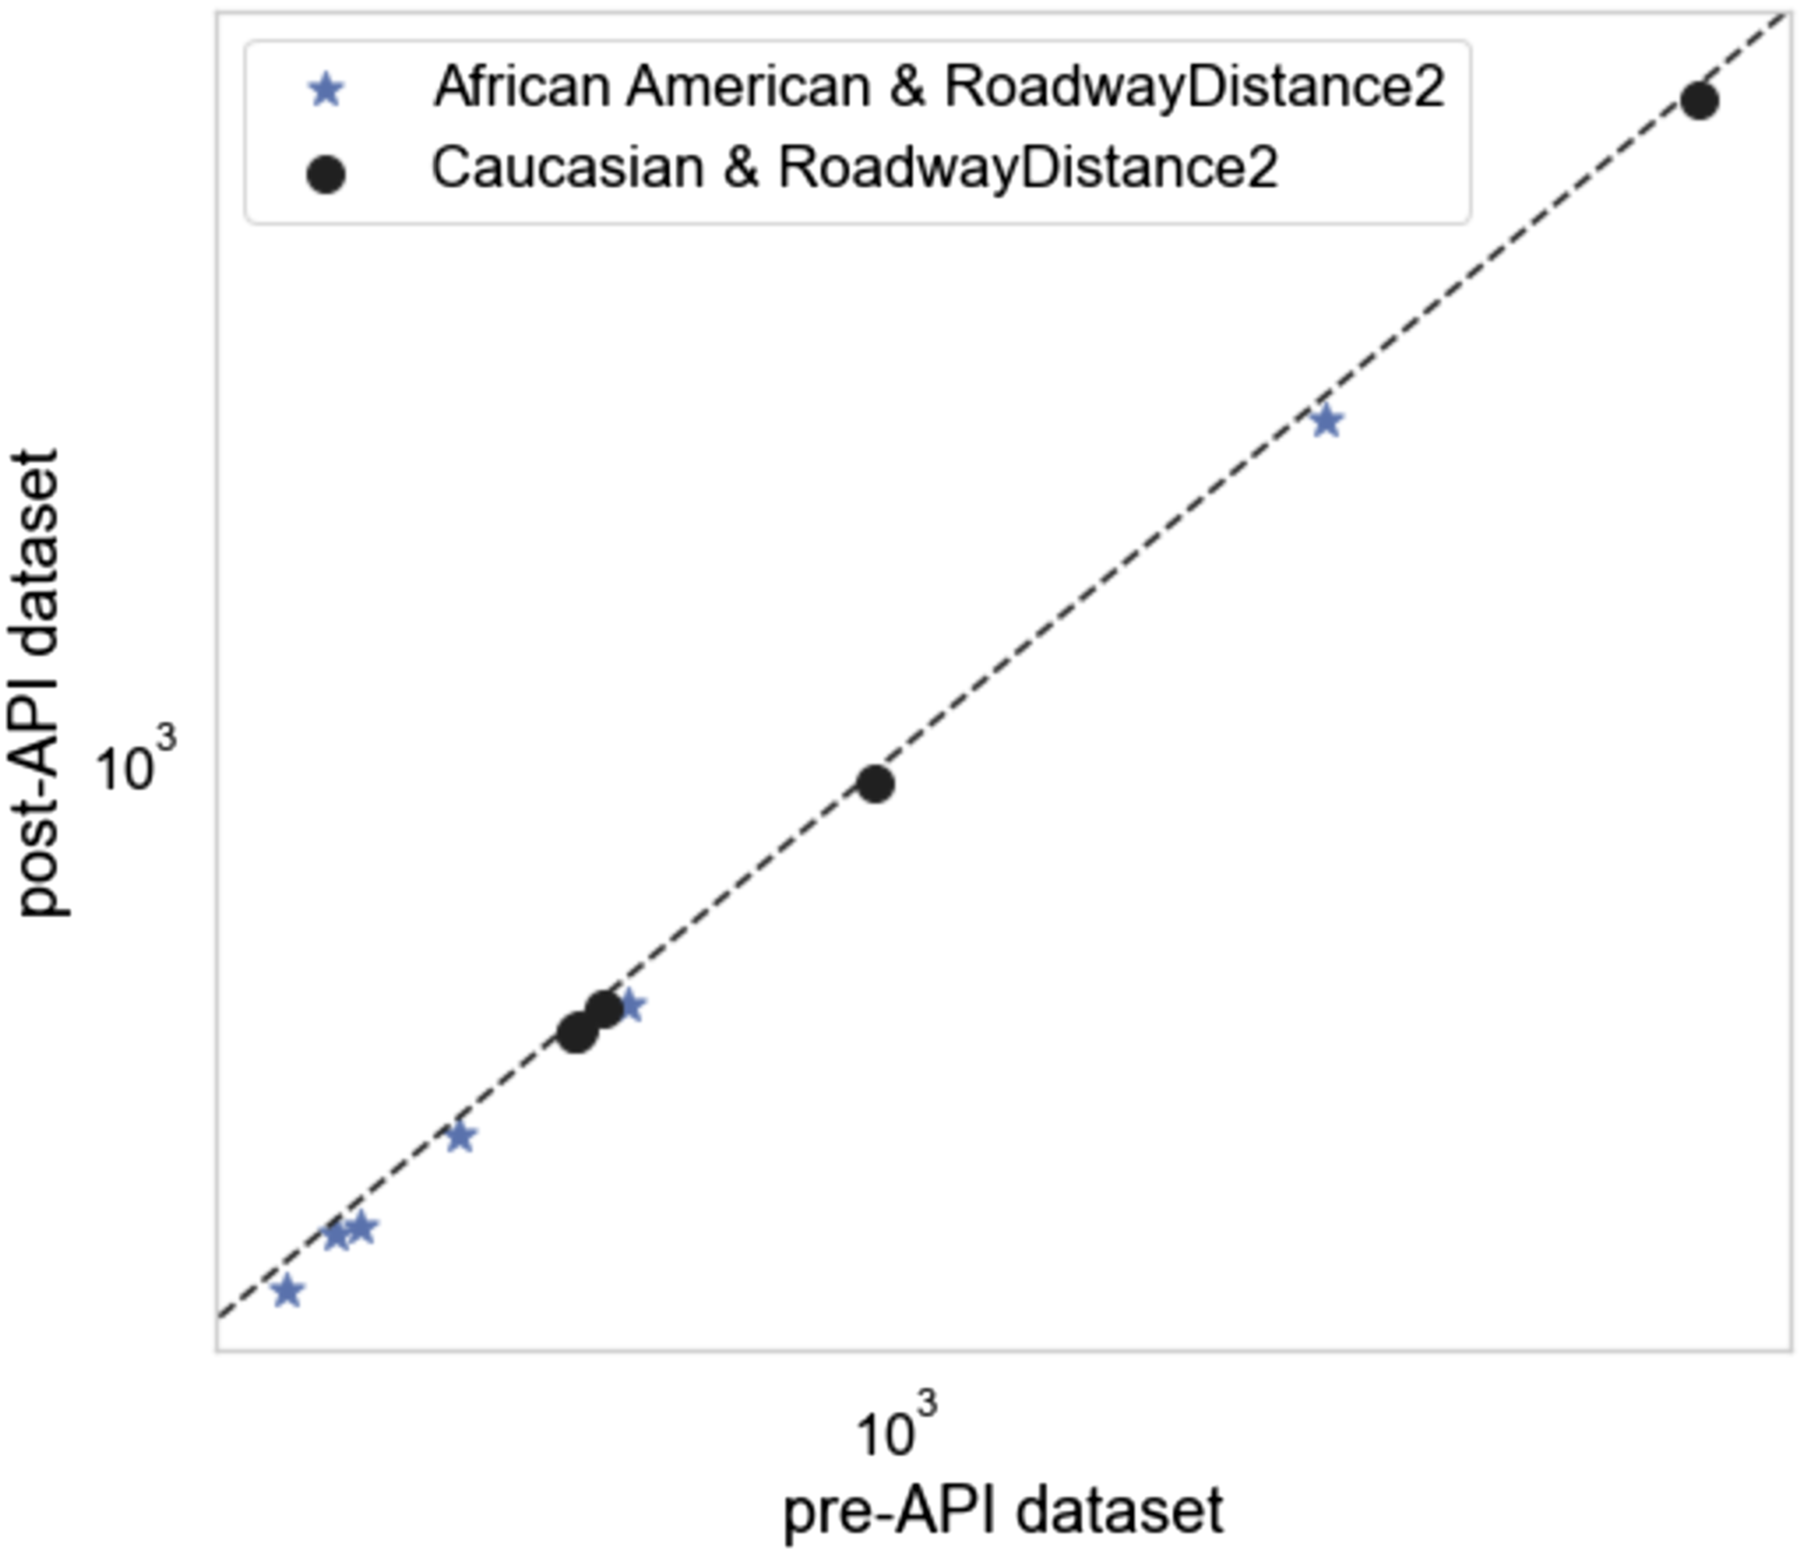
A Kullback-Leibler test was then applied to the pre-API and post-API 2 × 2 table for Race:RoadwayDistanceExposure2. The test showed a divergence of 0.00011, with a Chi Square test probability of 0.99, indicating that there was no divergence between the pre-API and post-API model output.
Discussion
We used the ICEES OpenAPI to generate a multivariate dataset and quantify data loss when compared to the constraint-free source data underlying the OpenAPI. We performed a comparative analysis of model robustness by applying a GLM model to the post-API versus pre-API datasets, using seven potential predictors of asthma exacerbations. Our comparative analysis included an examination of one-, two-, and three-way interactions for both pre-API and post-API model output. The purpose of the pre-API versus post-API comparative analysis was to: (i) evaluate the analytic impact of select feature variables on asthma exacerbations, as measured by annual ED or inpatient visits for respiratory issues; (ii) quantify and account for data loss; and (iii) determine if there is any divergence between pre-API and post-API model output.
Importantly, the ICEES OpenAPI prevents the creation of cohorts with ≤10 patients. 3 In the event that a user attempts to create such a cohort, the user receives an error message. This regulatory restraint may result in data loss when accessing the ICEES OpenAPI to generate a multivariate table. Thus, the multivariate table generated via the ICEES OpenAPI will not necessarily be identical to the multivariate table generated from the underlying, constraint-free source data. Moreover, when using the ICEES OpenAPI to generate multivariate datasets, the impact of this regulatory constraint will be cumulative, as the programmatic approach that is used entails iterative cohort generation, using an increasing number of feature variables with each iteration.
One way to understand the impact of data loss with the ICEES OpenAPI is to compare frequencies for the pre-API versus post-API datasets. After carefully assessing and comparing the pre-API and post-API datasets generated to answer a specific use-case question, we found that we lost approximately 6% of the pre-API data when accessing the data via the ICEES OpenAPI. Fecho et al. 2021 6 reported that data loss is generally <10% with the open multivariate approach, but with the potential for greater data loss, depending on the feature variables that are selected, their order, and several other considerations. A critical discussion on data loss can be found in Fecho et al. 2021. 6
When we applied a GLM to the pre-API and post-API datasets, we found that the main predictors of asthma exacerbations, estimated from the GLM model, were sex, race, prednisone, obesity, and PM2.5 exposure. These predictors were significant for both the pre-API and post-API model output. These results are consistent with Fecho et al. 6 and Lan et al. 9 Two additional interactions were significant for both the pre-API and post-API model output: sex x obesity and race x prednisone x obesity. Ten interactions were significant only for the pre-API model output, and six interactions were significant only for the post-API model output.
After fitting the GLM model to both the pre-API and post-API datasets, we found divergence in model output, in terms of the interaction terms for the pre-API versus post-API datasets. A closer examination of the divergence suggested that it was due to the imbalance in the frequency of obesity across racial categories. We chose to collapse race to focus only on African Americans and Caucasians, which together accounted for the majority of patients, and then refit and reevaluated the GLM model. The GLM model fit applied to the pre-API and post-API datasets with balanced race data (i.e., only African Americans and Caucasians) revealed little divergence in model output, apart from minor divergence in the model’s interaction terms. Thus, while regulatory constraints imposed on the ICEES OpenAPI, coupled with inherent data imbalances in EHR data, indeed do affect data loss and multivariate model robustness, the general approach we describe herein yields valid results. To minimize the likelihood of spurious results, users of the ICEES OpenAPI are encouraged to investigate possible class imbalances when fitting models with higher order interactions.
Limitations
While our results suggest minimal impact of the ICEES open multivariate functionality on model robustness, our findings have limitations that should be considered when interpreting the results. First, our pre- versus post-API analysis demonstrated that the data loss that is inherent in the ICEES open multivariate approach did not impact the main effects identified by the GLM. However, we did find an impact on model robustness when comparing two-way and higher interactions in the pre- versus post-API model results, although the impact was fairly minimal. Second, we focused our systematic analysis on GLM results, but we did not apply other statistical models or machine learning algorithms. We plan to repeat our analysis using other models and approaches such as causal inference analysis. Finally, we conducted our analysis using data derived from a single, large ICEES cohort on patients with asthma. We therefore do not know how generalizable our results are, in terms of applicability to other cohorts and smaller datasets. We plan to repeat our analysis using datasets derived from additional ICEES cohorts, including cohorts of patients with primary ciliary dyskinesia, drug-induced liver injury, and Long COVID syndrome.
Conclusions
In summary, the results from our comparative analysis of ICEES pre-API versus post-API datasets reveal similar predictors of asthma exacerbations and consistency with our prior results. We further show that datasets generated via the ICEES OpenAPI are generally reliable for exploratory multivariate studies, albeit with a certain amount of data loss and a potential for data imbalance that users should be aware of. Of relevance, we recently developed a preliminary theoretical framework to estimate data loss when applying the ICEES multivariate functionality. 20 We are now refining the framework and considering approaches for providing users with case-by-case estimates of data loss and model robustness to inform multivariate model development. In addition, we are expanding the current use of the ICEES OpenAPI to investigate predictors using longitudinal data and analytic approaches such as machine learning models and causal network analysis. Finally, we note that ICEES is disease-agnostic and currently supports asthma and several other use cases or cohorts. We plan to implement the analytic method presented in this study in other ICEES use cases.
Footnotes
Acknowledgements
The authors wish to acknowledge Stanley C. Ahalt, Director of the Renaissance Computing Institute, for his support and advice on the work described herein; David B. Peden for his expertise on the asthma use case; Emily Pfaff and James Champion for their help with the patient data; and Sarav Arunachalam, Stephen A. Appold, Alejandro Valencia Arias, and Lisa Stillwell for their help with the environmental exposures data.
Author Contributions
PSh prepared the first draft of the manuscript and conducted the analyses described herein; all authors contributed to the study design, assisted with interpretation of the results, reviewed the first draft of the manuscript, and approved the final submission.
Declaration of conflicting interests
The author(s) declared no potential conflicts of interest with respect to the research, authorship, and/or publication of this article.
Funding
The author(s) disclosed receipt of the following financial support for the research, authorship, and/or publication of this article: This study was supported by the National Center for Advancing Translational Sciences, National Institutes of Health (OT2TR003430, OT2TR003428, UL1TR002489, UL1TR002489-03S4, OT3TR002020).
Institutional Review Board Statement
The study procedures were approved by the Institutional Review Board at the University of North Carolina at Chapel Hill (protocol #16–2978).
Data Availability Statement
The ICEES asthma OpenAPI is freely available and can be accessed at https://icees-asthma.renci.org/apidocs [Permalink: https://perma.cc/7RWE-78JL]. The ICEES GitHub repository and software code can be found at: ![]() .
.