
Abstract
Epidemiology has made advances, thanks to the availability of real-time surveillance data and by leveraging the geographic analysis of incidents. There are many health information systems that visualize the symptoms of influenza-like illness on a digital map, which is suitable for end-users, but it does not afford further processing and analysis. Existing systems have emphasized the collection, analysis, and visualization of surveillance data, but they have neglected a modular and interoperable design that integrates high-resolution geo-location with real-time data. As a remedy, we have built an open-source project and we have been operating an open service that detects flu-related symptoms and shares the data in real-time with anyone who wants to built upon this system. An analysis of a small number of precisely geo-located status updates (e.g. Twitter) correlates closely with the Google Flu Trends and the Centers for Disease Control and Prevention flu-positive reports. We suggest that public health information systems should embrace an open-source approach and offer linked data, in order to facilitate the development of an ecosystem of applications and services, and in order to be transparent to the general public interest.
Keywords
Introduction
Contagious outbreaks may occur at any time and have the potential to cause serious illness, death, and economic downturn. Rapidly recognizing and responding to these pandemics and emerging diseases are public health priorities and might be facilitated by health informatics. News reports, search engines keywords, and social media have been credited with decreasing the detection lag. In particular, the diffusion of smartphone technology provides new opportunities for implicit or explicit self-reporting with the benefit of accurate geo-location data. The goal is to build interoperable and distributed systems that can detect symptoms early and expose results with linked data. The term linked data refers to interlinked structured data on the Web. The general idea behind linked data is the increase in usefulness and value of data interlinked with data from other sources. Linked data allow data sources to be crawled by search engines and enable links between data from different sources.
There are several health information systems that search through online information sources (e.g. news reports, search engine keywords) and social media (e.g. Facebook, Twitter) to identify contagious outbreaks. The aim of these systems is to provide public health stakeholders with real-time, geo-located data about viral diseases, such as the seasonal flu. Many of those systems are generic to epidemics, but there has also been a focus on influenza-like illness (ILI). Influenza or flu is a viral infection that affects mainly throat, nose, bronchi, and occasionally lungs. It is considered as one of the most common infections in human beings. The seasonal flu is a major public health concern, causing many respiratory illnesses and deaths worldwide each year. 1 Early detection of disease activity, when followed by a rapid response, can reduce the impact of both seasonal and pandemic influenza.2,3 The symptoms are so common that self-diagnosis of influenza is normal among the general public and clinical diagnosis.
Flutrack.org (http://www.flutrack.org) gathers flu-related tweets using the Twitter Application Programming Interface (API). 4 The words used as tags are influenza synonyms and flu symptoms such as sore throat, cough, and fever. The data are localized and visualized every 20 min. The unique features of Flutrack.org are the real-time linked data and the availability of the source code. These open attributes make the proposed service an ideal tool for extracting linguistic features and along with machine learning, for achieving accurate automatic recognition of a patient’s deteriorating symptoms and worsening conditions during flu infection.
Related work
The detection of ILI online or in social media has been growing due to the diffusion of Internet and usable terminal devices, such as the smartphone. According to Kass-Hout and Alhinnawi, social media are not yet completely understood, 5 but they hold great potential for early detection and response to contagious diseases. There are two approaches in the study of contagious diseases on social media: (1) text filtering and (2) social network analysis. Text filtering has been employed widely in previous work for ILI detection,4,6–12 and it has been established to have high correlation to the verified reports from the institutes of national health. The main drawback of text filtering research has been that it has been based on snapshots of ILI data and the researchers have employed custom tools in their analysis. Nevertheless, ILI is an evolving phenomenon and it would be worth to build directly upon the work of previous researchers.
In addition to text filtering, another important feature in public health information systems is the geographic dimension. 13 Moreover, Waller and Gotway 14 have provided data analysis techniques with a special focus on epidemiology and geographic data. Robinson et al. 15 have highlighted the importance of geographic information systems (GIS) in epidemiology and provided usable tools that make GIS more accessible. Moreover, geo-location might be combined with social network analysis, which has already indicated that contagious diseases spread rapidly through networks of friends. 16 Therefore, an important criterion for the classification of public health information systems should be the ability to organized data according to geography.
Notably, the role of geographic analysis and open data has been celebrated in the book ‘The Ghost Map’, 17 which has emphasized that the key to stopping the 1854 cholera outbreak in London was the representation of data on a geographic map. John Snow 18 (15 March 1813–16 June 1858) is considered to be one of the fathers of epidemiology, in part, because of his work in tracing the source of a cholera outbreak in Soho, London, in 1854. Interestingly, John Snow had been trying for years to convince the authorities about his theory, but it was only later when he managed to collect the data on death locations with the help of a well-networked local priest that the evidence was clear (Figure 1).
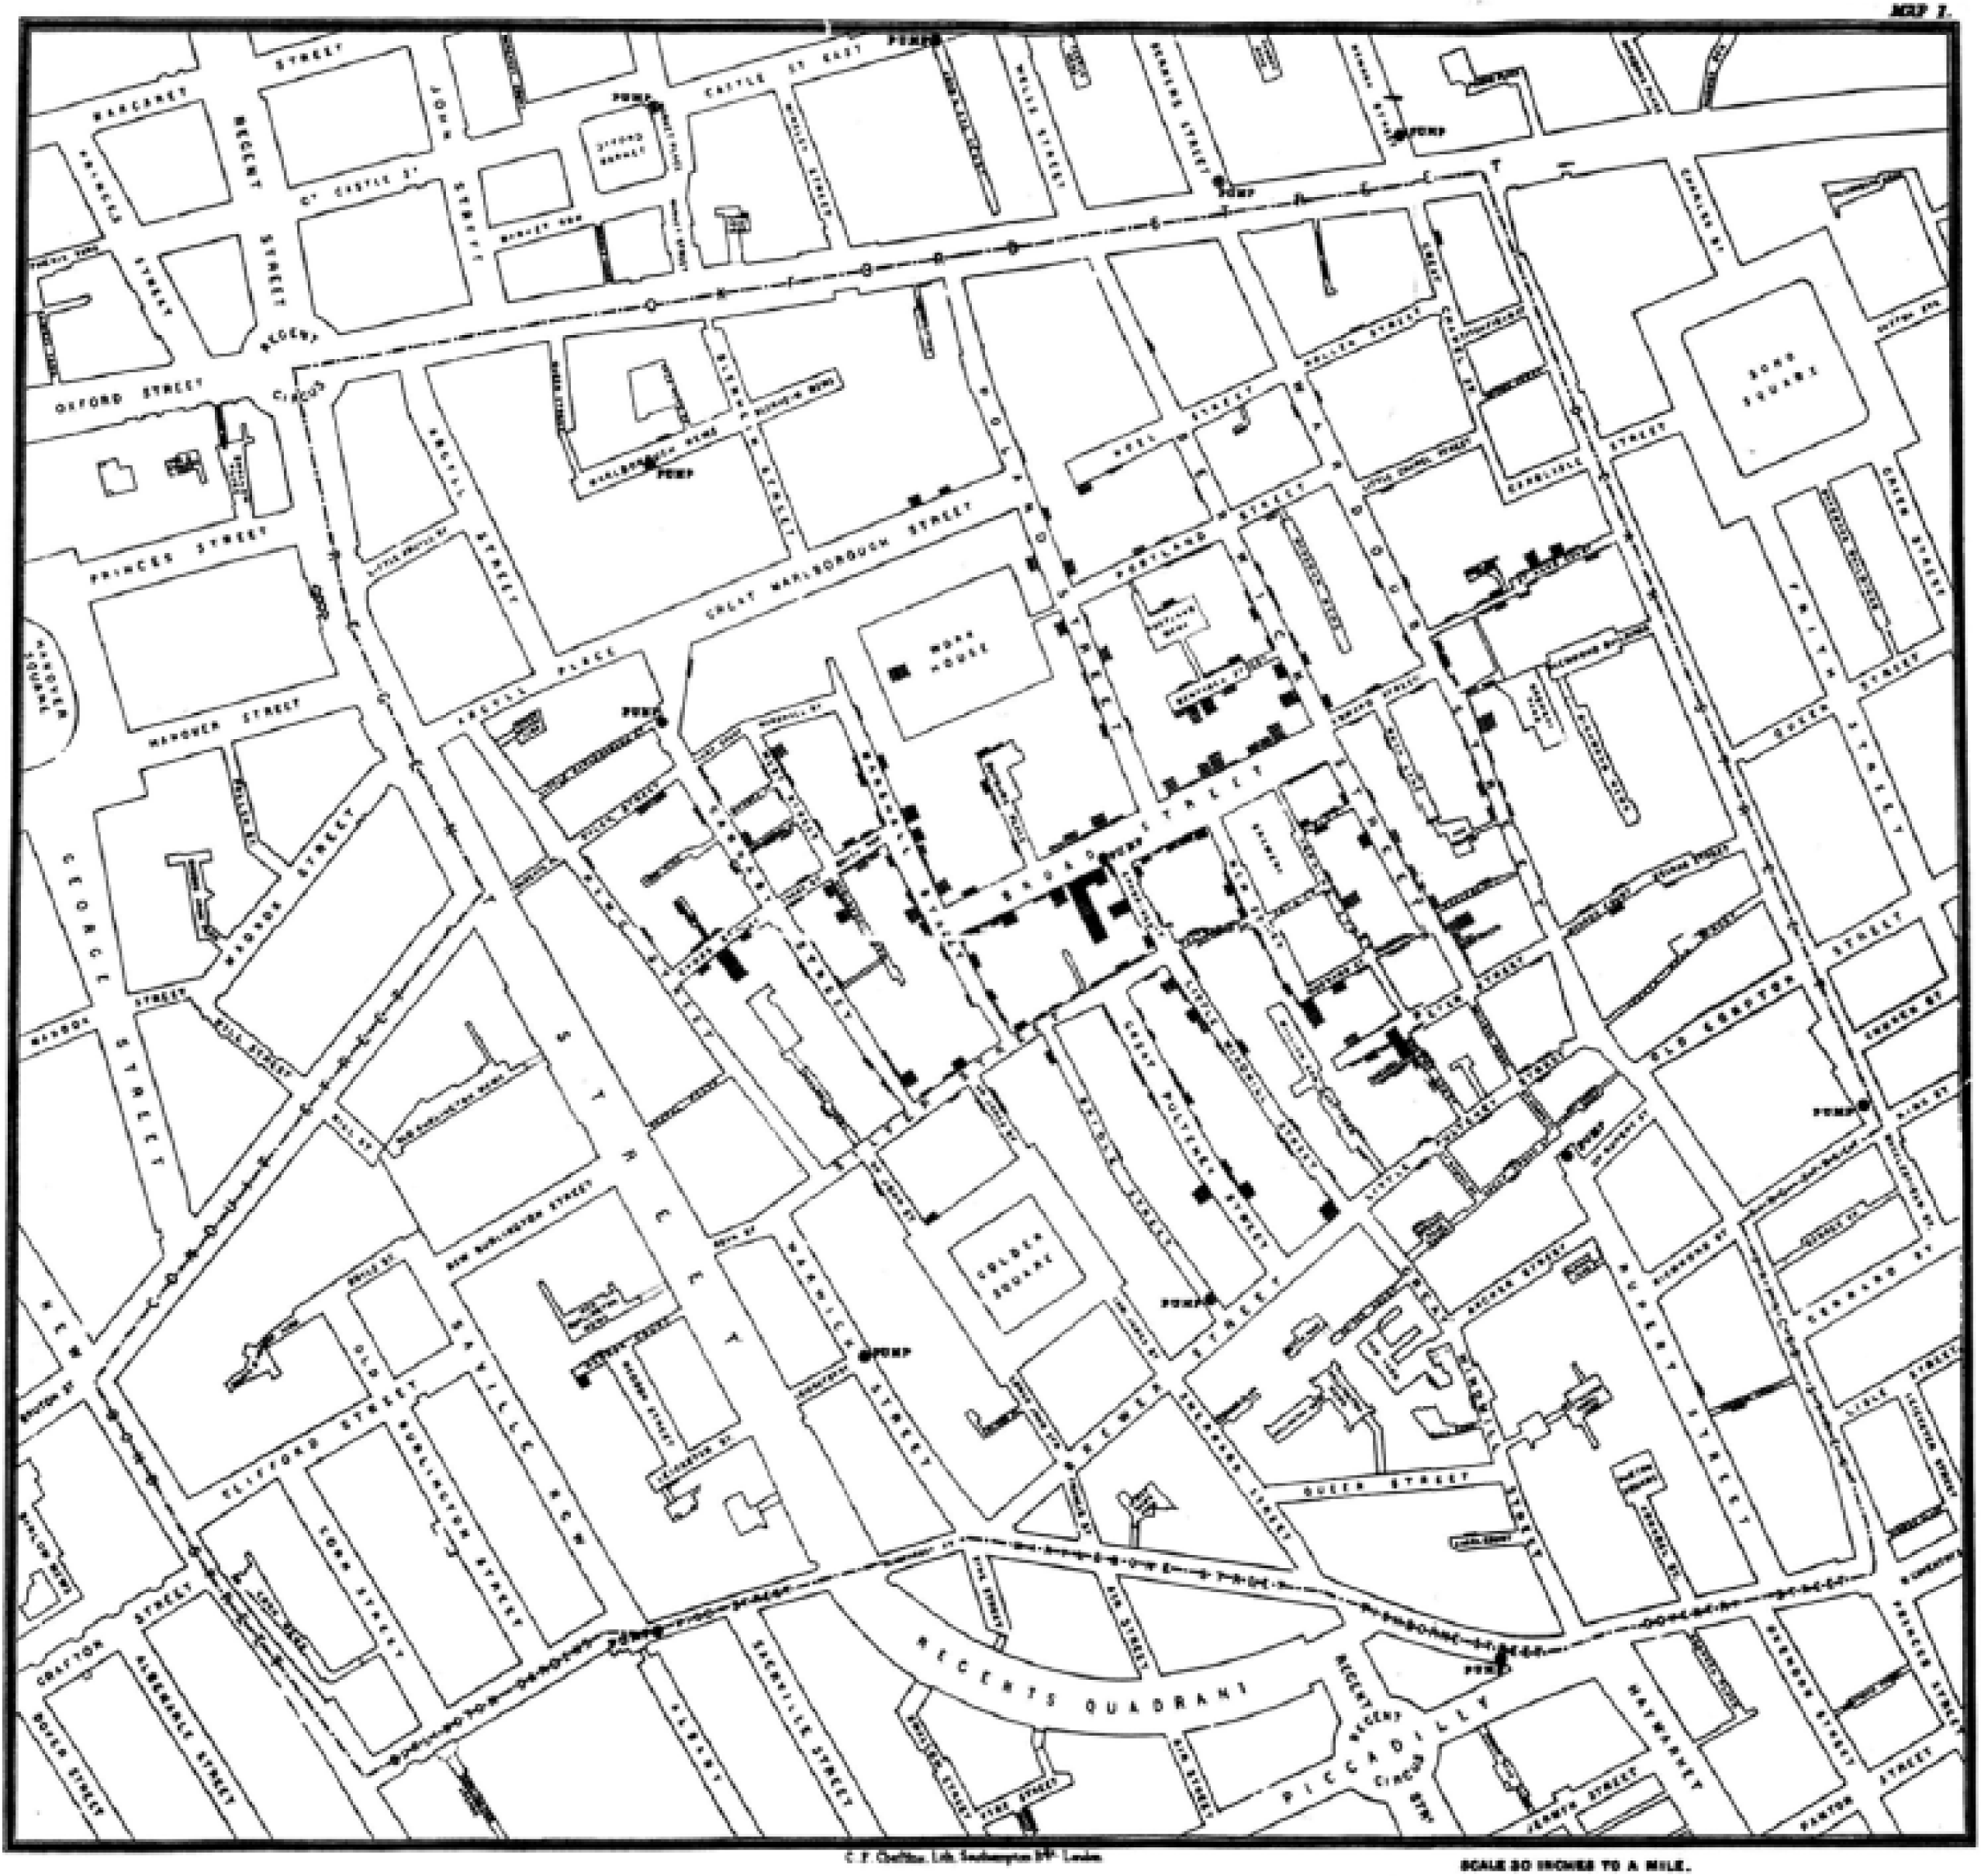
Epidemiology has been born and developed, thanks to high-resolution geographic data about contagious diseases (e.g. Cholera outbreak in 1854 London).
There are many health informatics applications that visualize flu-related data using mapping techniques. Flutracking 19 is an Australian health information service, which is based on weekly reports collected through an online survey form that is filled-in by thousands of volunteers (more than 18,000 participants as of year 2013). It provides a map-based visualization (Figure 2) of high-quality data, which has been submitted by participants who have opted-in to report influenza-like symptoms. The MappyHealth 20 application searches Twitter for posts related to diseases, including influenza, and visualizes them in a worldwide scale (Figure 2). It also provides various data export formats, but they are only in aggregate form, which is not usable for further post-processing. Germtracker 21 provides a map visualization of high-resolution geo-located tweets that contain words related to germs, such as influenza. Nevertheless, instead of elaborate language filtering for false positives, Germtracker asks the user of the web application (Figure 2) to provide feedback on whether the tweet stands for a sick person. It is based on support vector machine (SVM) classifiers, 22 which filter tweets for relevance. The website asks people to mark false-positive tweets in order to create more training data for these classifiers. Although this was an innovative project, it is neither available online anymore (by the time this article was written: October 2014) nor open source to really assess its approach.
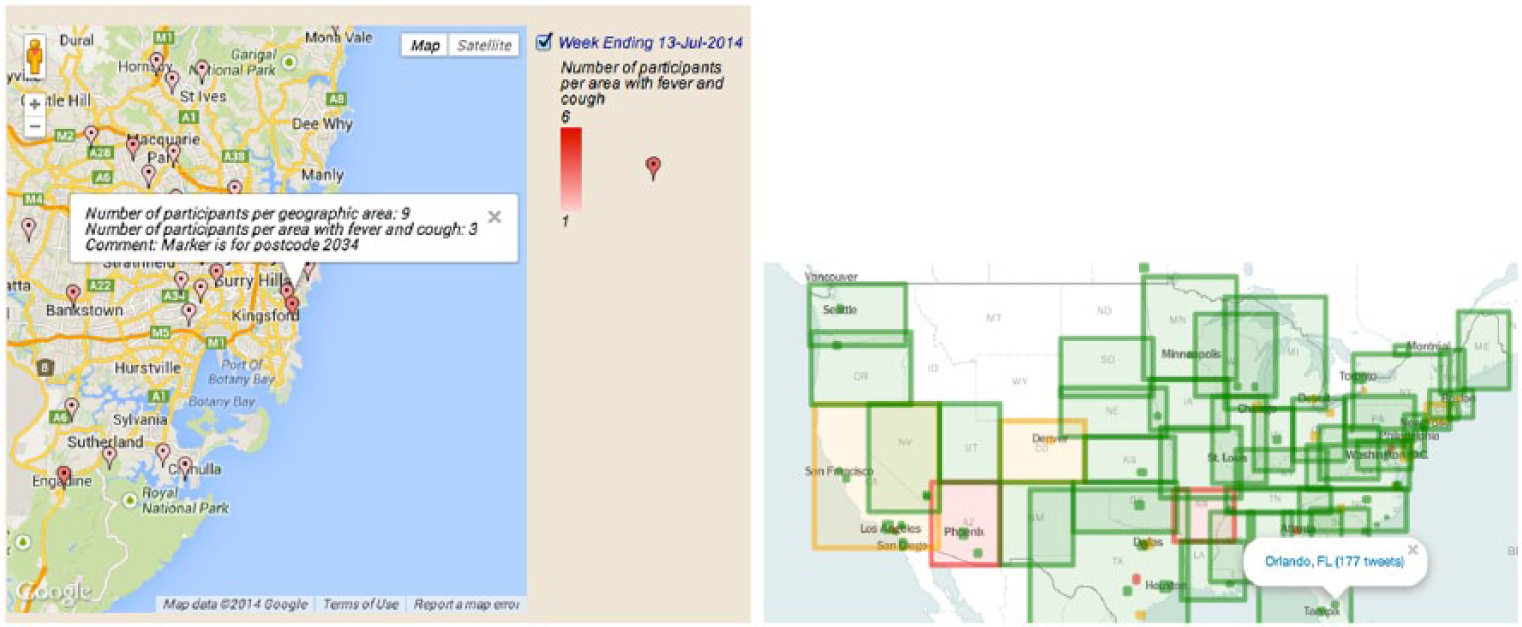
Flutracking (left) provides cumulative map visualization of flu-related symptoms, which are collected weekly through an online survey. MappyHealth (right) is based on twitter data, which are presented on map at the region and city levels.
The Google Flu Trends 23 system monitors the flu activity of some countries and regions based on aggregated search queries from Google search engine. The algorithm that filters the search queries have been validated through comparison with historic influenza data from the Centers for Disease Control and Prevention (CDC). In addition, Google Flu Trends uses IP address information from Google servers logs to make a best guess about where queries originated (Figure 3). 24
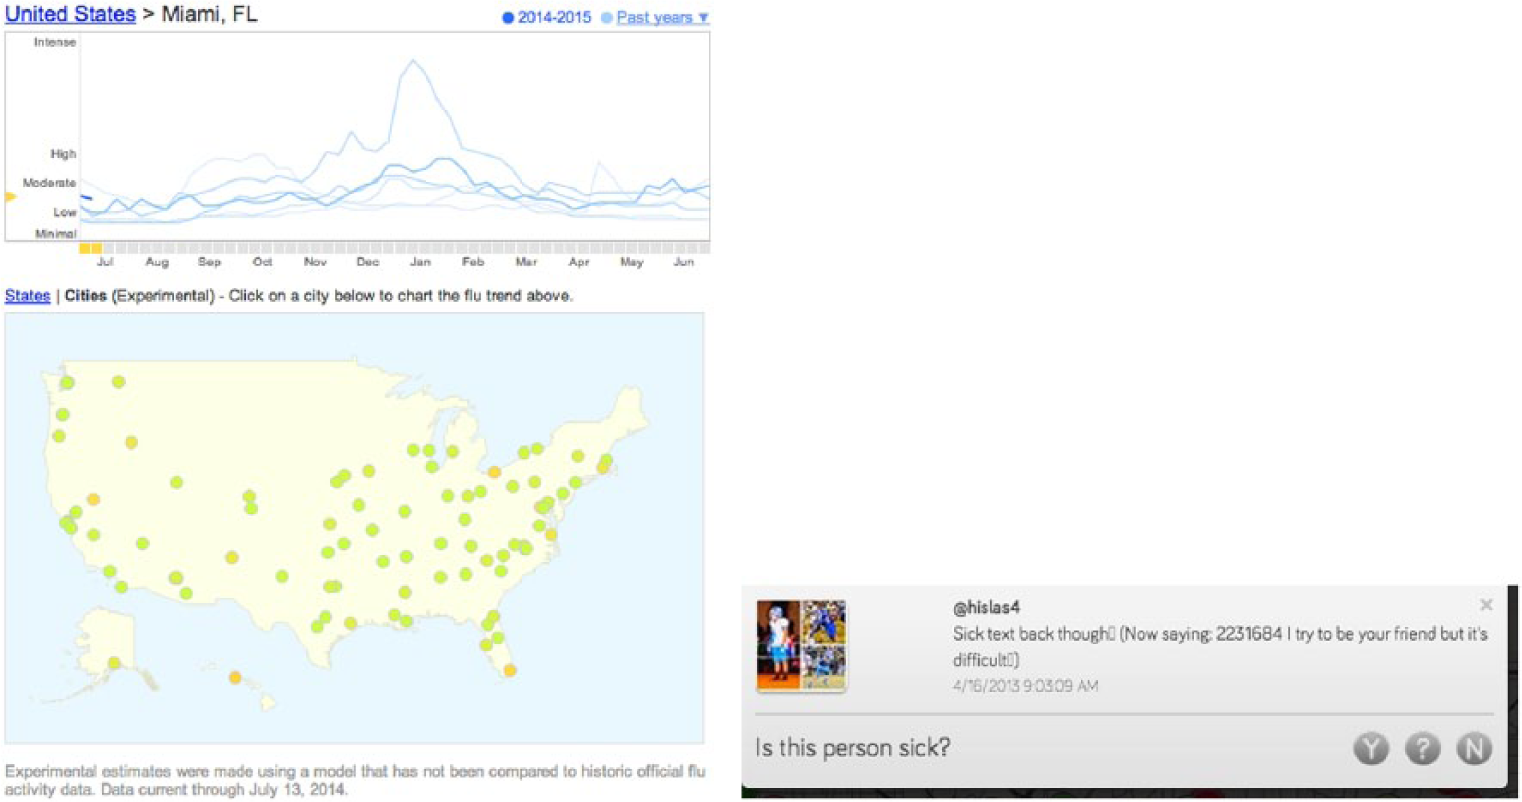
Flu Trends (left) provides a time series and a map visualization at the city level. Germtracker (right) provides high-resolution geo-location and the potential to mark the tweet as positive or not.
HealthMap 25 is a very comprehensive system, 26 because it has been collecting and aggregating data from many sources (official reports and online news) since the year 2007. Nevertheless, the main shortcoming of HealthMap is that it does not expose this wealth of data. Moreover, another issue with HealthMap is that it does not offer access to its source code, which is important for other stakeholders before they consider adopting it. Overall, there are many public health informatics systems that are trying to fulfil a similar need, but there is no comparison between them, which would also facilitate a strategy for improving existing systems and approaches (Figure 4).
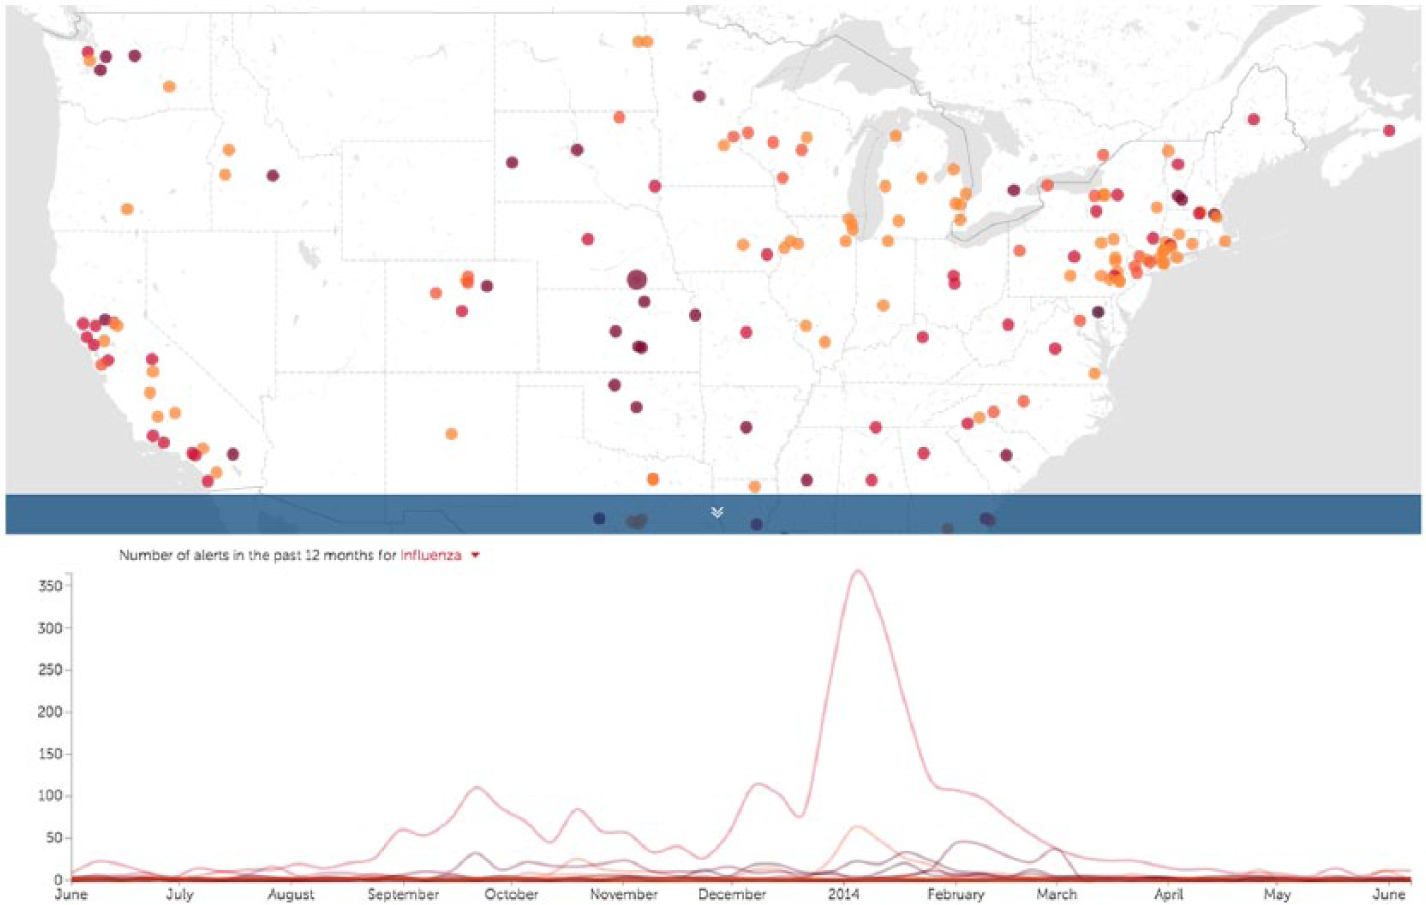
HealthMap is collecting data from many sources (official reports, as well as news), which are visualized on a map at the city level.
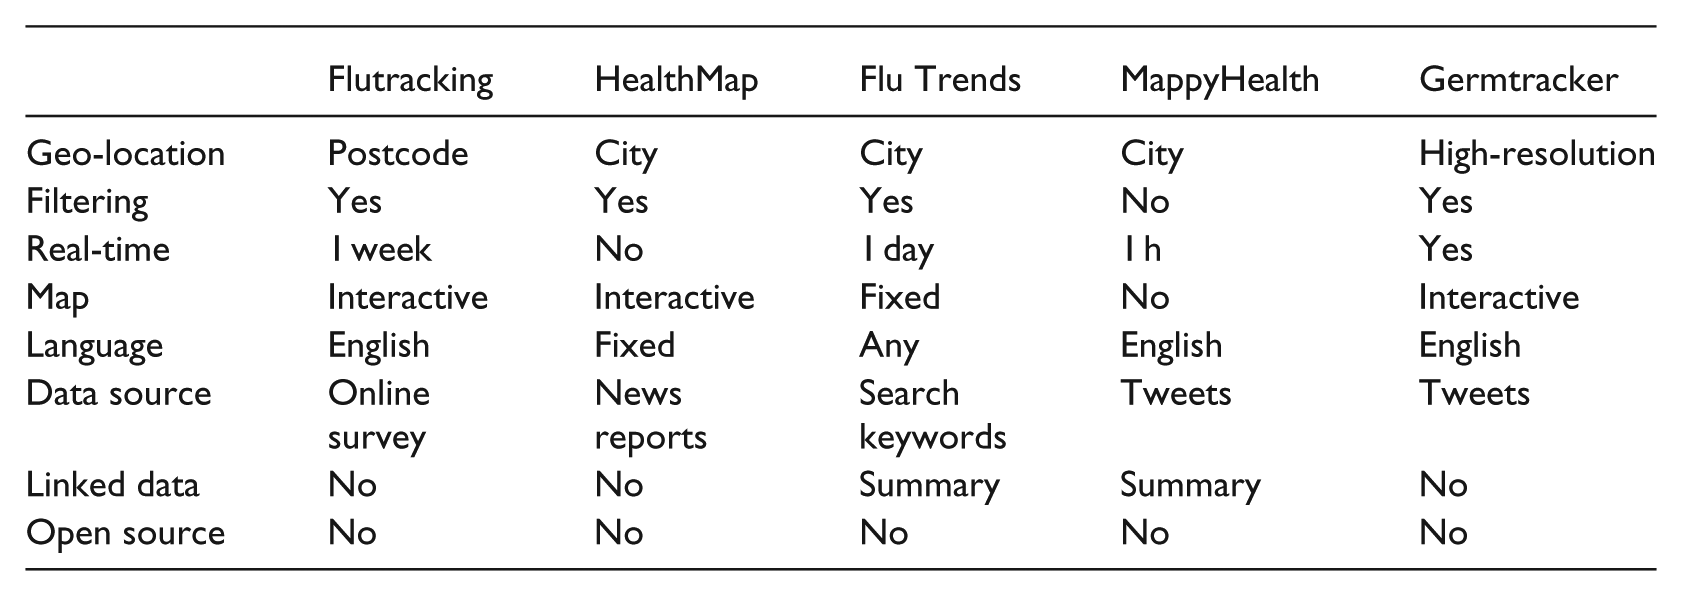
There is no standard way for comparing health information systems, but there are some previous approaches that can be considered. According to Lyon et al., 27 the most important criteria in the comparison of ILI information systems are as follows: (1) information volume, (2) their information overlap, (3) timeliness, (4) sources, (5) languages, and (6) geographical regions. According to Jonhson, 17 the key to stopping the cholera outbreak in London was the collection of data and the accurate geo-location of deaths around the contaminated pump. Thus, another requirement for health information systems in epidemiology is high-resolution geo-location and linked data. In this way, we suggest that the following criteria should apply in the comparison of public health information systems:
In summary, we found that despite the interest and the efforts in detecting symptoms online, the research methods have been developed in separation to the respective systems. In particular, there are a growing number of research results that link actual disease with online activity and there are also a growing number of systems that visualize online report. The main shortcoming of the former is that they have based their analysis on a snapshot of online status updates. In terms of system design, the main issue with the latter is that there is no open-source system and that none of the systems analysed offered linked data. In terms of end-user design, the existing public health informatics systems lack a combination of real-time, high-resolution geo-location, and language filtering of false positives.
Design
According to the related work, the main challenges of flu information systems are as follows: (1) open-source and real-time linked data, (2) linguistic filtering, and (3) high-resolution visualization of geo-location. Therefore, our challenge was to develop a system that collects data related to influenza epidemics and filter and visualize them in real-time. In addition to the visualization, the system would focus on linguistic analysis in order to provide an accurate detection of influenza outspread. Notably, the source code and the extracted/filtered data would be accessible to everyone in order to gain knowledge about flu detection, or even transform and expand our project.
Open-source and linked data
Flu differs from the common cold, because it is caused by a different group of viruses and symptoms, which tend to be more severe and last longer. 28 Infection usually lasts for about a week and is characterized by sudden onset of high fever, aching muscles, headache and severe malaise, non-productive cough, sore throat, and rhinitis. Symptoms usually peak after 2 or 3 days. Although the accurate identification of flu requires laboratory confirmation, a small number of symptoms such as cough and fever are highly correlated with flu. 1
Twitter, a micro-blogging service, has an estimated community of millions of active users, who generate billions of short messages every year. Twitter users are enabled to send and read each other’s 140-character messages, called tweets. Despite the high level of noise, the twitter stream contains useful information and it has proven useful for tracking or even forecasting trends, moods, or behaviour if it can be extracted in an efficient manner. Furthermore, Twitter has been used as real-time source for various public health applications (e.g. MappyHealth, Germtracker).
Flutrack.org examines Twitter data using the Twitter API. It gathers flu-related tweets from the entire world, with searching tag, words that are influenza synonyms and flu symptoms. The tags that being tracked are influenza, flu, chills, headache, sore throat, runny nose, sneezing, fever, dry cough. For every tweet extracted, the additional amount of metadata is extracted too. Some of them are used for sorting the tweets in the database and other, such as geo-location coordinates, for mapping the tweets. For displaying tweets, Flutrack exports a JSON file every 20 min, which contains tweets from the last 7 days. Notably, the front-end of the Flutrack.org system consumes the same JSON data feed that is open to anyone for access and analysis (Figure 5).
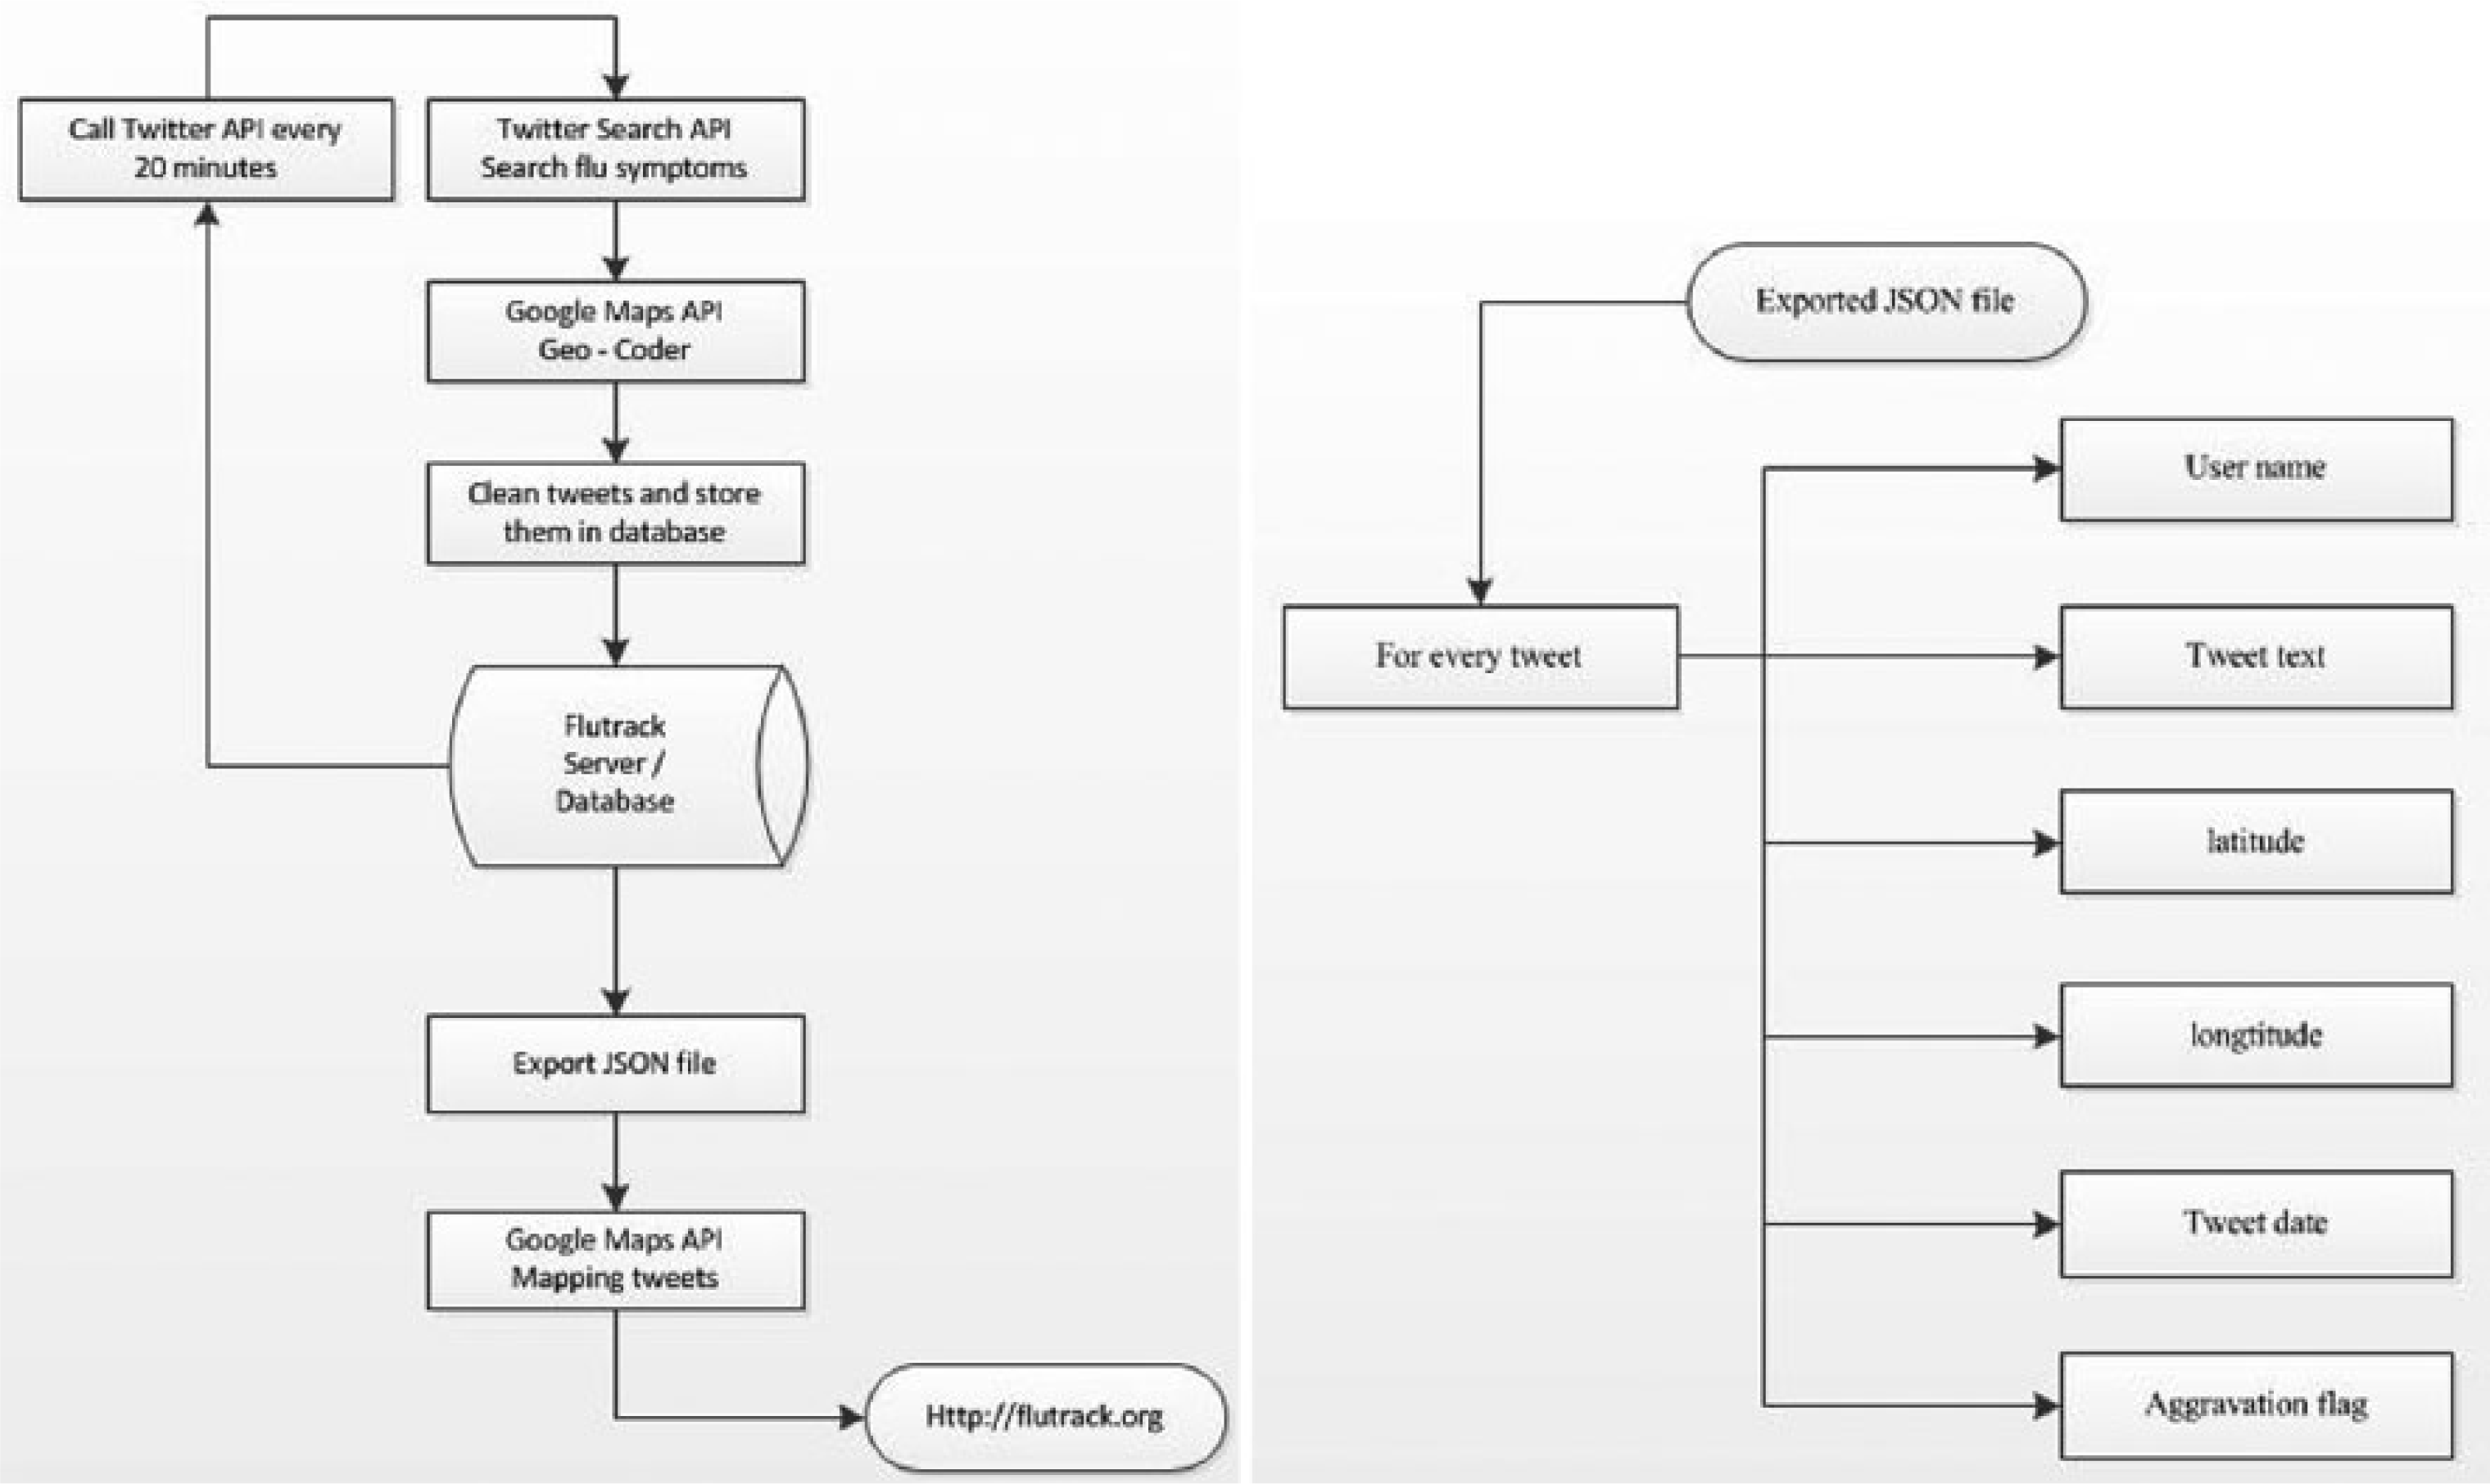
Flutrack.org flowchart (left) and data model (right).
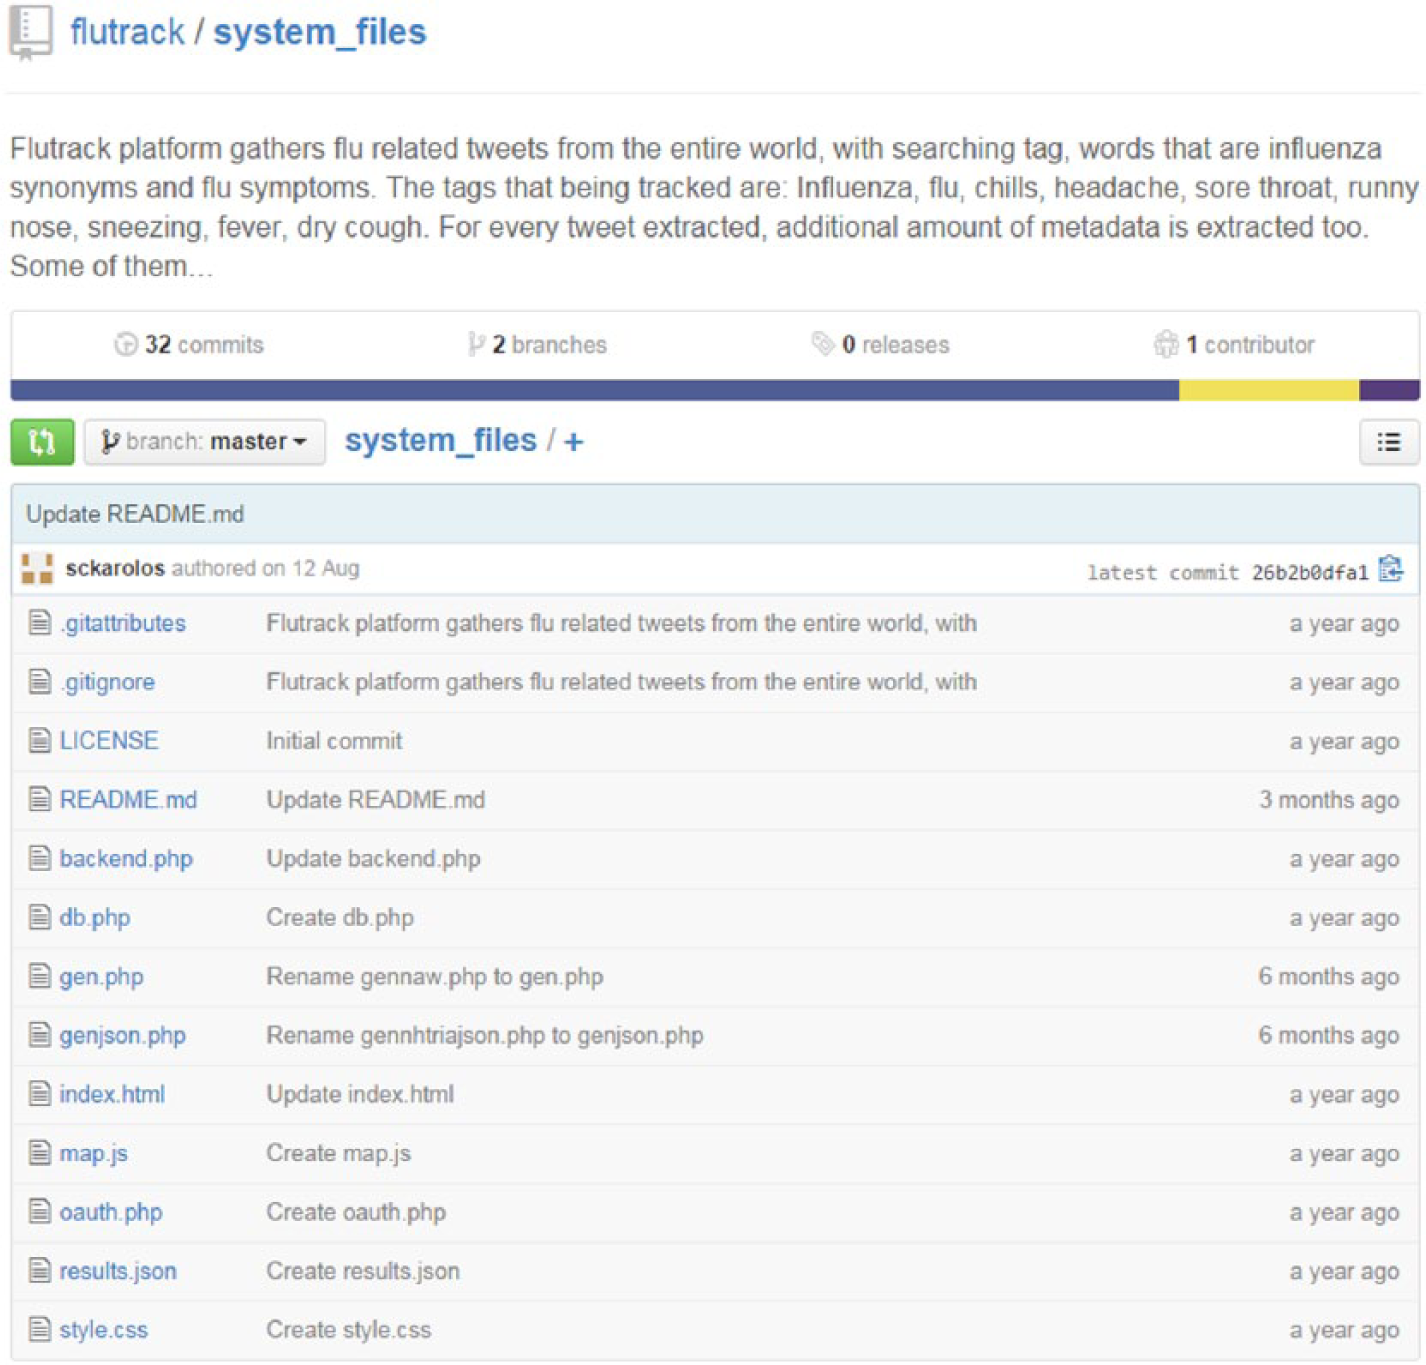
Flutrack.org source code is hosted on Github and it is available for inspection and improvement by the public.
In summary, Flutrack’s platform architecture is based on modularity and linked data. The PHP programming language is used for calling Twitter API, while JSON and Javascript for visualizing the tweets. The call requests are repeated periodically using the ‘cron’ job scheduler. Finally, the system (back-end data collection, web-app) is hosted at http://flutrack.org (Figure 8).
An API enables user to access a website’s data without going near its databases. Flutrack’s data are provided to every user via a simple JavaScript Object Notation (JSON) call. JSON is a lightweight, easy, and popular way to exchange data. In order to facilitate users, Flutrack’s API sorts and exports tweets according to flu symptoms, date and time, and limit of tweets number (Figure 7).
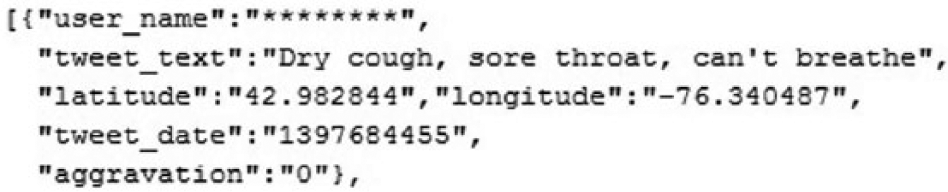
JSON for a positive geo-located tweet.
API users have been enabled to submit requests to Flutrack’s current and archival data. The AND and OR operators are being supported for creating more complex queries. For example, if a user searches for tweets that contain the flu symptoms fever and cough, the corresponding request should be ‘http://api.flutrack.org/?s=feverANDcough’. For the rest of the API choices, the same method should be used.
Linguistic filtering
Tweets having less than five characters and those containing non-American Standard Code for Information Interchange (ASCII) characters are also excluded. In addition to the basic linguistic filtering described above, a further filtering process is used to define which tweet post is referring to an influenza-infected user or not (flu-positive/negative). Consider the following tweet examples:
Flu-positive: ‘I’m definitely sick. Bad flu, cough, sore throat, fever & headache’.
Flu-negative: ‘Fever cough diarrhoea upset stomach joint aches headache … I lost my appetite’.
In the first case, the tweet contains the most common flu-related symptoms caused probably by an influenza virus. As a result of this, this tweet will be tagged as flu-positive and will be stored in the database. In the second case, we have employed a simple dictionary containing terms, symptoms, and expressions such as diarrhoea, vomit, and stomach aches. If a tweet contains the non-flu-related symptoms ‘diarrhoea’ and ‘stomach aches’, it is tagged as flu-negative. Although some kinds of flu may involve symptoms such as upset stomach, or vomiting and diarrhoea, the possibility of a different virus infection is very high. The infection could have been caused by food poisoning or gastroenteritis. Gastroenteritis is often called a ‘stomach flu’ although it is not caused by influenza. 28
The current implementation of the system employs a dictionary and simple rules to filter twitter messages. Future extensions of the system might employ more advanced classification techniques, or machine learning approaches, 29 but the main focus of the Flutrack system is on open source and open data, which are significant features for public health information system.
High-resolution geo-location
Only geo-located tweets or tweets that their geo-location is extracted from the user’s profile location (self declared home location) are being saved to the database. Twitter offers the choice of stating one’s address. It is only when a tweet’s coordinates are not given, the tweet is not posted by mobile device, or location services (enabled by default) are disabled, that profile location declared by the user is used as geo-location, which is filtered by a dictionary. Locations containing ‘suspicious’ words (home, heaven, hell, sky, etc.) are discarded, in order to avoid false or non-existing location coordinates. If enough location information is not available, even flu-positive tweets are automatically rejected, because geo-location has high importance in epidemiology (Figure 8).
Flu-related tweets in United Kingdom on 11 January and 26 March 2014 show that symptoms are milder towards the end of the seasonal flu.
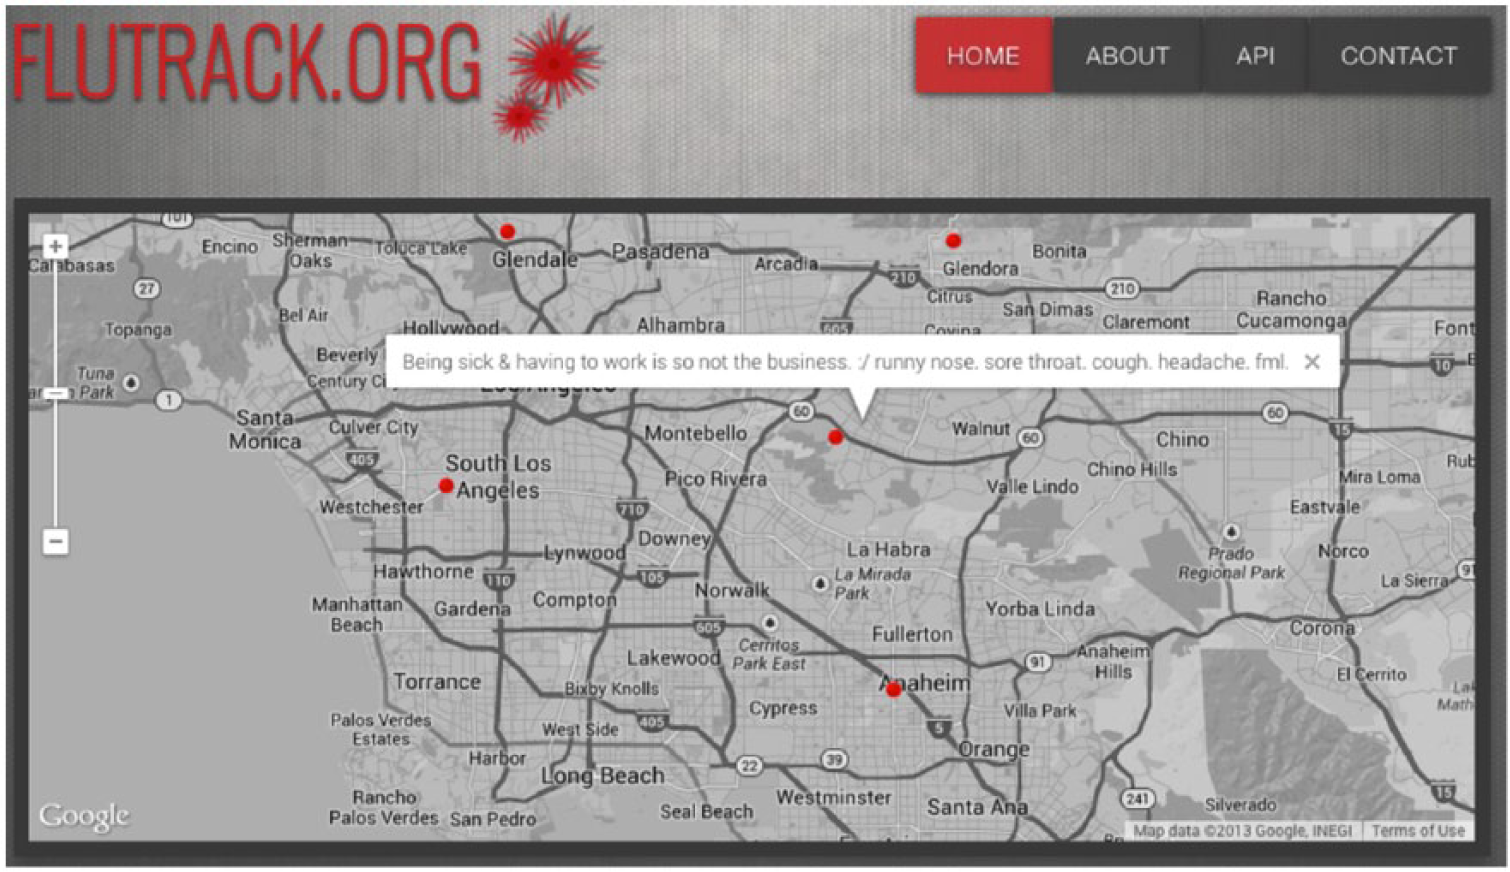
Upon completion of the above procedure, tweets are visualized and updated regularly (every 20 min). New tweets are pinned in a worldwide map. Flutrack users can navigate on a map in order to examine where the tweets were exactly posted. Visuals are displayed on a styled Google map, free of unnecessary information and (upon permission by the user) centred around the location of the Flutrack user, as reported by the user terminal device (Global Positioning System (GPS) or WiFi location). Geo-location extracted by the user’s router or mobile device has an accuracy of 0–20 m. The system displays tweets that are up to 7 days old, because this is the average duration of flu symptoms. Moreover, the users can interact directly with the map by selecting and reading the anonymized tweets, in order to get a more detailed sense of the symptoms.
Data validation
To evaluate the accuracy of the data collection and filtering process, we performed a correlation analysis between Flutrack and Google Flu Trends and another one between Flutrack and CDC. The data were geo-located in the United States and were extracted from 2 December 2012 to 7 April 2013. The location was chosen based on the fact that the query counts of CDC come from the United States. The scatter plot of the normalized population of data from Google Flu Trends and Flutrack platform is plotted. For the second plot, we used the CDC cases that were positive to influenza, rather than using all tested cases. It can be seen that there is a clear linear relation between two populations indicating the robustness of our platform in correctly following users’ posts. In order to quantify the degree of the observed linear relation between the normalized uploads of the two social media, a linear regression analysis is performed. In the figures below, the least square line is depicted where the corresponding coefficient of determination is estimated to be 0.79 and 0.82, respectively, thus showing a high degree of correlation between Google Flu Trends, CDC, and our platform (Figure 9). The main focus of this research has been on the validation of the software system (Figure 10) according to important features that are not available in existing public health information systems, such as open source and open data. Nevertheless, future versions of the system should be improved with regard to the Natural Language Processing (NLP) component, as well as evaluated against similar NLP approaches in related work.
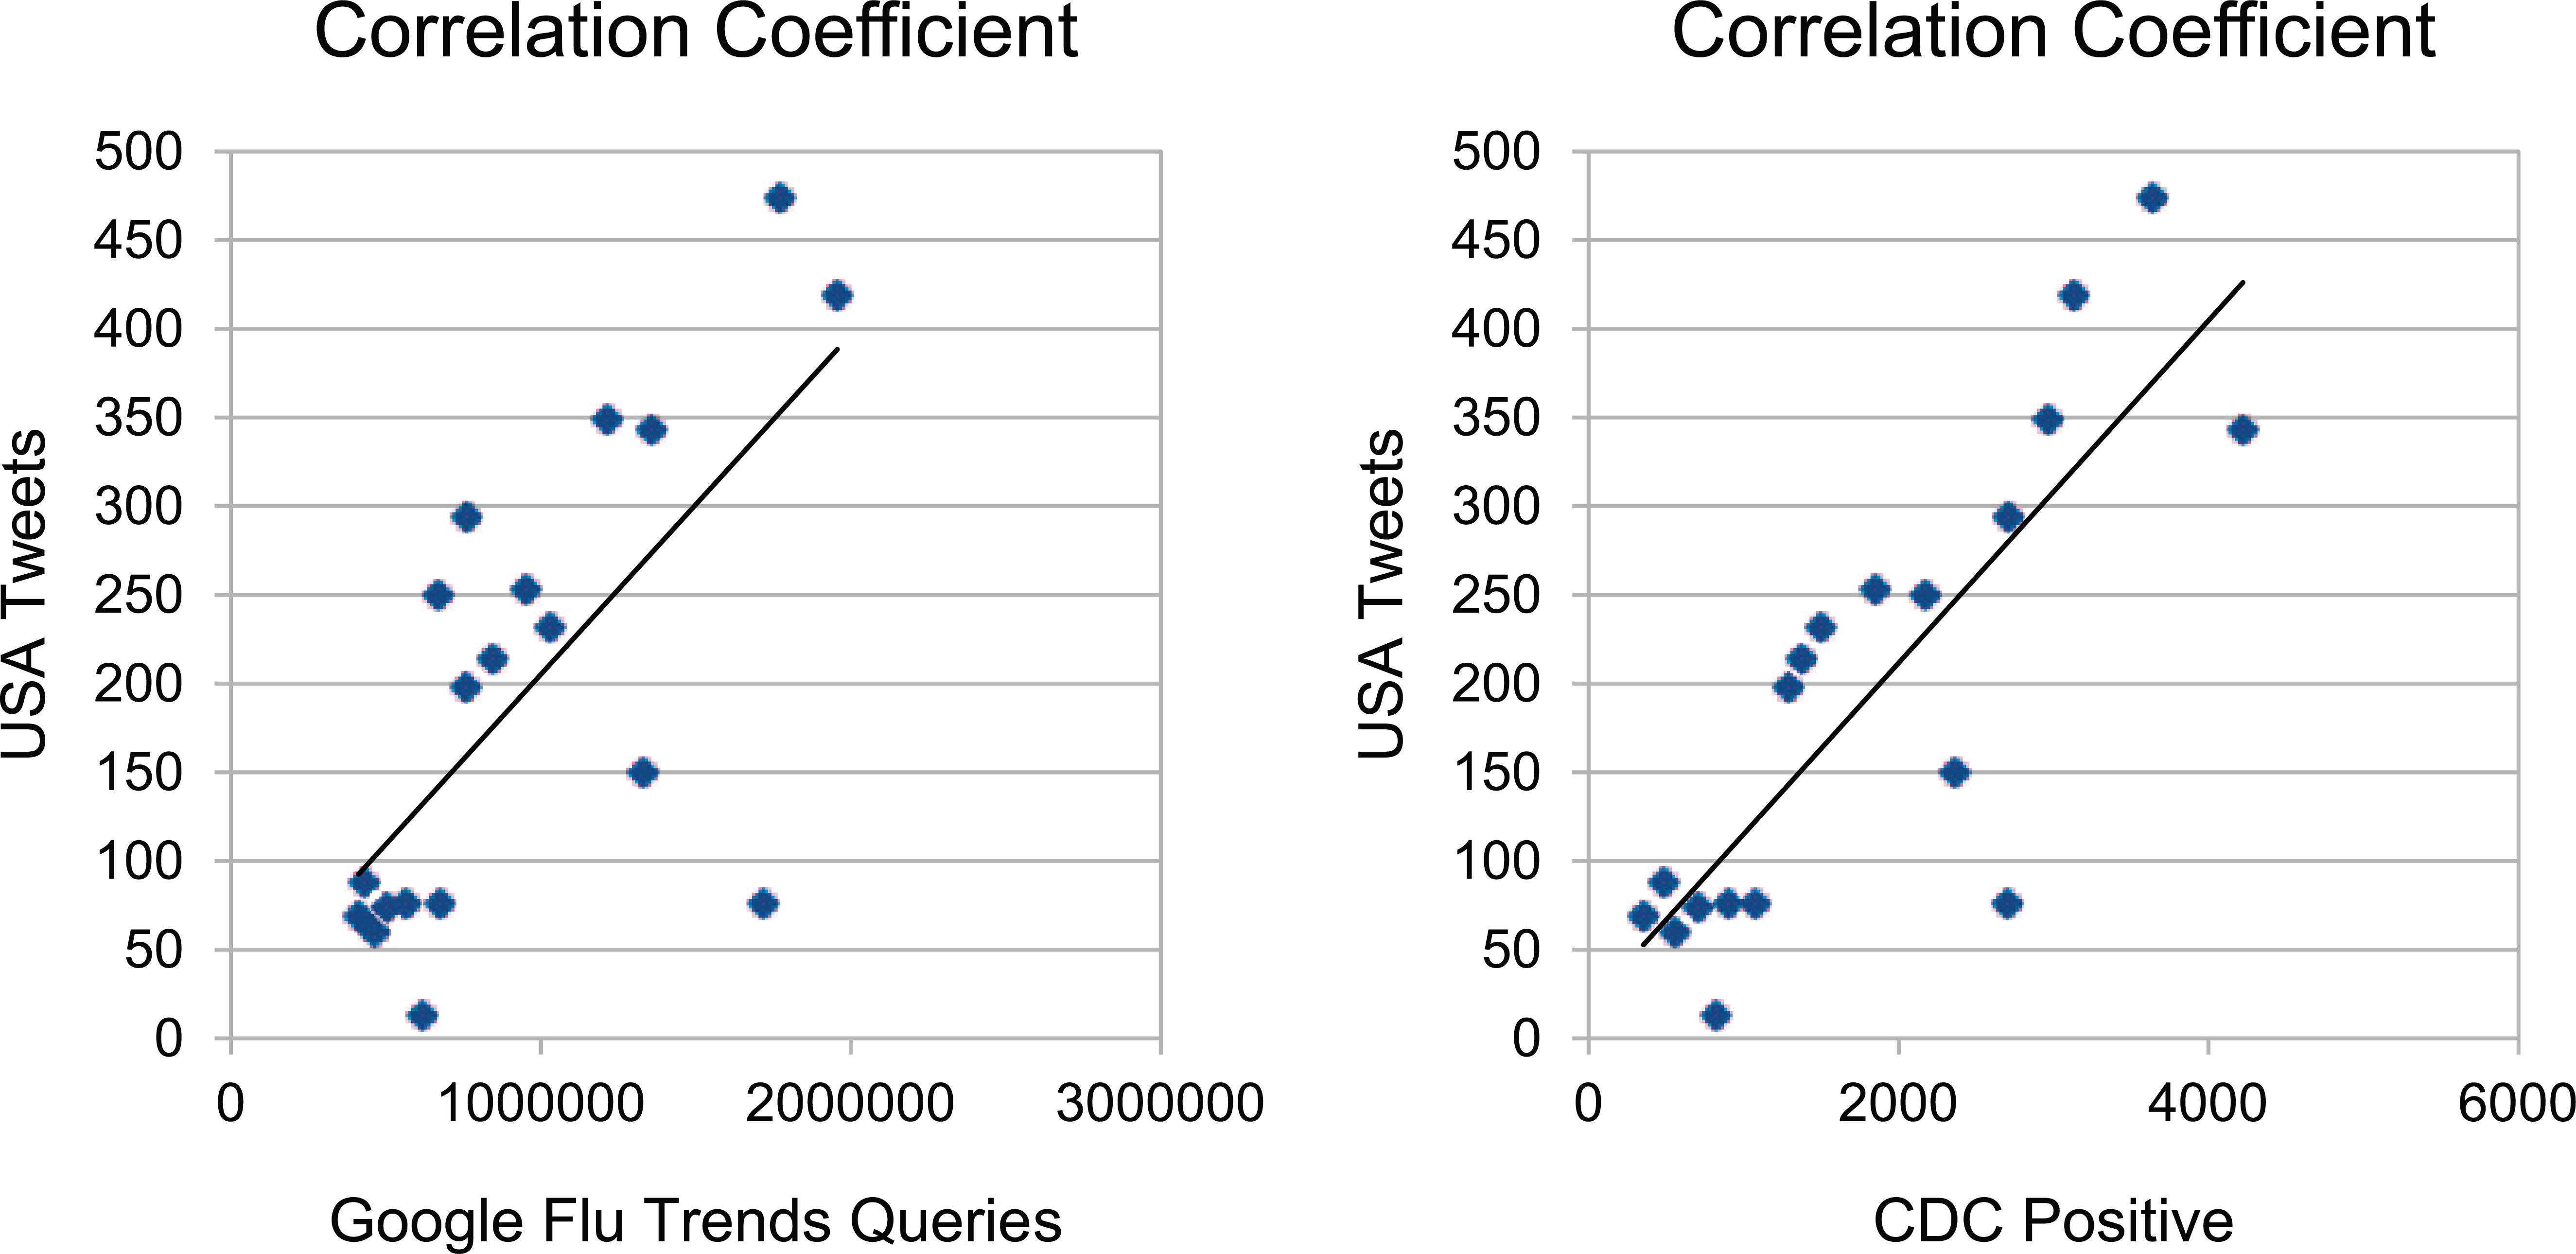
Linear relation between Flutrack.org and Google Flu Trends (left) and linear relation between Flutrack.org and CDC (right).
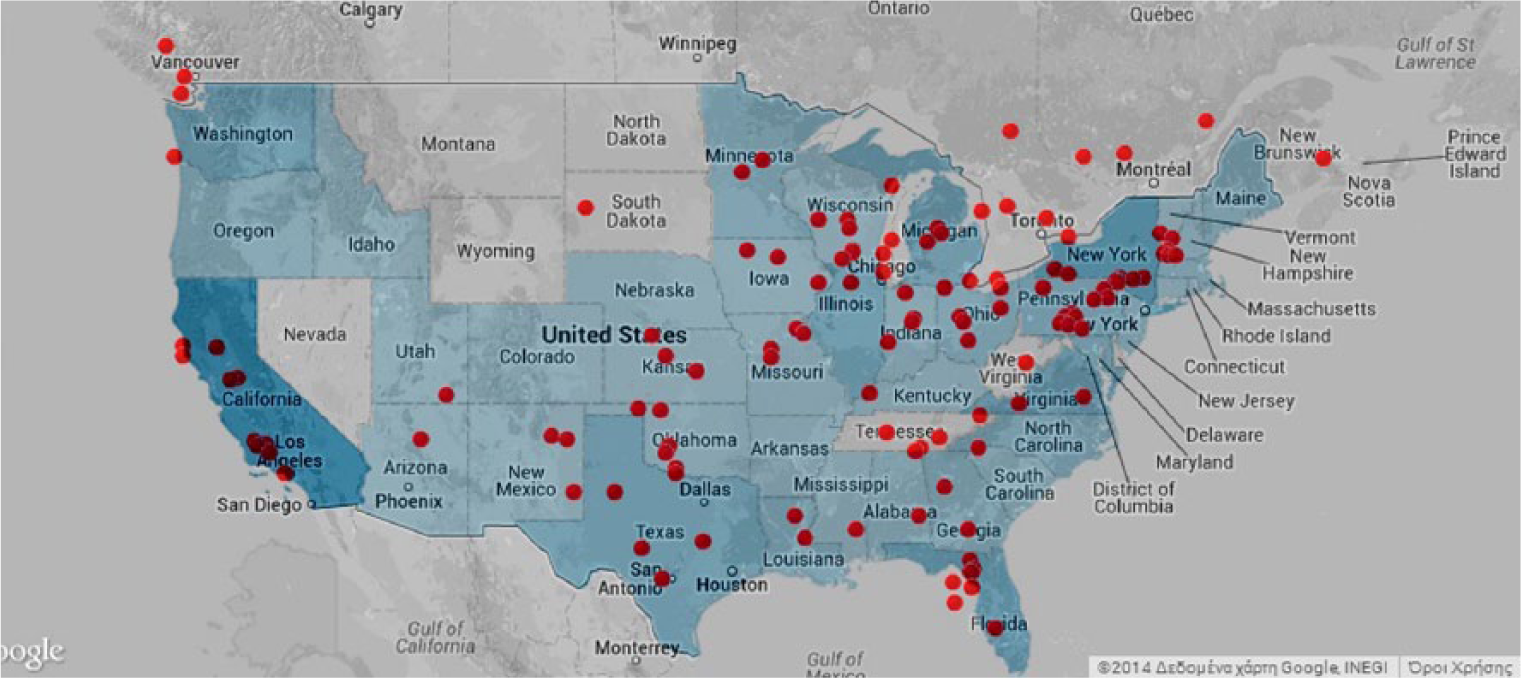
Datasets and Flutrack.org visitors match actual incidents on a map.
Discussion
We have built a system that holds two important properties for public health informatics. First, the source code of the system is available (Figure 6), which means that it is possible to study and improve the computer code in ways that make sense to varying stakeholders. For example, it is straightforward to replace or add other languages in addition to English, or to select different keywords or conditions for flu-positives/negatives. Second, the system has been designed to expose the dataset, which means that it is possible to develop new applications that build upon this effort, 30 without the need to reinvent the wheel of detecting influenza-like symptoms. Moreover, the open-source code is available for inspection, 31 in order to improve performance or to maintain the system according to the latest software dependencies (e.g. database, operating system, web technology framework).
In our knowledge, there are few open-source systems in the area of health informatics and public health. 32 Although the dissemination of public health data has been long recognized as a pillar in epidemiology,17,33 in practice, the sharing and dissemination of data stops in the presentation and consumption by individuals with little concern for potential added-value services. Overall, we found that contemporary health information systems are at an early stage in the development of modular and interoperable practices that in the long-term will benefit all the stakeholders in public health.
The current situation in the transparency and interoperability of health information systems is similar to the early days of the software applications. In the early years of competitive development, each software vendor kept the software code and the file format closed. Gradually, software vendors started to open-up their systems on two key dimensions. The first dimension regards the format of the exposed data. This is an important first step that enables system interoperability. The second dimension regards the ability to inspect the code of the system that produces the data. This is an important step that facilitates transparency and trust. Indeed, according to Jensen, 34 the adoption of health information might be facilitated by the following principles: (1) flexibility, (2) modularity, and (3) identification of key stakeholders. The main motivation for closed systems has been customer lock-in, which means that if someone writes a text document with a particular word processor, then it is difficult to open and edit the document in different processor. This motivation might only be considered acceptable in the short-term and in the case of competitive commercial markets, but it is neither productive nor ethical in the case of public health informatics and epidemiology, which has been benefited by open access to data and systems.
Conclusion
The popularity of real-time status updates in social media (e.g. Twitter) and open APIs provides developers with the opportunity to analyse public user data, which can be a thesaurus of information. This opportunity led to the development of an open source and linked data platform called Flutrack.org (http://www.flutrack.org) that detects the symptoms of ILI, based on self-reports in online status updates, such as Twitter. In particular, we capture symptoms through words such as ‘sore throat, cough, fever’. Previous work has validated the detection of influenza outbreaks by filtering flu-related Twitter messages, but there has not been any open-source platform.
The Flutrack.org system gathers and visualizes geo-located tweets in real-time. The open API allows users and developers to extend this project and take influenza detection to higher levels. For example, Flutrack data could be combined with weather data, in order to provide alerts to sensitive users depending on their location. Moreover, the availability of source code enables the optimization of the detection algorithm, as well as the extension of the system. For example, the Twitter feed could be complemented with additional data providers (e.g. Facebook, SMS). We suggest that the sharing of the data in an interoperable format (e.g. XML, JSON) and access to source code could facilitate transparency and incremental improvement by other parties and stakeholders. Flutrack.org data analysis has confirmed previous findings that online status updates match the officially verified disease data (e.g. CDC). The visualization might be employed by officials or individuals for planning their activities according to the trend of the epidemic.
We have focused only on data with high-resolution geocoding, because contagious diseases spread during close encounters. Moreover, linked data that use time and location stamps might be useful to researchers who focus on the prediction of pandemics. 22 Although prediction has been the holy grail for epidemiology, we suggest that system transparency and in particular interoperability might offer more benefits to public health. The main roadblock towards the adoption of interoperability is the fear of losing control, but the networked nature of modern economies has shown that the increased use and improvement of a platform are facilitated by open interfaces, linked data, and sharing of best practices.
One step further would be to extend the interoperability of the system with complementary systems. Other parameters, such as weather deterioration, should also be analysed, in order to examine whether there is any correlation between weather changes and flu outbreaks. Moreover, the interoperability of the system should be further complemented with links to data about public transportation (e.g. metropolitan, international, and intercontinental) because contagious diseases might spread between distant locations that have frequent and accessible transportation. Finally, we have been working on a similar open-source system that is based on a mobile app, which in addition to exposing the data from Flutrack.org also manages user profiles, as well as personal alerts and reports.
Footnotes
Declaration of Conflicting Interests
The author(s) declared no potential conflicts of interest with respect to the research, authorship, and/or publication of this article.
Funding
The author(s) received no financial support for the research, authorship, and/or publication of this article.