
Abstract
A history of brain tumor strongly affects children’s cognitive abilities, performance of daily activities, quality of life, and functional outcomes. In light of the difficulties in cognition, communication, physical skills, and behavior that these patients may encounter, occupational therapists should perform a comprehensive needs-led assessment of their global functioning after recovery. Such an assessment would ensure that the patients receive adequate support and services at school, at home, and in the community. By predicting the functional activity performance of children with a history of brain tumor, clinical workers can determine the progress of their ability recovery and the optimal treatment plan. We selected several features for testing and employed common machine learning models to predict Functional Independence Measure (WeeFIM) scores. The ensemble learning models exhibited stronger predictive performance than did the individual machine learning models. The ensemble learning models effectively predicted WeeFIM scores. Machine learning models can help clinical workers predict the functional assessment scores of patients with childhood brain tumors. This study used machine learning models to predict the WeeFIM scores of patients with childhood brain tumors and to demonstrate that ensemble machine learning models are more suitable for this task than are individual machine learning models.
Keywords
Introduction
Brain tumors are the most common pediatric solid tumors and have the highest cancer death rate among children. The incidence of primary central nervous system (CNS) tumors in children is approximately 0.003%. 1 In 2013, approximately 3050 pediatric patients were diagnosed with benign or malignant primary CNS tumors. 2 Brain and CNS tumors have more than 100 histopathological subtypes, each with varying incidence depending on patient age and subtype. The incidence of CNS tumors in children differs by country and region, ranging from 1.12–5.14 cases for every 100,000 people, with the highest incidence being in the United States. 3
Gliomas arising from neuroglia cells are the most common form of childhood brain tumors (CBT). The incidence and survival rate of gliomas vary depending on tumor site and histopathological subtype. In particular, astrocytic tumors account for 40%–50% of CNS tumors in children. 1 Medulloblastomas are the most common embryonal tumor and comprise 10%–25% of CBTs.4,5 These tumors only occur in the posterior fossa and may cause leptomeningeal spread; their treatment method combines surgery and radiotherapy (for patients younger than 3 years old). 4 AT/RT is a rare and invasive embryonal tumor 6 most often found in children younger than 3 years old and has unfavorable prognosis. 3 Current treatment methods for AT/RT remain controversial because of a lack of randomized controlled trials; thus, physicians have yet to reach a consensus on the optimal treatment method. Current treatments for AT/RT consist of multidrug therapy and radiotherapy. 7 In addition, ependymoma is a rare tumor found in the neuroectoderm and is capable of local extension and metastasis. 8 The tumor is the third most common CBT and accounts for 8%–10% of CNS tumors in children. The current treatment method for ependymoma is removal through surgery with strict safety measures followed by radiotherapy at the primary site of the tumor. 7
The continuing expansion of oncology knowledge, increase in surgery treatment success rate, and advancements in medical treatment methods have contributed to an increase in the CBT survival rate. 9 However, the literature has reported that survivors of brain tumors must overcome numerous problems after their recovery. For these patients, overcoming cancer is the first obstacle among many after diagnosis. Despite the advancements in research and treatment technology, these patients are subject to negative physiopsychological, sociopsychological, and neuropsychological influences. 9 Approximately 60% of these patients have at least one disability, such as visual, motor, cognitive and neural disability, or endocrine complications. 9 The effects of tumor site and medical treatment may be related to impairments in patients’ cognitive, behavioral, or bodily functions, including those in executive, memory, motor, visual, spatial, and linguistic function.9,10 These impairments may have long-term effects on the quality of life and functional outcomes of CBT survivors. 11 In light of the difficulties in cognition, communication, physical skills, and behavior experienced by these patients, occupational therapists should perform a comprehensive needs-led assessment of a child’s global functioning after recovery. This assessment ensures that the patient receives adequate support and services at school, at home, and in the community. 11 However, from an occupational therapy perspective, these impairments reflect the effect of cognitive function on a patient’s ability to live independently and demonstrated competence. Therefore, the early recognition of cognitive function disability is crucial to providing timely intervention and preventing the rare occurrence of secondary behaviors in the patient’s daily life and psychological trauma. 12
The Wechsler Intelligence Scale for Children, 4th Edition (WISC-IV) is the gold standard for assessing the intellectual ability of children aged 6–16 years. The WISC-IV employs four indices, namely the verbal comprehension index (VCI), processing speed index (PSI), working memory index (WMI), and perceptual reasoning index (PRI) 13 to assess patients, devise clinical treatment plans, and guide educational and nursing plans for gifted children and those with mental and learning disabilities.
The Functional Independence Measure for Children (WeeFIM) is an 18-item, 7-level ordinal scale instrument for measuring the performance of essential daily function in children. The scale assesses three domains, namely selfcare, mobility, and cognition, through interviews or observation of a child’s performance of a task on the basis of criterion standards. 14 The WeeFIM is divided into two main functional streams, namely “dependent” (i.e. requiring assistance: score of 1–5) and “independent” (i.e. not requiring assistance: score of 6–7). Scores of 1 (total assistance) and 2 (maximal assistance) are classified as “complete dependence”; scores of 3 (moderate assistance), 4 (minimal contact assistance), and 5 (supervision or set-up) are classified as “modified dependence”; and scores of 6 (modified independence) and 7 (complete independence) are classified as “independent.” The WeeFIM is a commonly used instrument to evaluate children’s functional independence.
Machine learning (ML) models have been applied to various aspects of health care. Given the complexity of big health care data, a novel framework can provide new applications for identifying optimal innovative health-care management practices. 15 Health-related data are stored in repositories managed and controlled by various entities. For example, the government manages electronic health records, health-care providers control electronic medical records, and patients directly manage their personal health records. 16 Numerous studies have analyzed health records.15–17 Some have applied medical imaging data to brain tumor classification18–24 and grading.25,26 Studies on ML prediction have also identified predictive risk factors for seizures on the basis of topographic brain tumor anatomy. 27 Radiomics features 28 can be used to predict H3 K27M mutation and survival after metastasis. 29 ML has been widely applied in various types of medical prediction. For example, an ML model was used to predict the incidence of cancer in Europe 30 and to assess the influence of data integration on the predictive ability of a caner survival model. 31 A deep-learning method was used to classify types of prostate cancer and as an effective auxiliary tool for decision-making regarding prostate cancer. 32 Microarray gene expression has been used as the basis for ensemble-learning feature selection in the diagnosis of prostate cancer. 33 ML has also been applied to dynamic sentiment analysis for breast cancer. 34 In addition, ML has been used to establish a preliminary screening and diagnosis tool for Guillain–Barré syndrome subtypes, 35 to predict the health condition of children with cerebral palsy, 36 and to preoperatively predict surgical morbidity in children. 37 However, no study has used ML models to predict the functional performance of CBT survivors.
This study used ML to determine the functional independence of patients with CBT and the importance of each WeeFIM index. This study made the following contributions: (1) applying ML algorithms to predict the WeeFIM score of patients with CBT; (2) analyzing the performance of each ML algorithm in WeeFIM score prediction; (3) analyzing the effect of each input variable on the performance of each ML algorithm; and (4) providing suggestions for subsequent studies on the use of ML algorithms to predict the functional independence ability of patients with CBT.
Proposed framework
Figure 1 presents the application framework. Patients with CBT mostly undergo surgery to remove the tumor or receive extensive radiotherapy or chemotherapy treatment during the inpatient period. After the patient begins to receive treatment, the medical team administers a rehabilitation intervention based on the patient’s condition to return the patient’s function to the premorbid state.
38
We collected clinical data as input data for the proposed ML models and employed the WeeFIM subscale scores and total score to predict the functional independence ability of patients with CBT. The prediction results can provide reference for clinical personnel, including rehabilitation physicians, occupational therapists in the rehabilitation department, and physiotherapist in the rehabilitation department, to determine the optimal rehabilitation plan for each patient. The proposed framework.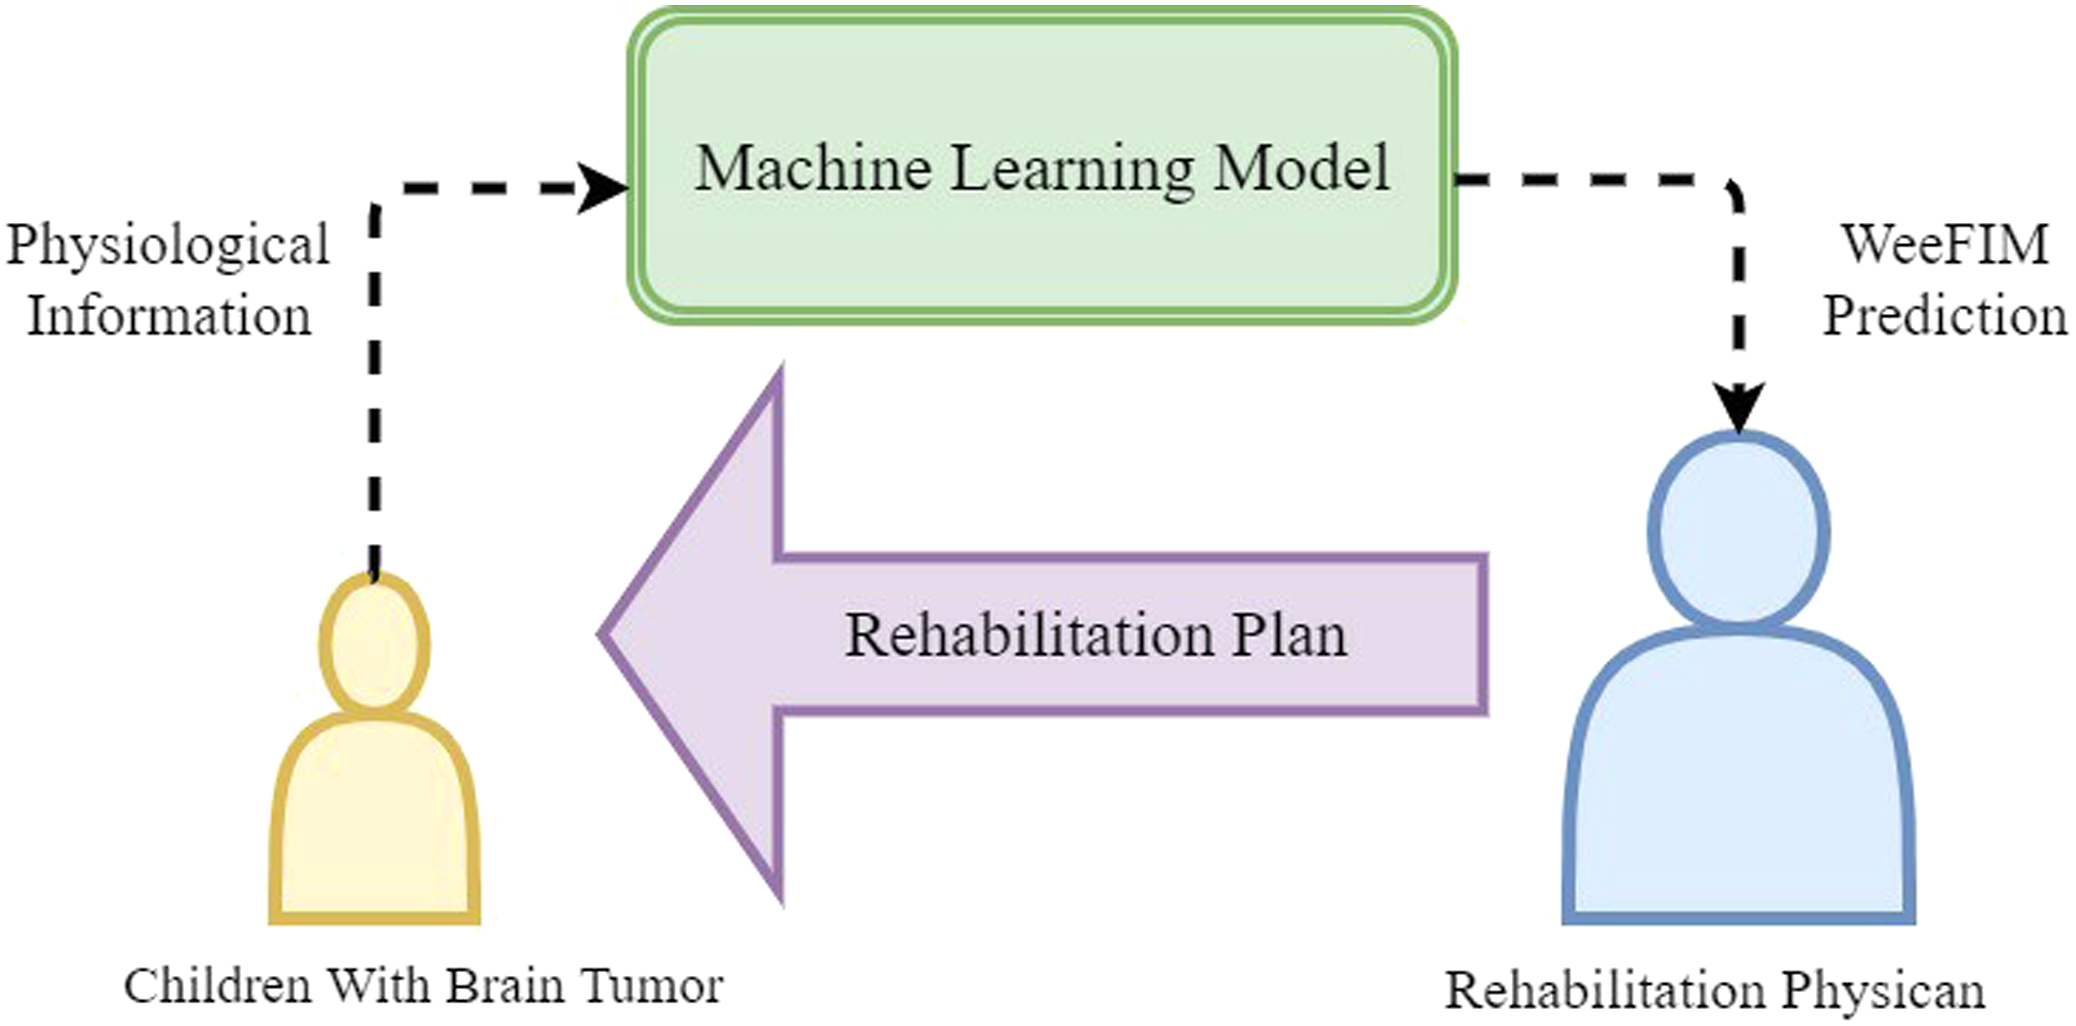
Methods
This section provides a brief introduction of the ML algorithms we applied for WeeFIM prediction, namely AdaBoost, decision tree (DT), multilayer perceptron (MLP), k-nearest neighbors regression (k-NNR), random forest (RF), support vector regression (SVR), and ensemble learning models, and details the verification procedures in the experiment. The following section explains the experiment.
k-Nearest neighbors regression
The NNR algorithm was the simplest ML algorithm adopted in this study and is the oldest and easiest regression method. The instance selection algorithm for k-NNR is a wrapper algorithm.39,40 In this study, the number of neighbors was set to 5.
Support vector regression
The SVR is a supervised ML algorithm used to process regression tasks. The SVR balances model complexity with training errors and performs adequately in processing high-dimensional data. 41 We employed the radial basis function as the kernel and assigned the function a kernel coefficient of 0.1.
Decision tree
Decision tree is a data mining classification technique commonly used in various fields to create classification systems based on multiple covariates and to develop prediction algorithms for a target variable.42,43 DT has been widely applied in medical research. 42 In this study, the maximum depth of the tree was set to 15.
Random forest
Random forest 44 combines the power of multiple DTs. Each tree is dependent on the random vector value of the independent sample, and every tree in the forest exhibits the same distribution. In this study, we set the number of trees to 100 and the maximum depth to 15.
Multilayer perceptron
Multilayer perceptrons, 45 also known as a “multilayer feedforward neural networks,” is the most commonly used neural network classification technique. In this study, we selected the sigmoid function as the activation function and used the stochastic gradient-based optimizer. The batch size was set to 4, and the maximum number of iterations was set to 100. The solver for weight optimization is Adam. One hidden layer (with 100 neurons) was embedded in the MLP model.
AdaBoost
AdaBoost 46 is an excellent boosting algorithm with a sound theoretical basis and has been successfully practically applied. AdaBoost is an ensemble algorithm but did not exhibit notable performance in our study. The maximum number of estimators was set to 100, and the linear loss function was employed.
MLP + MLP + MLP
In the first ensemble learning model, we combined three MLP frameworks. The sigmoid function was selected as the activation function, the stochastic gradient-based optimizer was employed, and the maximum number of iterations was set to 100. The batch sizes were 1, 4, and 16 for each MLP model to perform training on different batch sizes. By combining the three MLP models, the prediction accuracy of the learning framework increased.
RF + MLP + MLP
The second ensemble learning model combined two MLP frameworks and an RF framework. The activation function of the MLP frameworks was the sigmoid function, the stochastic gradient-based optimizer was employed, and the maximum number of iterations was set to 100. The batch sizes of the MLP frameworks were 1 and 4. In the RF framework, the number of trees was set to 100, and the maximum depth was set to 15.
RF + MLP + Adaboost
For the third ensemble learning model, an MLP, RF, and AdaBoost framework were combined. The activation function of the MLP framework was the sigmoid function, and the stochastic gradient-based optimizer was employed. The maximum number of iterations and batch size were set to 100 and 4, respectively. The number of trees and the maximum depth of the RF framework were set to 100 and 15, respectively. The maximum number of estimators in the AdaBoost framework was set to 100, and the linear loss function was adopted.
RF + MLP
In the fourth ensemble learning model, we combined an MLP framework with an RF framework. We selected the sigmoid function as the activation function, adopted the stochastic gradient-based optimizer, and set the maximum number of iterations and batch size to 100 and 4, respectively. For the RF framework, we set the number of trees and maximum depth to 100 and 15, respectively.
The ensemble learning models (i.e. MLP + MLP + MLP, RF + MLP + MLP, RF + MLP + AdaBoost, and RF + MLP) were tested, and the prediction results were compiled. The output results were determined through voting to achieve higher prediction accuracy than that of a single prediction.
This study adopted an ensemble averaging method to combine several ML models. Two commonly used ensemble averaging methods are the simple averaging method, represented by (1), and the weighing averaging method, represented by (2).
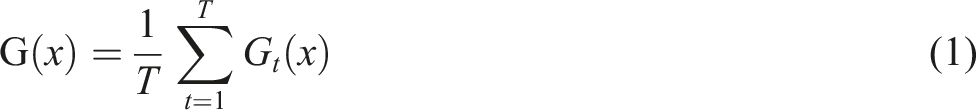
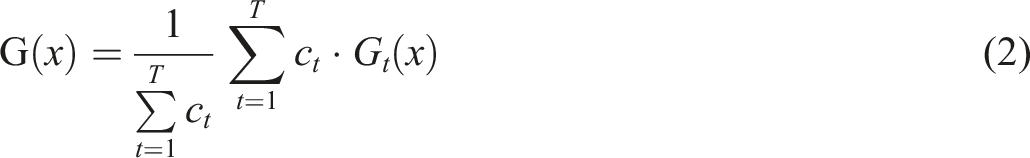
Figure 2 presents the processing flowchart of the algorithms. First, we preprocessed the data and converted features with concentrated data into input formats suitable for each ML algorithm. During data preprocessing, we ensured that each dimension had equal influence on the ML models. The leave-one-out cross-validation method, the most rigorous cross-validation method, was adopted for performance analysis to determine the advantages and disadvantages of each ML algorithm. The processing flowchart of the ML models.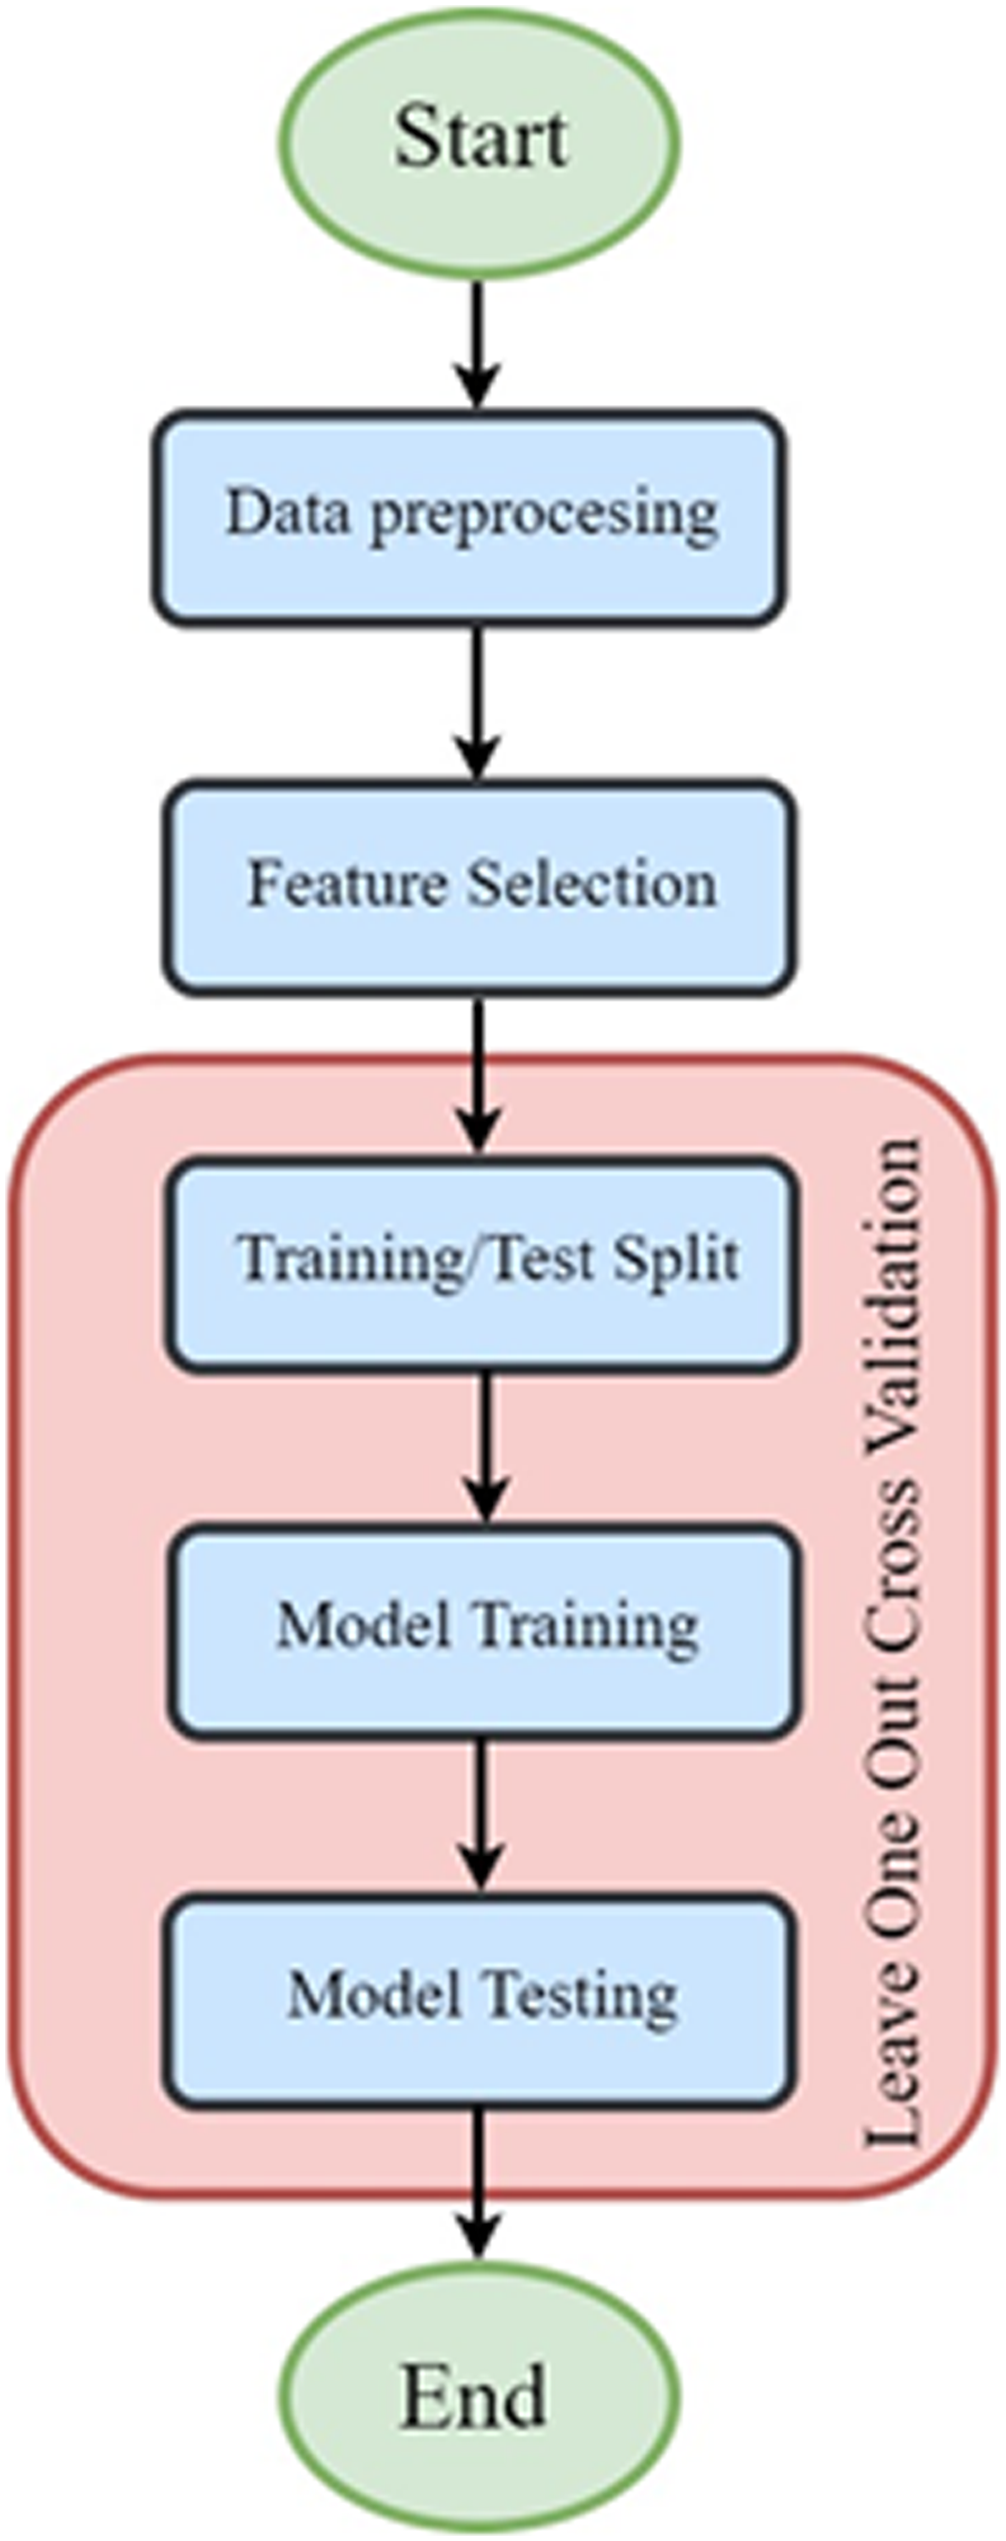
This study used three commonly used assessment indicators, namely mean absolute error (MAE), root mean square error (RMSE), and the coefficient of determination (R2 score) for model assessment.
Variable n denotes the number of data points,
Results
The results section is divided into a description of the data and the results of prediction. The data description section provides an introduction to and preliminary analysis of the database; the prediction results section presents the design of the experiment and a comparison of the performance between the ML ensemble models and WeeFIM prediction method.
Data description
We referenced a dataset on patients with CBT47–48 from May 2021 for an experiment in the Eugenio Medea Scientific Institute in Bosisio Parini, Italy. The original dataset consisted of 78 patients, five of whom we excluded as outliers. Therefore, the experiment dataset consisted of 73 patients with brain tumors diagnosed during the developmental stage, and their age ranged from 6 to 18 years.
The Shapiro-Wilk test was adopted to explore the normality of the 36 features. This test is the most used normality test and can determine whether the random selection of samples has normality. A smaller W value indicates the rejection of normality.
49
Figure 3 presents the Shapiro ranking, in which high values for age at diagnosis, tumor type, time since diagnosis, VCI, VSI, FSIQ, WMI, PSI, selfcare bathing, selfcare dressing (upper), selfcare dressing (lower), mobility stairs, cognition problem-solving, WeeFIM selfcare, WeeFIM cognition, and WeeFIM total were observed. This suggested that these features had normality. Shapiro ranking of the features.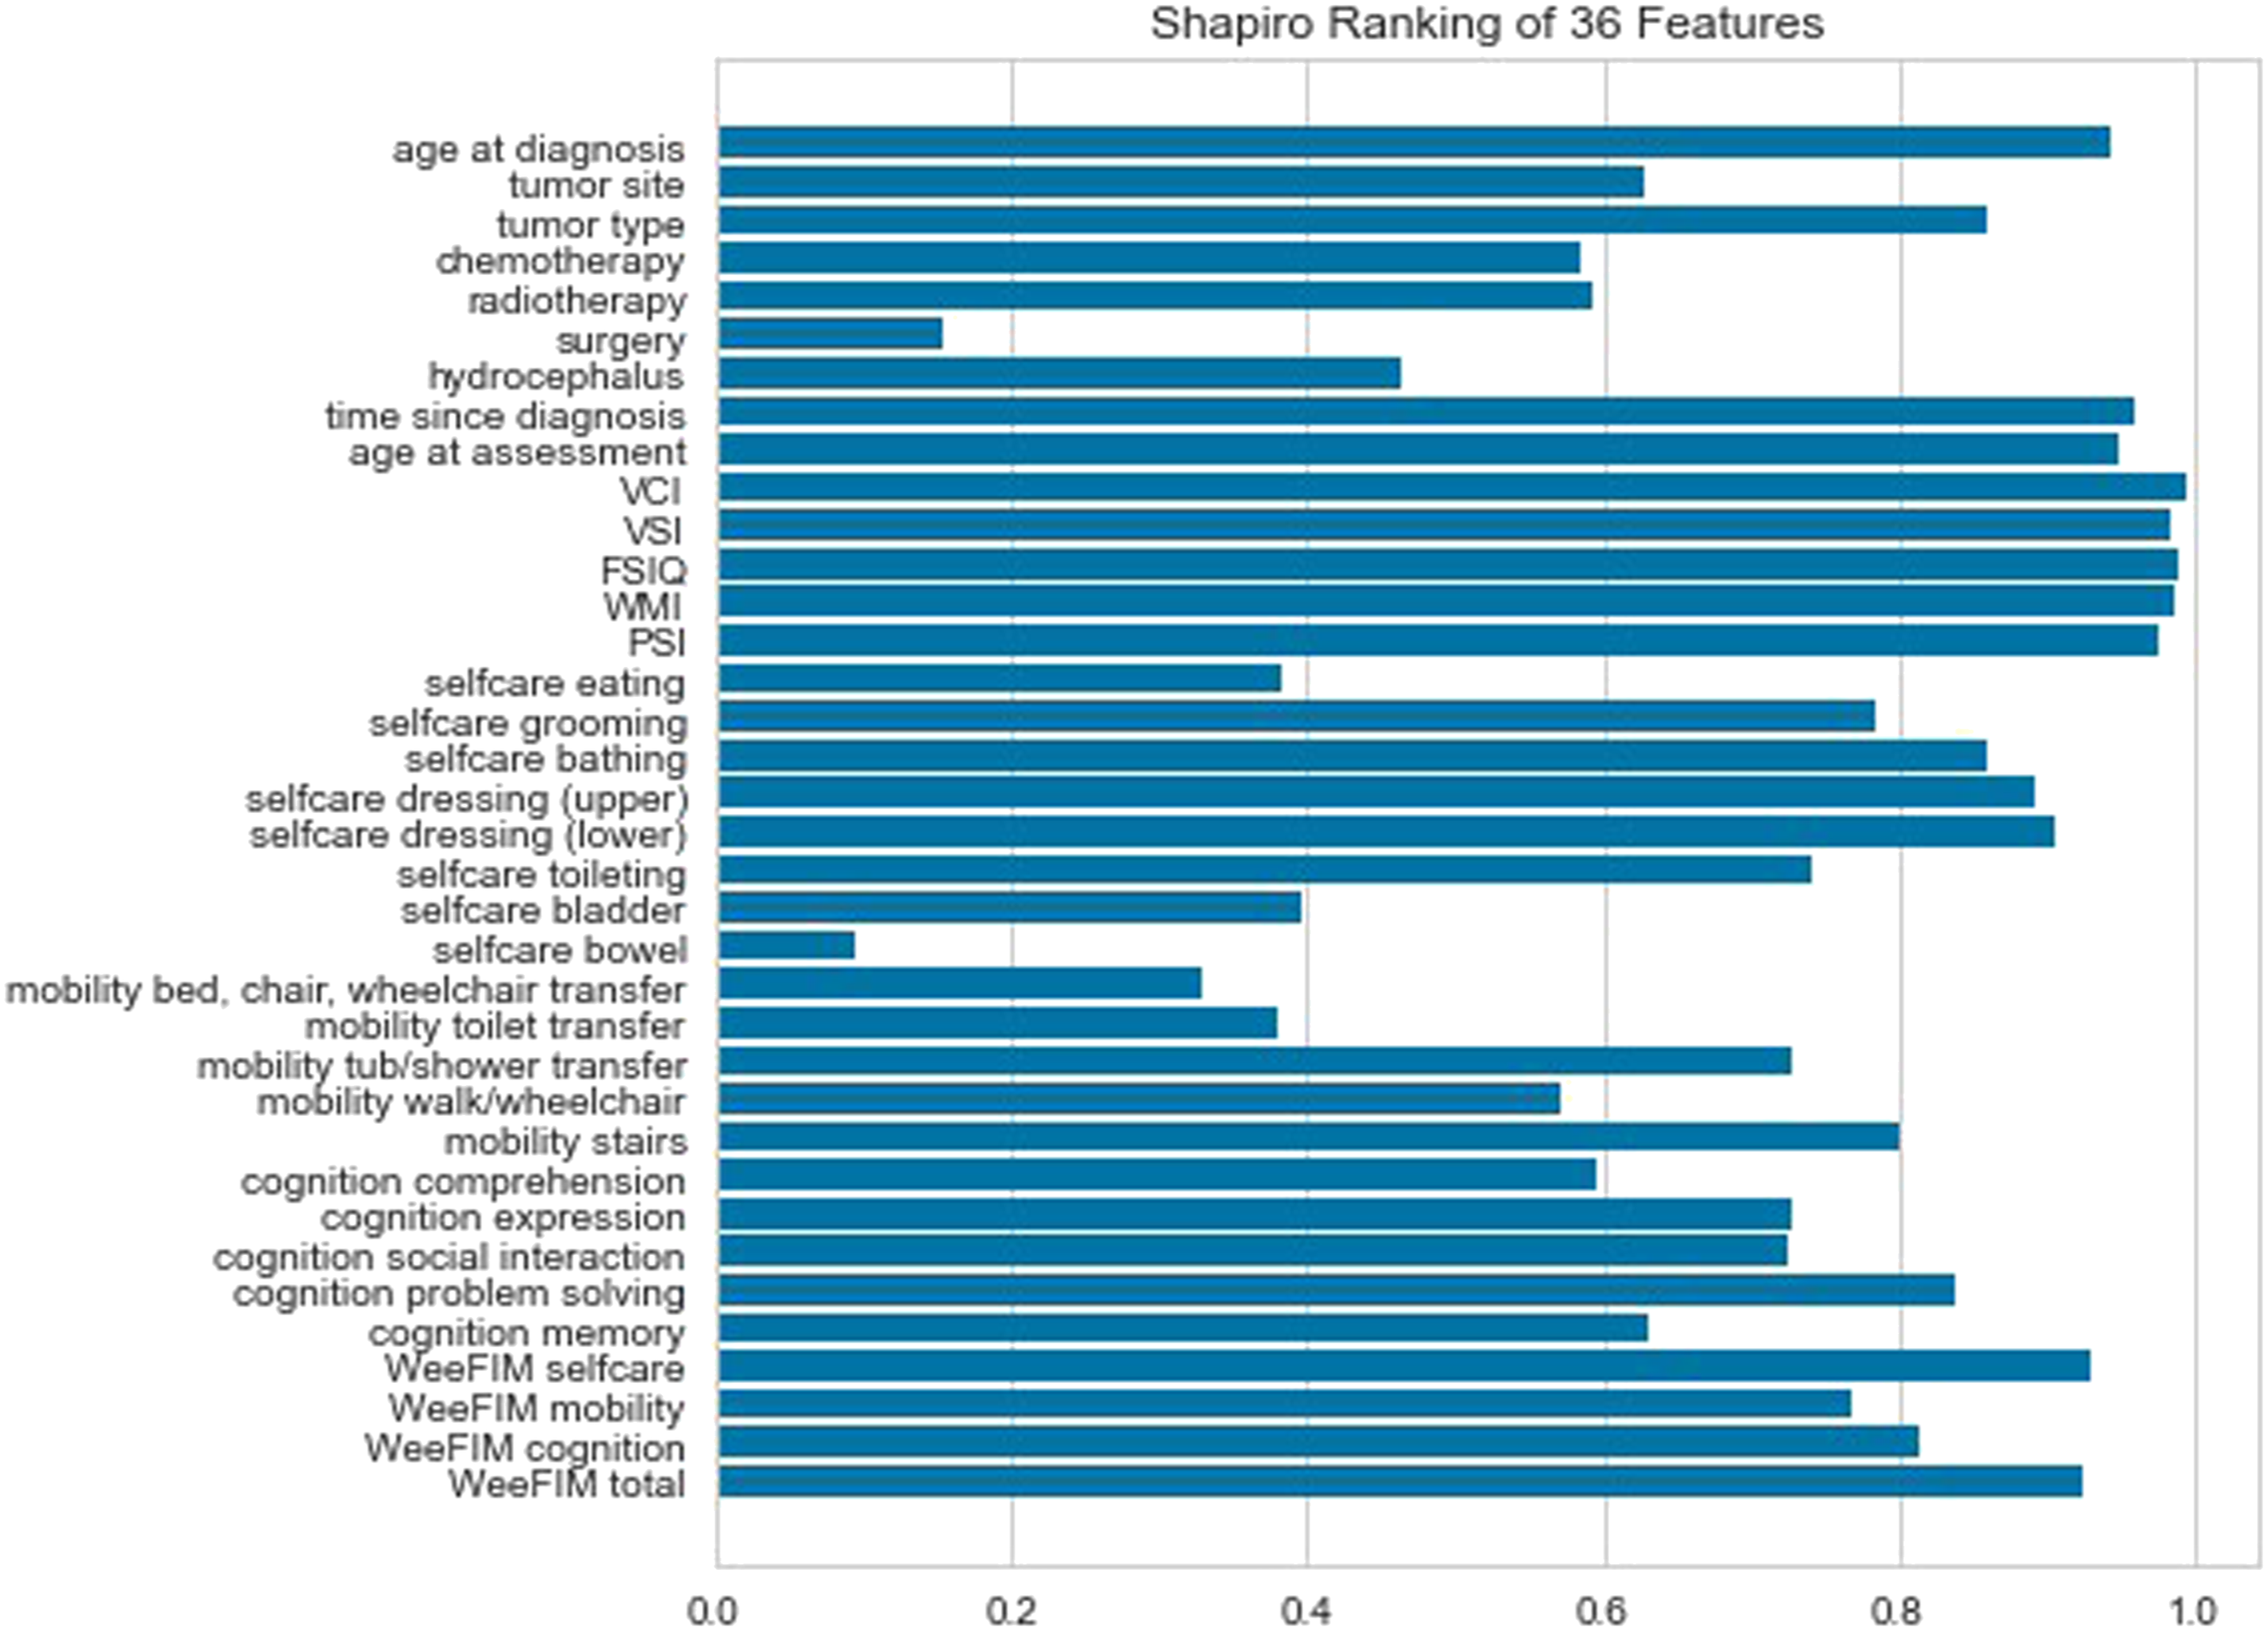
Figure 4 presents the Pearson matrix and the correlation between each feature. Red and blue indicate positive and negative correlations, respectively, with darker colors representing higher degrees of correlation. Figure 5 depicts the relationship between the WeeFIM scores in the dataset. The diagonal kernel density estimation plot indicates normality in the WeeFIM selfcare, WeeFIM cognition, WeeFIM mobility, and WeeFIM total data. Pairplot was used to represent the relationships between two variables (e.g. linear or nonlinear and whether two variables were significantly correlated). A slanted linear line represents a linear regression. Scores closer to the regression line indicate a stronger correlation. Pearson matrix of the features. The relationship between the WeeFIM scores in the dataset.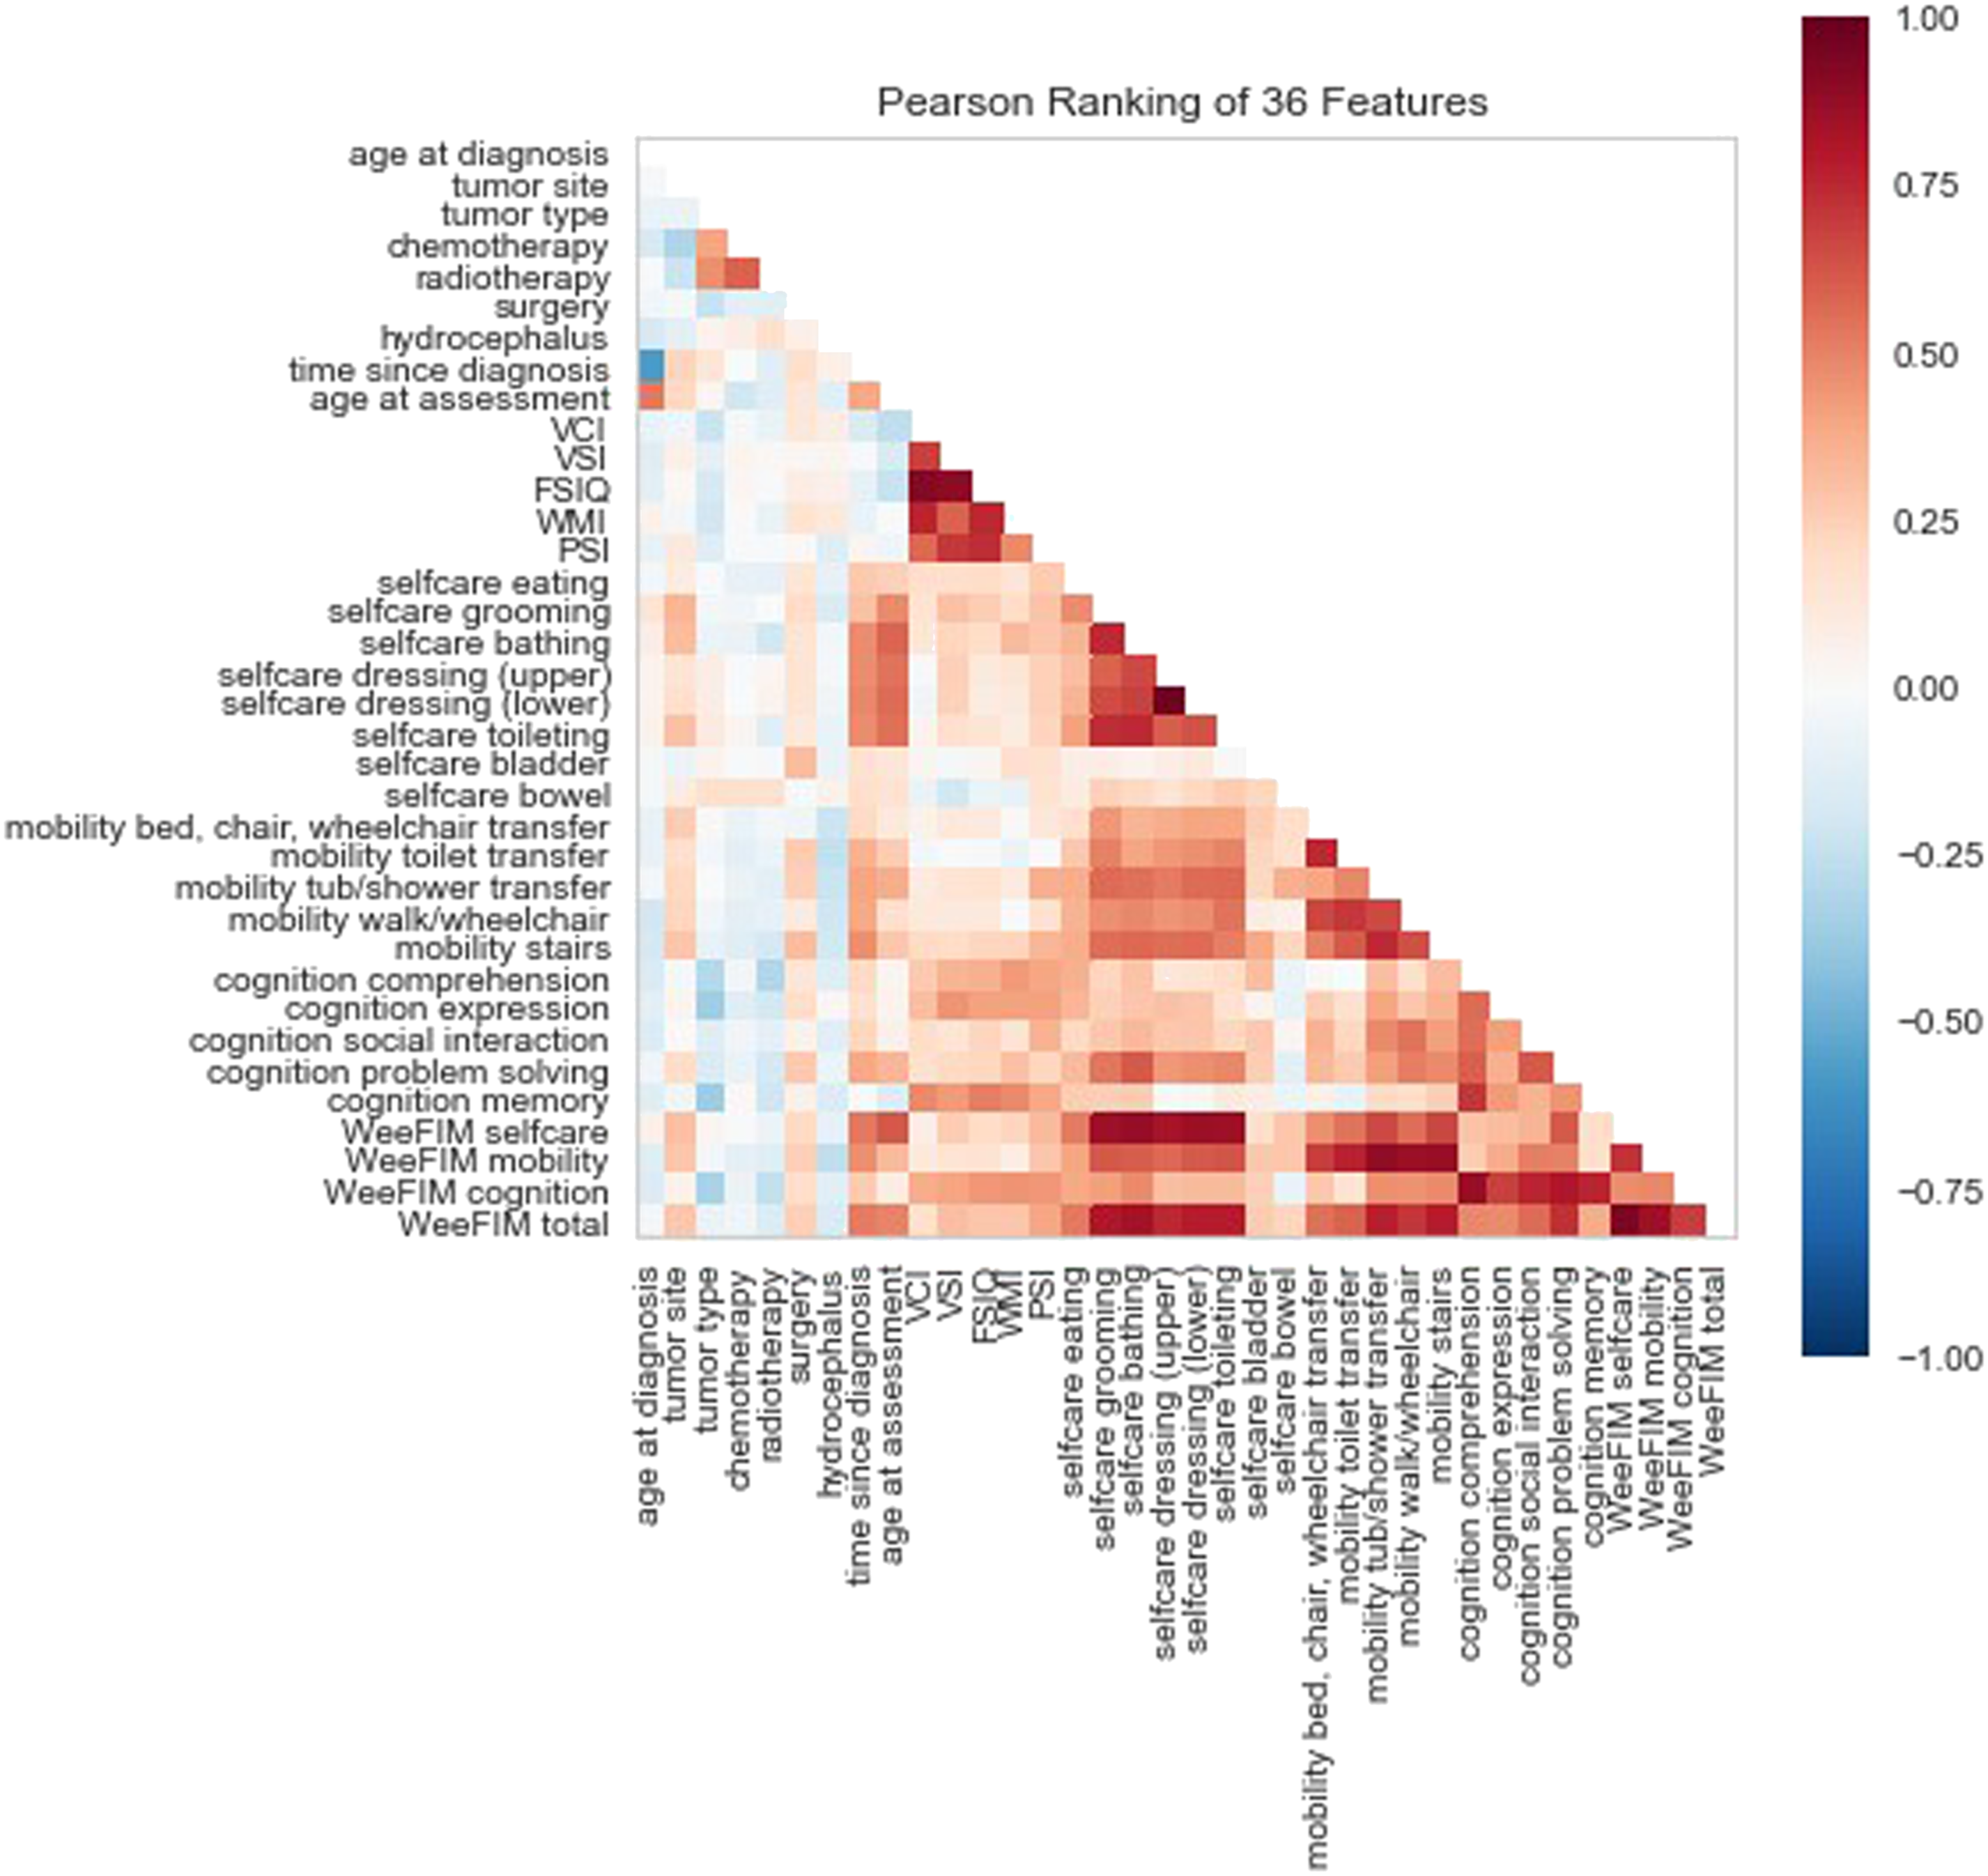
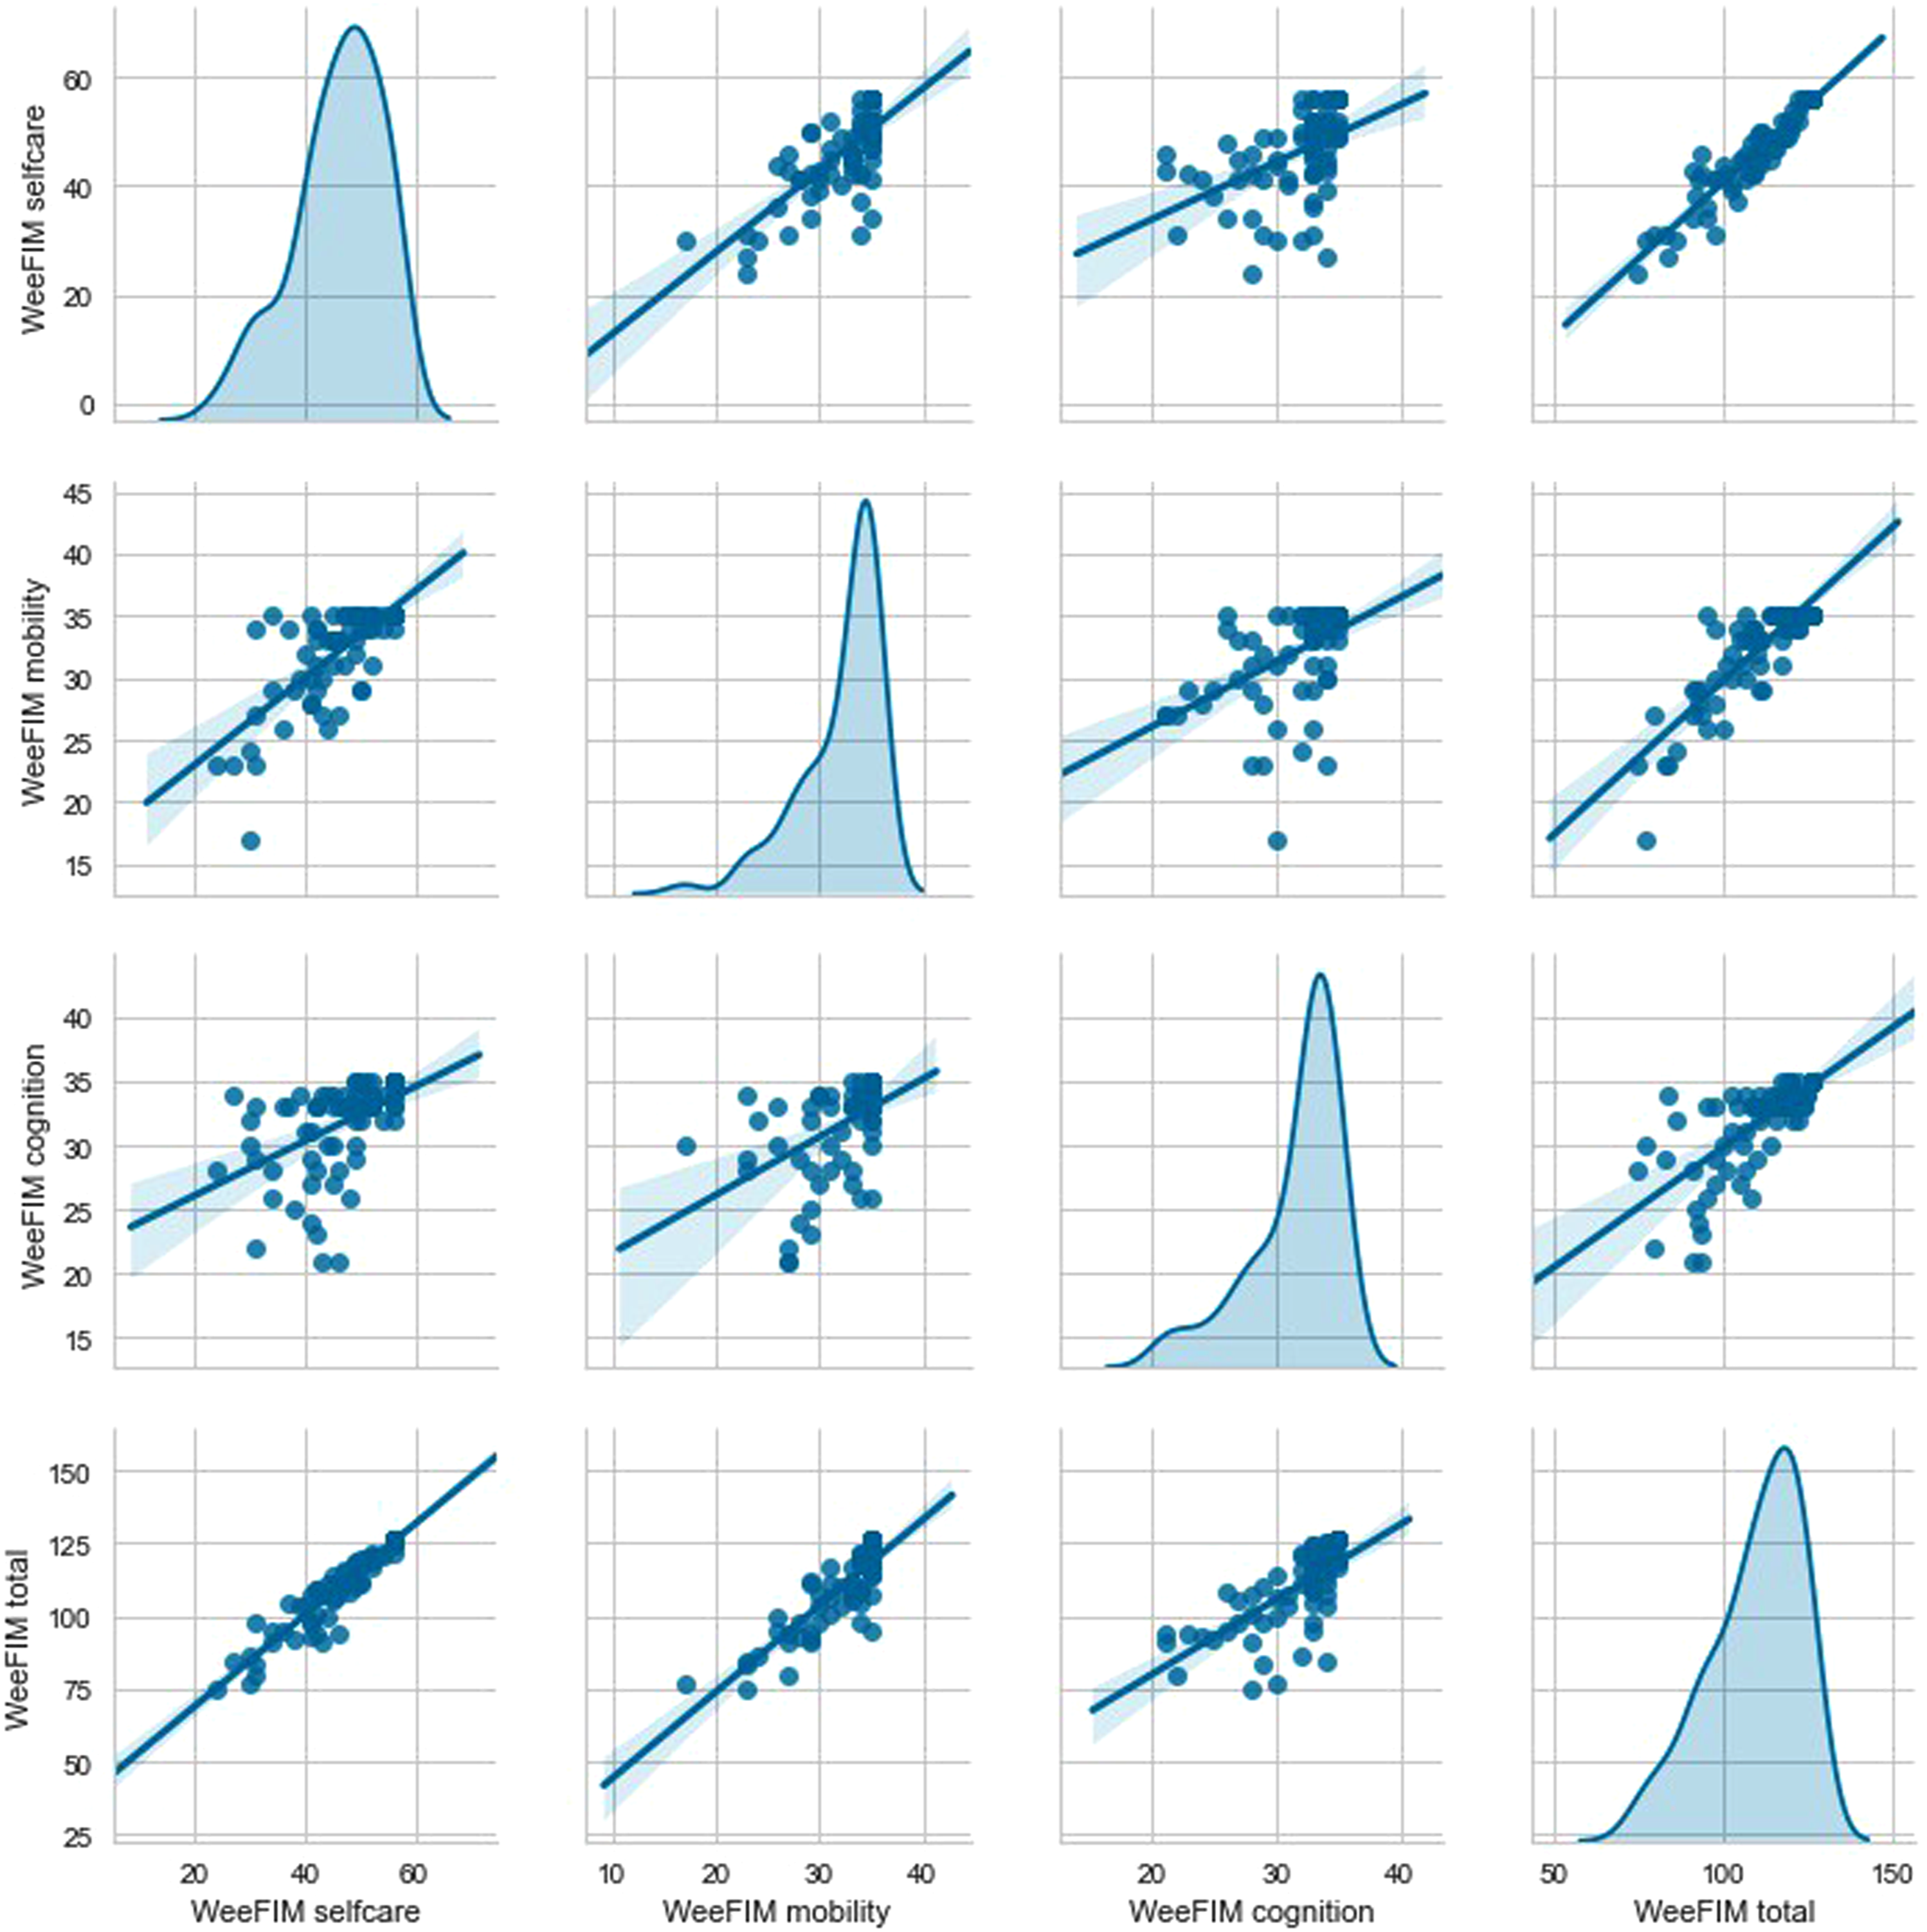
Most of the scores for WeeFIM total and WeeFIM selfcare were concentrated around the diagonal line (Figure 5). Therefore, the highest correlation was between WeeFIM total and WeeFIM selfcare, followed by that between WeeFIM total and WeeFIM mobility and that between WeeFIM total and WeeFIM cognition.
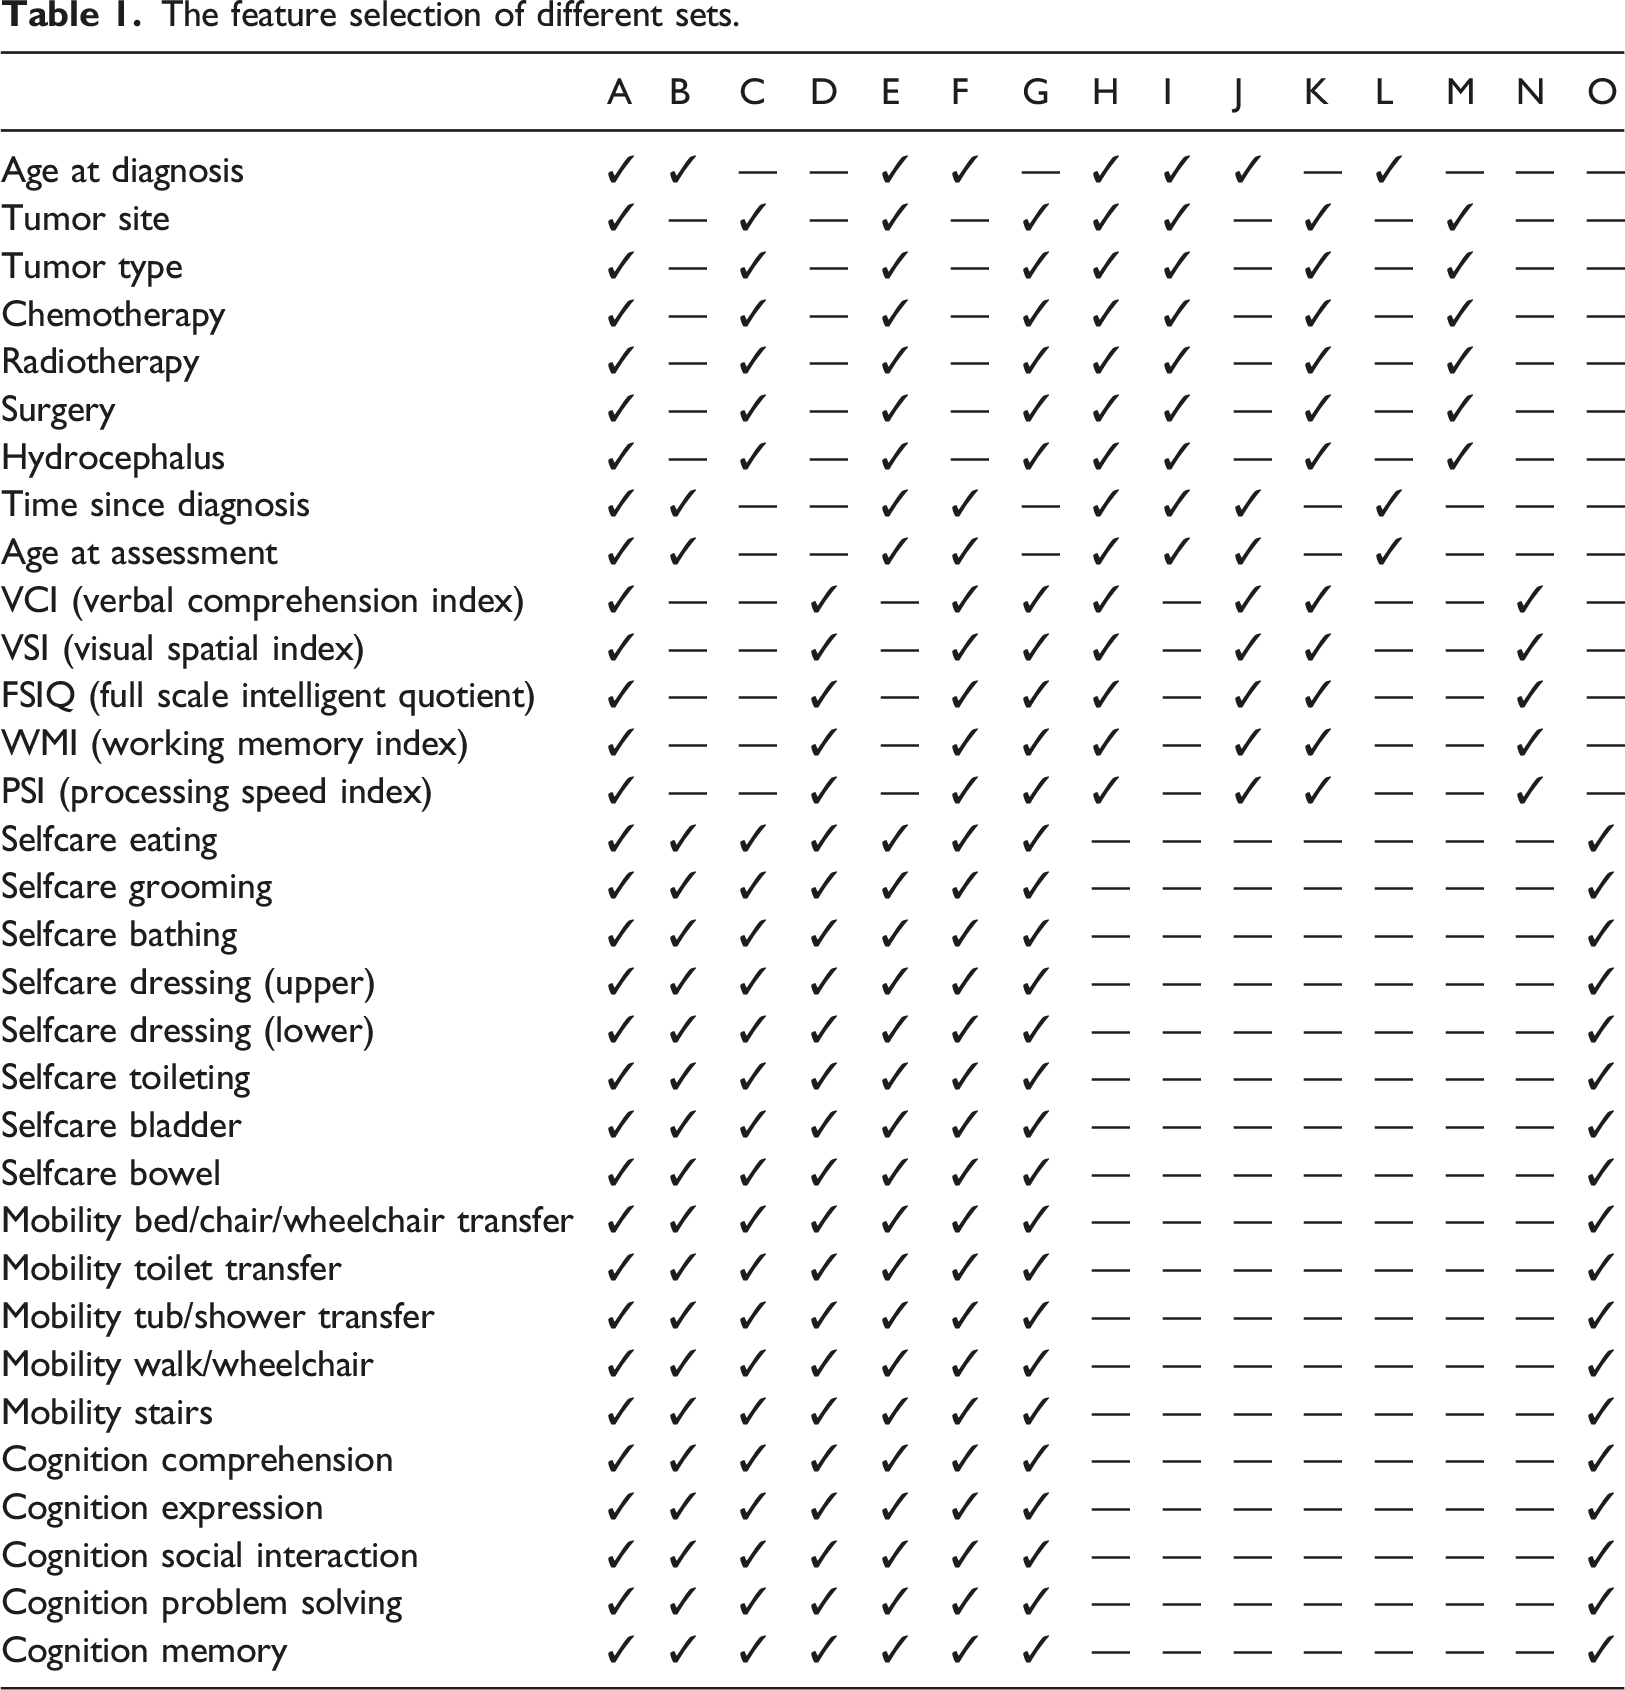
We classified features with concentrated data into four groups, namely age-related features (i.e. age at diagnosis, time since diagnosis, and age at assessment), tumor-related features (i.e. tumor site, tumor type, chemotherapy, radiotherapy, surgery, and hydrocephalus), intellectual assessment subtest scores (i.e. VCI, VSI, FSIQ, WMI, and PSI), and 18 subitem scores on the WeeFIM scale. We selected several features for testing and divided them into 15 sets from Set A to Set O. We then employed common ML models (RF, MLP, AdaBoost, SVR, DT, and NNR) to predict WeeFIM total, WeeFIM selfcare, WeeFIM mobility, and WeeFIM cognition scores.
The feature selection of different sets.
Prediction result
We employed the leave-one-out cross validation method for performance analysis. Figure 6 presents the results of the WeeFIM total score prediction using the ML models from Set A, namely RF, MLP, AdaBoost, SVR, DT, NNR, and four ensemble learning models. After the predicted values were compared with the actual values, the absolute values were plotted using three colors; blue represents |R| ≤ 1, green represents 1 < |R| ≤ 2, and orange represents |R| ≥ 2. The WeeFIM-Total prediction results of the ML models from Set A. (a) MLP + MLP + MLP, (b) RF + MLP + MLP, (c) RF + MLP + Adaboost, (d) RF + MLP, (e) MLP, (f) Adaboost, (g) RF.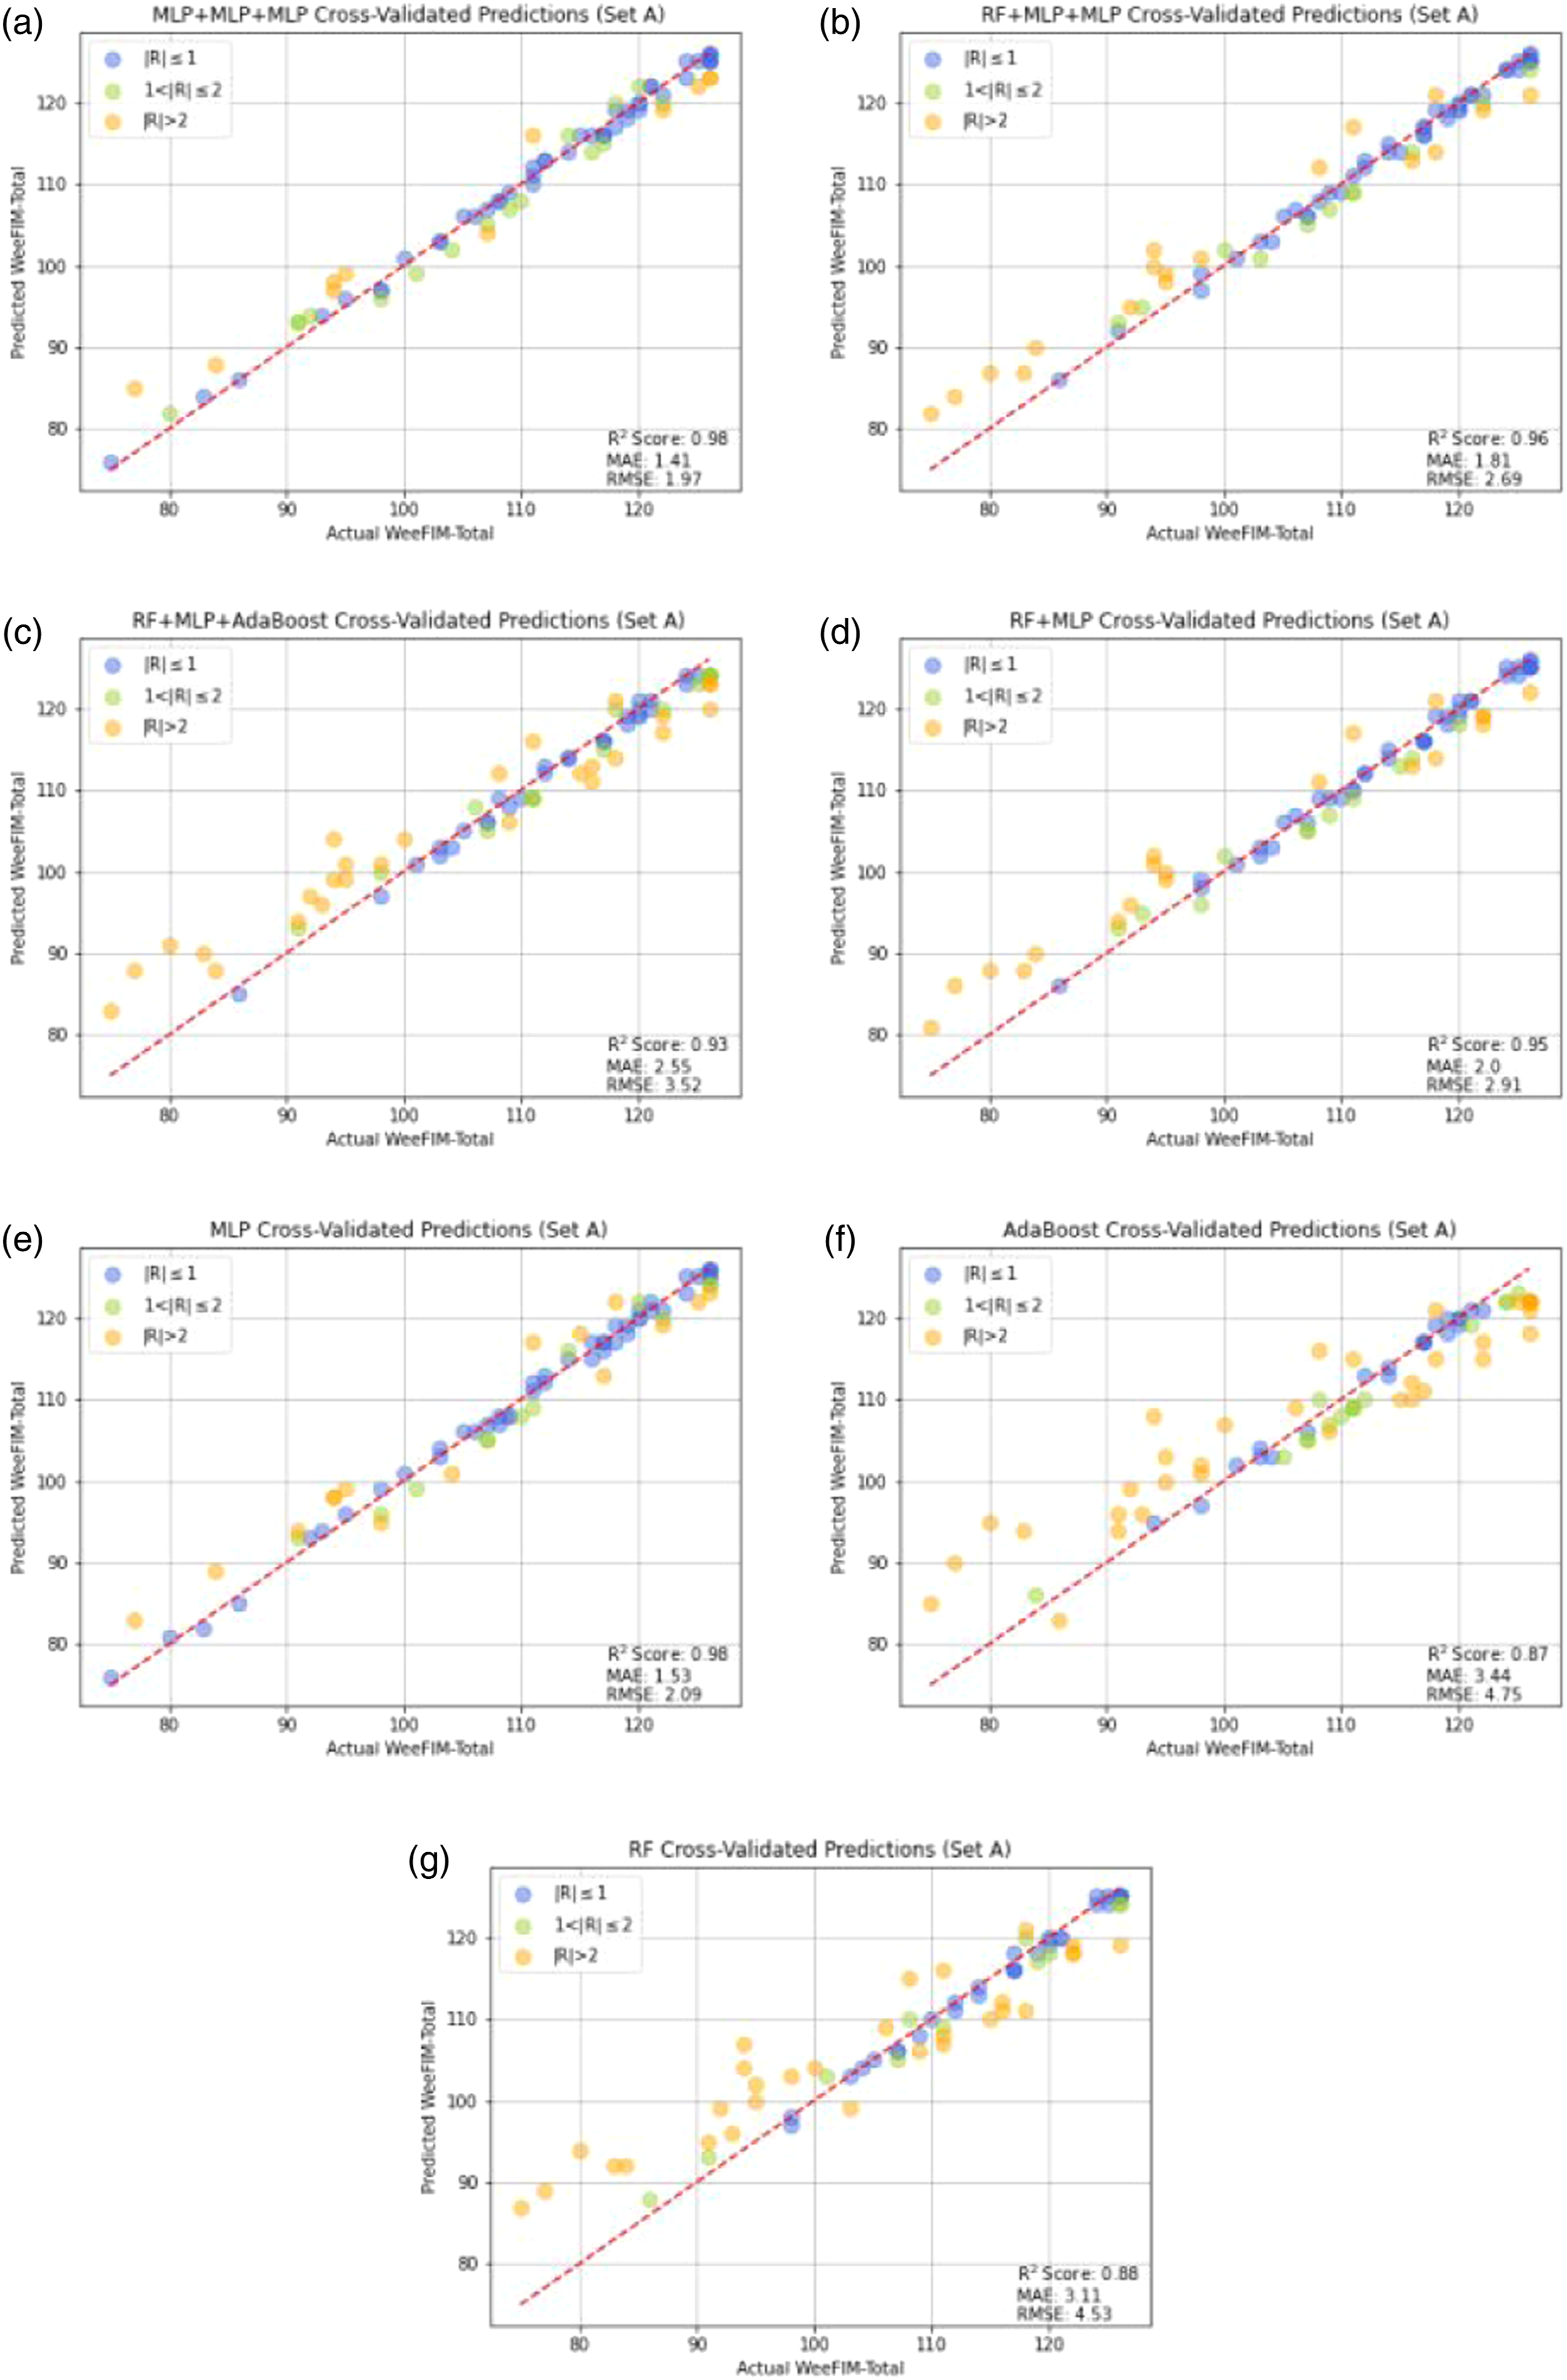
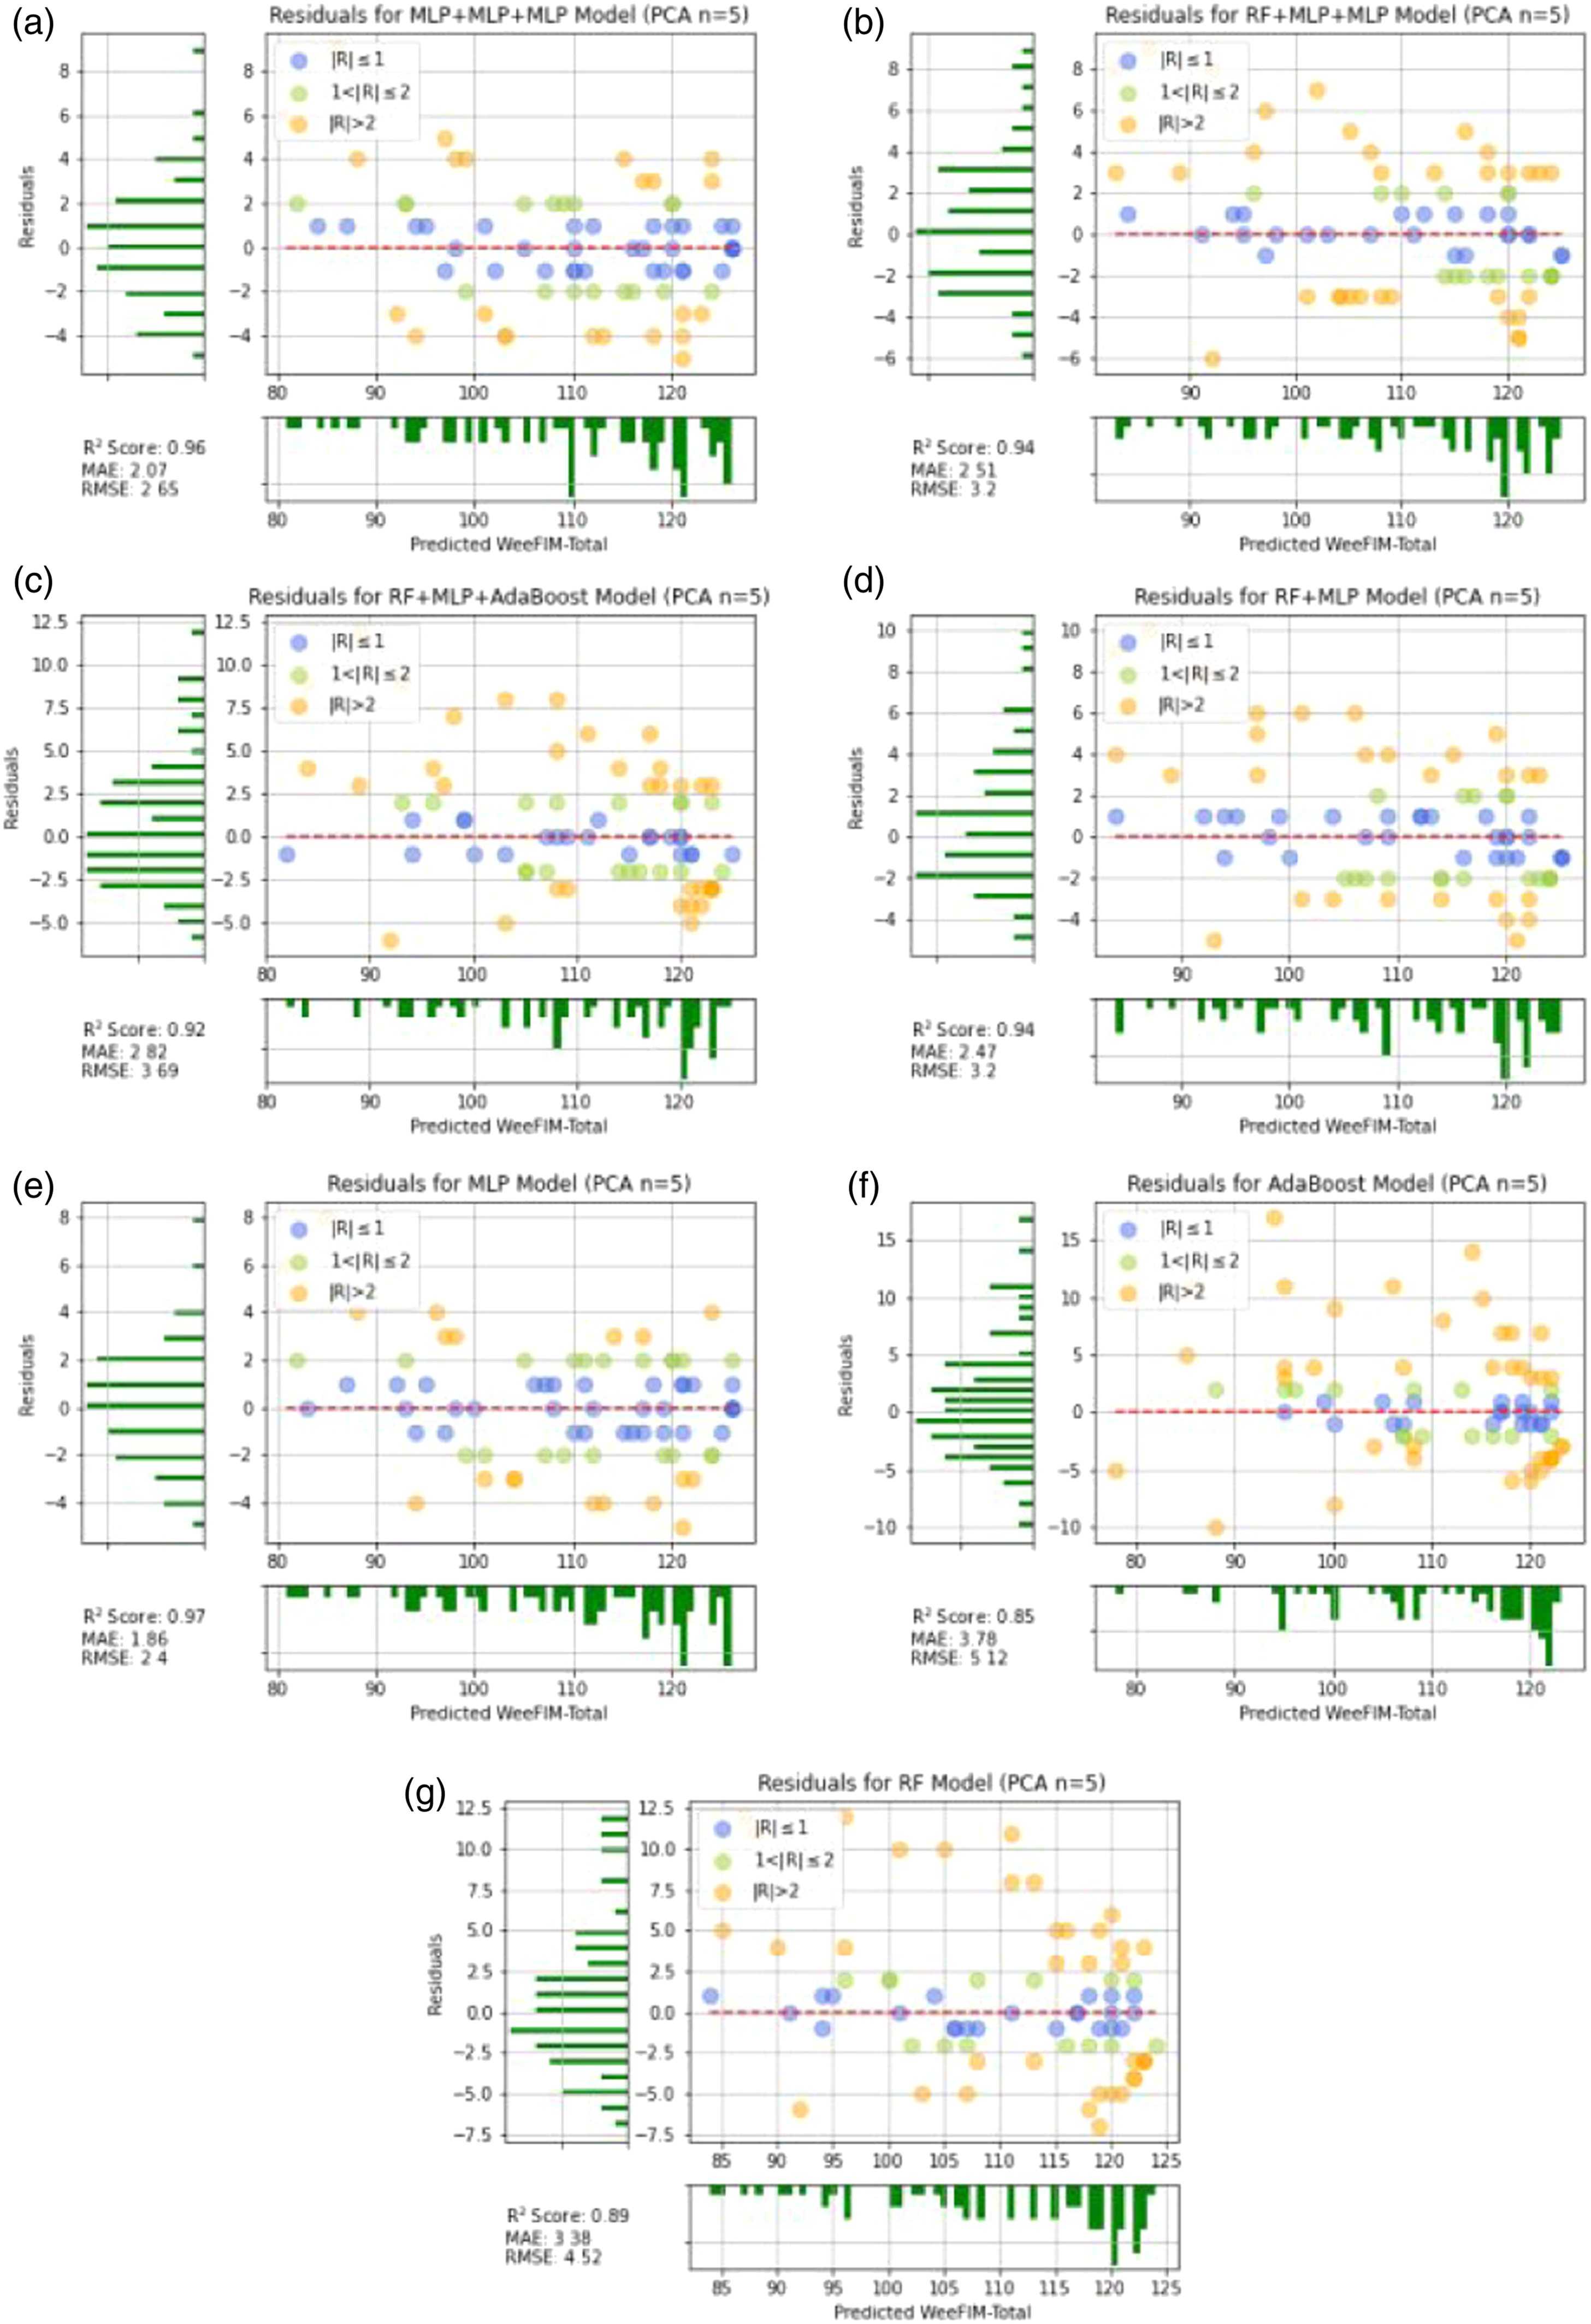
Figure 6 presents the cross-validated predictions by each model. The data predicted by the models were more concentrated than those predicted by the single ML models. The prediction of the MLP model generated more concentrated results than those generated by the other single models. Figure 7 presents the residuals of the results of WeeFIM total score prediction from Set A. The vertical and horizontal axs respectively represent the residuals and predicted values, respectively. The residuals of the WeeFIM-Total prediction results from Set A. (a) MLP + MLP + MLP, (b) RF + MLP + MLP, (c) RF + MLP + Adaboost, (d) RF + MLP, (e) MLP, (f) Adaboost, (g) RF.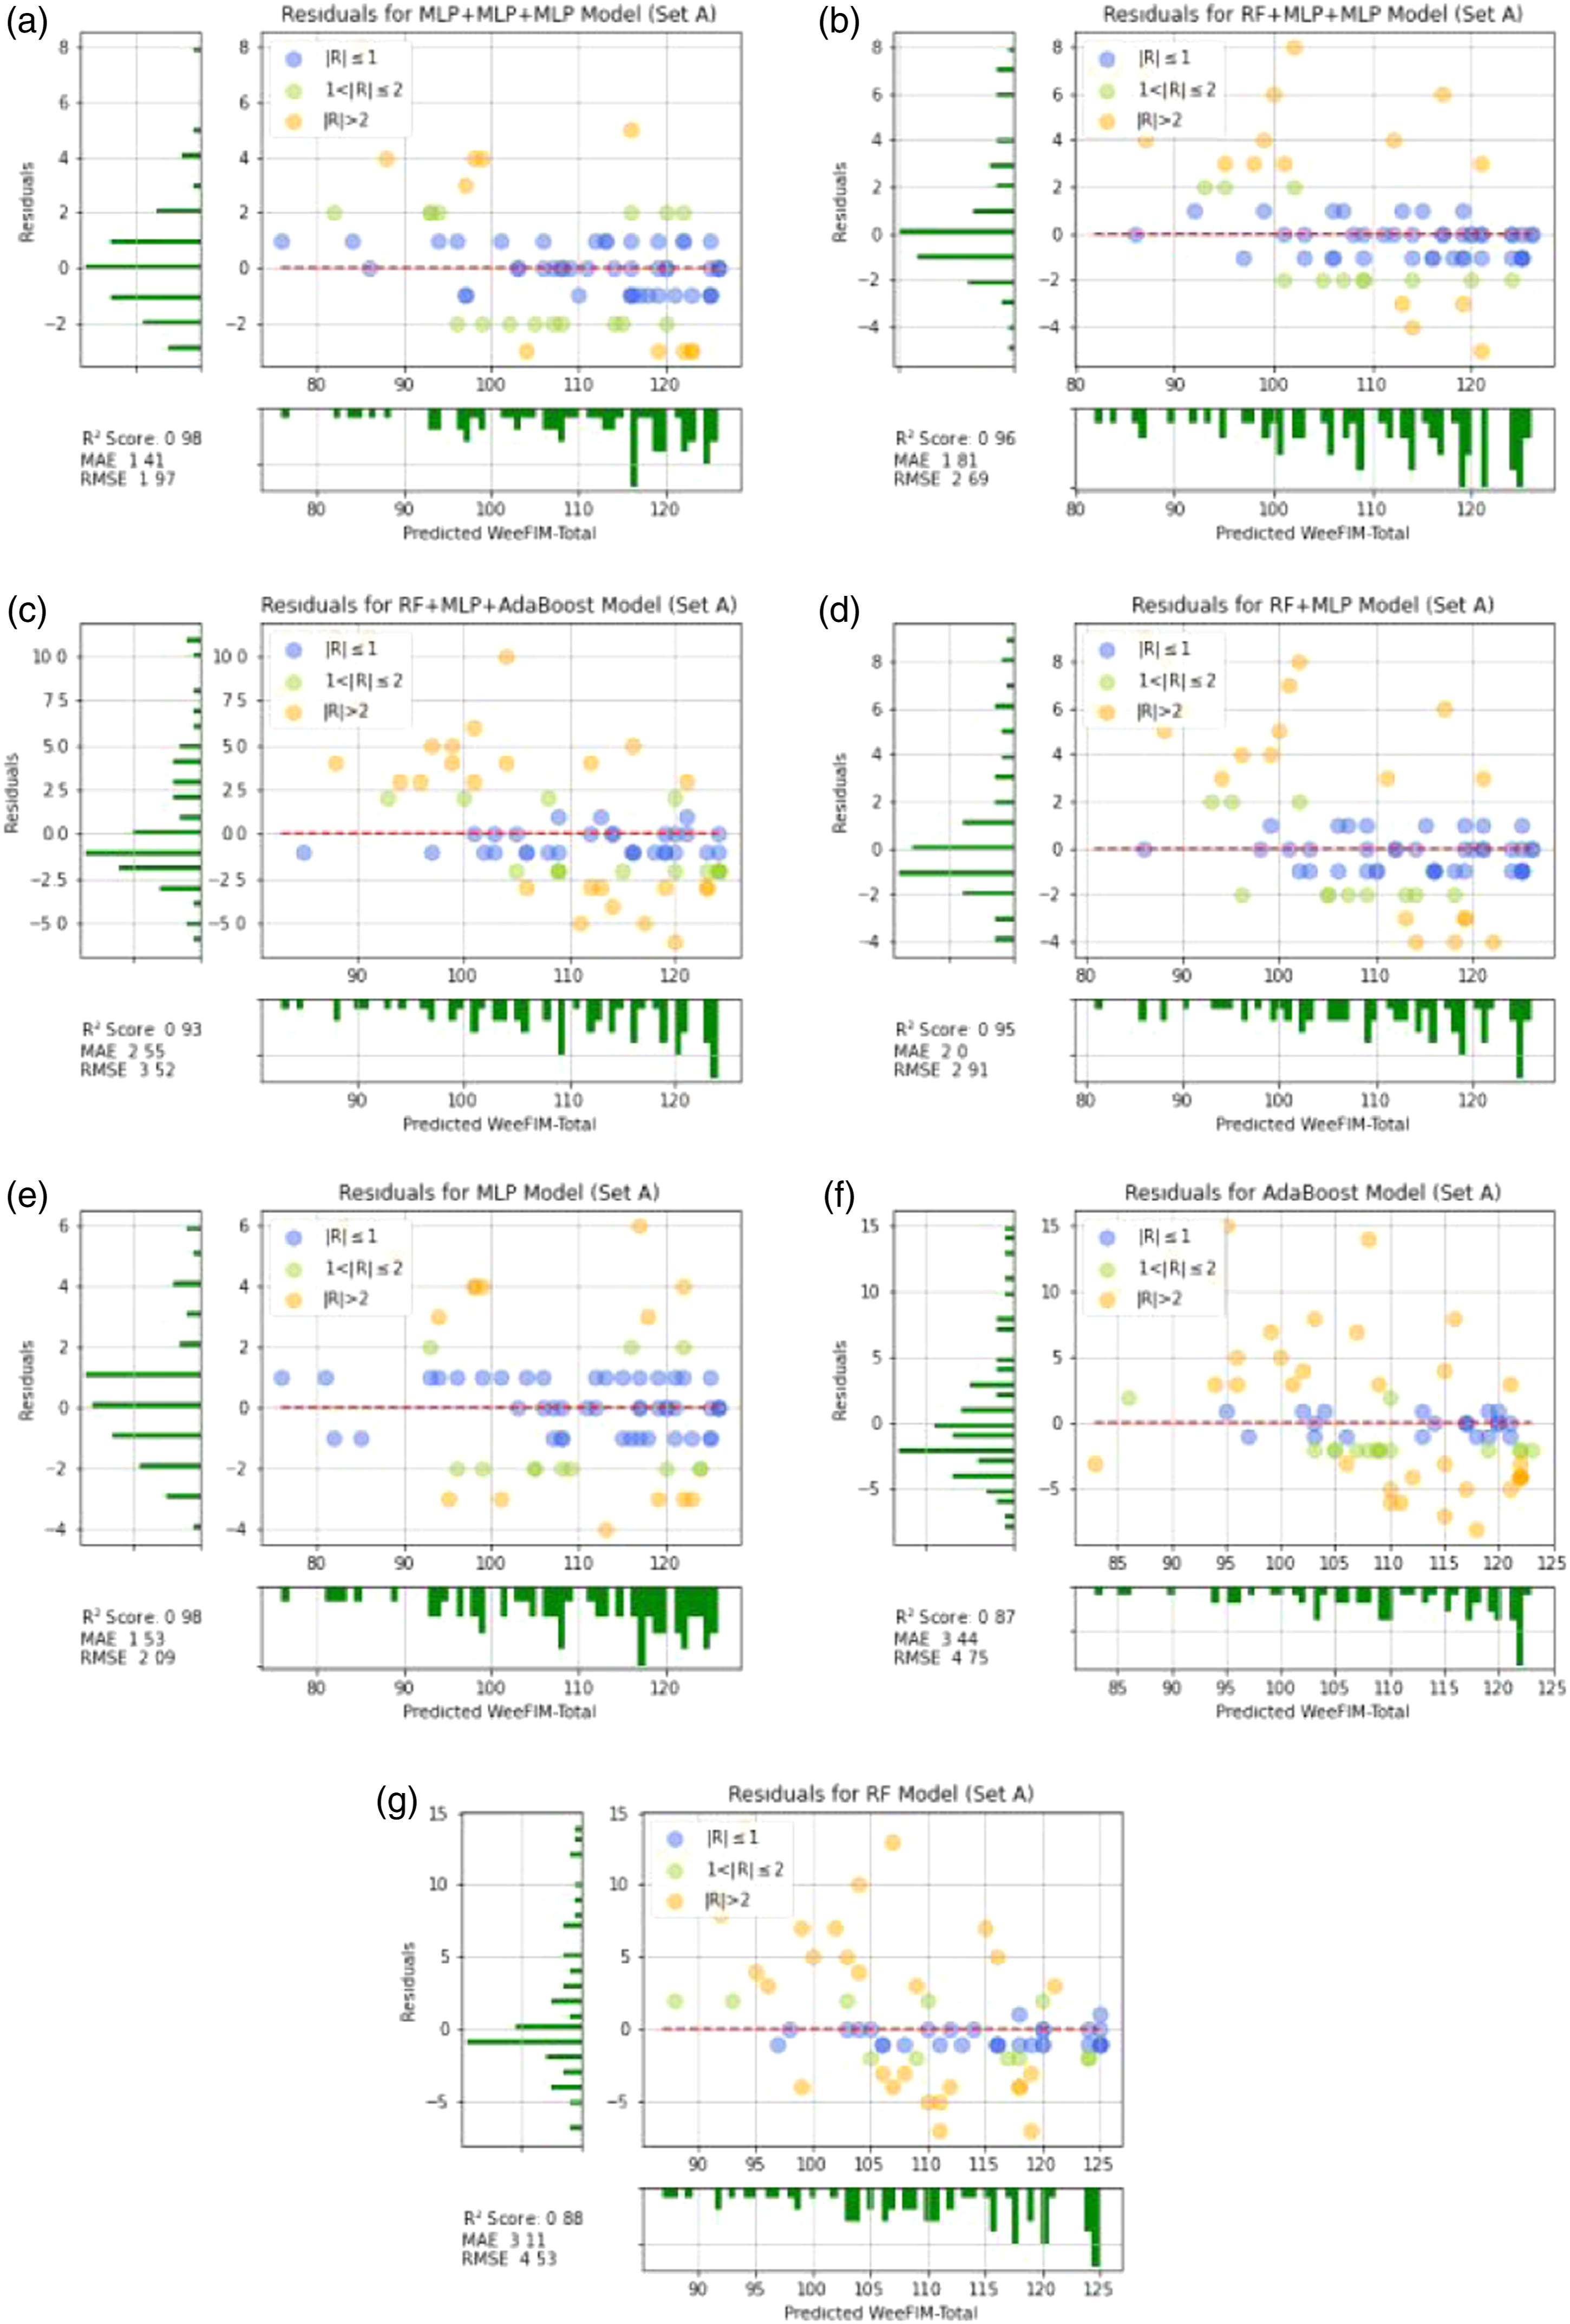
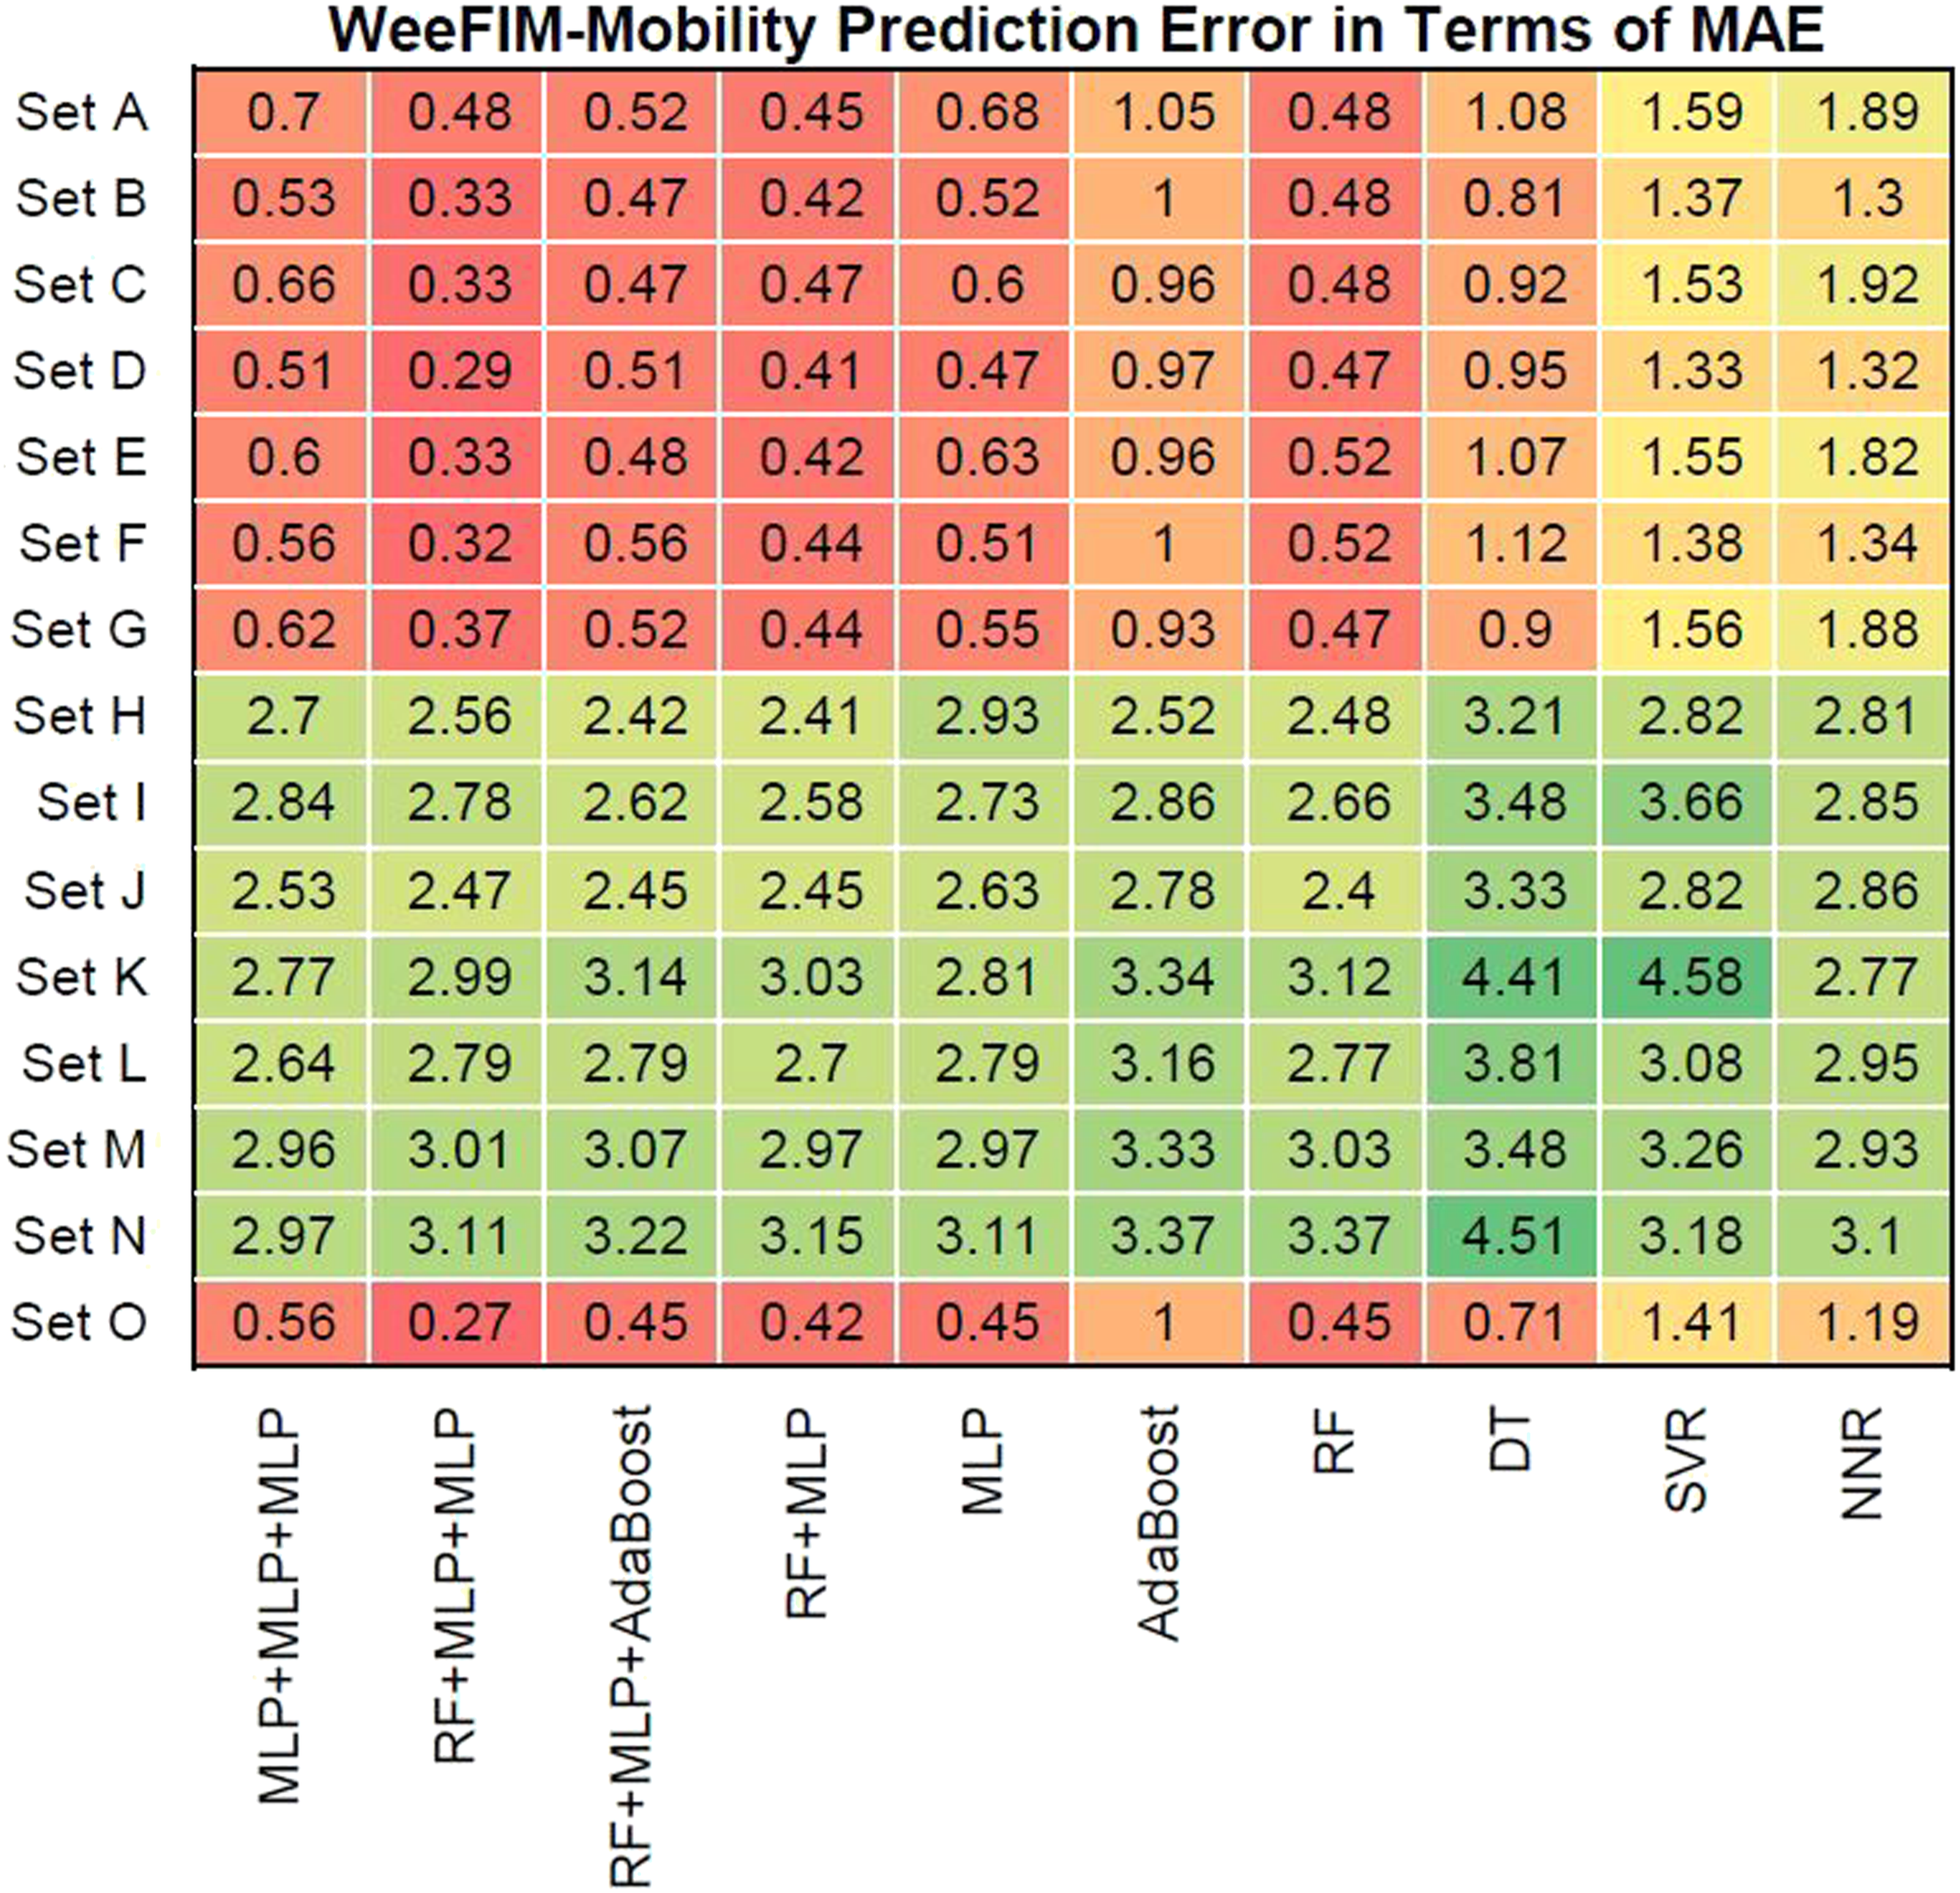
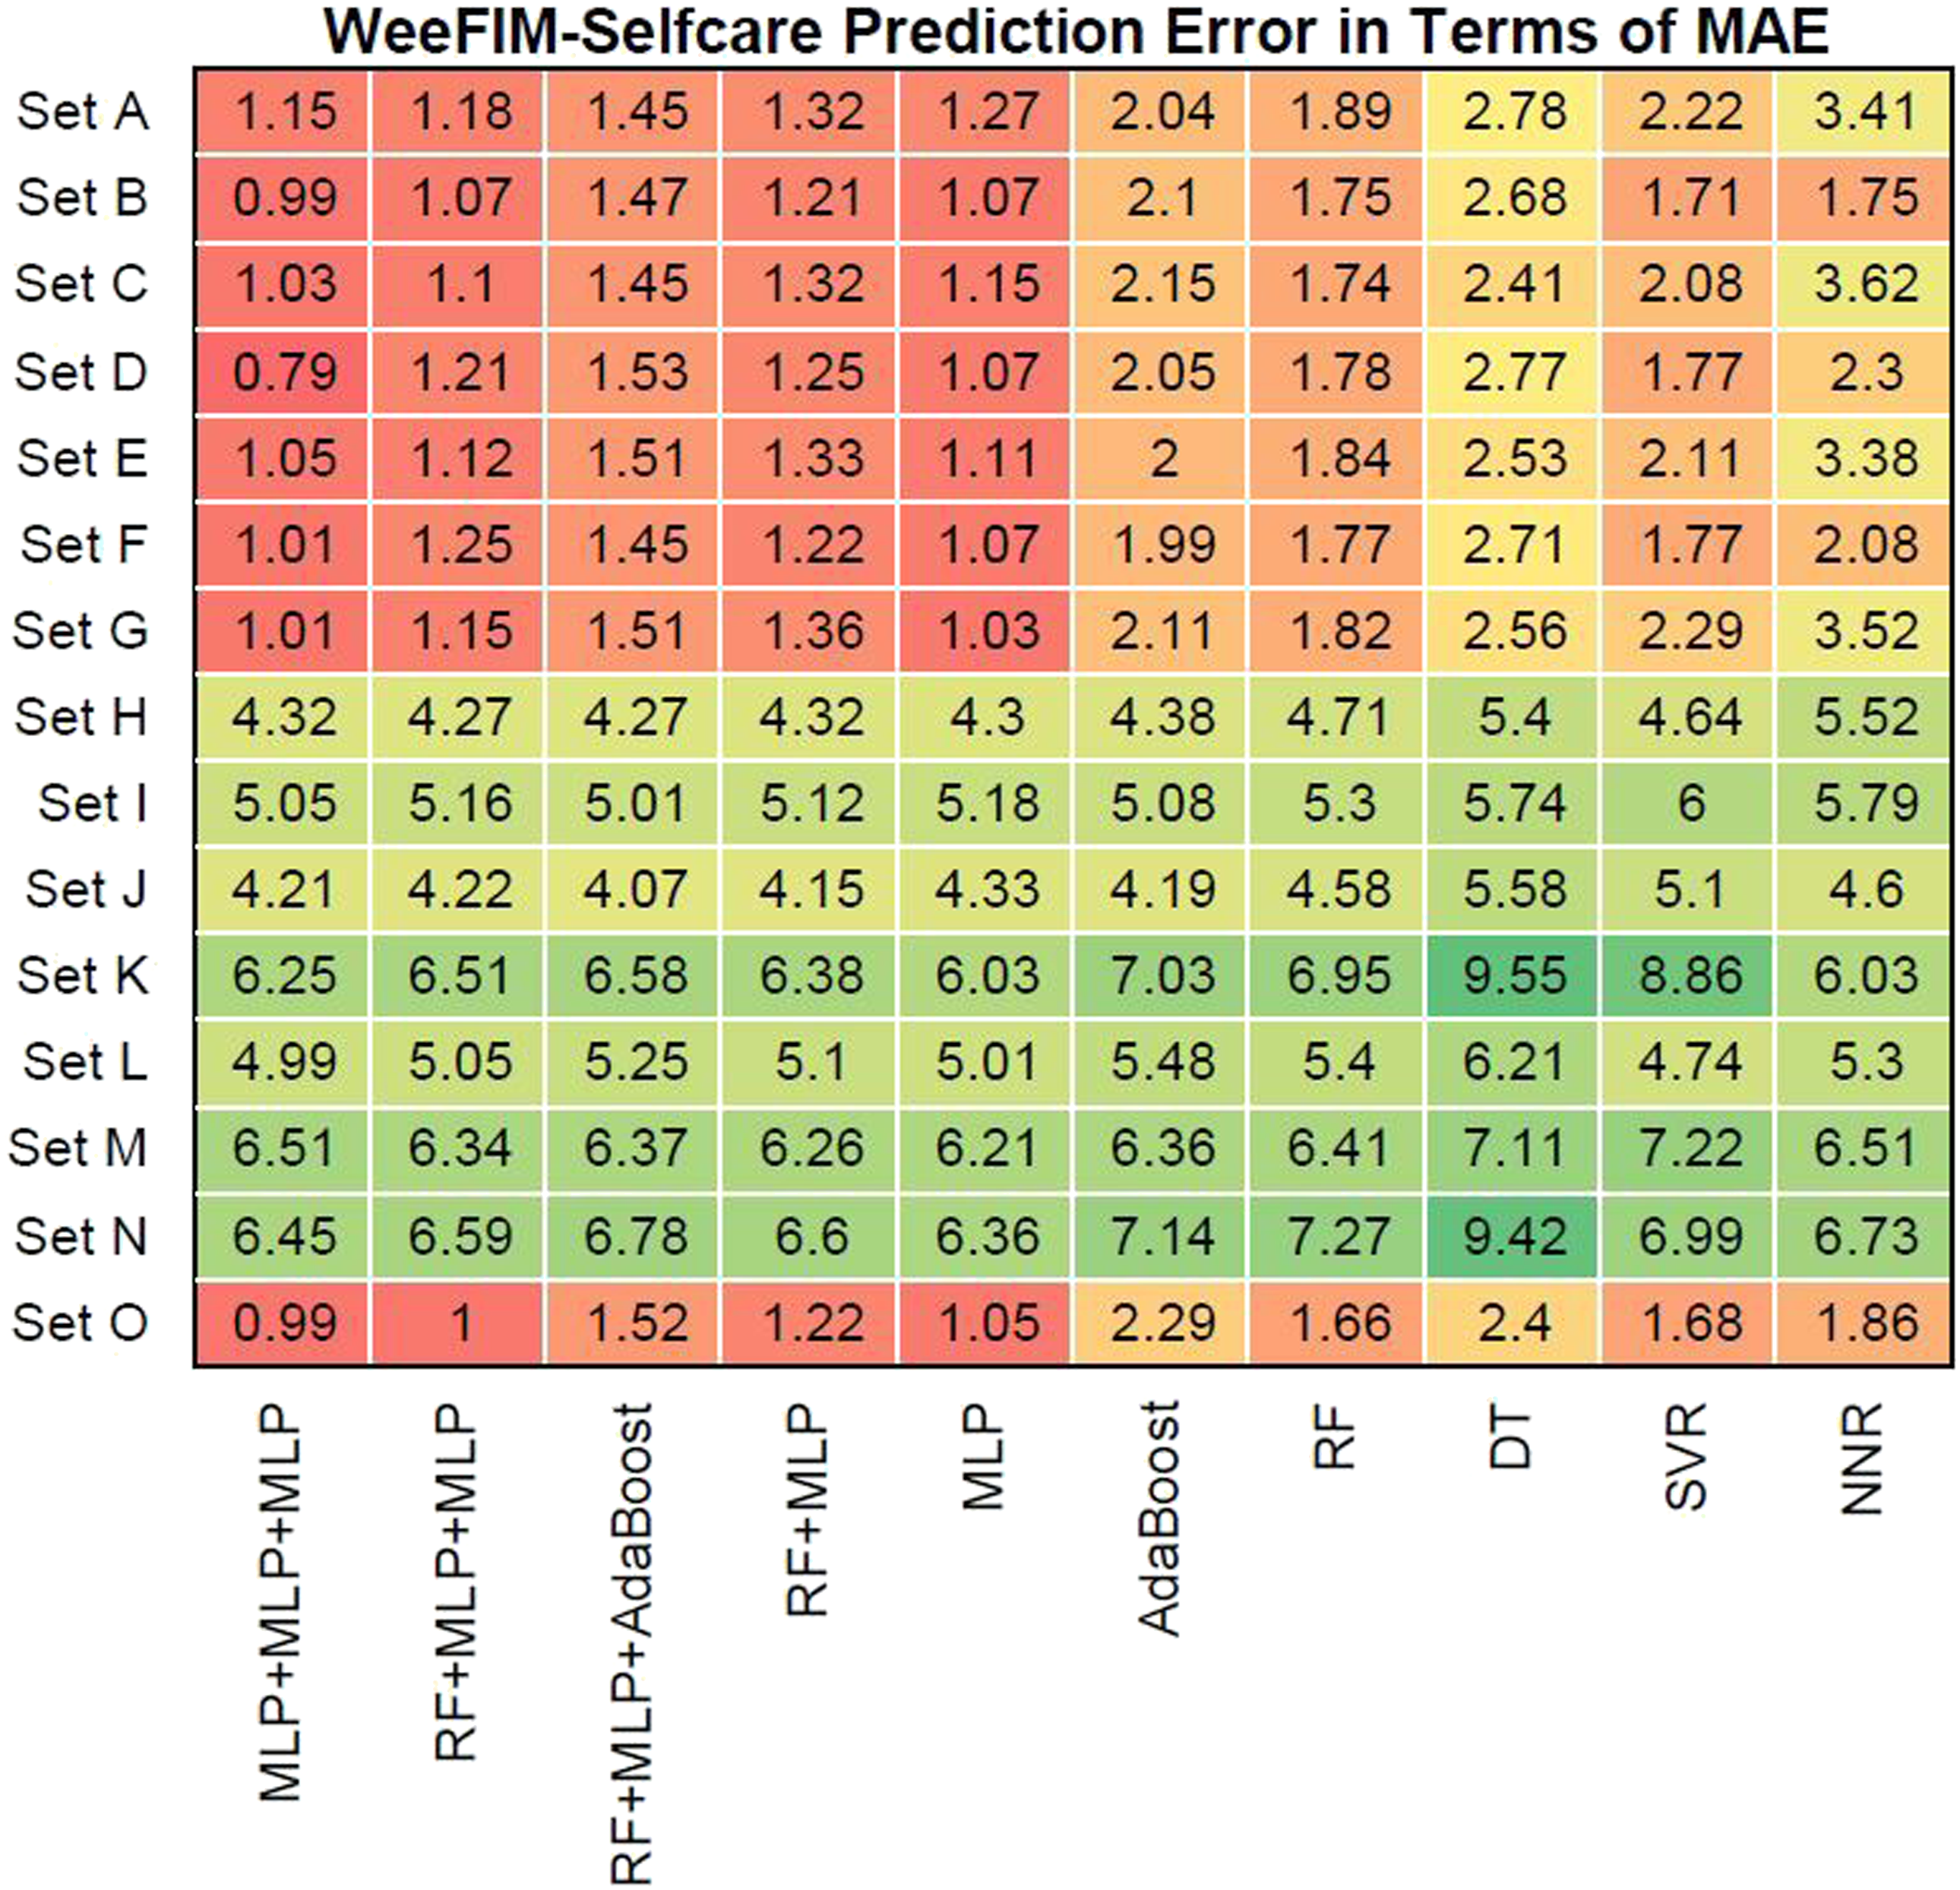
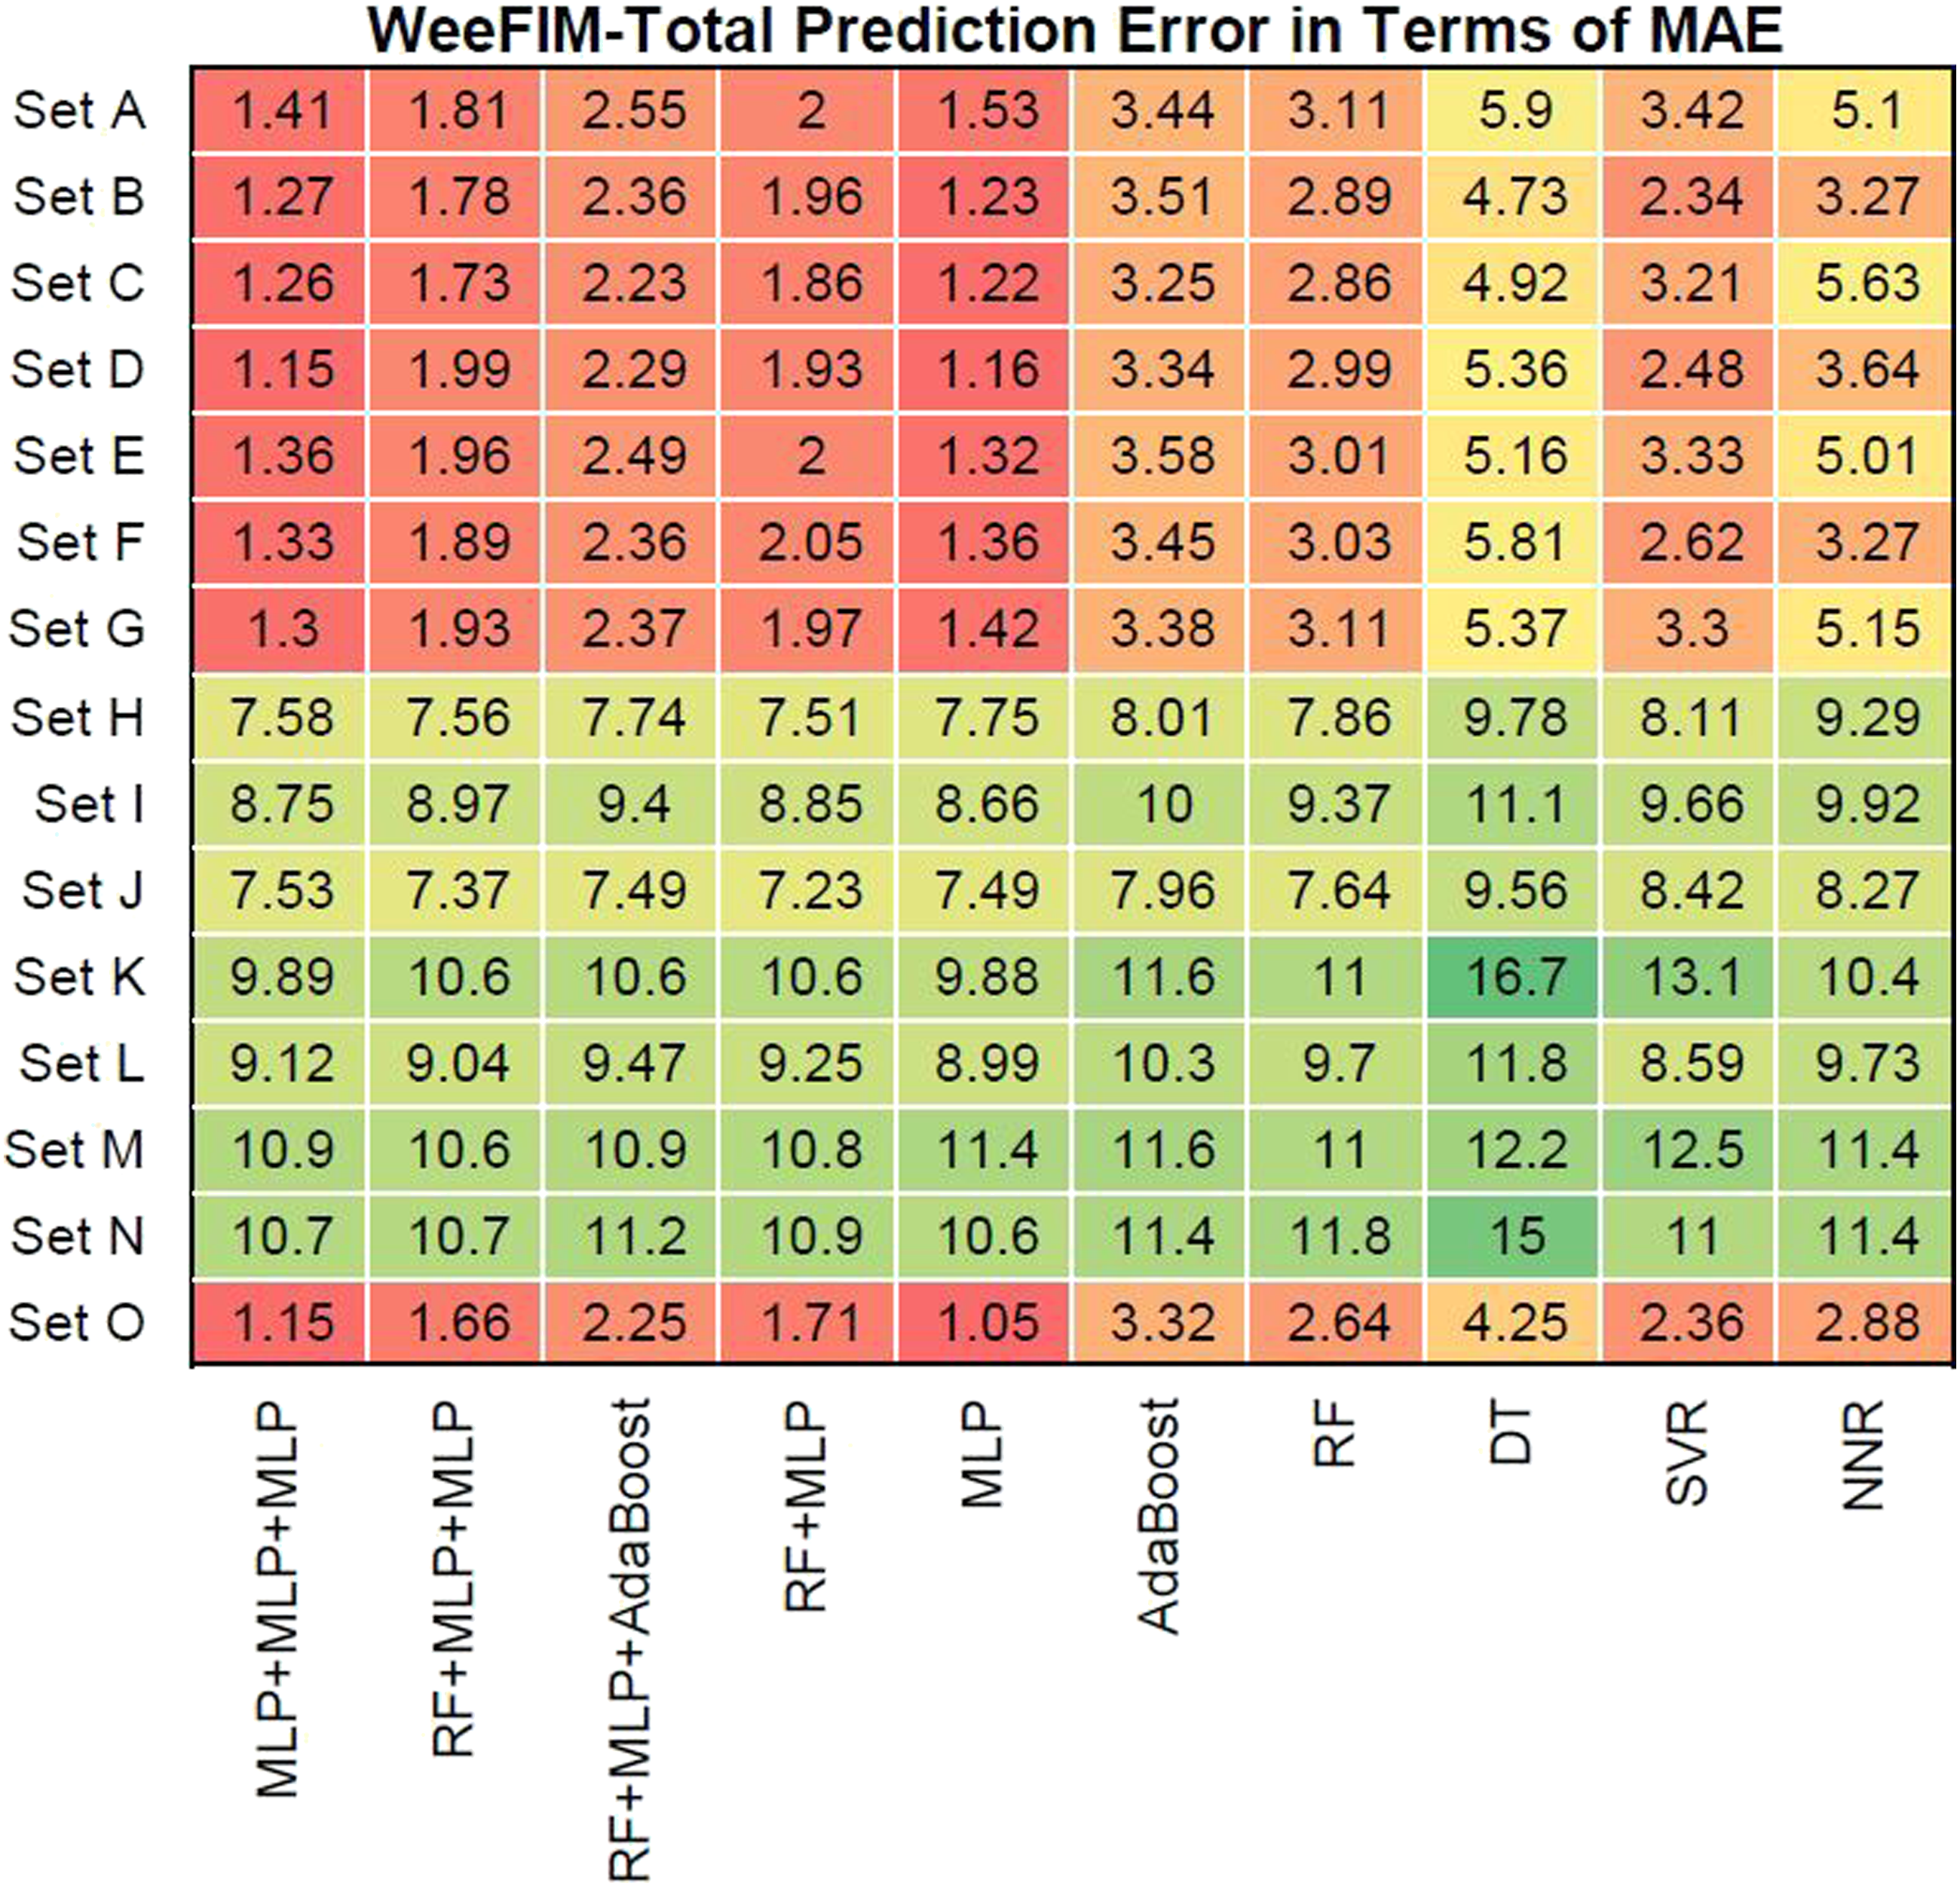
We evaluated prediction error in terms of the mean absolute error (MAE) of the models for WeeFIM cognition, WeeFIM mobility, WeeFIM selfcare, and WeeFIM total. Figures 8–11 (WeeFIM total), respectively. The four ensemble learning models had a low prediction error for Sets A–G and O. Therefore, the ensemble learning models are accurate. The MLP learning model has a lower prediction error than do the other learning models, indicating higher accuracy. The prediction error in terms of MAE (WeeFIM–Cognition). The prediction error in terms of MAE (WeeFIM–Mobility). The prediction error in terms of MAE (WeeFIM–Selfcare). The prediction error in terms of MAE (WeeFIM–Total).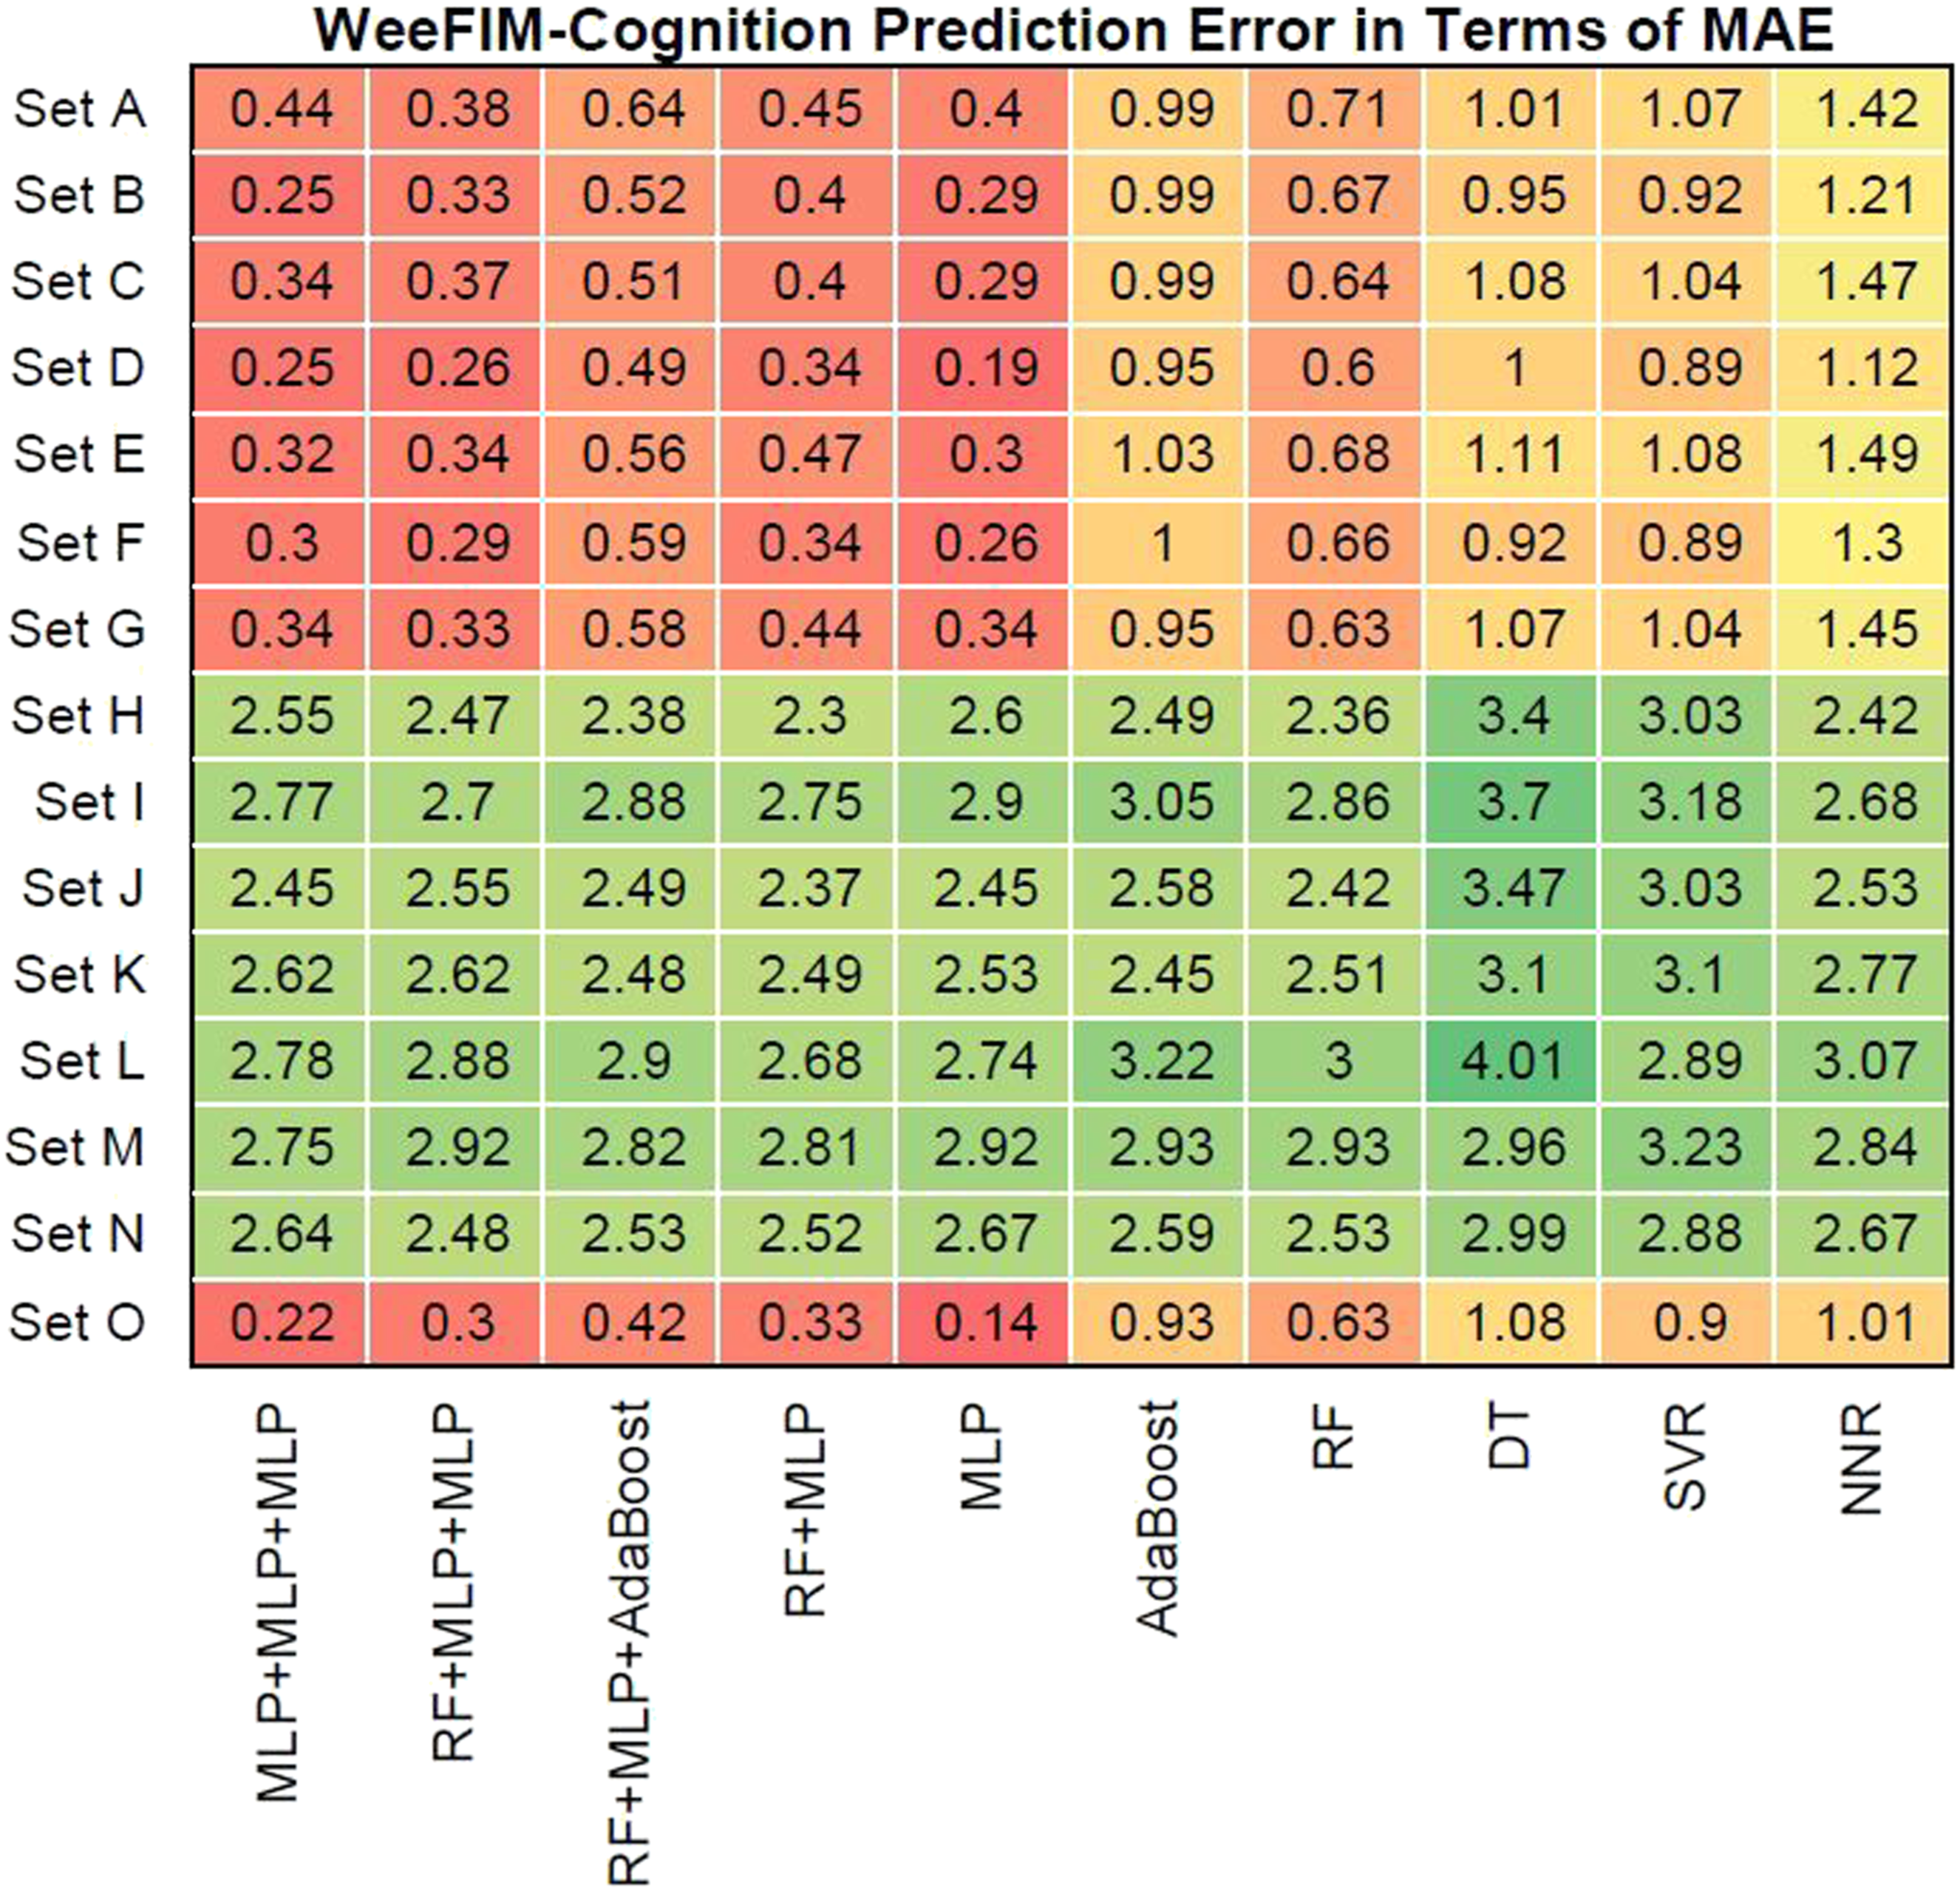
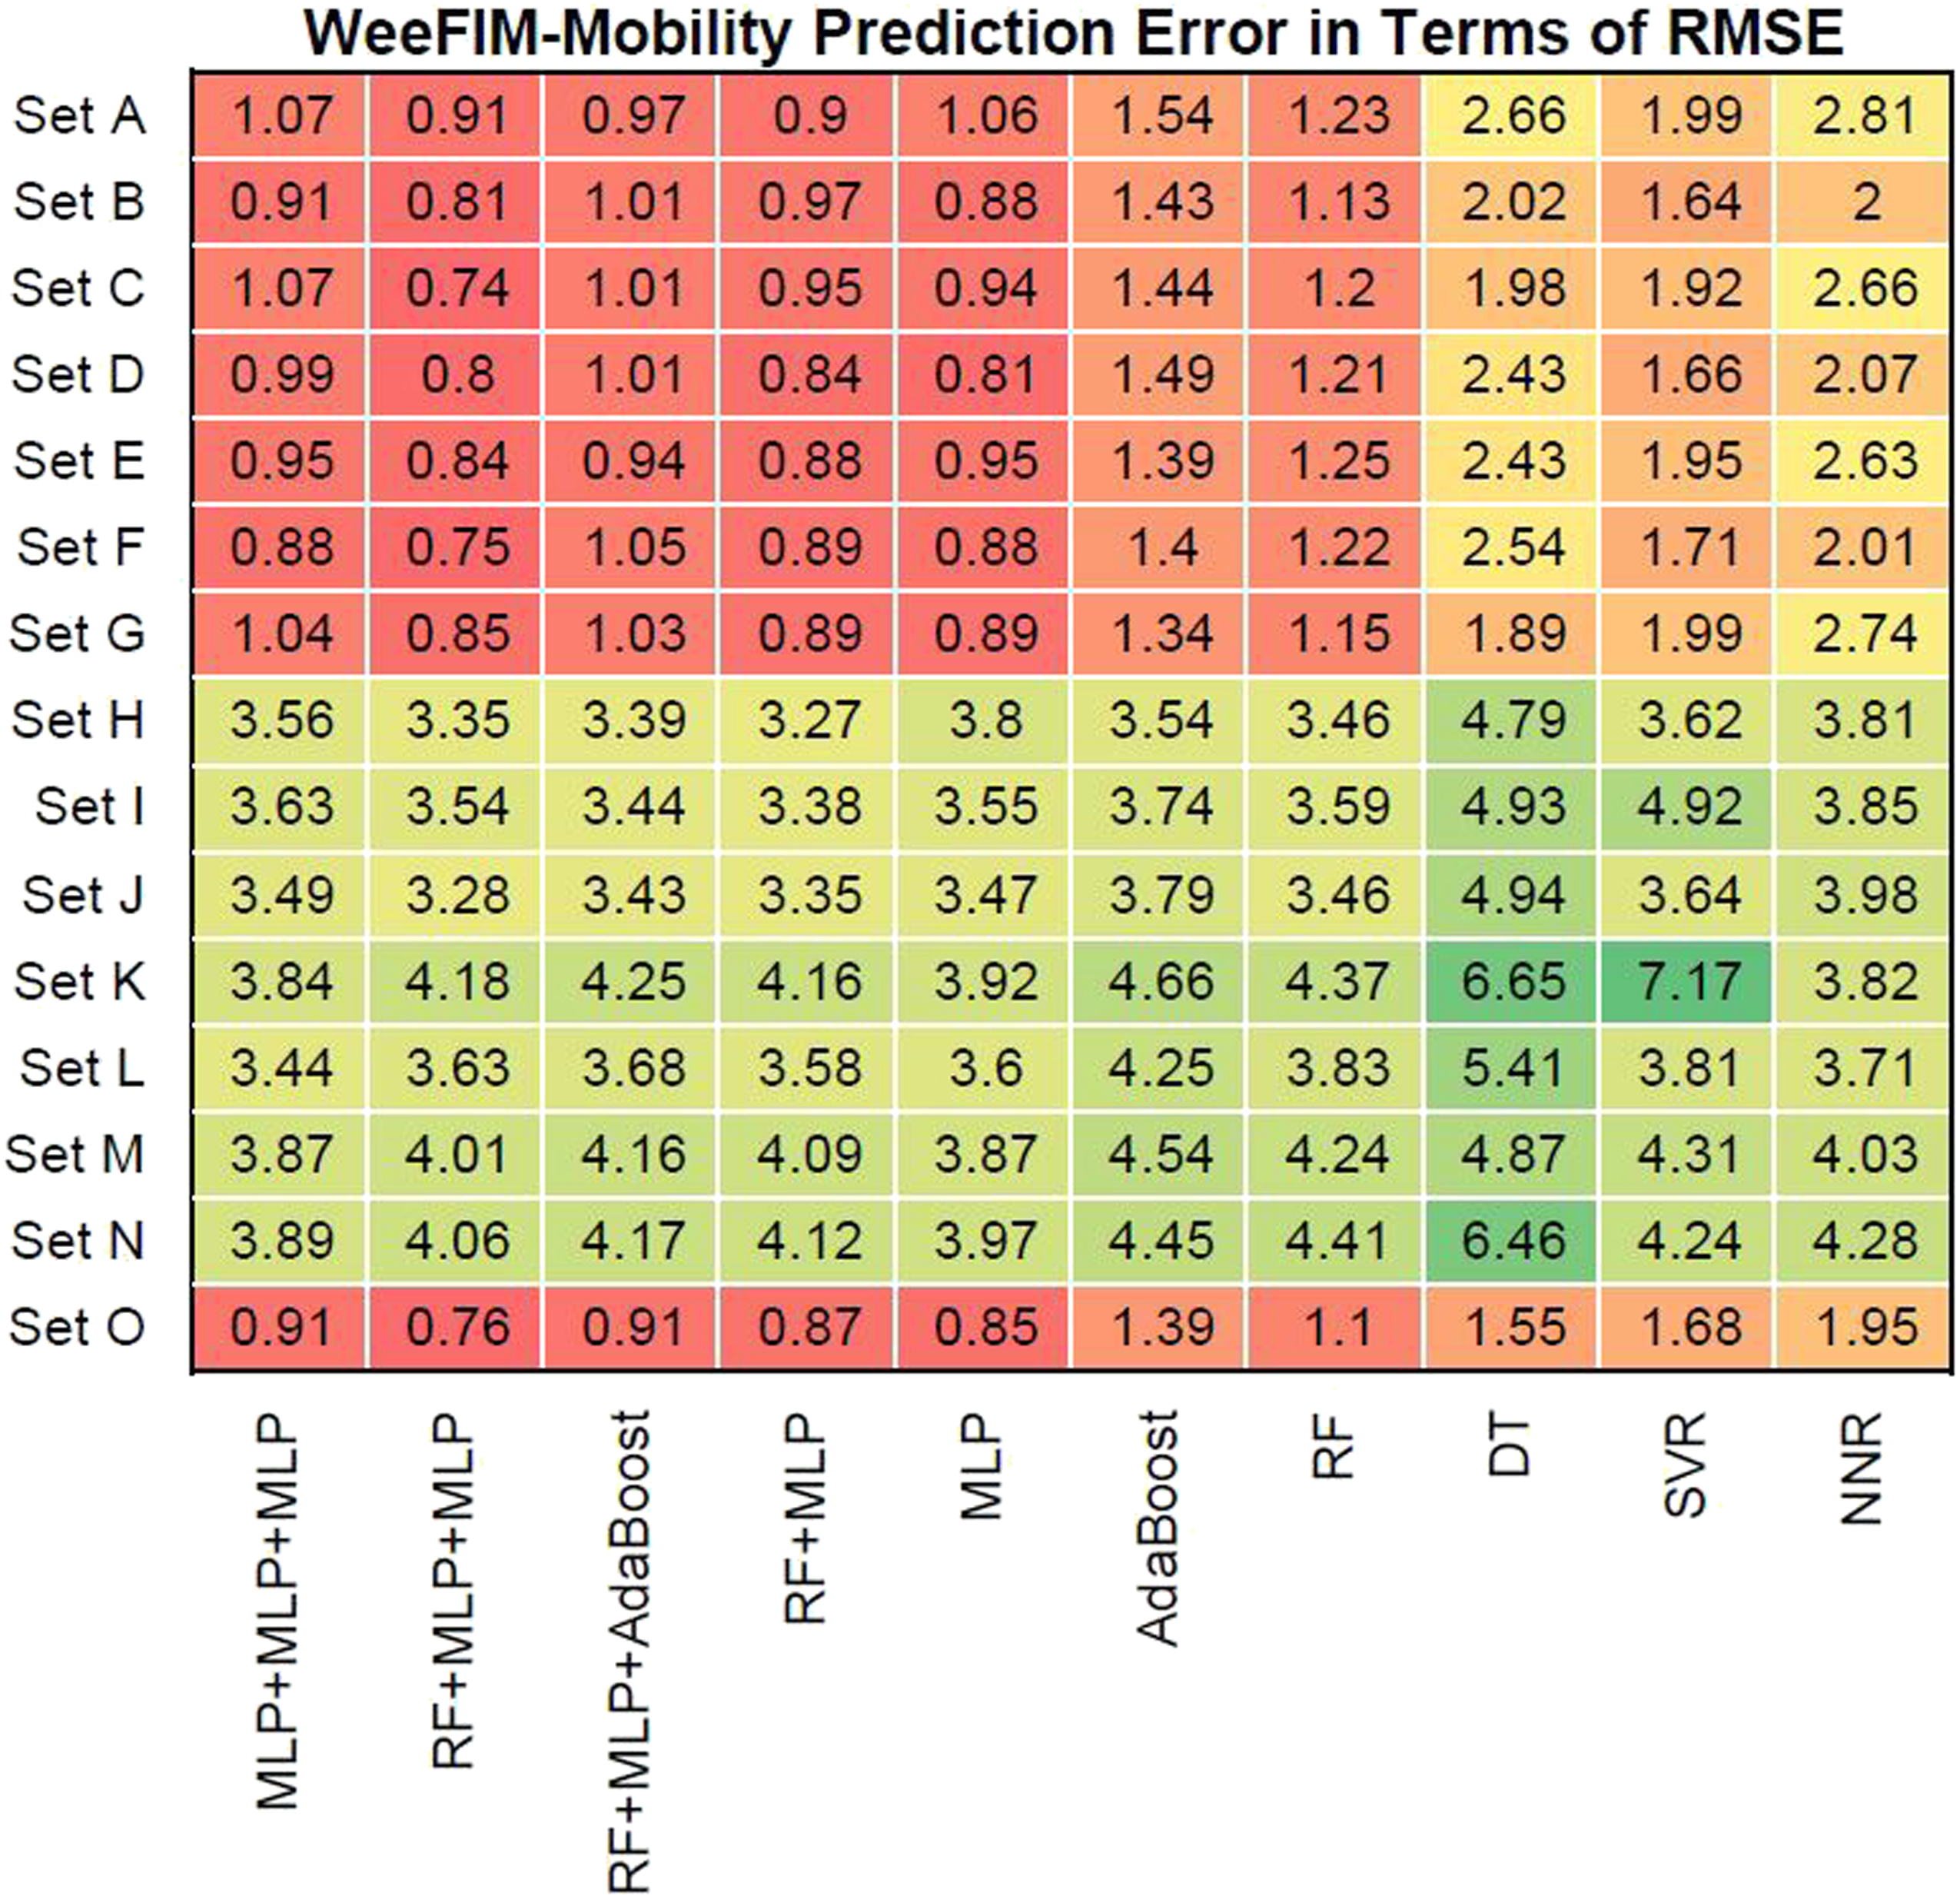
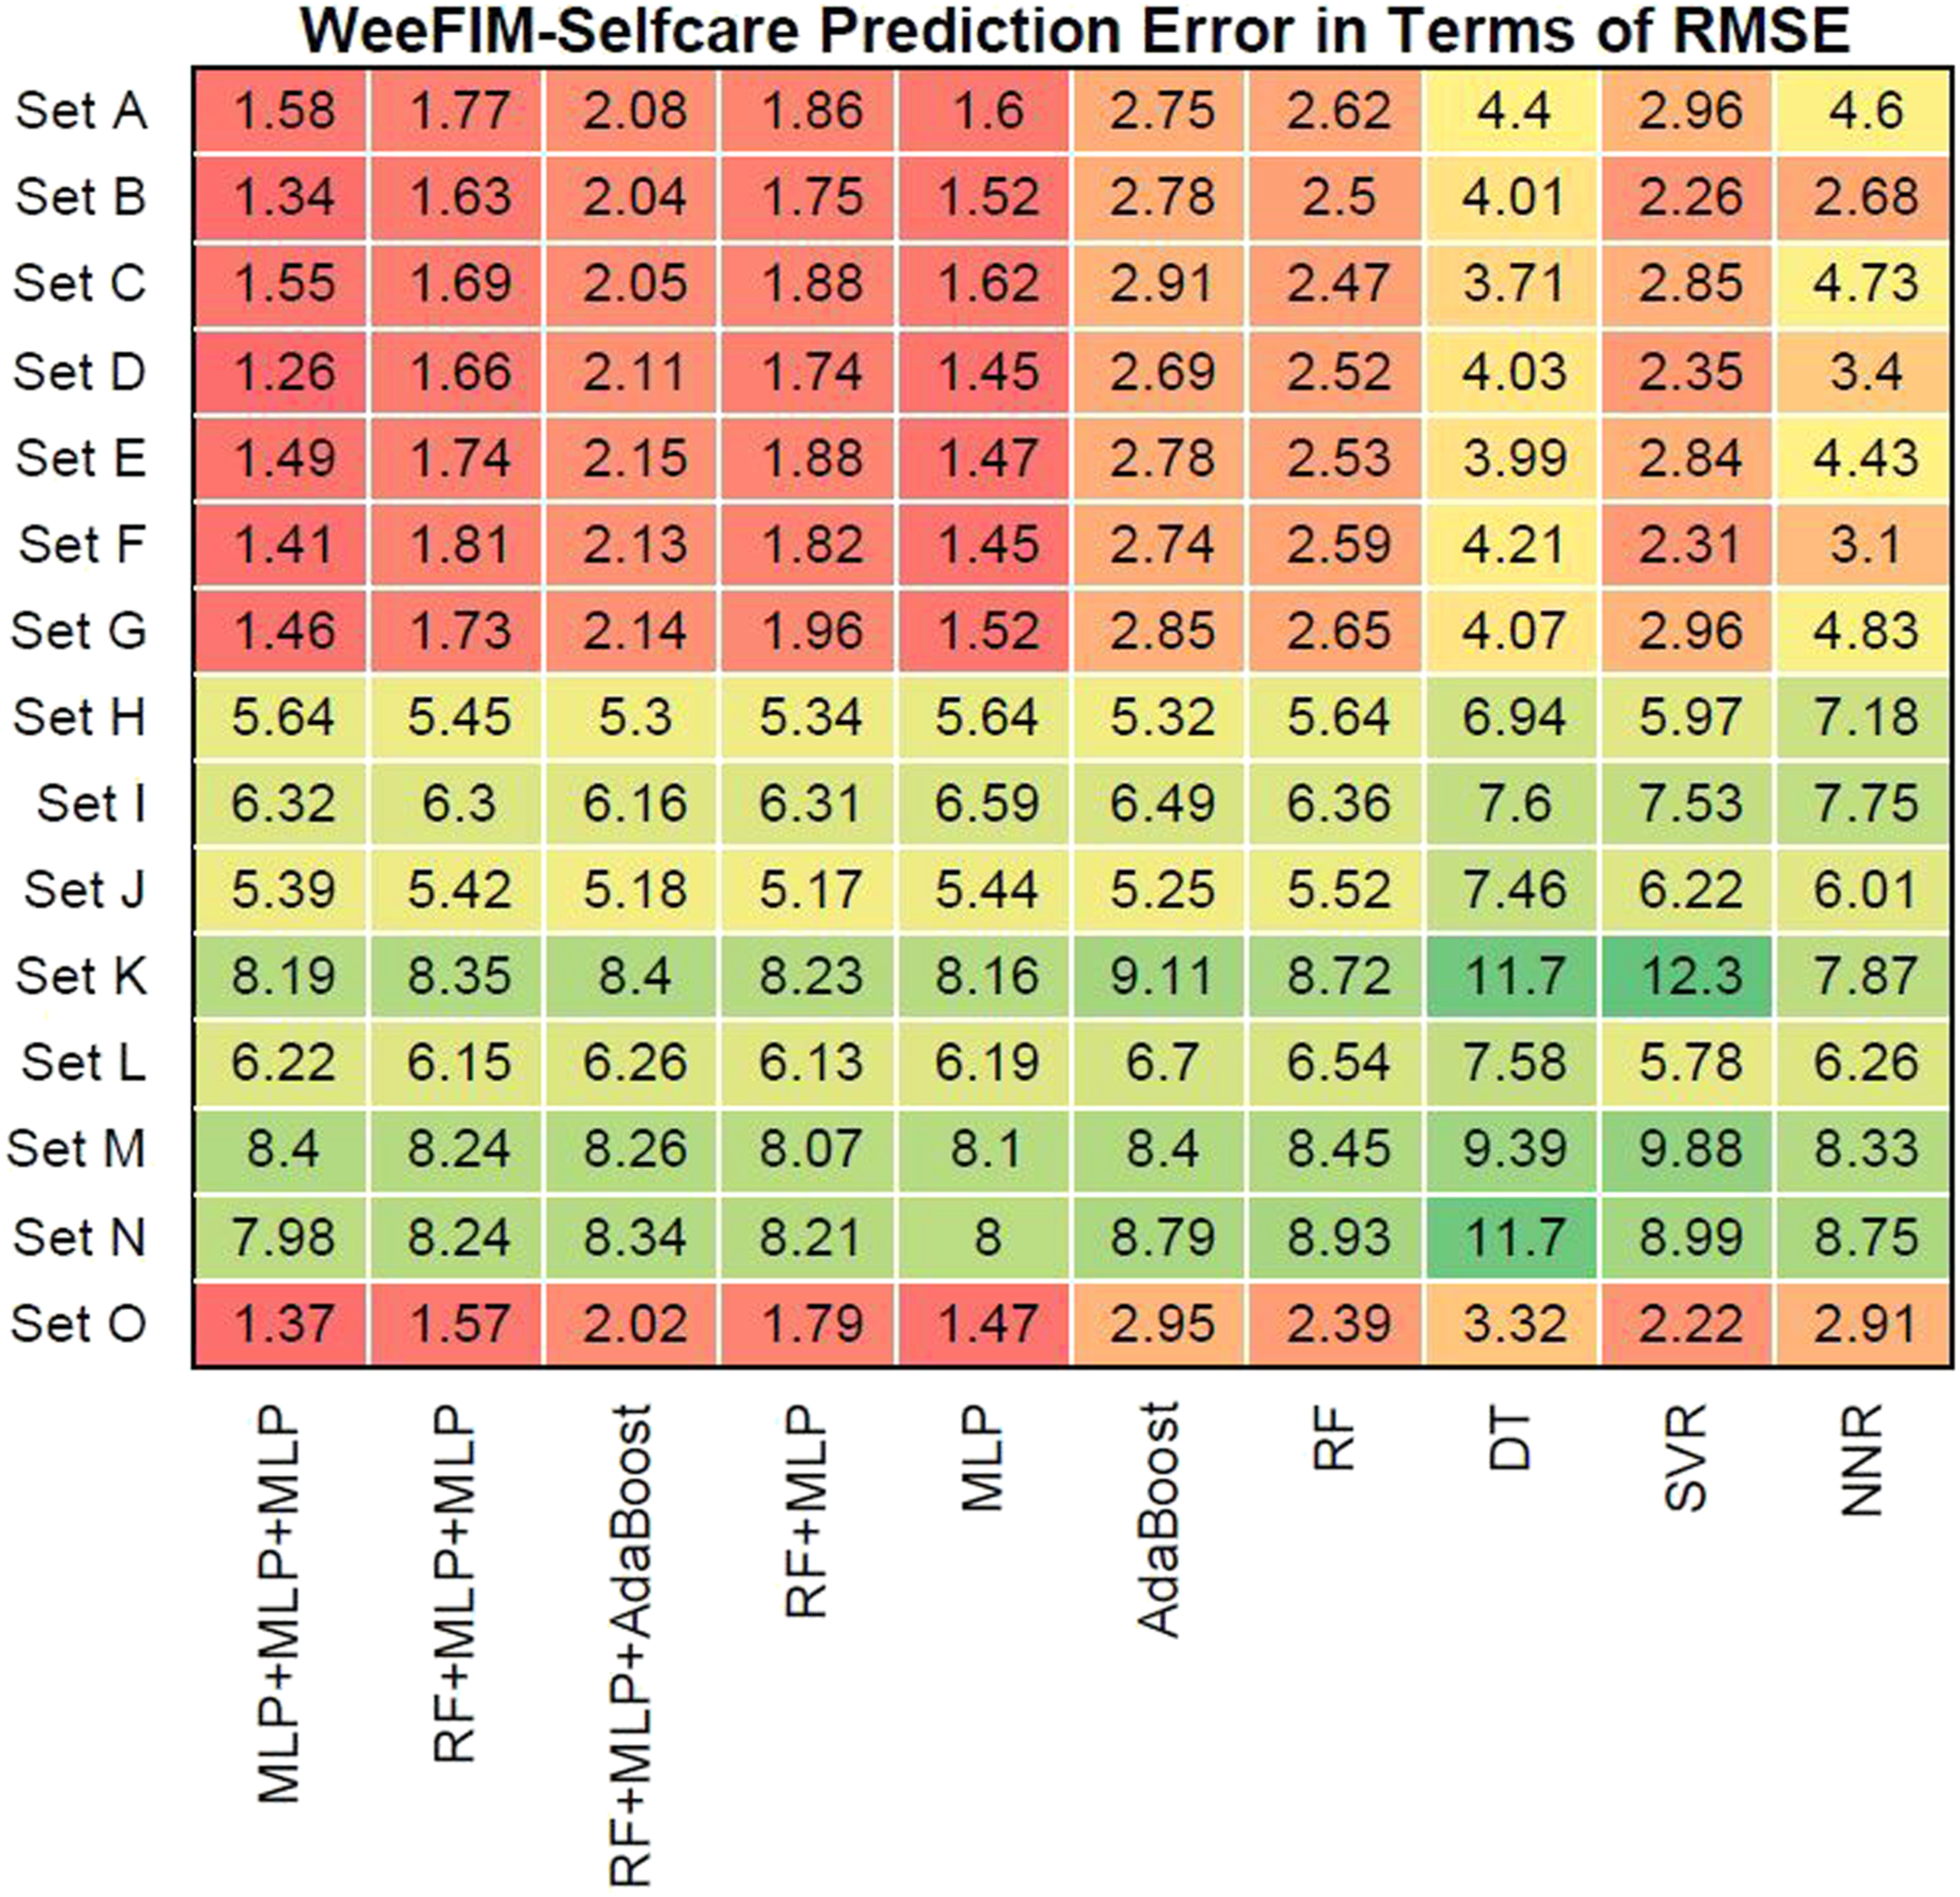
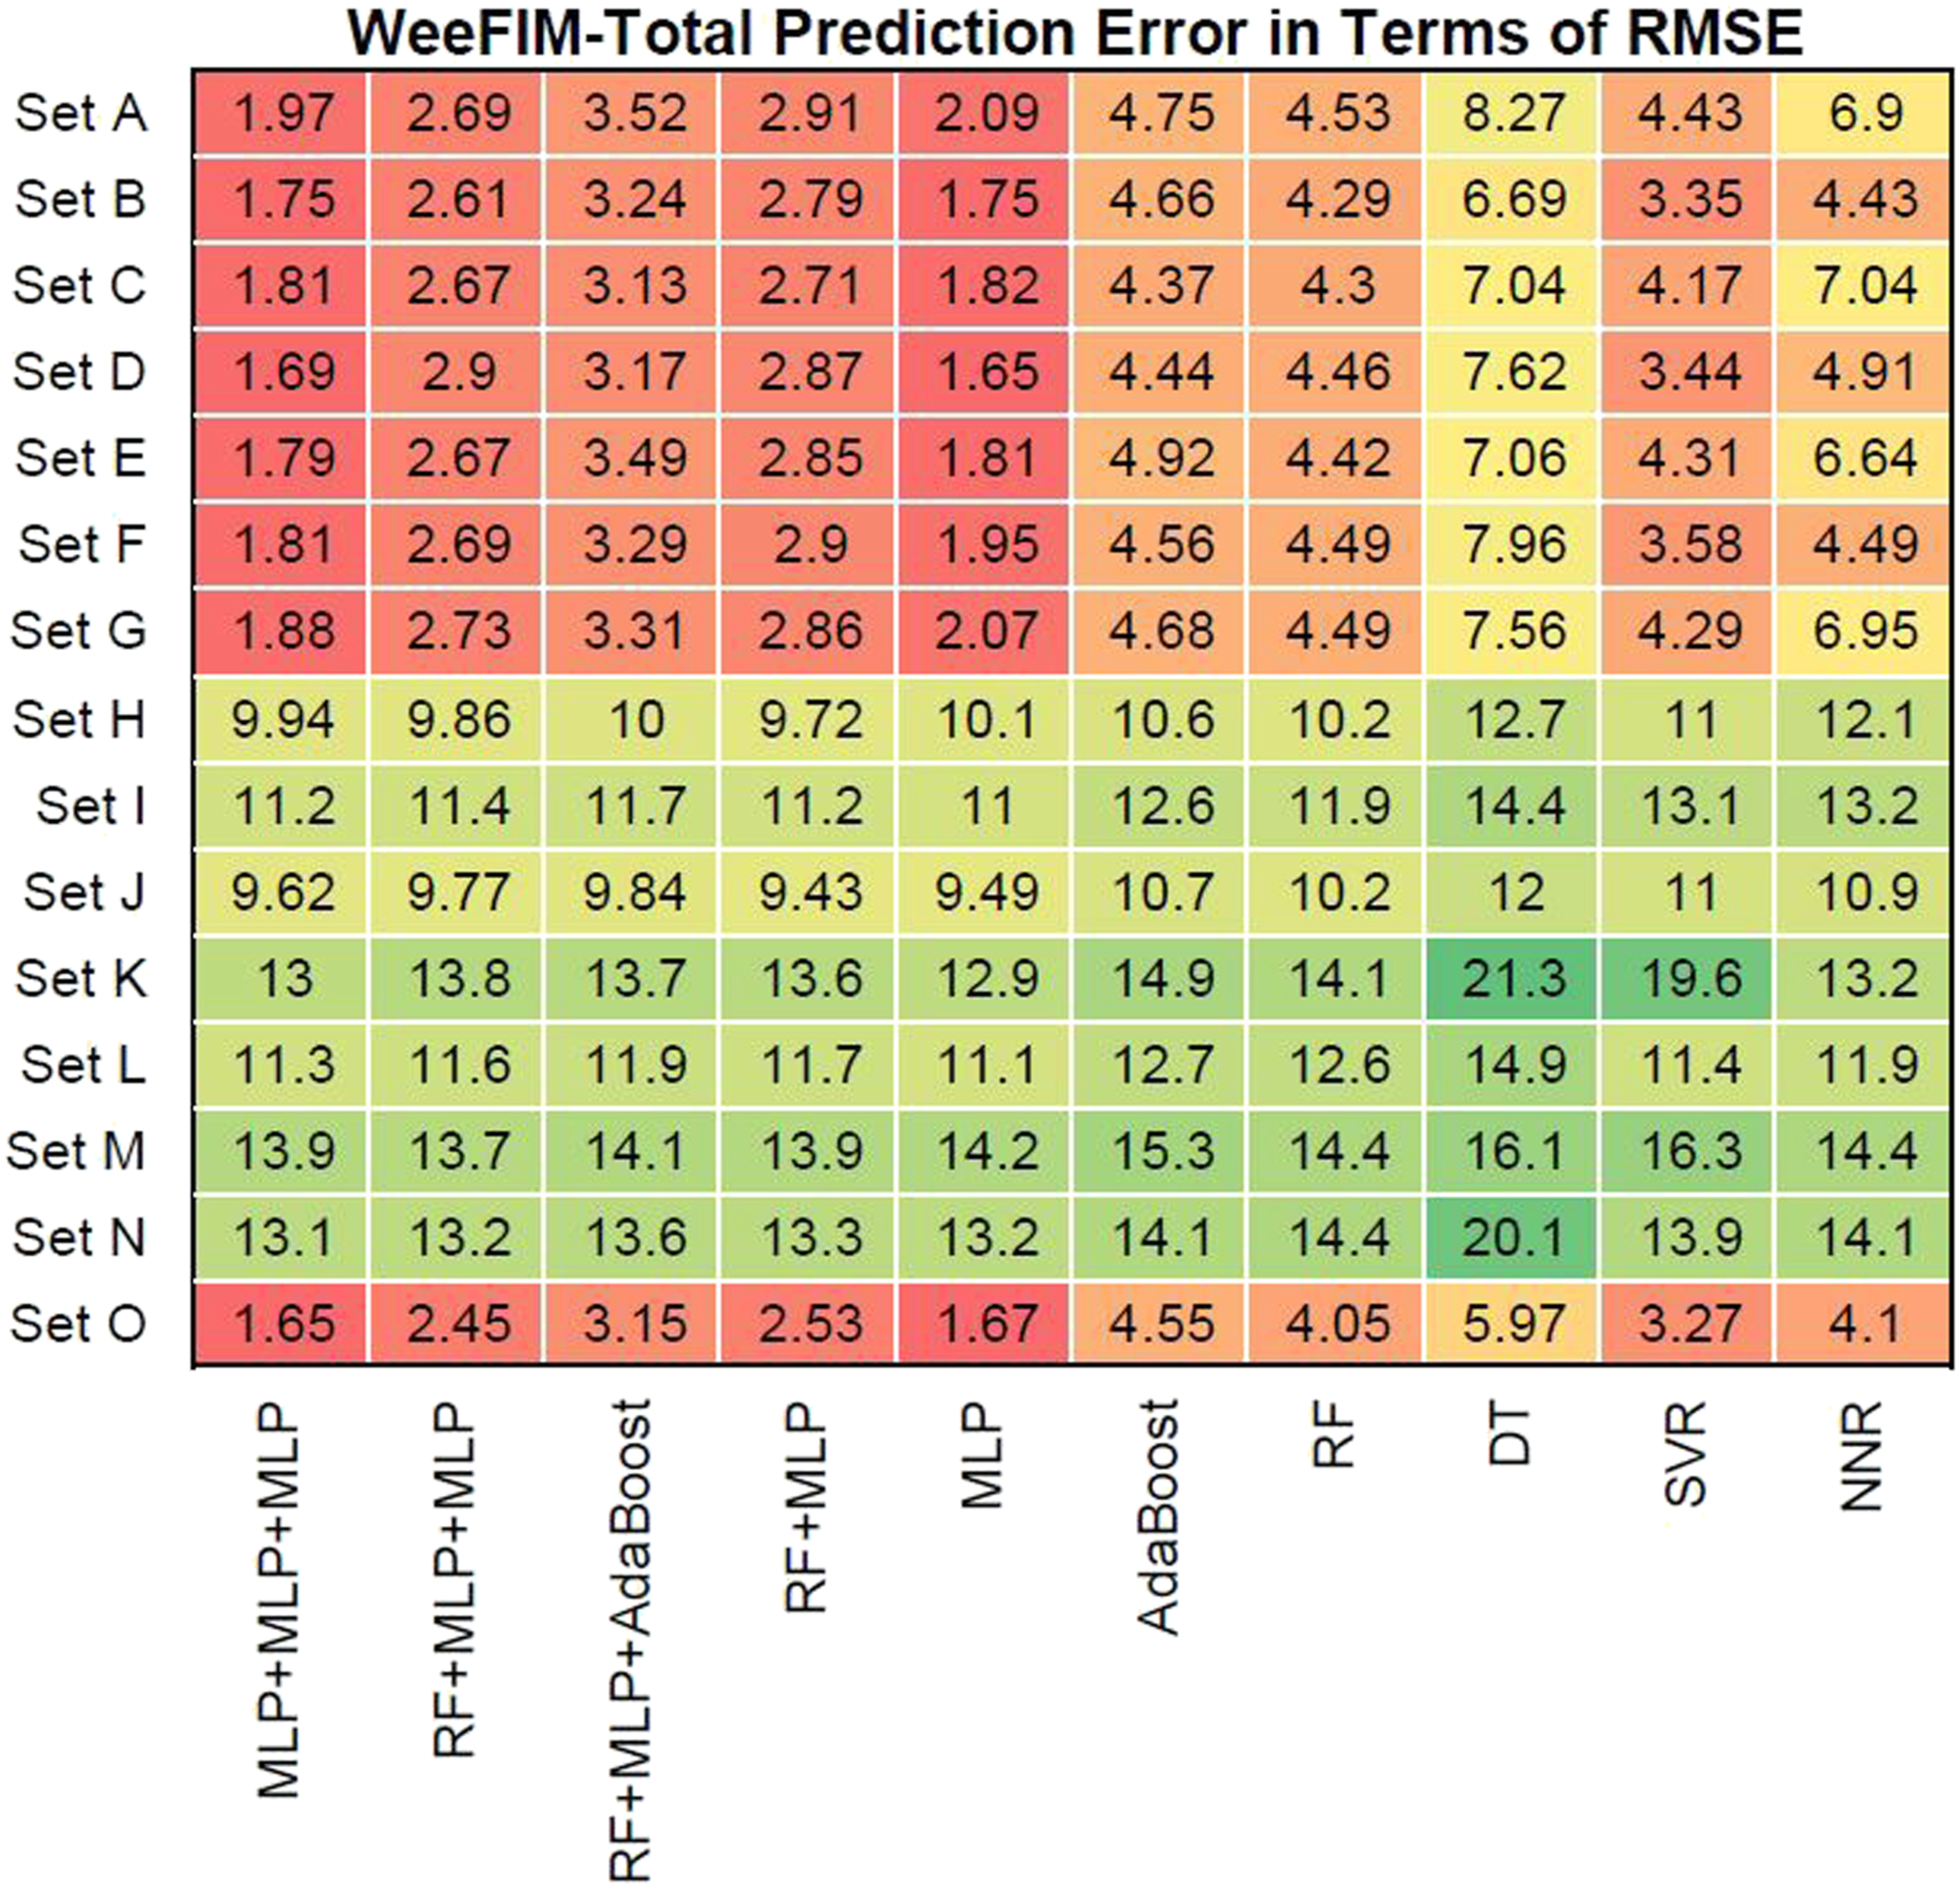
Figures 12–15 present the prediction error in terms of RMSE for cognition (WeeFIM cognition), mobility (WeeFIM mobility), selfcare (WeeFIM selfcare), and total (WeeFIM total), respectively. The four ensemble learning models had low prediction error in terms of RMSE for Sets A–G and O, also indicating that they are accurate. The MLP learning model had lower prediction error in terms of RMSE than did the other learning models, suggesting a higher accuracy. The prediction error in terms of RMSE (WeeFIM–Cognition). The prediction error in terms of RMSE (WeeFIM–Mobility). The prediction error in terms of RMSE (WeeFIM–Selfcare). The prediction error in terms of RMSE (WeeFIM–Total).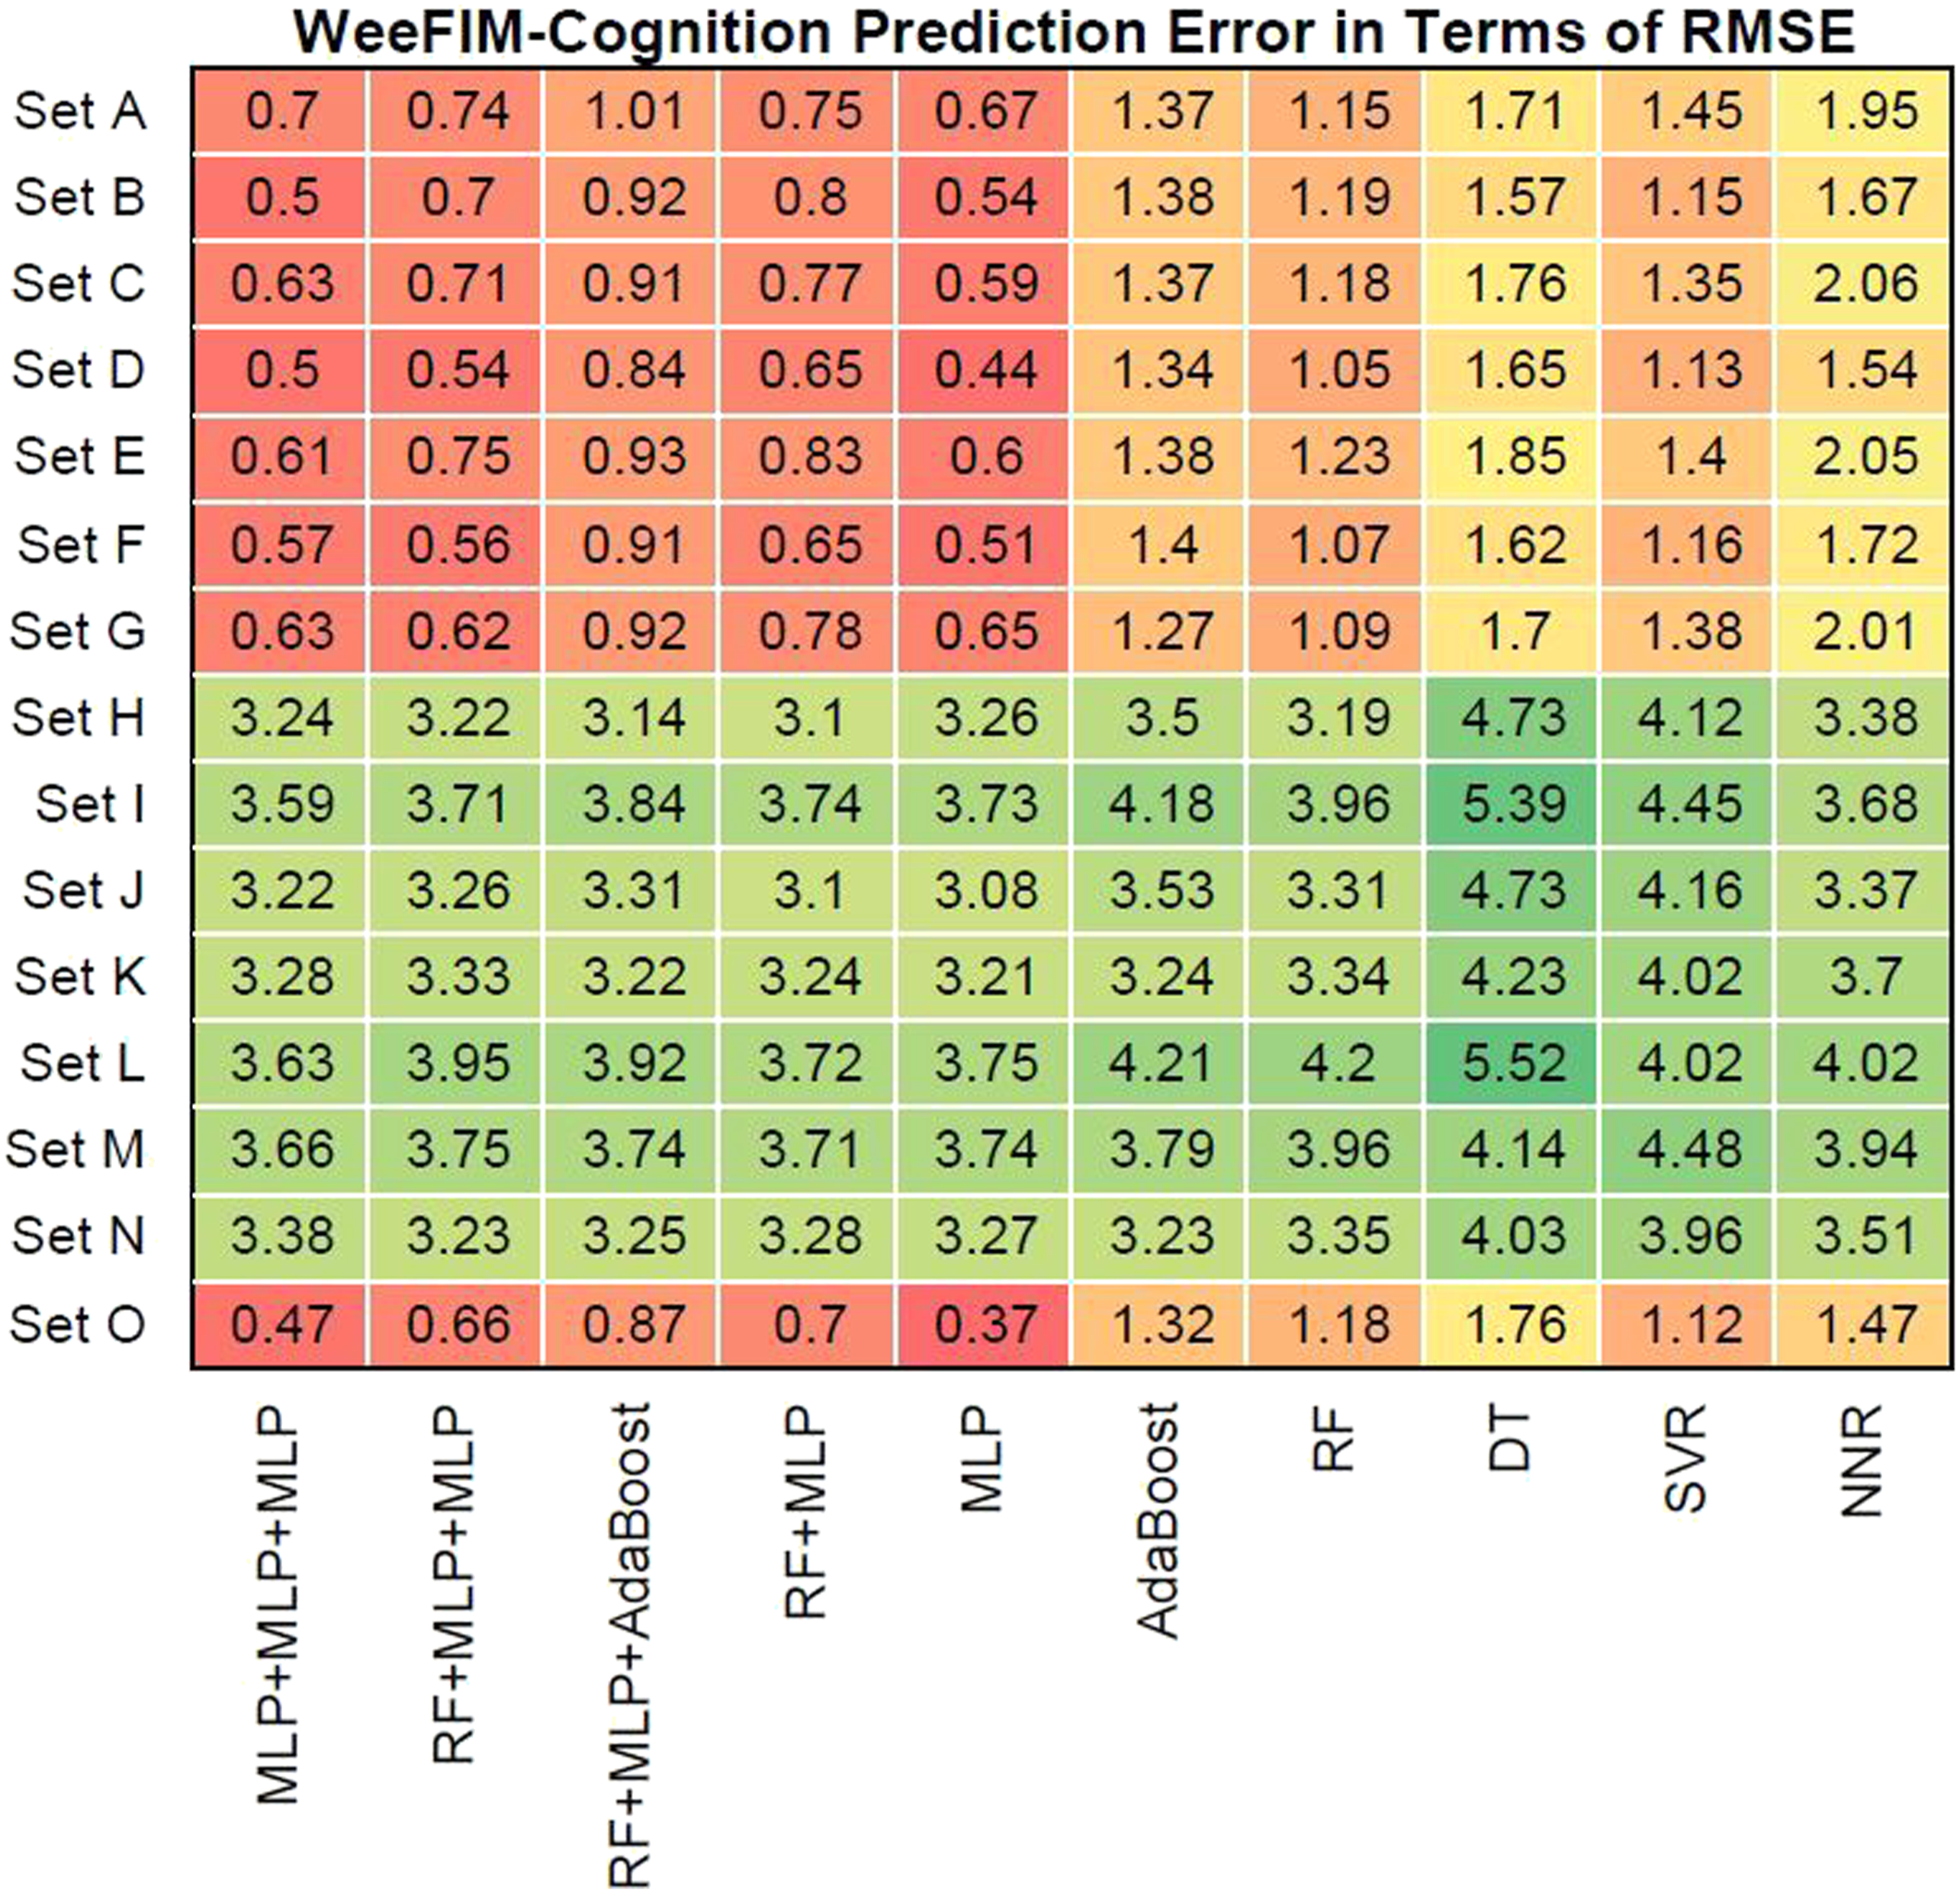
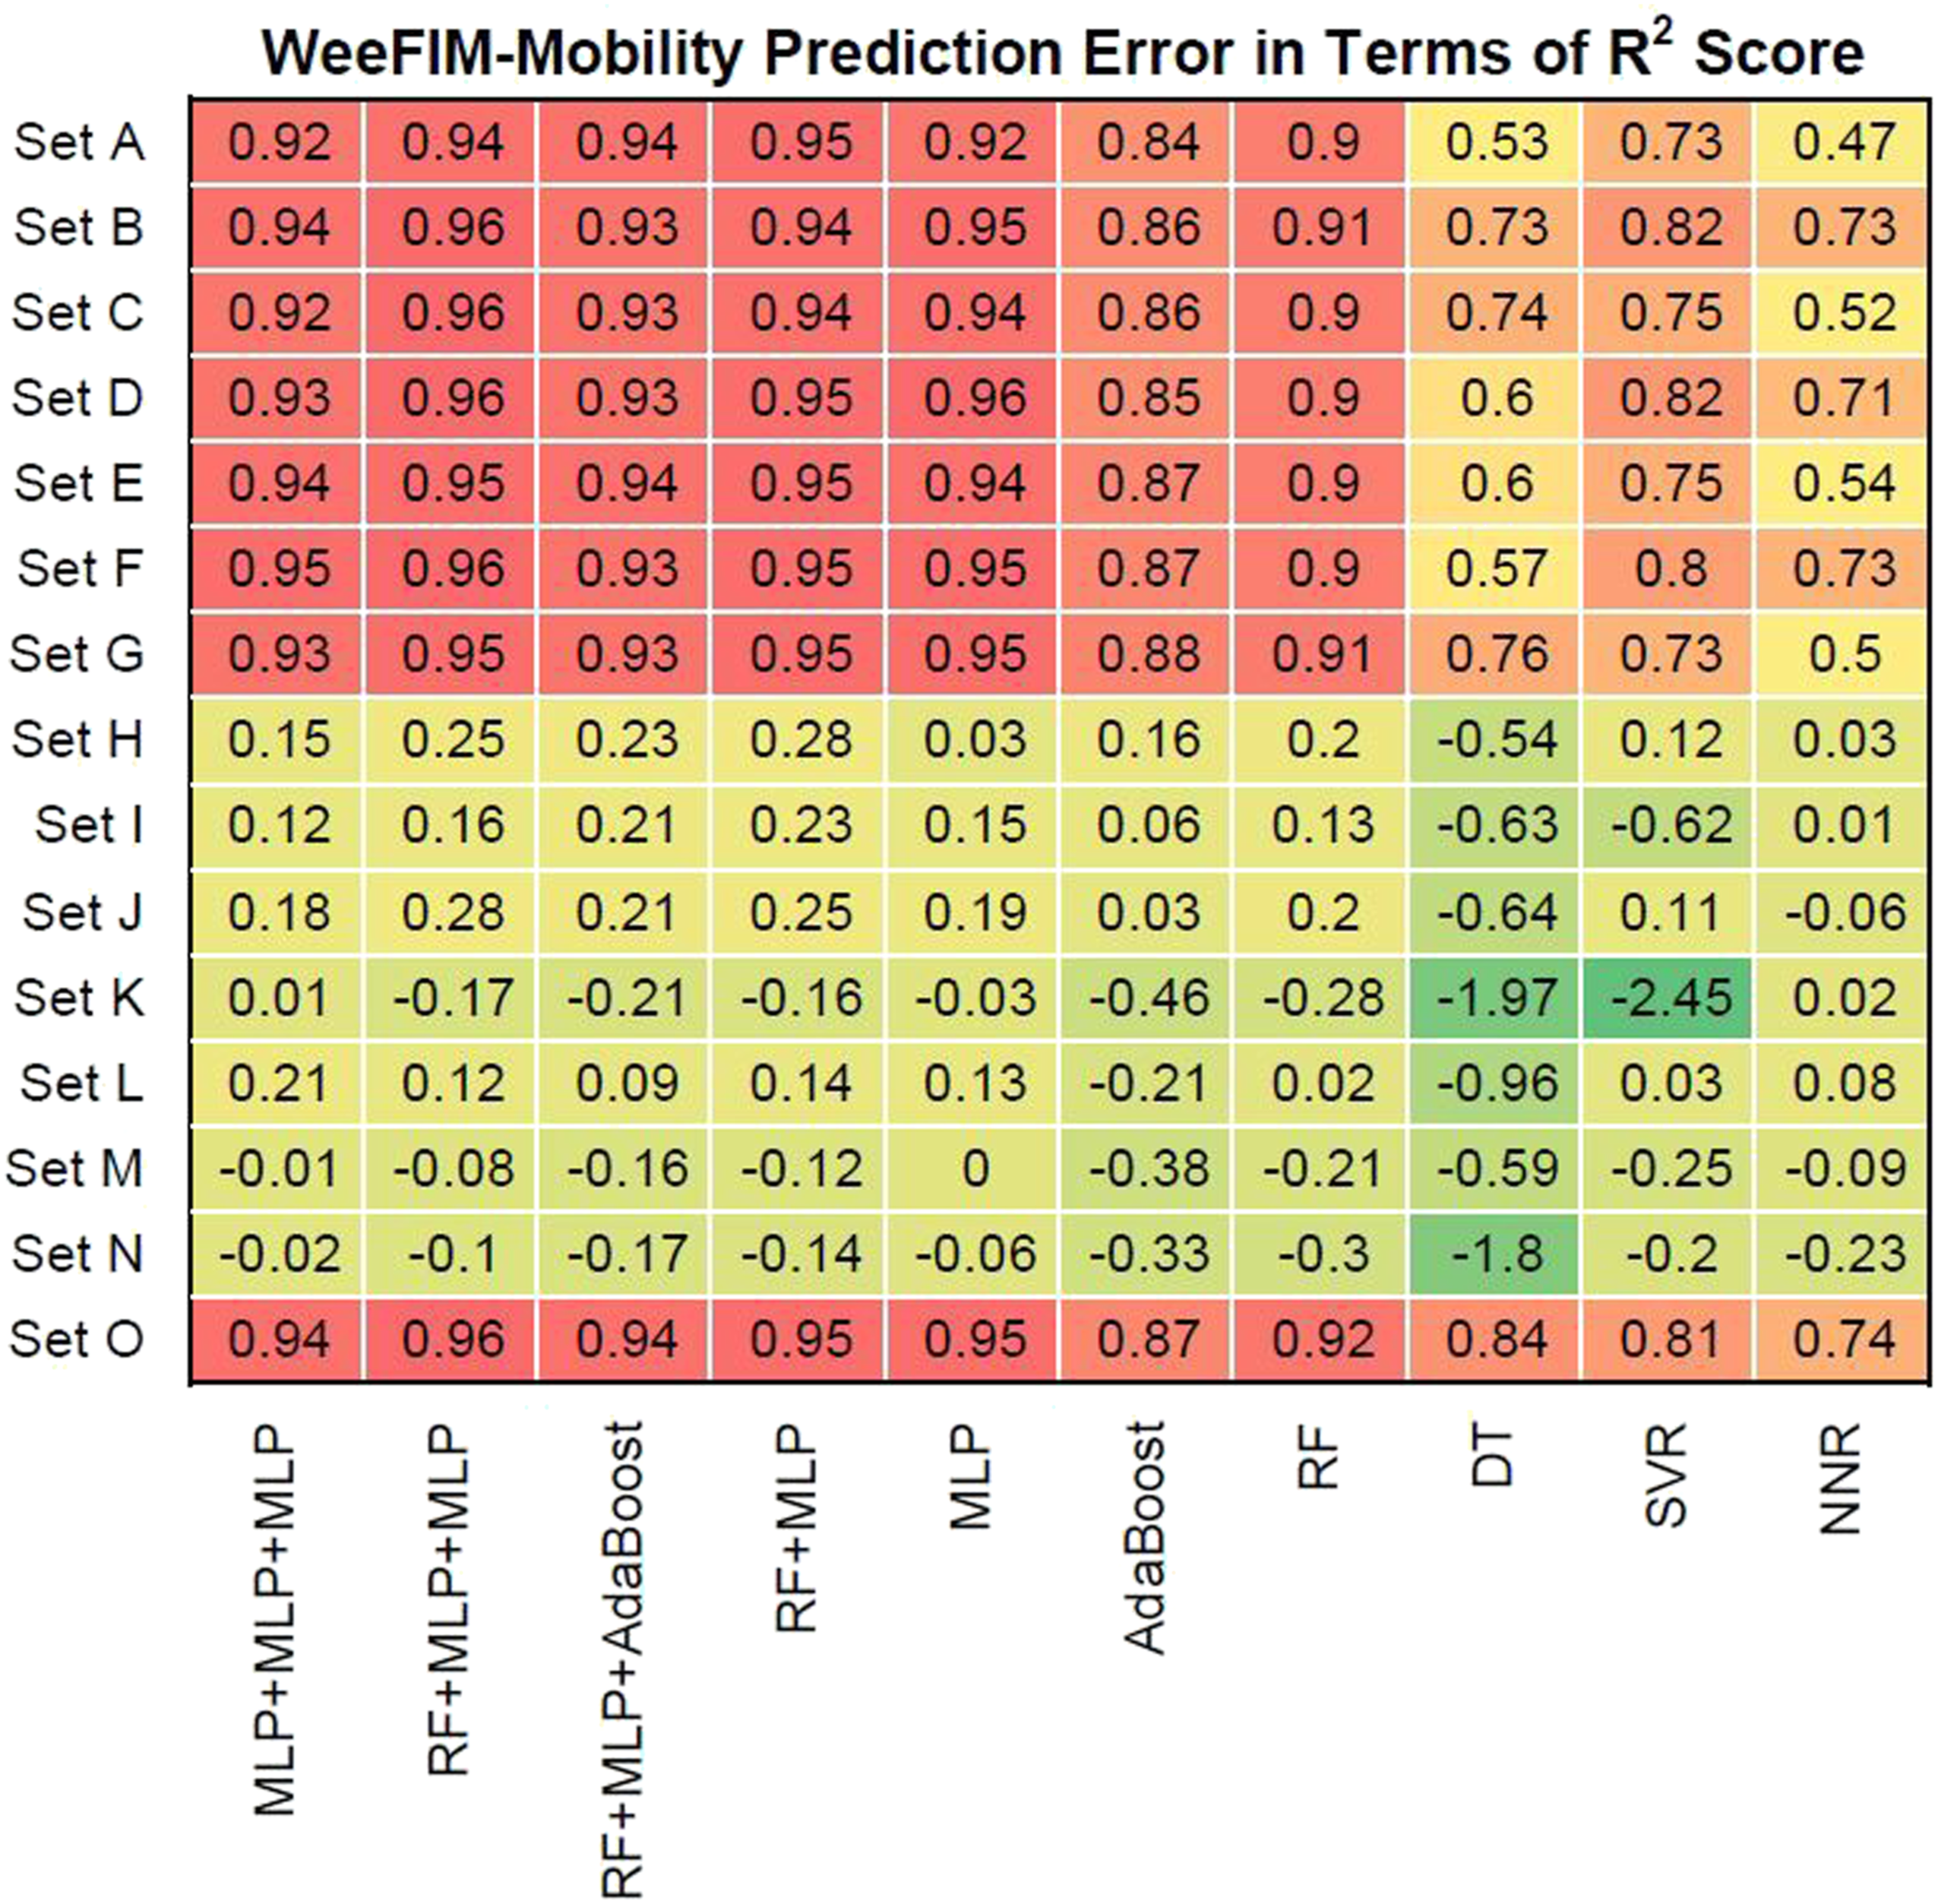
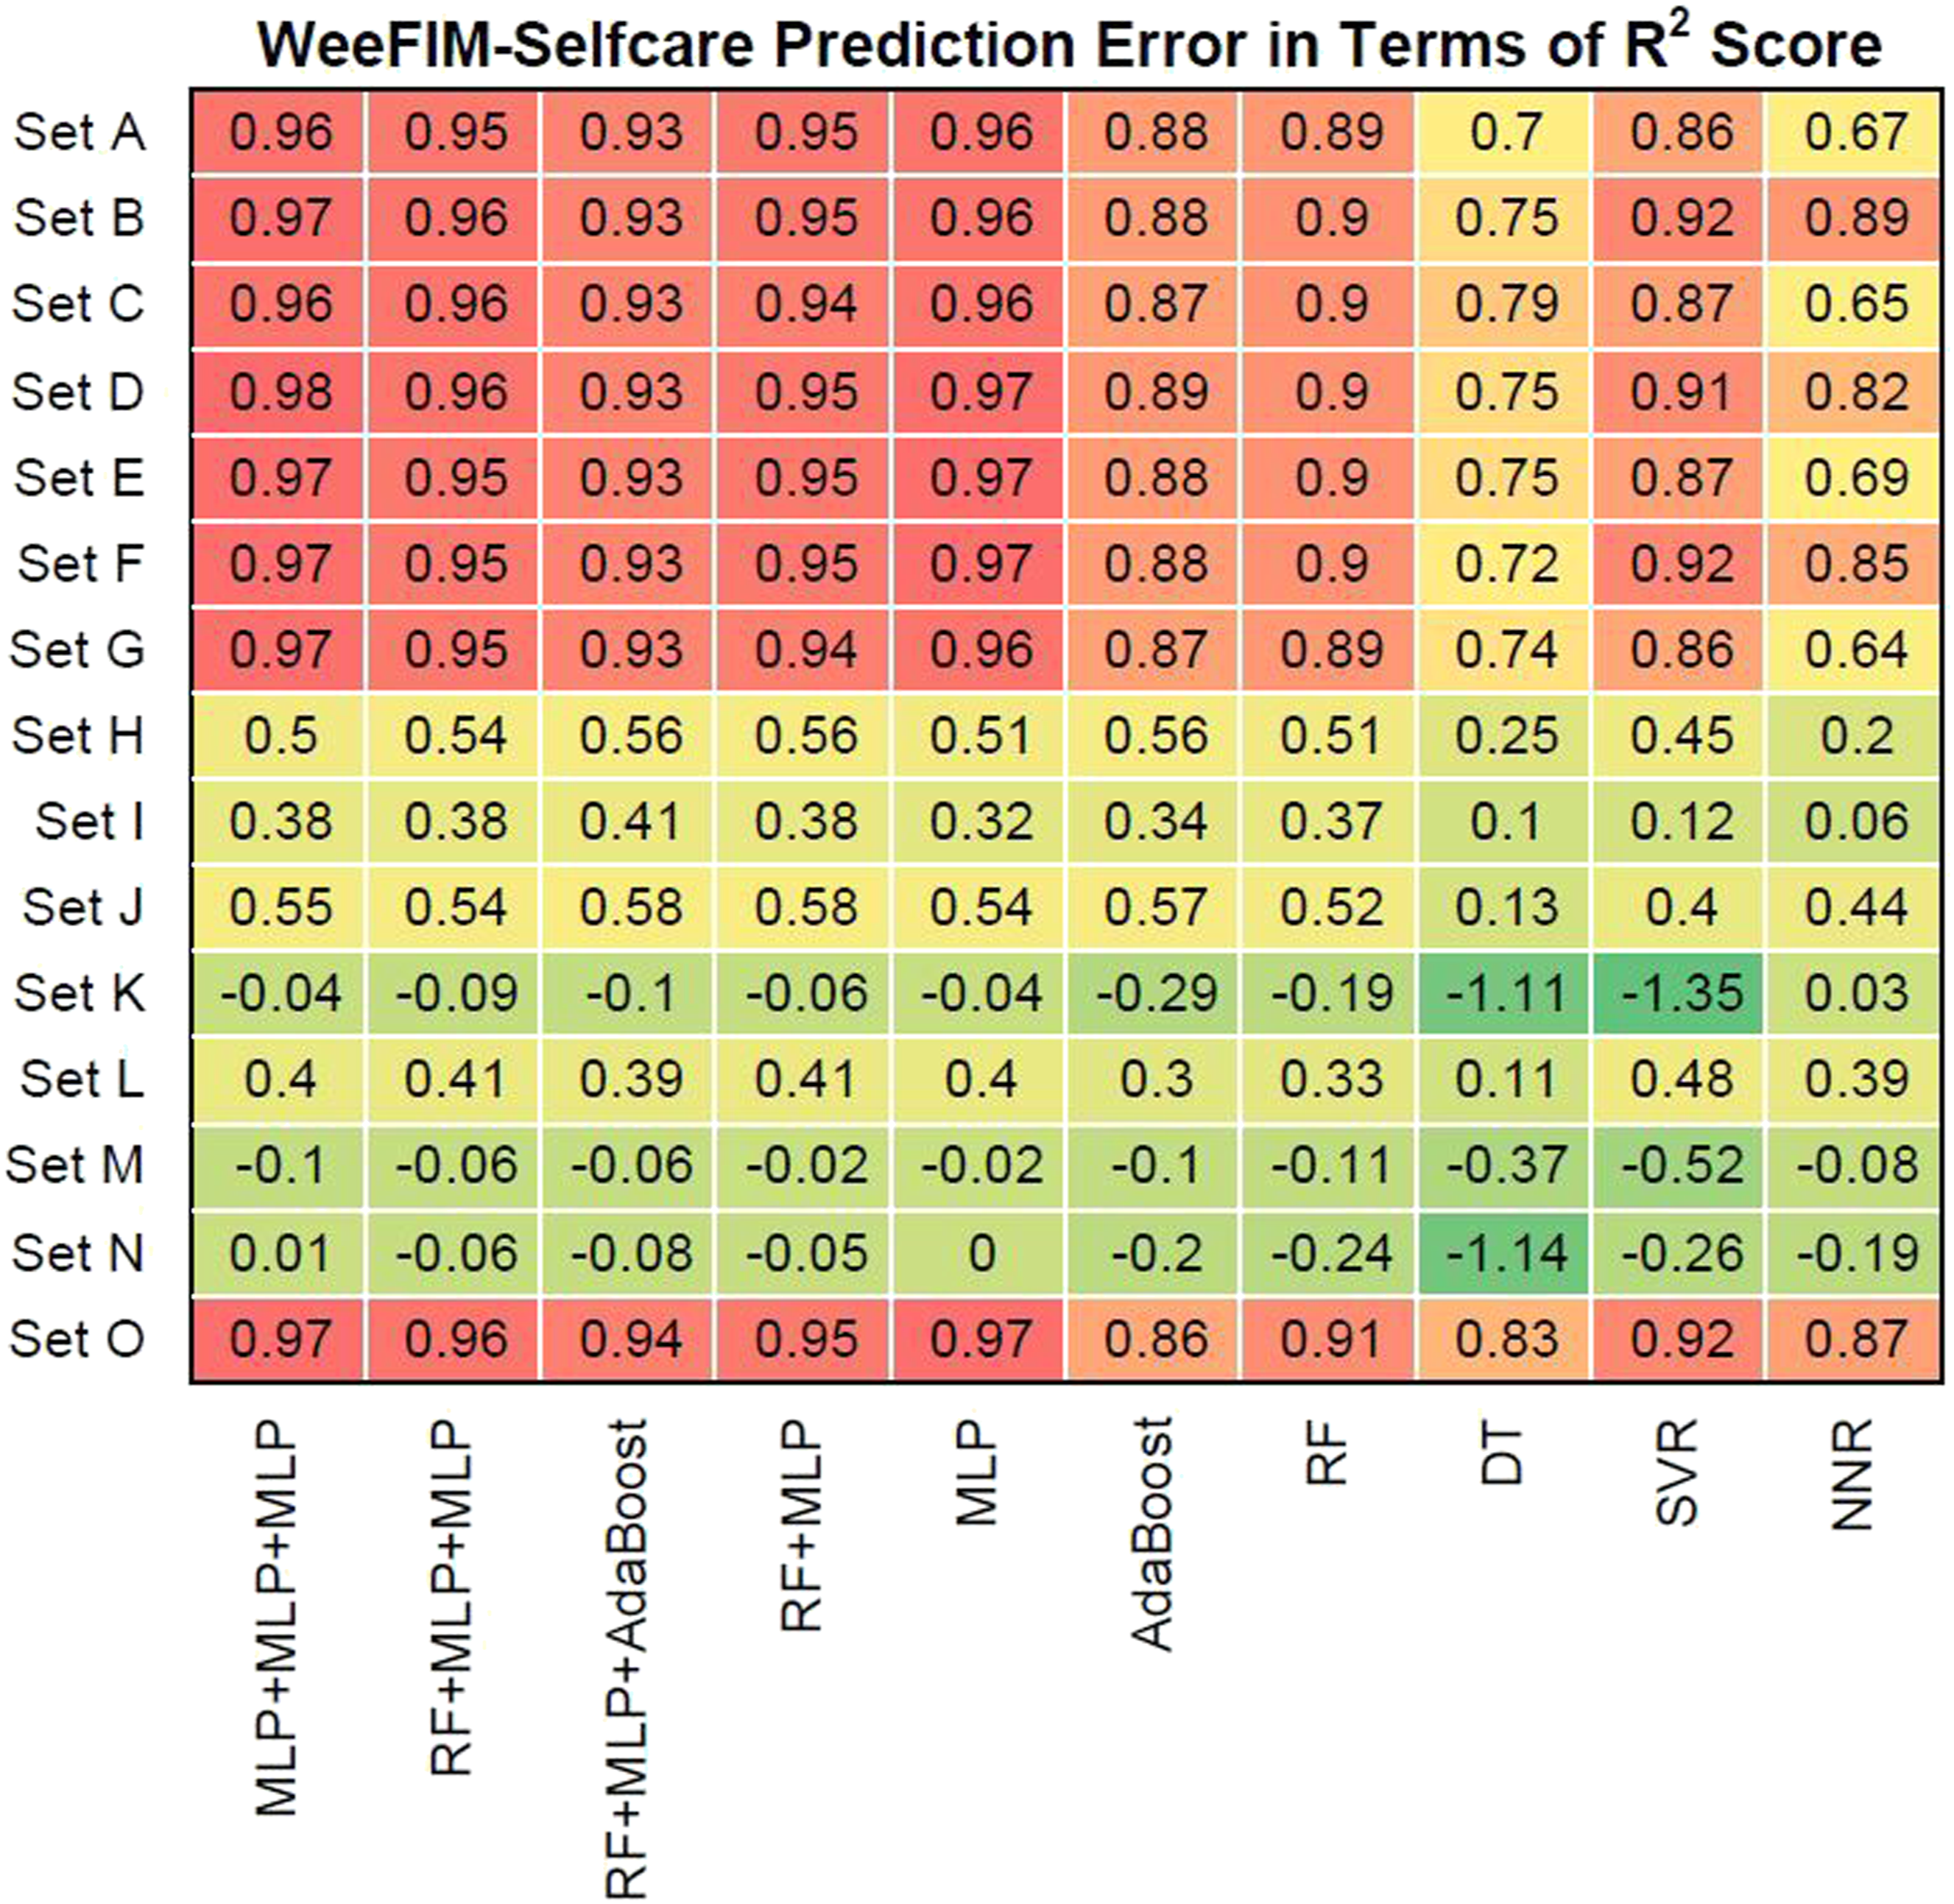
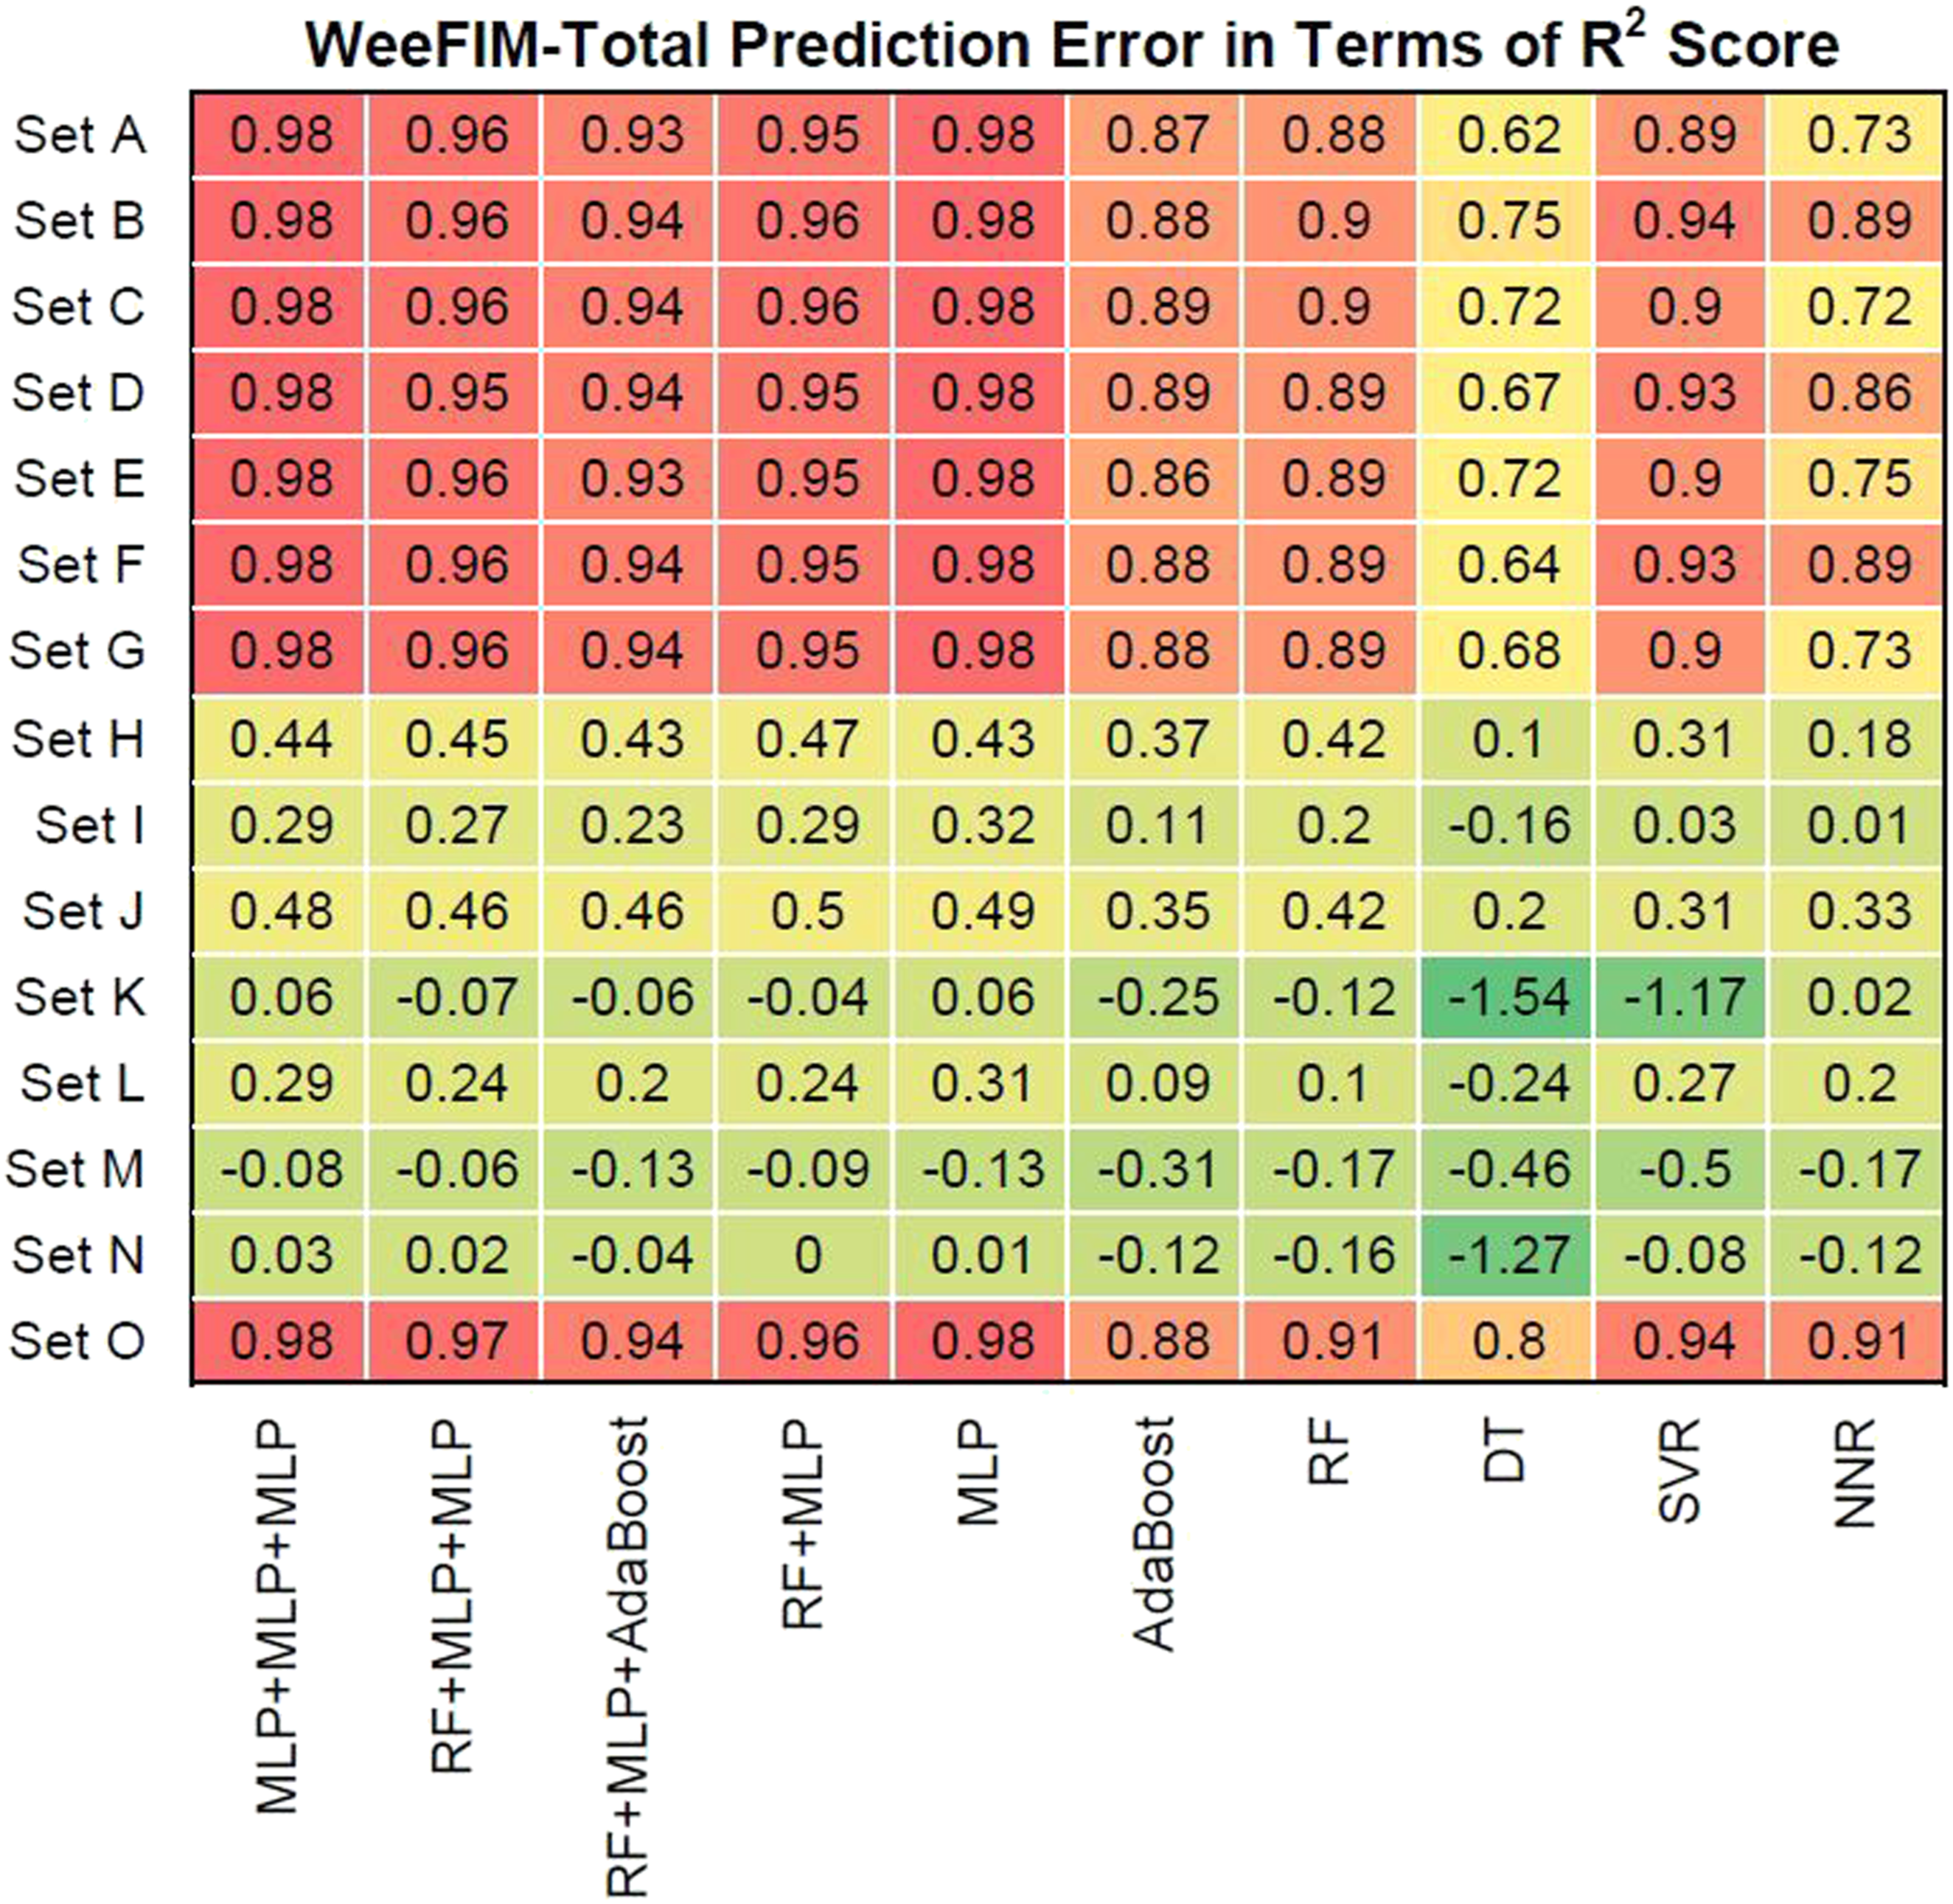
We also evaluated prediction error in terms of R2 values. Figures 16–19 present the prediction error in terms of R2 values for cognition (WeeFIM cognition), mobility (WeeFIM mobility), selfcare (WeeFIM selfcare), and total (WeeFIM total), respectively. The four ensemble learning models exhibited strong prediction performance for Sets A–G and O. Therefore, the models are accurate. The MLP learning model exhibited superior prediction to that of the other learning models, indicating higher accuracy. The prediction error in terms of R2 Score (WeeFIM–Cognition). The prediction error in terms of R2 Score (WeeFIM–Mobility). The prediction error in terms of R2 Score (WeeFIM–Selfcare). The prediction error in terms of R2 Score (WeeFIM–Total).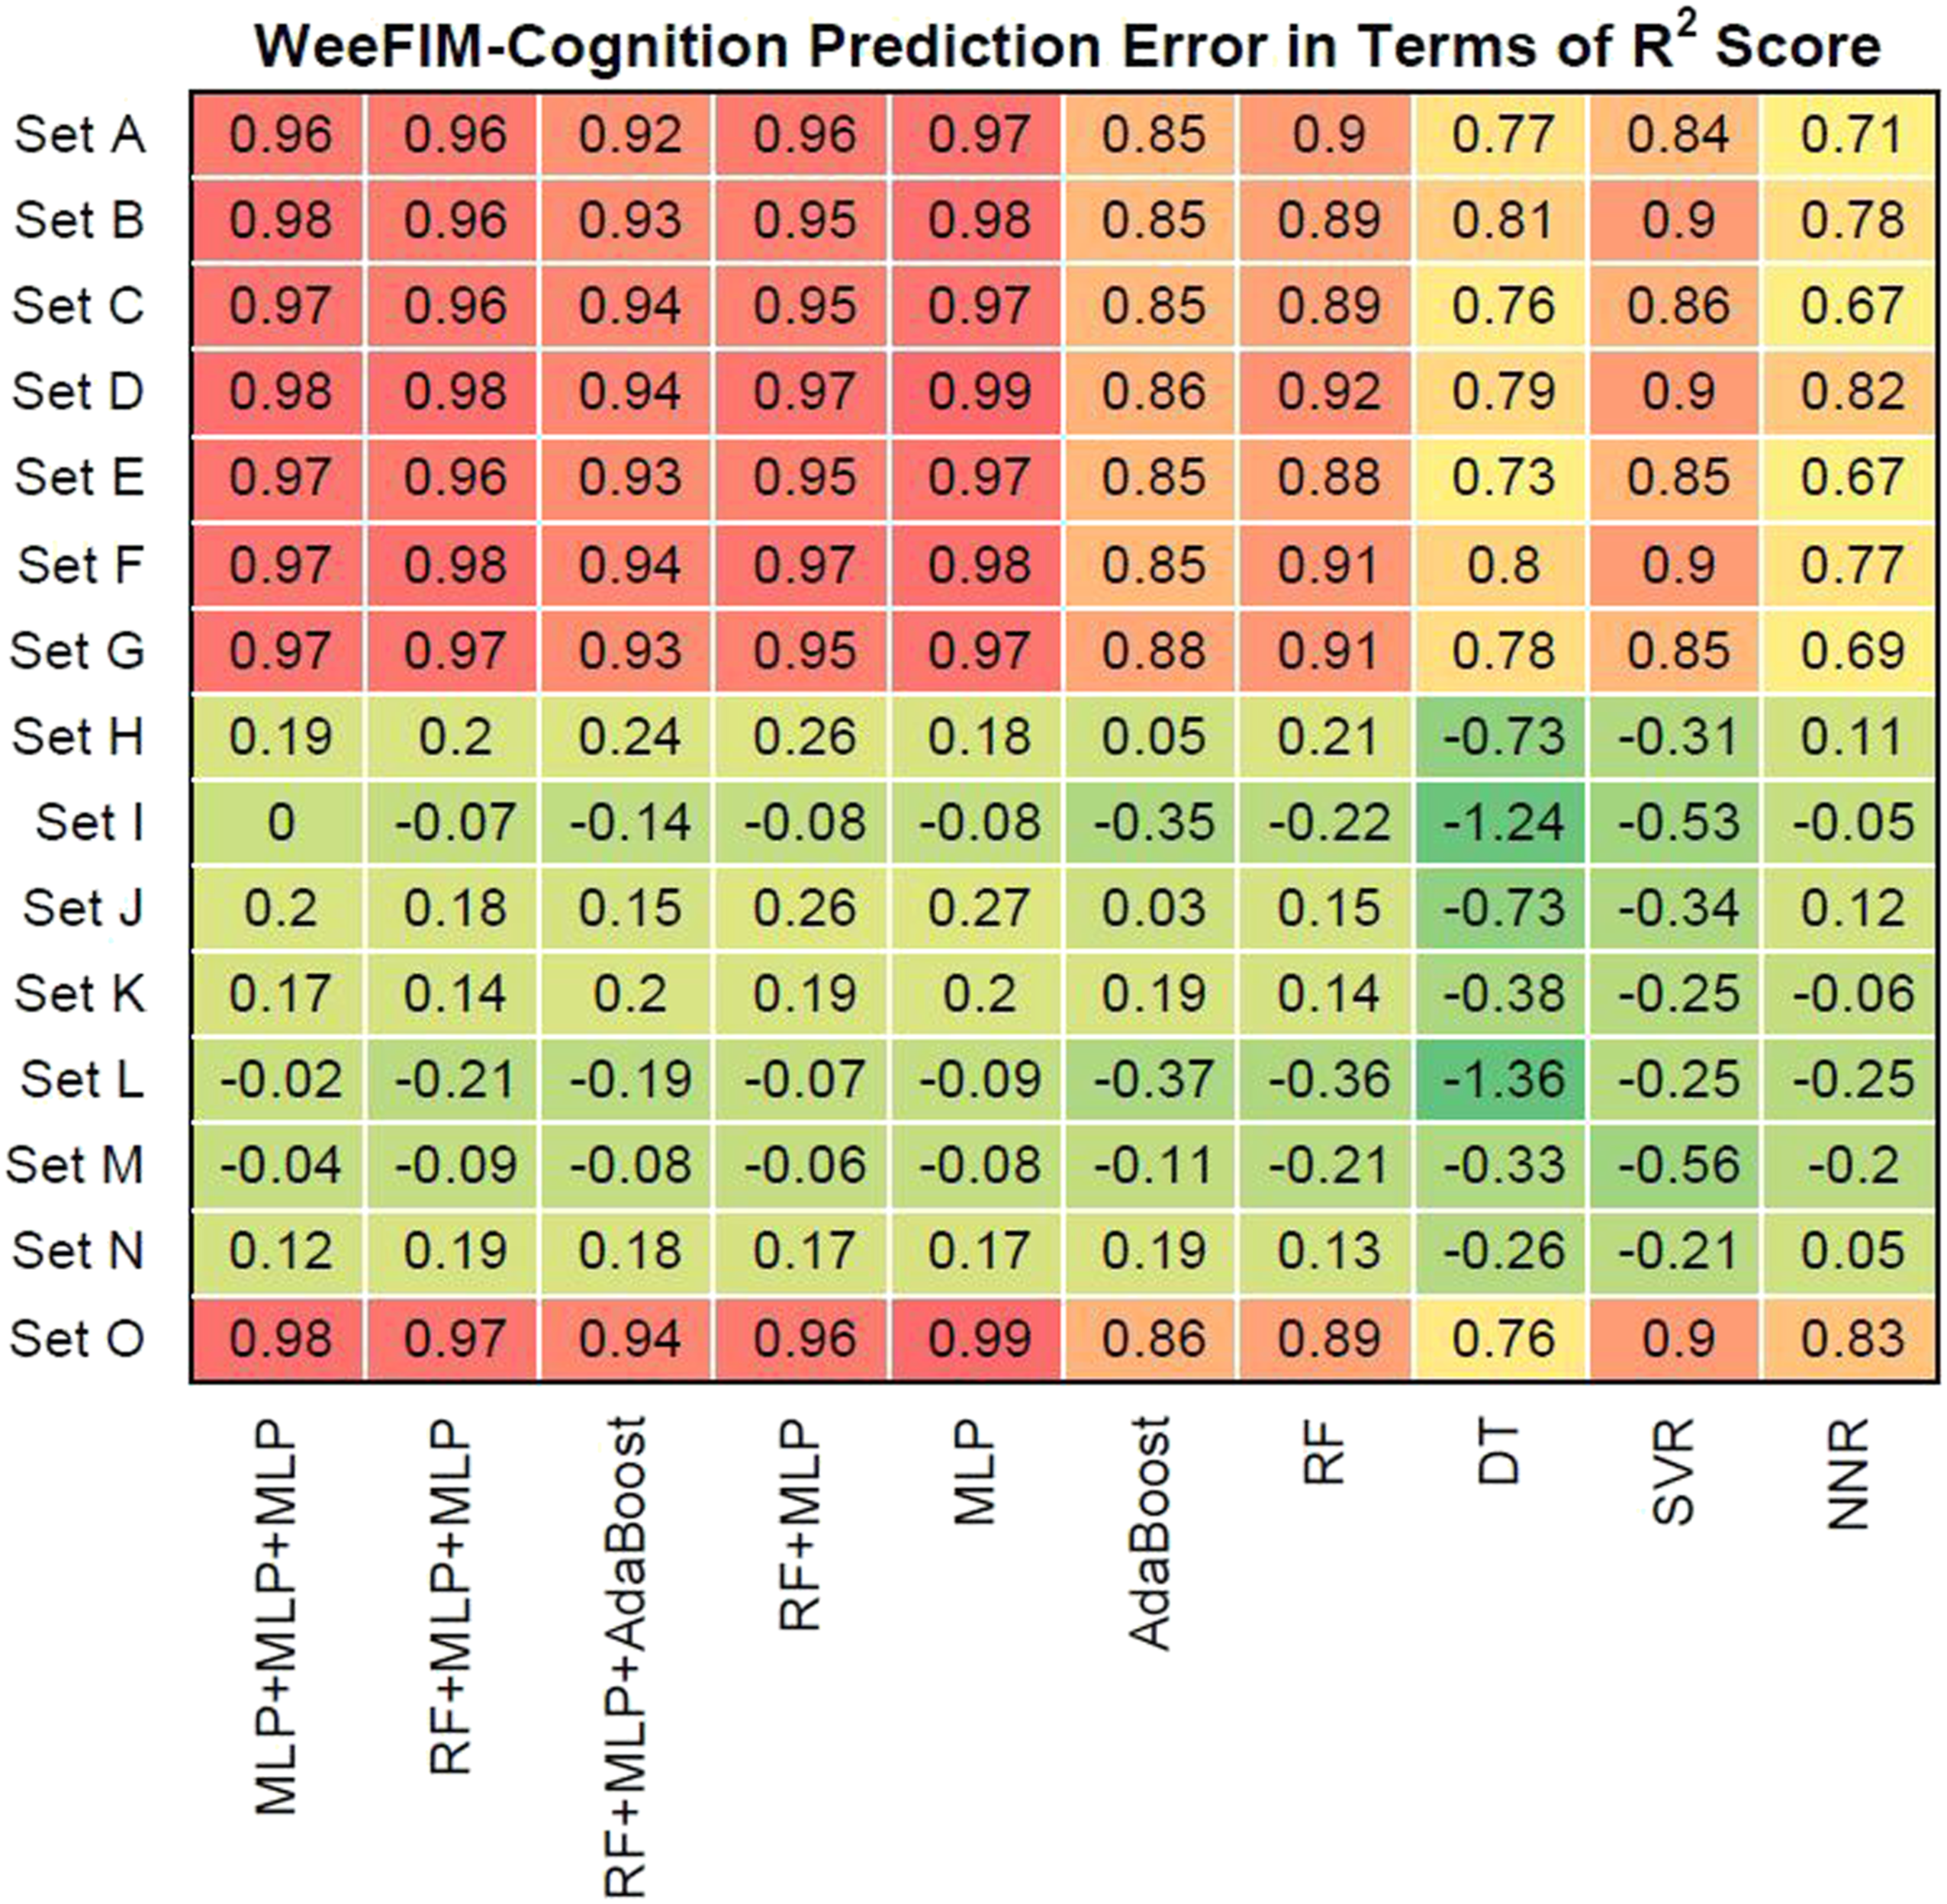
Discussion
Identifying possible treatment methods for patients with diagnosed brain tumor can enable clinical workers to predict side effects and prognosis. This knowledge assists them in determining proper rehabilitation services and in devising a comprehensive rehabilitation plan. 50 We demonstrated that the use of ML models can predict three WeeFIM indices and the total score, which can assist clinical workers in planning treatment and clinical strategies for clinical care.
Studies have indicated that children with a history of brain tumor have a high risk of cognitive disability, particularly in terms of processing speed, executive functions, memorization, and focus.10,12,51–54 This influences their cognitive function, and results in poor occupational performance. 12 Most studies have explored the correlation between neurocognition assessments and the cognitive abilities of patients with CBT. Few have explored whether damage to a tumor site or pharmacotherapy affect quality of life and functional performance for patients with CBT. 11 These factors limit patients’ ability to exercise and their processing skills, thereby affecting their performance of daily tasks. 9 Önal and Huri 55 revealed that patients with medulloblastoma exhibit poorer executive function and occupational performance than do patients without medulloblastoma.
We revealed that WeeFIM selfcare and the cognition comprehension item in WeeFIM total were the most crucial for predicting WeeFIM total. The cognitive understanding and functional performance of children with brain tumors are influenced by numerous factors. Therefore, compulsory cognition methods should be applied to increase or teach such patients new skills and to enable occupational therapists to focus on skills related to the patient’s education. 56 Our results indicate that occupational therapists should consider the effect of rehabilitation plans on patients’ lives and cognition.
In addition to the machine learning models which are mainly used in this study, in order to verify the performances of other common models, we also applied 10-fold cross validation to conduct logistic regression and SVR experiments. The experimental results of “Set A” show that, in terms of logistic regression, the R2 score of WeeFIM-Cognition is 0.52; the R2 score of WeeFIM-Mobility is 0.53; the R2 score of WeeFIM-Selfcare is 0.59; the R2 score of WeeFIM-Total is 0.59. In terms of SVR, the R2 score of WeeFIM-Cognition is 0.8; the R2 score of WeeFIM-Mobility is 0.72; the R2 score of WeeFIM-Selfcare is 0.86; the R2 score of WeeFIM-Total is 0.87. The experimental results show that the performance of these two methods in 10-fold cross validation is acceptable, but not very outstanding. Thereby, the combination of logistic regression and SVR model may not provide very superior performance.
From the perspective of ensemble learning, the combination of two models with higher performance usually brings better results. Through the experiments, we found that for a single model, RF and MLP perform better. Therefore, in the experiments, we demonstrate the performance of RF + MLP in Figures 8–19. Moreover, in order to further explore the performance of the combination of the three models, we additionally conduct additional experiments of combining other three models. However, because there are many algorithms and their combinations are too many, we only list some representative models in this study.
The ground truths of the data are obtained by qualified actual clinical staffs in this study. The prediction results of machine learning models will be compared with the ground truths. The experimental results show that the prediction results of the ensemble learning models are very close to the evaluation reports of actual clinical staffs. The feasibility of the proposed framework is also validated in the experiment.
Moreover, Principal Component Analysis (PCA) analysis is also adopted in the leave-one-out cross validation experiments. Figures 20 and 21 illustrate the WeeFIM–Total prediction results and residuals of the ML models with PCA (number of components is 5). Feature selection is an important issue for data mining. Generally, even though the original data (Set A) provide better results, PCA with 5 components still also gives good prediction performance. This experiment shows that the PCA is also a good method for the dimension reduction process. However, for reaching the highest WeeFIM prediction accuracy, using the original data is suggested. The WeeFIM–Total prediction results of the ML models with PCA (number of components is 5). (a) MLP + MLP + MLP, (b) RF + MLP + MLP, (c) RF + MLP + Adaboost, (d) RF + MLP, (e) MLP, (f) Adaboost, (g) RF. The residuals of the WeeFIM–Total prediction results with PCA (number of components is 5). (a) MLP + MLP + MLP, (b) RF + MLP + MLP, (c) RF + MLP + Adaboost, (d) RF + MLP, (e) MLP, (f) Adaboost, (g) RF.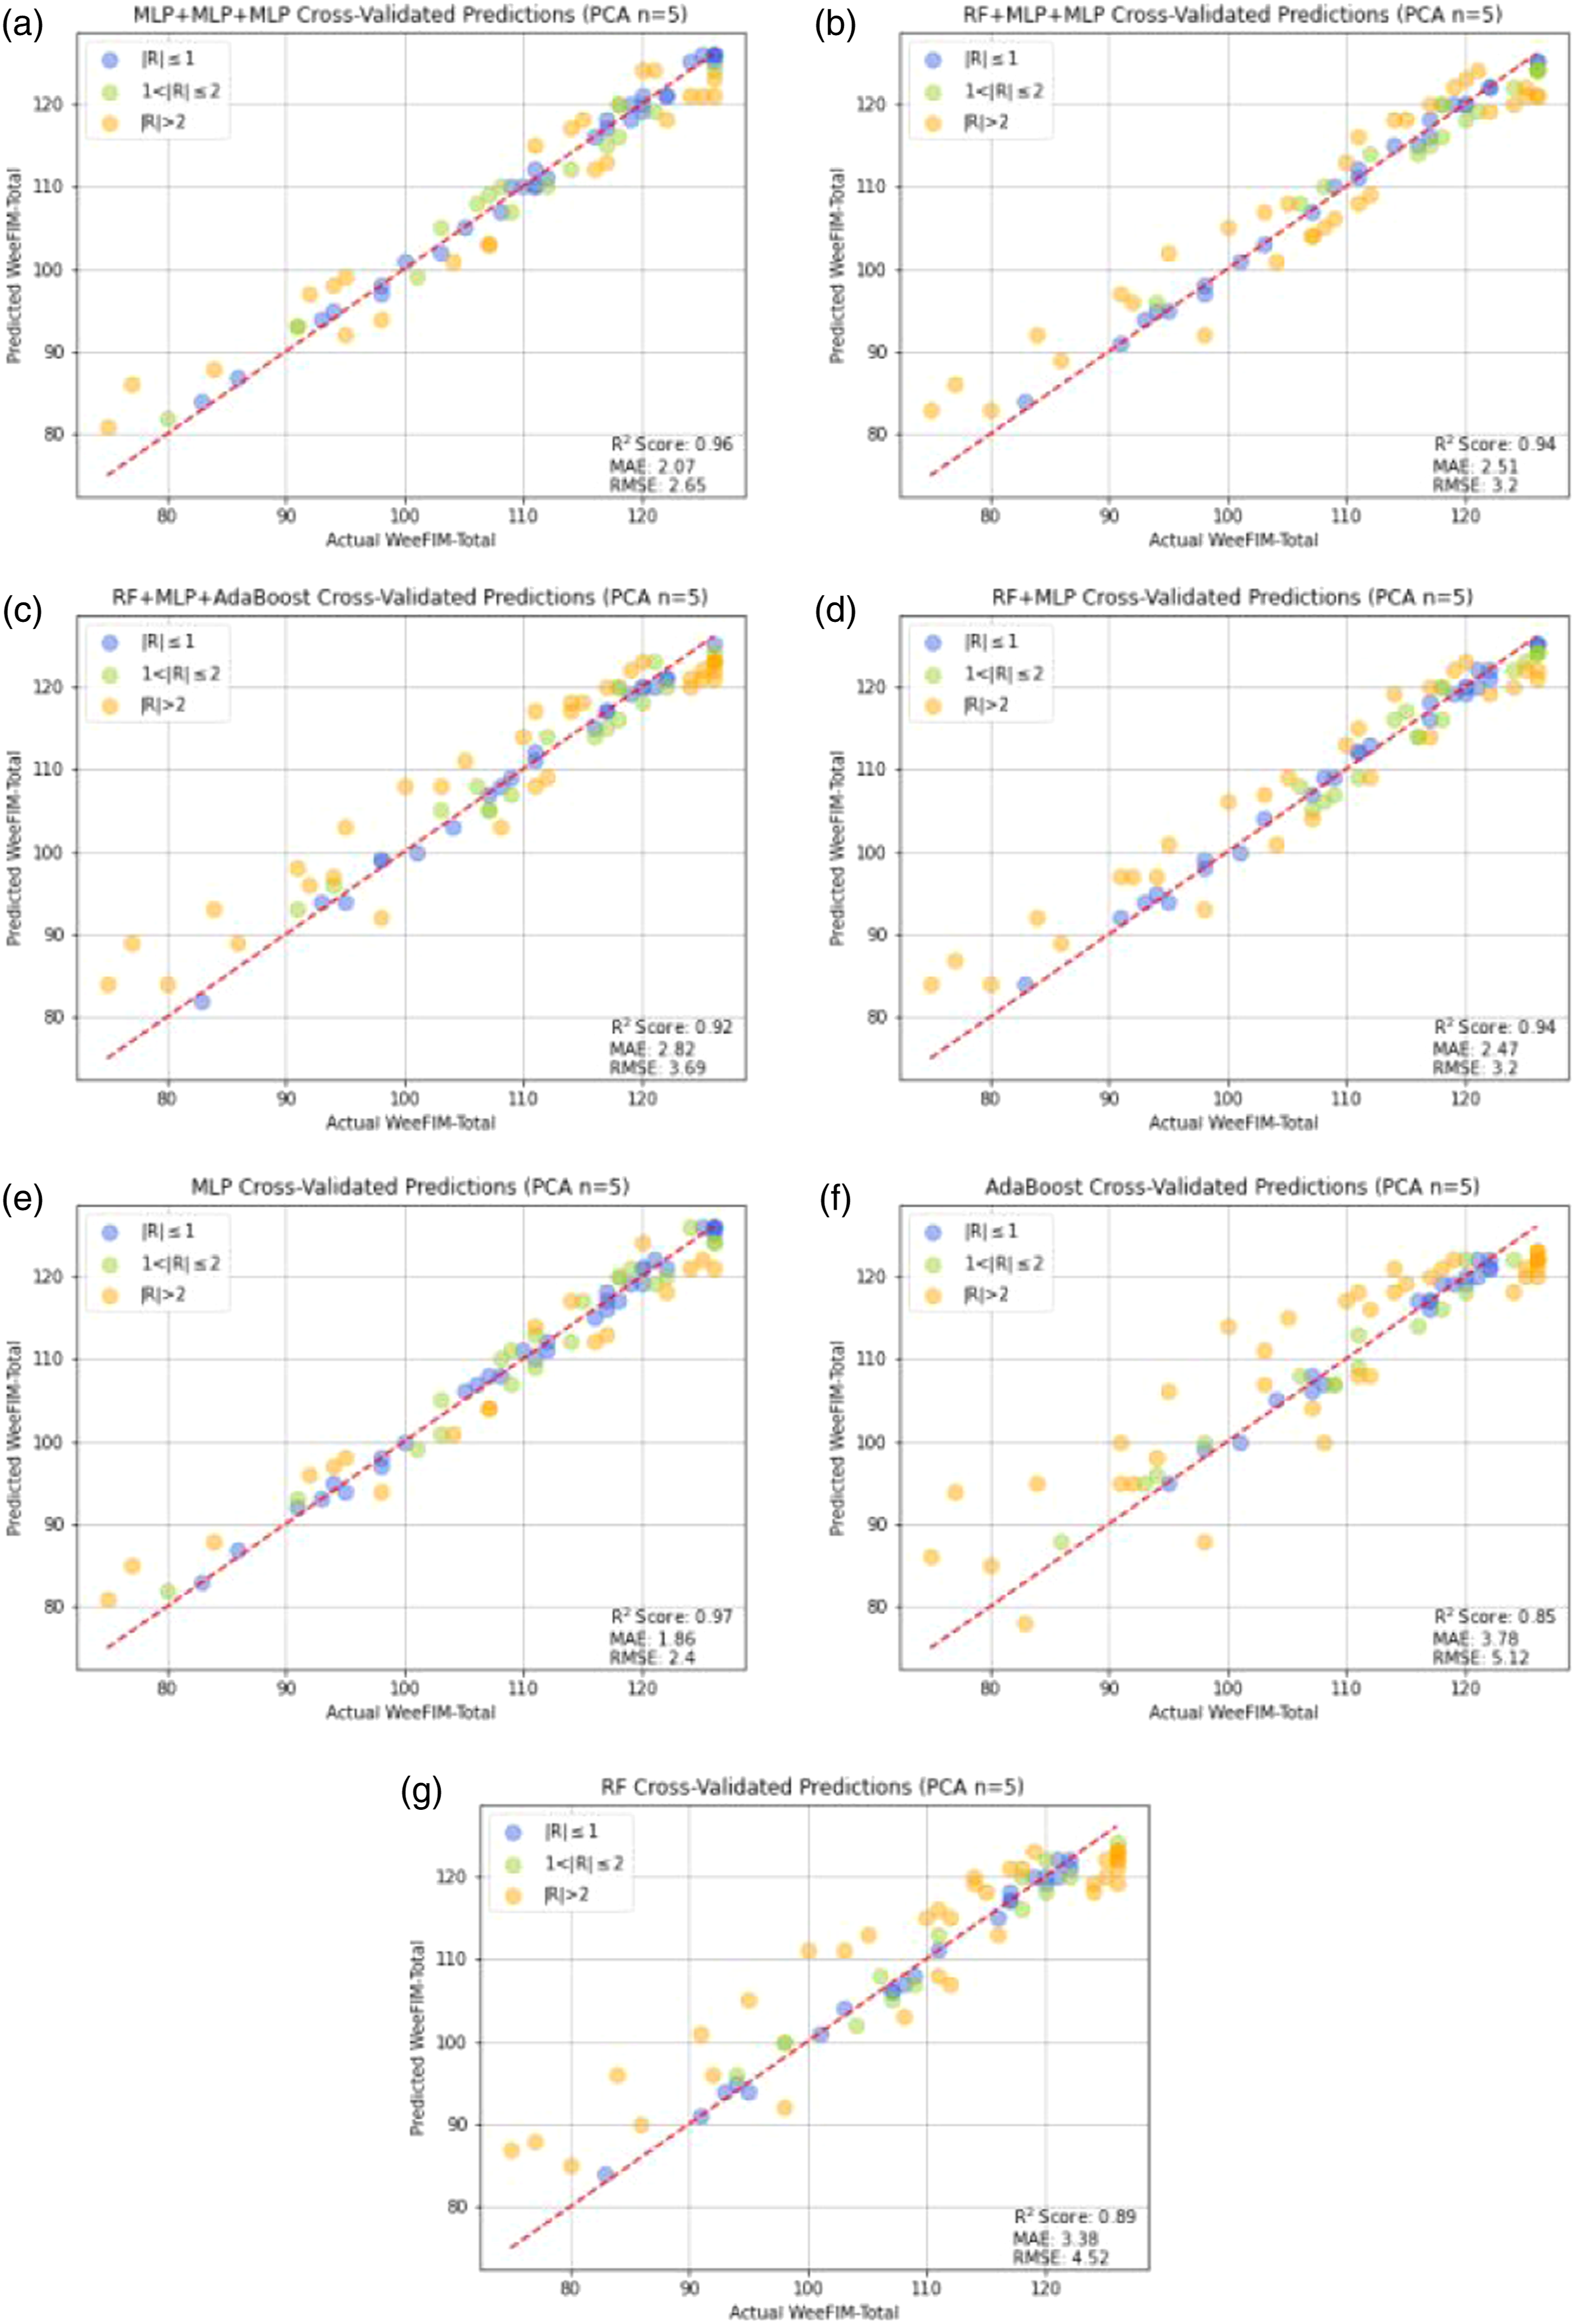
Conclusion
We selected features and created 15 sets to predict WeeFIM scores using ML. Our results suggest that clinical physicians should evaluate the cognitive assessment results and daily cognitive performance of patients with CBTs. Clinical physicians should also focus on patients’ selfcare. This study is the first to create ensemble ML models for this purpose by using multiple ML models, namely RF, MLP, AdaBoost, SVR, DT, and NNR, and to use the leave-one-out cross-validation method for the performance evaluation. The prediction results indicate that the ensemble algorithm–based ML models possess considerable predictive capabilities and that the MLP model exhibited favorable prediction performance. Sets containing the WeeFIM subitem scores exhibited a strong correlation with WeeFIM cognition, WeeFIM mobility, WeeFIM selfcare, and WeeFIM total.
Highlights
• Most studies have explored the correlation between neurocognitive assessments and the cognitive abilties of patients with CBTs. • By exploring the subitems of the WeeFIM scale, we proposed models that can assist clinical workers in evaluating the progress of a patient’s ability recovery and form the optimal treatment plan for intervention. • We applied ML models to large-scale datasets to predict the daily functional performance of patients with CBTs. We also provided suggestions to increase the efficiency of health care services.
Footnotes
Authors’ contributions
Pei-Hua Lin and Ping-Huan Kuo design this study. Ping-Huan Kuo wrote the program. Pei-Hua Lin design the experiments. Pei-Hua Lin and Ping-Huan Kuo wrote this paper. All authors revised the manuscript and read and approved the version submitted.
Declaration of conflicting interests
The author(s) declared no potential conflicts of interest with respect to the research, authorship, and/or publication of this article.
Funding
The author(s) disclosed receipt of the following financial support for the research, authorship, and/or publication of this article: This work was supported by the Ministry of Science and Technology, Taiwan, under Grants MOST 109-2221-E-194-053-MY3.
Research ethics and patient consent
All the data in this study are obtained from a public resource in Ref. [47]. The database is publicly available and provided in Ref. [48] (![]() ). This study was conducted according to the guidelines of the Declaration of Helsinki and approved by the Human Research Ethics Committee, National Chung Cheng University (Application number: CCUREC111081701).
). This study was conducted according to the guidelines of the Declaration of Helsinki and approved by the Human Research Ethics Committee, National Chung Cheng University (Application number: CCUREC111081701).