
Abstract
In the modern world, with so much inherent stress, mental health disorders (MHDs) are becoming more common in every country around the globe, causing a significant burden on society and patients’ families. MHDs come in many forms with various severities of symptoms and differing periods of suffering, and as a result it is difficult to differentiate between them and simple to confuse them with each other. Therefore, we propose a support system that employs deep learning (DL) with wearable device data to provide physicians with an objective reference resource by which to make differential diagnoses and plan treatment. We conducted experiments on open datasets containing activity motion signal data from wearable devices to identify schizophrenia and mood disorders (bipolar and unipolar), the datasets being named Psykose and Depresjon. The results showed that, in both workflow approaches, the proposed framework performed well in comparison with the traditional machine learning (ML) and DL methods. We concluded that applying DL models using activity motion signal data from wearable devices represents a prospective objective support system for MHD differentiation with a good performance.
Keywords
Introduction
With increasingly heavy stress in modern life, mental health disorders (MHDs) are becoming more and more common worldwide, the incidence rising in both developing and developed countries.1–4 MHDs occur in many forms with varying symptom severity and differing periods of suffering. These illnesses are difficult to detect and easily confused with each other. Underestimation of or incorrect treatment for these illnesses could result in difficult consequences. MHDs directly affect the mental and physical health not only of individual patients, but also those close to them, and even society as a whole.
In this study, we conducted experiments on two specific MHDs, schizophrenia and mood disorders (including bipolar and unipolar disorders). People with schizophrenia experience disturbed behavioral, cognitive, and thinking changes that can distort their perception of reality. Schizophrenia usually develops initially in people between the ages of 15 and 25, although it can appear later in life. The prevalence of schizophrenia in the general population is about one percent. 5 Mood disorders are another mental disorder described by sleep disturbance, a feeling of emptiness or sadness, general loss of interest and initiative in activities, and anxiety. 6 The severity of mood disorders is regulated by several factors, such as occupational function, their seriousness and duration, as well as the number of symptoms. Mood disorders are present in both unipolar and bipolar disorder (in major depressive episodes), which share common symptomatic and functional impairments;7,8 however, mania is not present in unipolar disorder, which is the main difference between unipolar and bipolar disorder. Therefore, we employed the term “Mood disorders” in this study to represent both unipolar and bipolar disorder. In general, patients with mood disorders develop a mood that is either prolonged or overly sad, depressed, and may even lead to suicide. 9 These symptoms can severely disrupt a person’s life. Schizophrenia and mood disorders are both serious MHDs with extreme symptoms. Several studies have indicated that there are overlapping symptoms between these two illnesses, thus making it difficult for doctors to identify the disorder and provide the correct treatment.10,11 Therefore, early detection of MHDs, not only based on symptoms, is a very important and urgent issue to avert or decrease deleterious effects on patients in the future.
Alongside the rapid technological development and explosion of information, deep learning (DL) is rising in popularity as a powerful technique for data analysis and decision support, with a better and more reliable performance than ever.12,13 In particular, in the healthcare domain, there are numerous real-life deployed applications of DL, such as using DL with big biomedical data for translating; to predict cancer cells with high accuracy; for early disease diagnosis; to predict health recovery trajectories, etc.14–16 Application of DL is becoming increasingly popular, and this technique is more widely-used than traditional data mining techniques. 17
In recent years, expenditure on wearable devices has been remarkable owing to their advantages and convenience. In addition to supporting users with daily reminders and notifications, these devices can track human activities such as sleep quality, count steps, calories burnt, etc. Thus, these devices provide a quick health condition overview. Furthermore, wearable devices are common for the remote management and monitoring of patients after leaving hospital.18,19 In addition, the devices could improve the quality of treatment and encourage patients to adhere to treatment, helping them to recover earlier as a result. 20 For these reasons, wearable devices are becoming an innovative solution for medical observation, monitoring, and the provision of early medical interventions.
In fact, the application of wearable devices with DL in healthcare is an innovative solution, and many researchers are currently working in this field. 20 This study employed a workflow that deploys DL models for MHD differentiation using activity motion signal data from wearable devices via two approaches. The aim was to build a support system using DL with wearable device data to provide physicians with an objective reference resource to assist in making differential diagnoses and planning treatment for patients. Instead of the long, traditional and costly process of diagnosis, such as interview, follow-up, and CT or MRI scan, by employing DL with wearable device data, physicians could obtain a pre-diagnosis – in other words, MHD early detection. We also generated three research questions. First, how can DL be applied with wearable device data to enable MHD differentiation? Second, what is the best approach for applying DL to detect and classify MHDs? And finally, how do the DL models perform in terms of prediction accuracy and sensitivity? The remainder of this study is presented as follows. In Literature review section, we review relevant studies of the differentiation of MHDs. We also run through several methodologies for applying DL with wearable devices in healthcare support systems. In Materials and methods section, we first introduce our target datasets with explanations, including several informatics charts and descriptive statistics, following which we present the DL concepts employed and the deployed DL model architectures. Experiments and results section shows our experimental process using two approaches and their results. Finally, Results section presents the discussion and conclusion.
Literature review
MHDs come in many different types (e.g. schizophrenia, bipolar disorder, unipolar disorder, dissociation, dissociative disorders, etc.) with serious symptoms and differing periods of suffering. In fact, schizophrenia and mood disorders (including bipolar and unipolar disorders) are both severe MHDs. These illnesses share common symptoms, such as delusions, depressed mood, sleep disturbance, social withdrawal, decreased concentration, and lack of motivation; 21 this poses important challenges in terms of diagnosis and providing the right treatment for each individual patient. 22 Classically, doctor and patient undergo an ask-and-answer conversation about mood, thought and behavior, and patients are required to complete questionnaires. This process is replicated again and again. However, this medical diagnosis process is also considered insufficient, and takes too much time. 23 Furthermore, people believe that a diagnosis of MHD carries a stigma, and that when it is recorded it is not good for their career; thus, some patients can be afraid of seeking medical care and try to bury their MHD, which could be treated from the early stages with a low cost.24,25
In addition, in MHD monitoring and follow-up, wearable devices are widely deployed and are being increasingly and progressively used, hence improving the quality of healthcare support and patient treatment.26–28 Numerous studies have been performed related to the use of wearable devices in MHDs. In particular, Naslund et al. proposed a framework using smartphone and Fitbit devices to track seriously ill psychiatric patients. 29 The participants were very pleased to take part in that experiment. They reported that they were encouraged to be more dynamic in order to reach their own activity goals, and in addition, they mentioned that the devices were useful for personal health status monitoring. Muaremi et al. examined a solution for stress experience evaluation by people using data from wearable chest belts and smartphones. 30 In detail, they collect data derived from the heart rate during sleeping, physical activity, audio, and communication data during the workday to build multinomial logistic regression models. The results showed that by combining all features, the accuracy of predicting three stress levels (high perceived stress, moderate, and low) reached up to 61%. Byrne et al. 31 used wearable devices to manage severe MHDs in the community. That study investigated the use of an inexpensive wearable device to detect physiological signs of stress from deviations in biometrics. The authors concluded that by employing a wearable device, it is possible to enhance treatment by improving early warning sign detection and improving communication between physician and patient. Another study by Cella et al. 32 employed wearable devices in order to disclose the autonomic signature of the severity of schizophrenia. They conducted their experiment in groups of 30 schizophrenia patients and 25 control subjects. The participants were asked to wear a mHealth device that was able to measure autonomic activity and movement during the experimental period. These wearable devices proved acceptable and provided reliable behavior and autonomic activity measurement. The authors stated that the schizophrenia patients had lower levels of functioning and heart rate variability movement in comparison with the control participants. In addition, Hunkin et al. discussed the application of wearable devices and their perceived acceptability with regard to MHD treatment. 33 In that study, they used a questionnaire that assessed perceptions of wearable and non-wearable treatments in current and former mental health help-seekers (N = 427). They reported that the wearable devices brought about strong interest in their use as an alternative to self-help options or as an adjunct to talking therapies. The aforementioned studies all applied wearable devices for patient monitoring, diagnosis and treatment. The physician obtains progressive information from their patient, thus providing a reliable resource for decision-making. However, several issues and challenges remain with regards to the real-life deployment of wearable devices in the healthcare setting due to factors such as stability, sensitivity, privacy, power source, continuous power supply limitation, user acceptability, safety, and even clinical knowledge.34,35
On the other hand, the application of DL in healthcare, especially in MHDs, has attracted increasing attention of late. Kwak et al. presented an easy to understand review of more than 320 studies on applying DL in healthcare. 36 They focused on the fields of medical image processing, genomics, electronic health, sensing, and online communication health from 2014 to 2019. In conclusion, the authors stated that with support from artificial intelligence, especially DL, healthcare informatics may ultimately change human life and open up a new paradigm for disease diagnosis, cancer detection, infectious diseases prediction, outpatient stroke prediction, etc. In terms of applying DL with wearable devices for healthcare support, Phan et al. proposed a DL approach to predict sleep quality using wearable device data. They conducted an experiment for 106 days in a row involving 30 participants (mean age = 20.79). Several DL models were deployed. The results showed that the DL models were able to predict sleep quality based on daytime physical activity with a highest accuracy of 62.2%. 37 By examining a variety of deep ensemble learning approaches, Nguyen et al. ascertained that ensemble methods are advantageous in the healthcare support system to enhance prediction and diagnosis performance, and ensure high reliability from physicians. 38 In terms of using DL for MHD prediction and prevention via wearable devices, Coutts et al. proposed a novel approach for mental and general health prediction using DL with wearable-based heart rate variability data. The experiment was conducted in 652 participants; subjective questionnaires were completed weekly or twice-weekly to evaluate the levels of general health, stress, anxiety, and depression. The experimental results showed that for mental health measures and classification, the proposed models achieved accuracies of 73% and 83% with two- and five-minute HRV data streams, respectively. 39 Another study by Bashivan et al. employed DL and other machine learning methods to recognize the mental state via a wearable electroencephalogram. In that work, electroencephalogram data were used, supported by machine learning, to differentiate between ‘emotional’ versus ‘logical’. The authors concluded that wearable EEG devices have significant potential in differentiating cognitive states among situations with different contexts. 40
Regarding major depressive disorder (MDD) and schizophrenia detection, Galvan et al. presented a feature selection and feature extraction with genetic algorithms methodology to detect depressive episodes in bipolar and unipolar patients. 41 The experimental results revealed that the proposed model with a feature extraction approach reached a value of 0.734 for the area under the curve (AUC). The authors concluded that it is possible to differentiate between depressive states by using the activity signal from a smart-band, providing a real-time preliminary and automated tool for physicians to support the diagnosis of depression. Zancella et al. used feature extraction before a random forest to differentiate between healthy controls and MDD patients. 42 The results showed that the proposed method achieved a sensitivity value of 0.867 and a specificity of 0.919. The authors concluded that the motor activity signal can be used to distinguish between healthy subjects and those with MDD. Jakobsen et al. 43 presented a SMOTE class balancing technique with a deep neural network in motor activity time series of healthy controls as compared with unipolar and bipolar patients. Their proposed method performed a cut above the rest of the deployed machine learning techniques. Boeker et al. 44 proposed hidden Markov model (HMM) parameters to classify healthy controls and schizophrenia patients. The work aimed to classify non-schizophrenic and schizophrenic participants based on the HMM, and the results showed that the features of the HMM were outperforming other models in terms of classifying non-schizophrenic and schizophrenic participants. Nguyen et al. 45 presented a deep stacked generalization ensemble learning approach to classifying healthy controls and depressed patients in a study that shared a dataset with the current study. However, the method of processing the dataset likely led to underestimation of the true generalization error. In detail, by using overlapping windows by a step of 1 day, very similar samples were generated, and if a sample was in the training set and a very similar one was in the testing set, it would be almost a seen data sample, and therefore easily recognized.
In conclusion, subsequent to the development of wearable devices and the boom in DL in healthcare, the abovementioned studies demonstrated that the application of DL with monitoring wearable devices in healthcare is promising. Further, DL methods have been shown to outperform traditional machine learning techniques. In addition, the traditional diagnosis methods for MHDs have some limitations, as mentioned above. Thus, using DL with wearable device data to differentiate MHDs is a promising approach, providing greater reliability and more convenience than traditional diagnosis methods. As a result, this can form an objective support system for physicians as a reliable resource for diagnosis and treatment.
Materials and methods
Materials
Our experiments were conducted on two open datasets, named Psykose and Depresjon.46,47 The authors declared that the schizophrenic state of the Psykose dataset was assessed by Haukeland University Hospital’s medical experts. The Psykose dataset was collected from 32 healthy controls and 22 patients with schizophrenia. The Montgomery-Asberg Depression Rating Scale was used to label the severity of the patients’ depressive state in the Depresjon dataset according to the rating of medical experts. The Depresjon dataset was collected from 32 healthy controls and 23 unipolar and bipolar disorder patients. Both datasets were collected through a wrist-worn actigraphic device (Actiwatch, fourth model, Cambridge Neurotechnology Ltd, United Kingdom), which participants were required to wear during the experiment for several days in a row. This device detects the peak amplitude of movement acceleration and later transfer it into a transient voltage signal proportional to the rate of the acceleration. Activity counts are generated from the raw digital voltage string being selected for each second. 48 There was a common method of data acquisition and data storage. The two mentioned datasets were first introduced in a study by Berle et al., 49 focused on data of “schizophrenia” patients, “unipolar and bipolar disorder” patients, and “healthy control” participants. The authors mentioned that, in the healthy control participants group, there were 23 hospital employees, five students, and four patients without serious medical or psychiatric symptoms from primary care. This group contained 12 men and 20 women, with an average age of 38.2 ± 13.0 years (mean ± std. dev.), ranging from 21 to 66. They also indicated that there was no healthy control participant with a history of psychotic or mood symptoms. However, the dataset was not published at that time. In two recent papers, schizophrenia and unipolar and bipolar disorder were released as two separate datasets, including the “healthy control” participants and corresponding patients. Therefore, the “healthy controls” across the studies were the same, without serious medical or psychiatric symptoms. Hence, we separated and re-ordered them into three classes corresponding to their characteristics, named Schizophrenia, Mood disorders, and Healthy control.
Descriptive statistics of the number of accelerometer data points collected from participants.
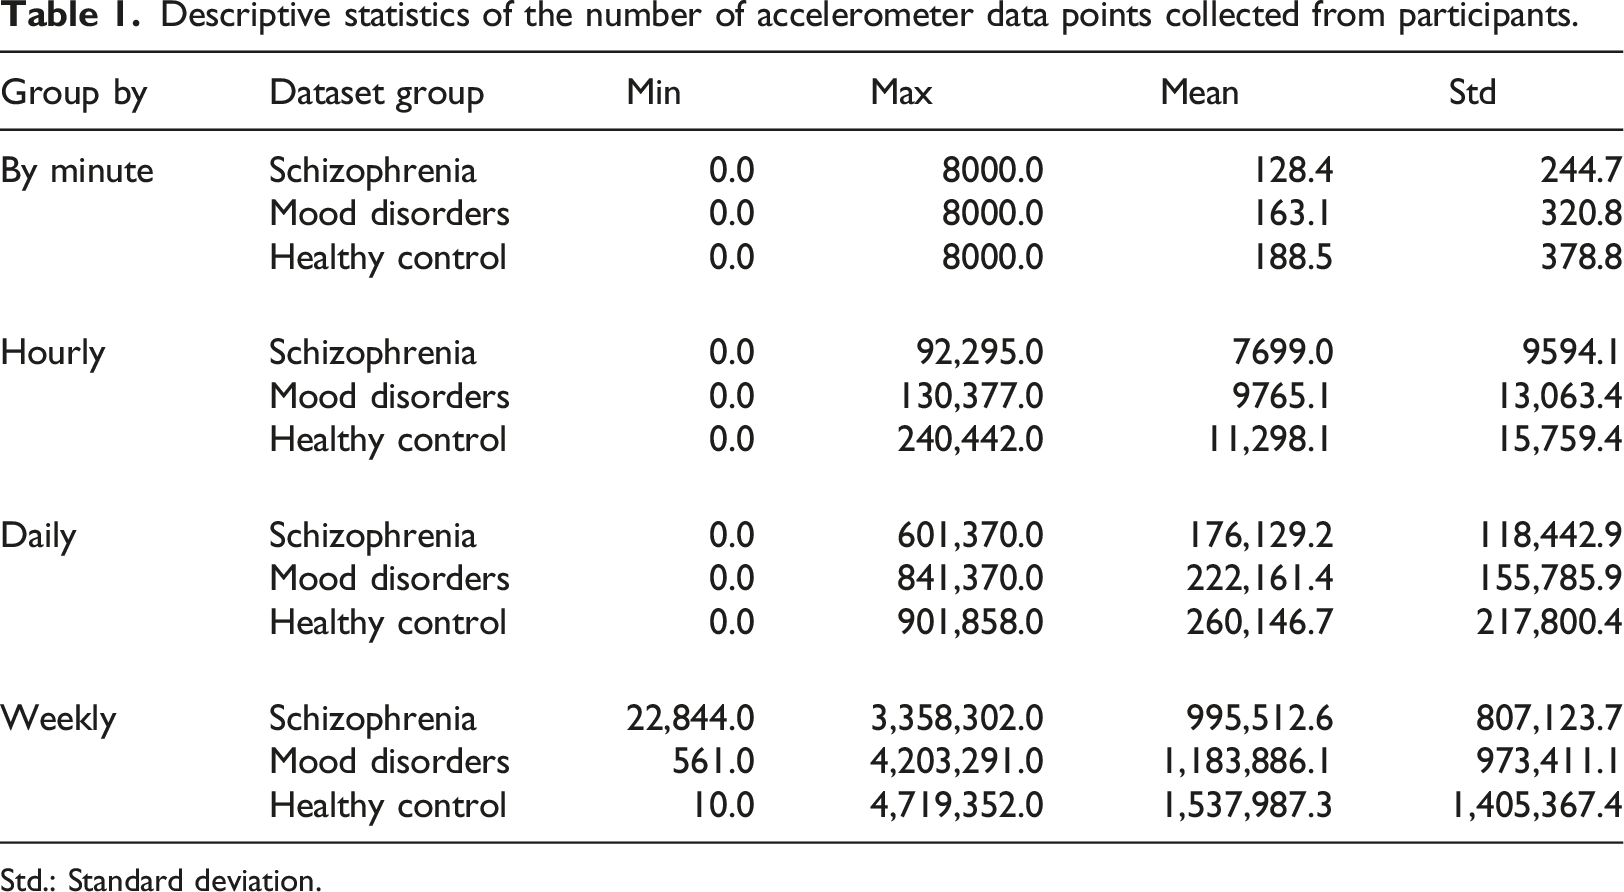
Std.: Standard deviation.
Overview of the wearable dataset across the three populations.

N/A: Not applicable. Std.: Standard deviation.
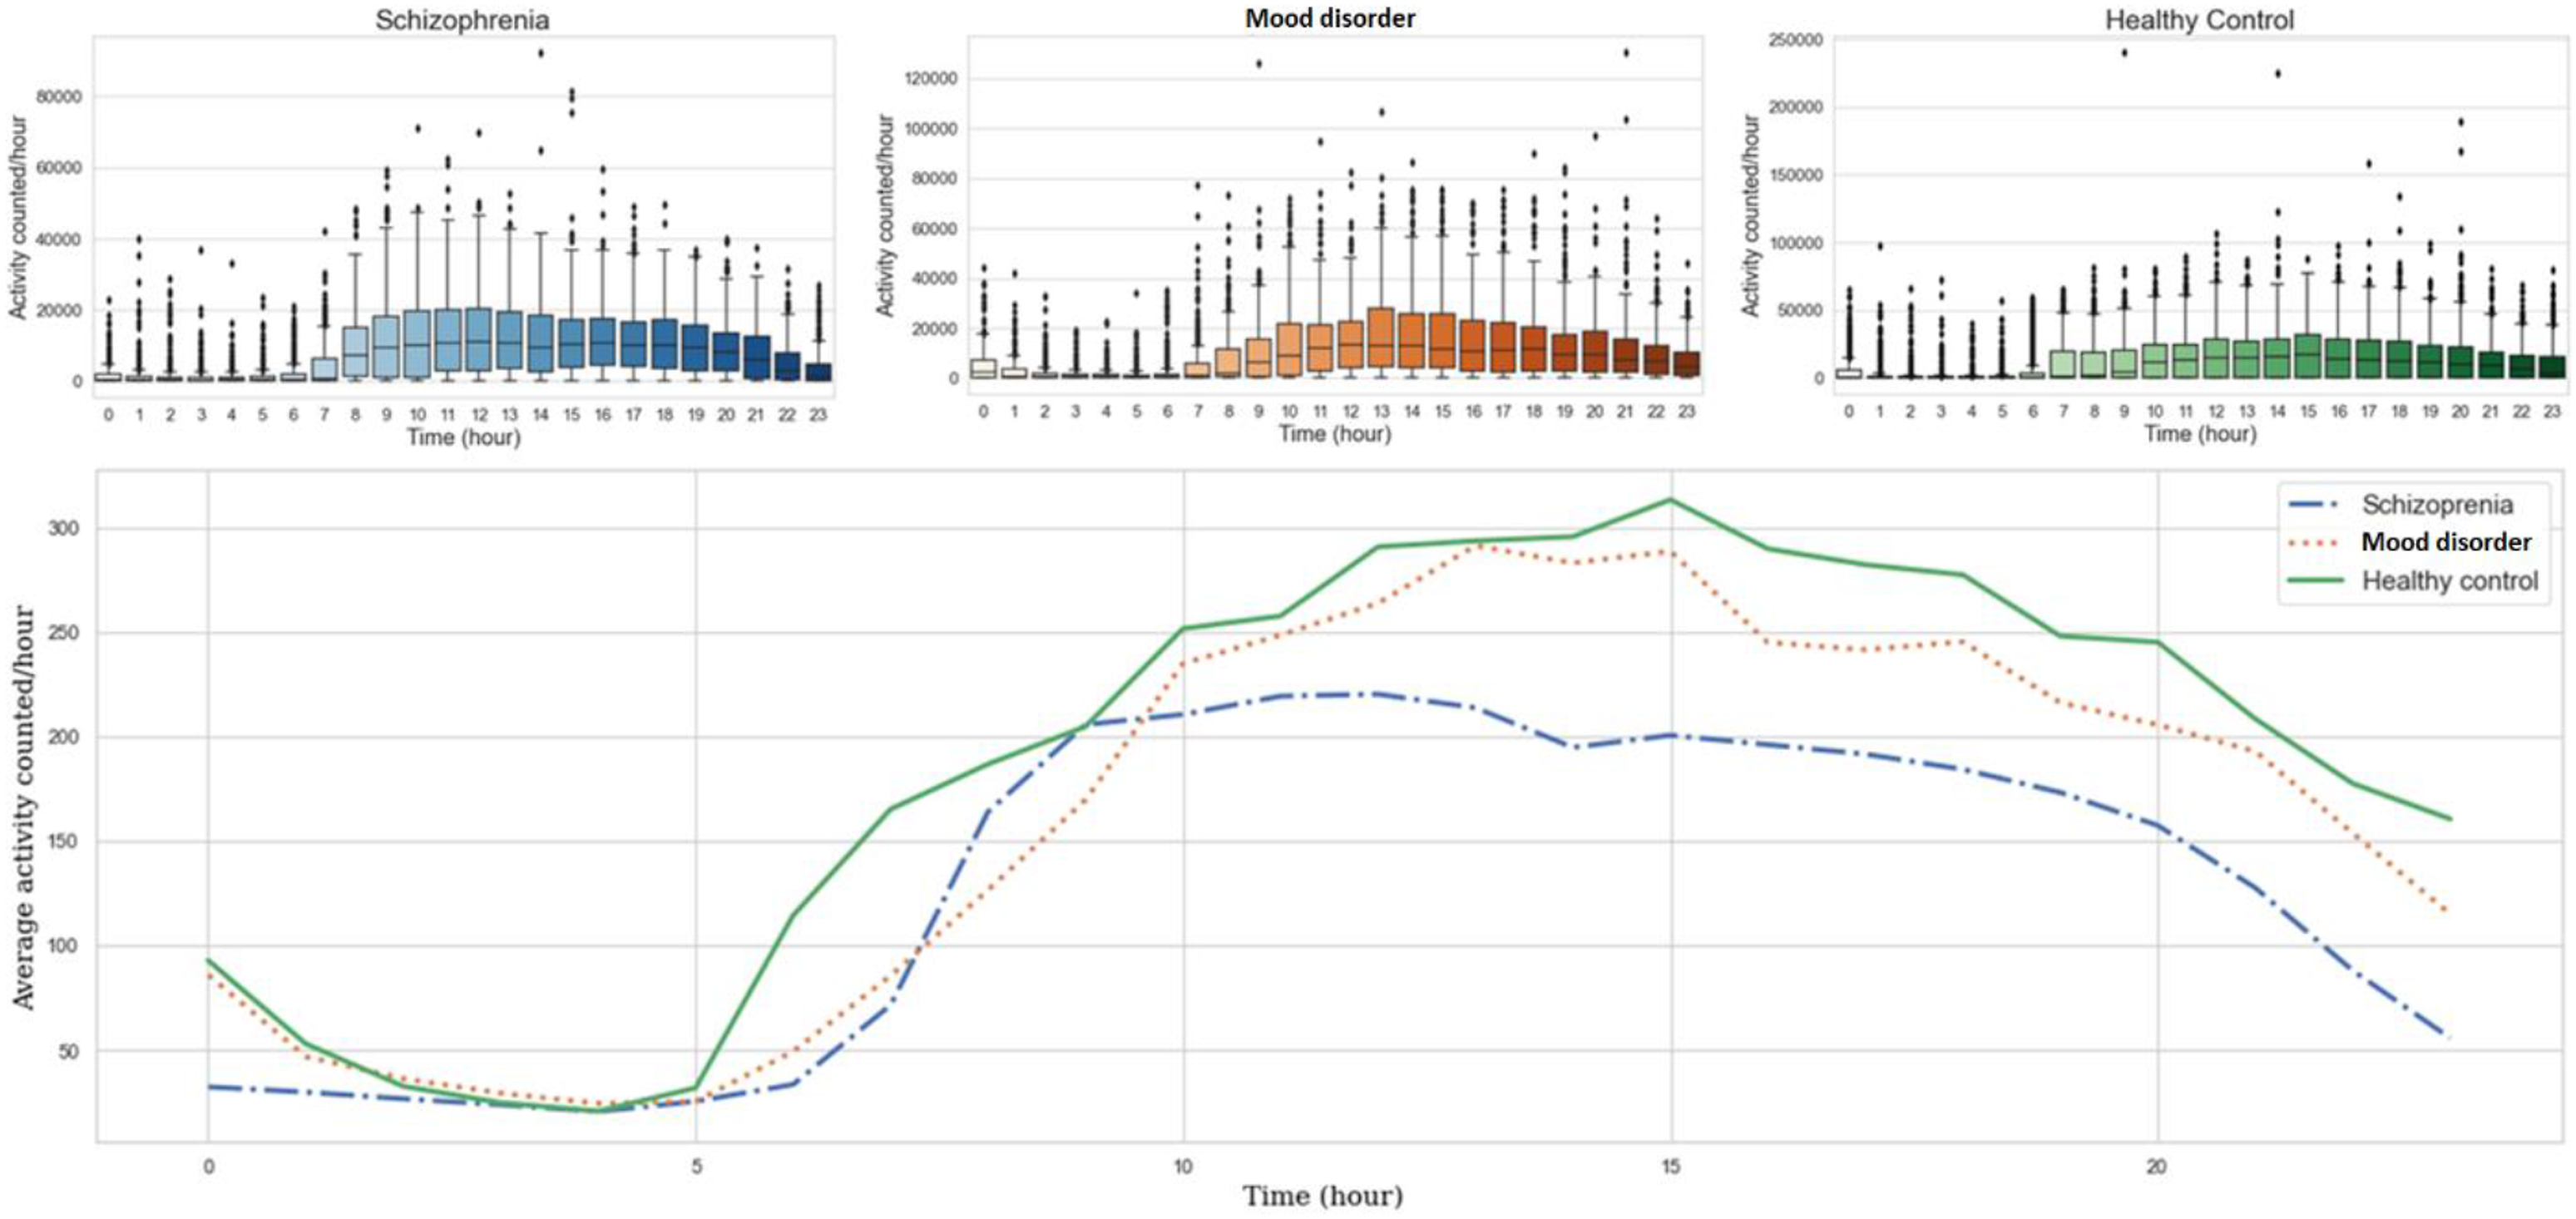
Boxplots and average of “The number of accelerometer data points” line chart in 24 h of the Schizophrenia, Mood disorders, and Healthy control groups.
Methods
In the proposed workflow, we deployed multiple deep learning models, namely, VGG16, Resnet50v2, XceptionNet, and EfficientNetB1, all of which are classed as a Convolutional Neural Network (CNN), and Long-short Term Memory (LSTM), Gated recurrent unit (GRU), Attention-based LSTM, and Attention-based GRU, which all come under the concept of a Recurrent Neural Network (RNN). Recurrent Neural Network models are suitable for time series data extracted from wearable devices, while in contrast, CNN models are commonly used for image-based tasks. However, the results of several studies have shown that the CNN has a good performance in seizing important features of sequential data.50,51 Hence, we present a way in which to preprocess sequential data to fit into these models (see Section 4.1) to take advantage of the CNN. Two approaches were applied with these models. The first approach was to perform the MHD Prediction and Differentiating between Mood Disorders and Schizophrenia tasks separately, while the second approach was the Direct Differentiation of Mood Disorders, Schizophrenia, and Healthy Control. We then compared the performances of the two approaches and the models using the specific evaluation metrics detailed in Section 3.2.3.
Convolutional neural network
The Convolutional Neural Network (CNN) is a concept of neural network applied widely for image-based tasks. The main idea of this concept is a structure constructed by several convolution layers and pooling layers placed interchangeably with each other. A fully connected layer is set in the end to conduct the final prediction.
52
The convolution layers extract the features from the right previous layers by using a use sliding windows. The pooling layers are deployed to reduce dimension from the right previous layers. The outputs of both the convolution layers and pooling layers are so-called feature maps. Right after the last convolutional-pooling layer block, the fully connected layer is deployed to flatten the output of this block into a simple neural network structure. At the end of this structure, the output layer yields the processed values that correspond to the prediction or differentiation result (Figure 2). A basic convolutional neural network structure. The main elements of this structure are intersecting placed convolution and pooling layers, and the fully connected layers at the end.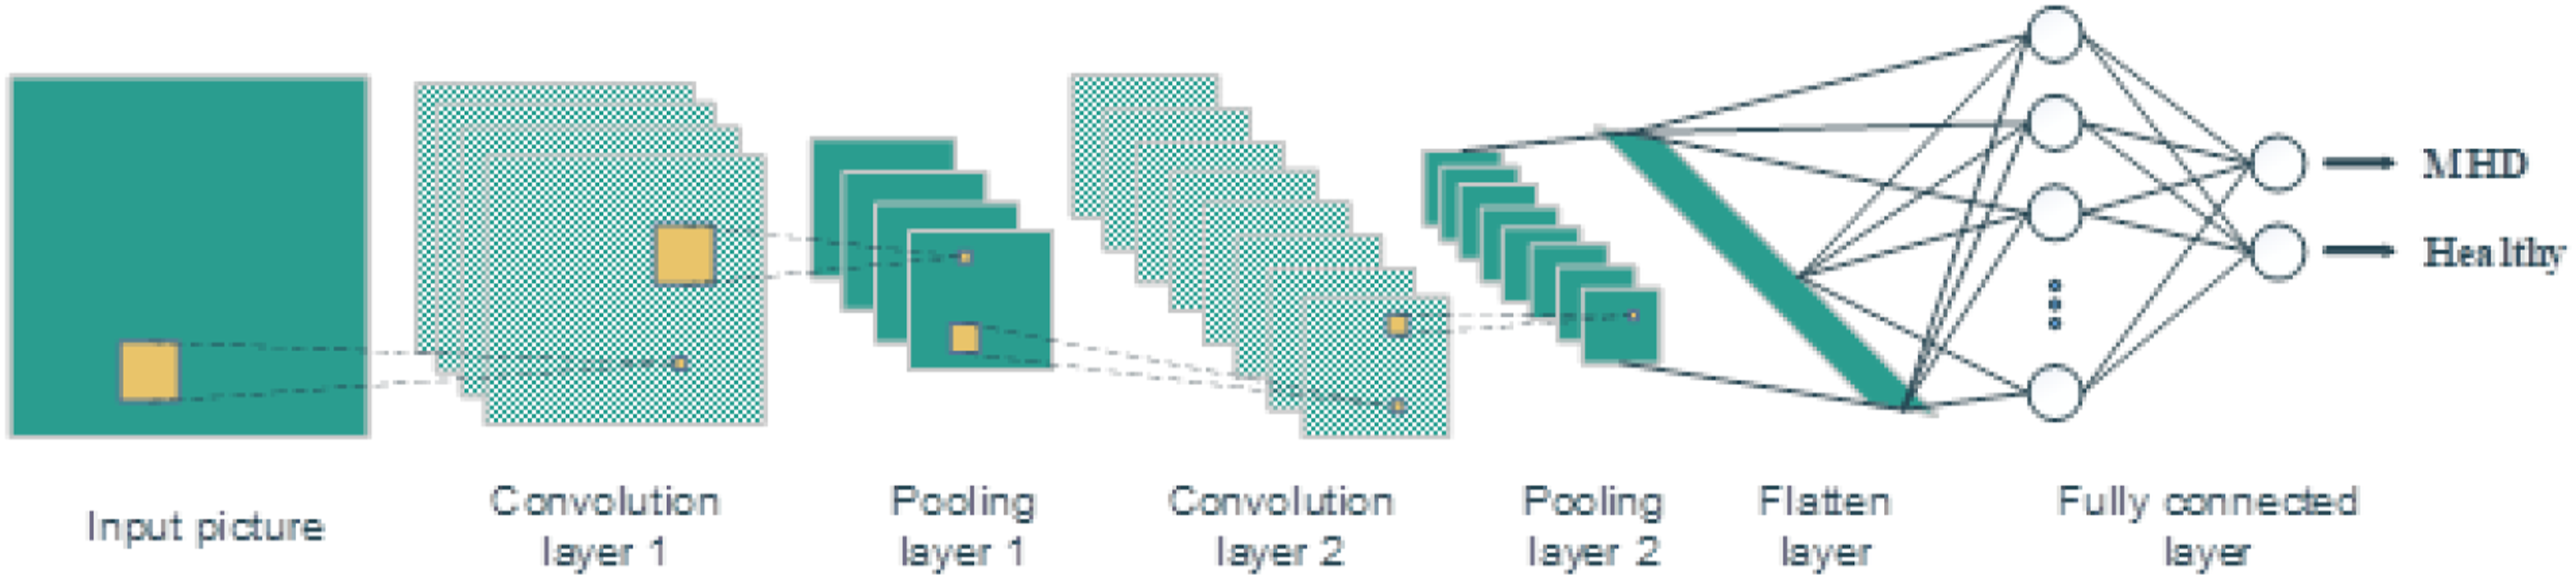
In this study, four models of the CNN concept were deployed, namely VGG16, Resnet, XceptionNet, and EfficientNet architectures. In detail, VGG16 is an upgraded version of a standard CNN following the arrangement of convolution and max pool layers consistently throughout the whole architecture. In the end, there are two fully connected layers with a Softmax activation function. 53 Using a residual learning framework, Resnet is named after its architecture; this model can deal with the vanishing gradient problem seen in previous DL architectures. 54 The modified version named Resnet50V2 was deployed in our experiment. The Xception model was designed based on Resnet, and is a linear stack of residual connections with depthwise separable convolution layers. 55 EfficientNet is a simple architecture but gains a highly effective compound coefficient by uniformly scaling all dimensions of depth, width, and resolution in a gradually increasing way. Intuitively, whenever the input image is bigger or smaller, EfficientNet is always able to automatically adjust more or fewer layers and channels to increase the receptive field, capture more fine-grained patterns, and optimize the training time. 56 A member of the EfficientNet family named EfficientNetB1 was deployed in this experiment.
Recurrent neural network
As another concept of a neural network, a Recurrent Neural Network (RNN) is usually employed for time series data in order to make predictions relying on a sequence of previous information (Figure 3). It is a type of feedforward neural network, the way in which it delivers information along the cells in this network lending the term Recurrent. The RNN has the internal state on the neural cell to process the variable-length sequence of input, and the output of the current state will be the input of the next states of itself. A basic Recurrent Neural Network structure and its unfold state. (hi is the neural network cell or layers, xi is the input at time step ith, yi is the output at time step ith, Vi is the output for the next step, U and W are the weights of the hidden layers.)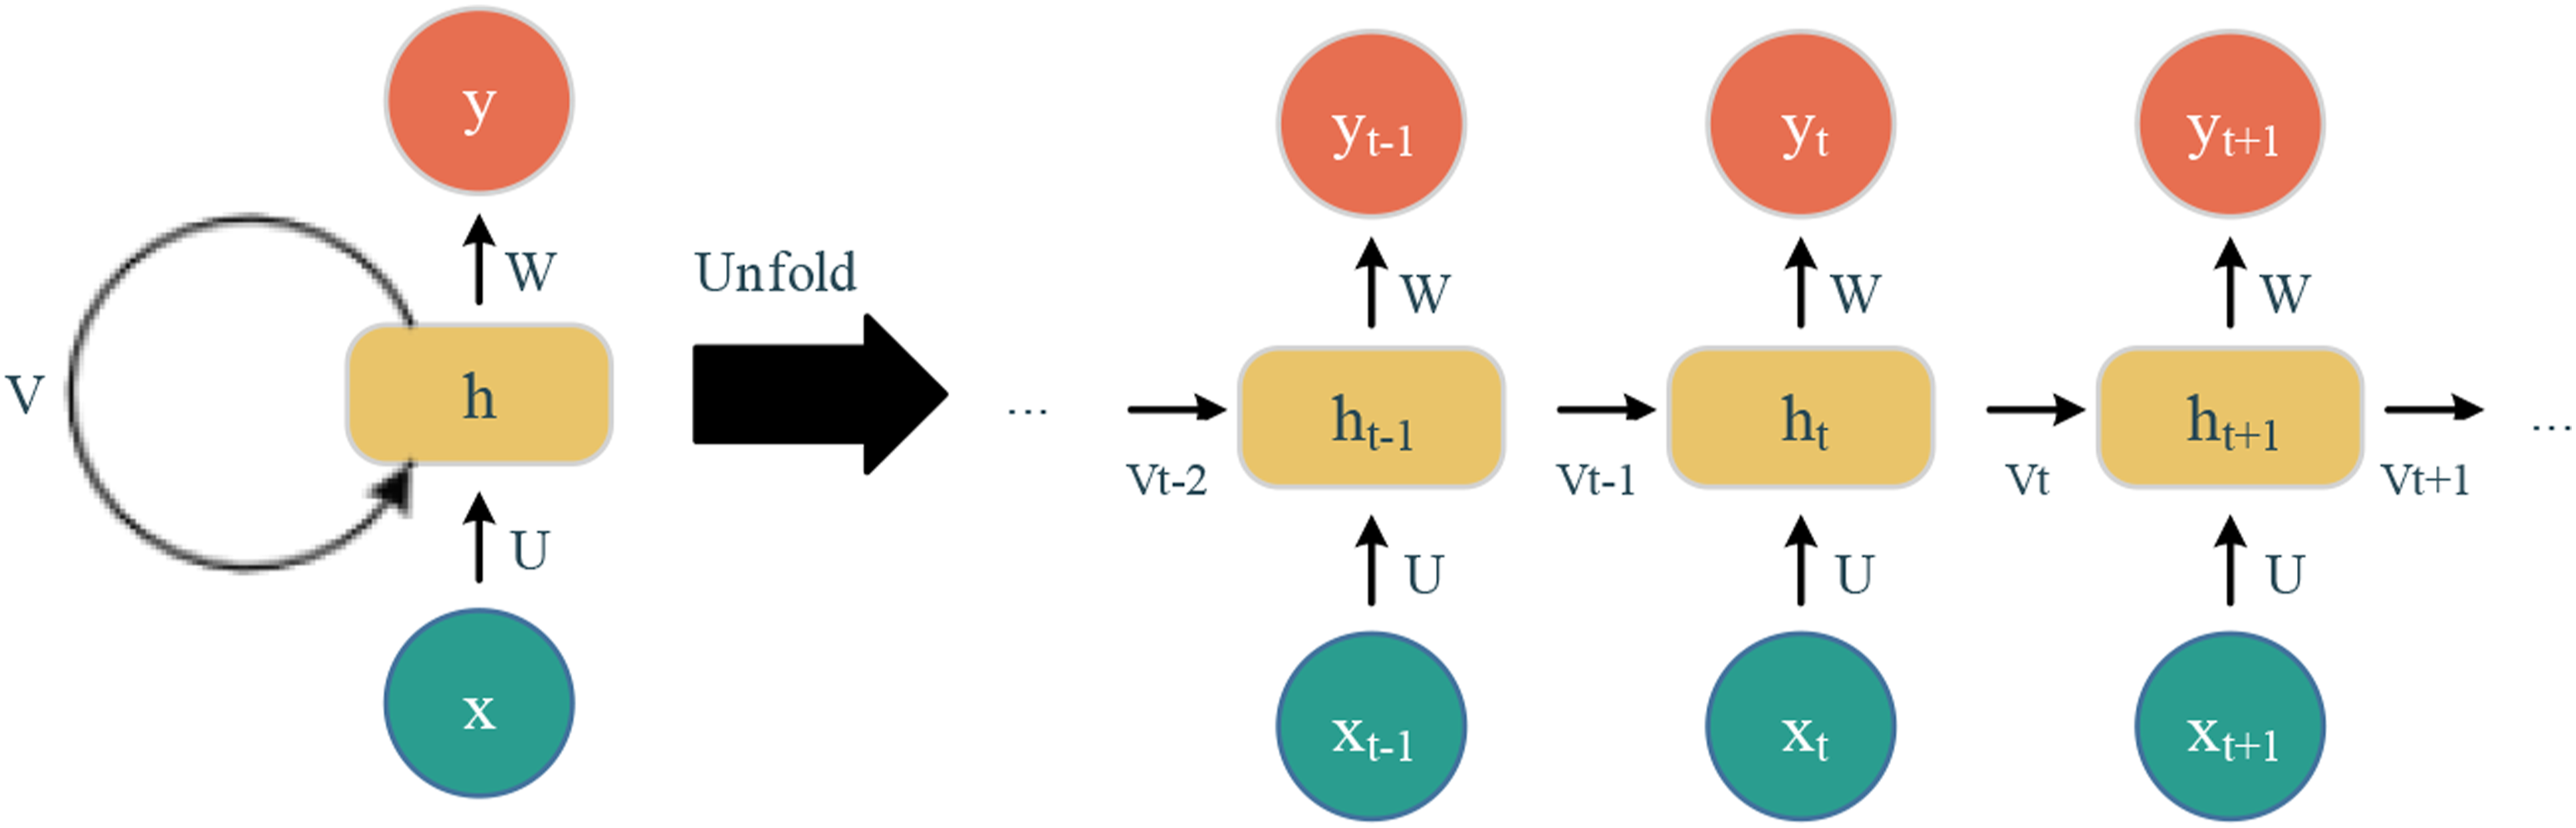
In this study, we deployed two architectures based on the RNN concept, named Long-Short Term Memory (LSTM) 57 and Gated Recurrent Unit (GRU), 58 and the other two models were the Attention-based LSTM and Attention-based GRU.LSTM is able to store long-term dependency information owing to four different gates with different activation functions – namely, forget gate, input gate, and output gate - to keep and store or let the information pass to the next state. Specifically, the forget gate decides whether the information, which is combined from the previous state output and current state input, should be thrown away or kept. The input gate is used to add relevant information from the current state. The output gate’s role is determining the next hidden state. The GRU network is an updated version of LSTM. Instead of three gates as in LSTM, the GRU has only two gates, a reset gate and an update gate. In detail, the reset gate is used to determine how much information from the previous state need to be removed, and the update gate has similar functions to the forget and input gates of LSTM, deciding whether to let the information go through or not and what information needs to be added. Attention is a mechanism that is usually used in RNN architectures for natural language processing tasks that refer to sequence data. Attention’s idea comes from making an encoder-decoder architecture able to have a variable length of internal representation. In order to do that, this mechanism keeps the intermediate outputs from the encoder layer, and after that, the model is trained on attention-selected information. In short, the output information is conditional on the attention-selected item from the input information. 59
Performance metrics
Commonly, a confusion matrix and corresponding derived metrics are employed to evaluate supervised learning models for classification tasks. The basic components of this matrix are so-called True Negative (TN), True Positive (TP), False Negative (FN), and False Positive (FP). Specifically, TN describes truly negative samples that are predicted as negative, TP describes truly positive samples that are predicted as positive, FN describes truly positive samples that are predicted as negative, and FP describes truly negative samples that are predicted as positive (Figure 4). Confusion matrix.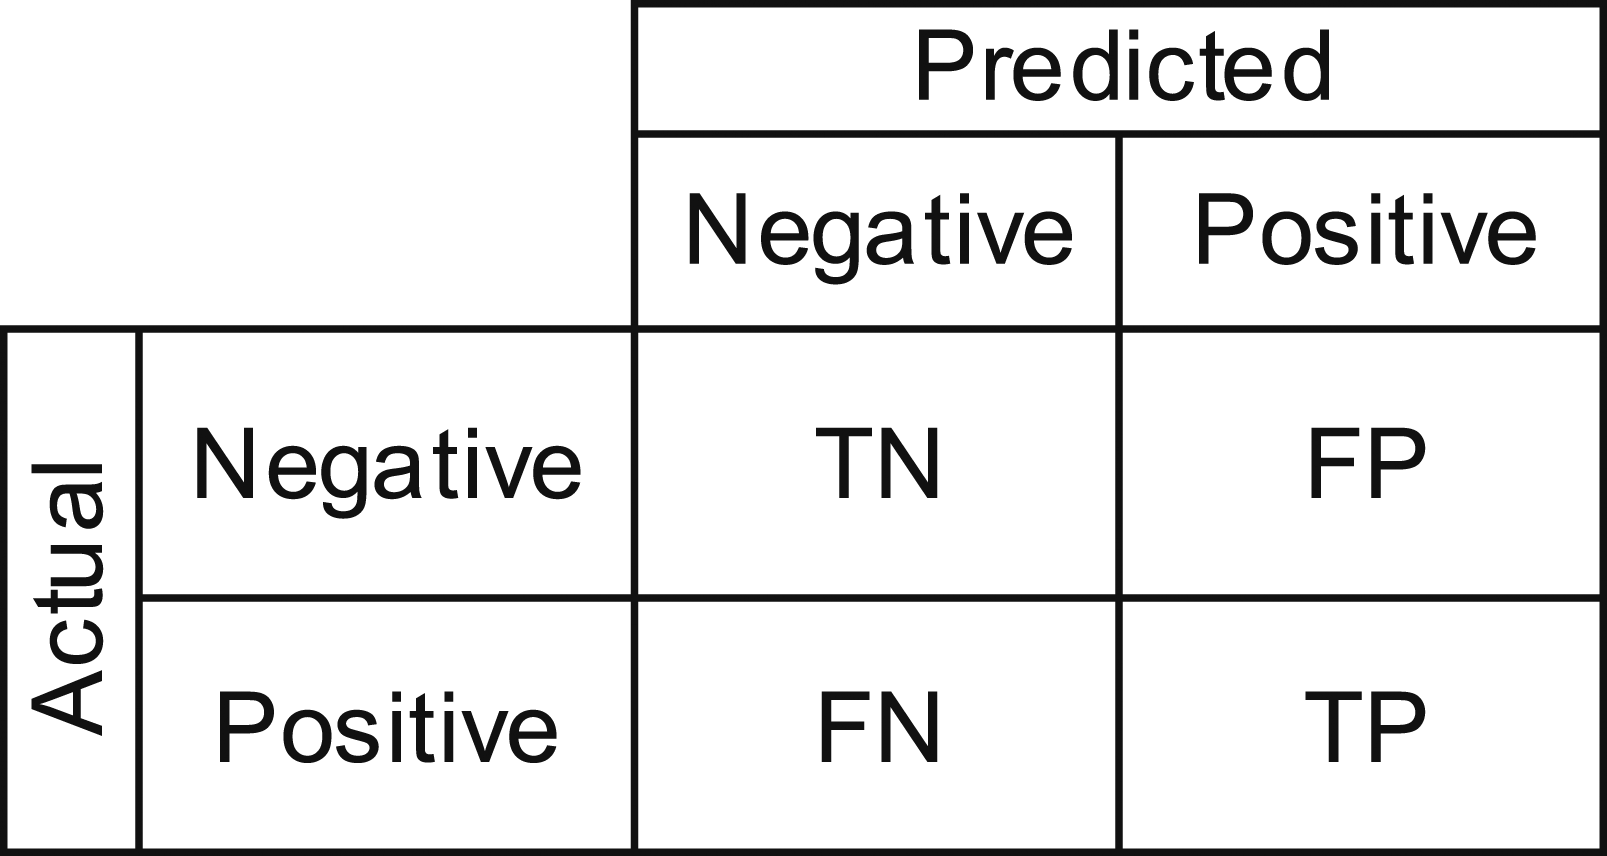


Descriptions of evaluation metrics.
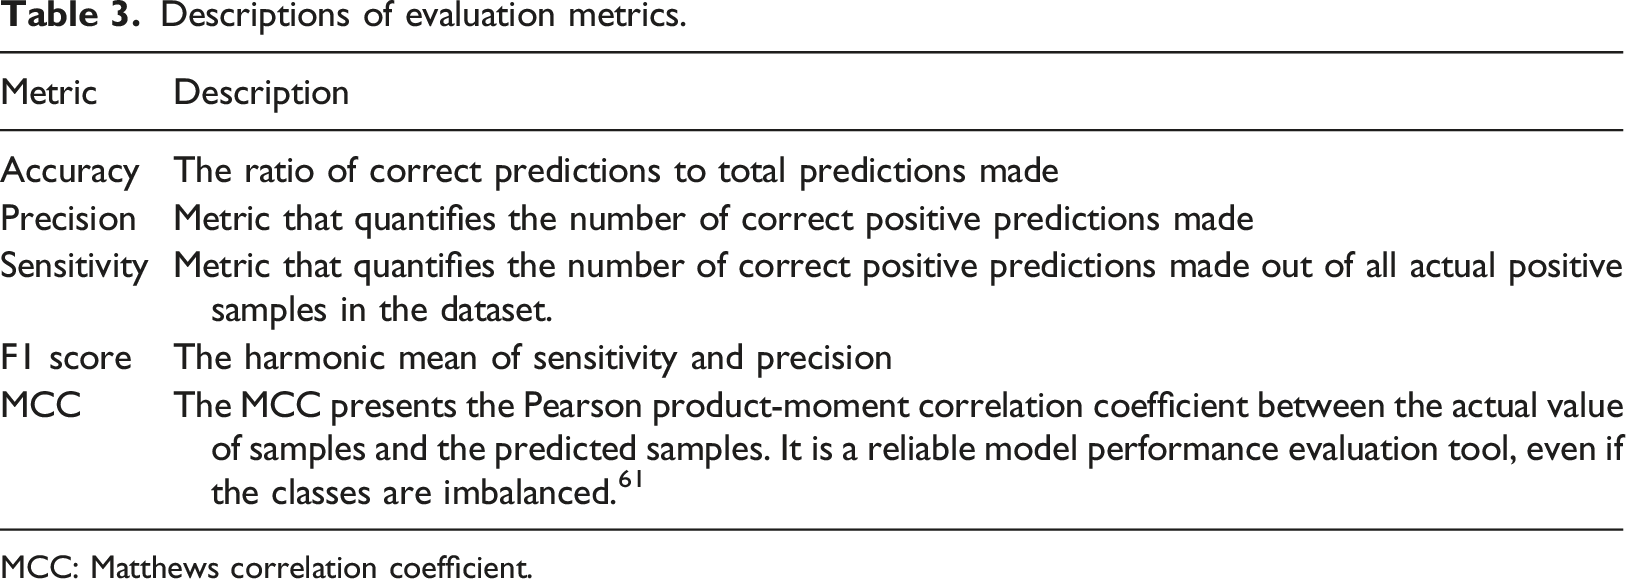
MCC: Matthews correlation coefficient.
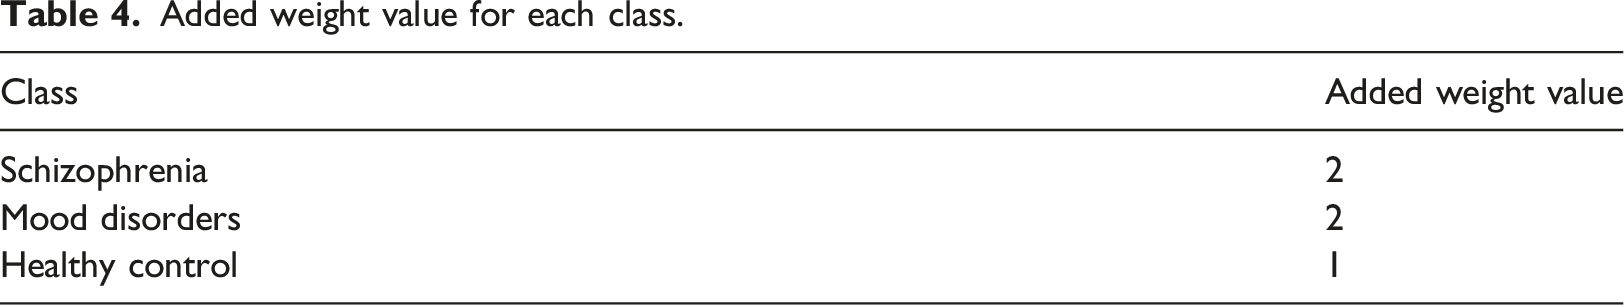
Added weight value for each class.
Experiments and results
Proposed framework
We conducted the experiments in three phases, namely Data preprocessing, Building and training models, and Evaluation models (Figure 5). The details of these phases are presented below. Proposed framework. (Phase 1: Data preprocessing; Phase 2: Building and training models; Phase 3: Evaluation models) MHD: Mental health disorder.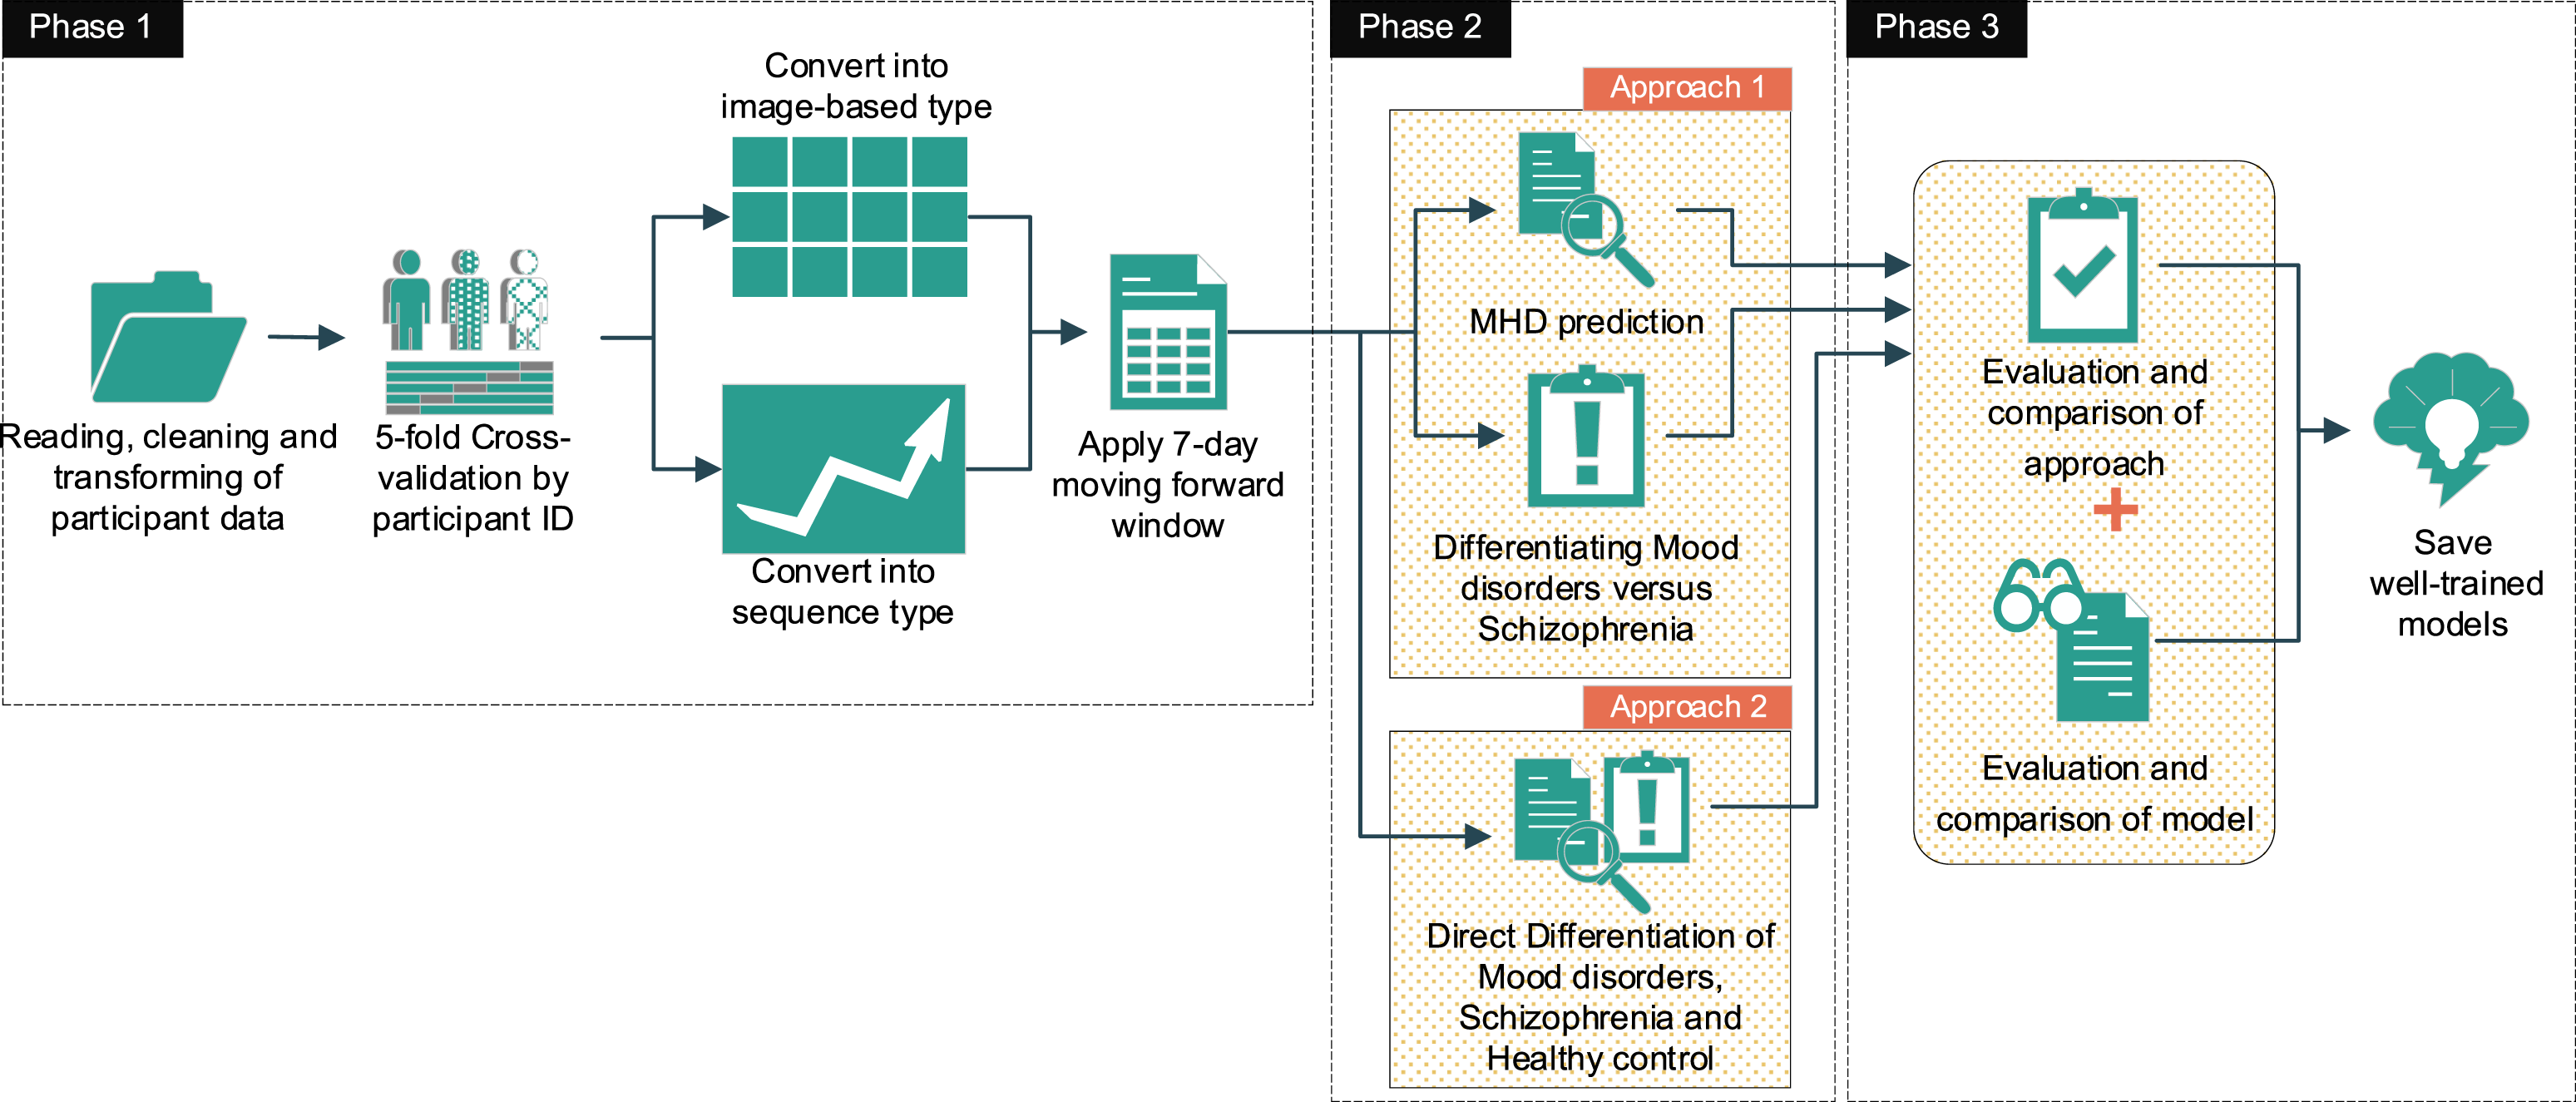
Phase 1 began with reading and cleaning of the raw data, which was the set of number of accelerometer data points collected in every single minute from the individual groups, Schizophrenia, Mood disorders, and Healthy control. Next, we used 5-fold cross-validation by participant ID; in other words, for each fold in the cross-validation process, 20% of the participants in each group were kept for testing, and the remaining 80% of participants were used for training. We then transformed the data to fit the deployed models. In detail, the experiments were conducted under two different concepts of DL, of which the RNN concept is widely-used for sequential data, which only has one dimension. These datasets were originally time-series data, which are apparently suitable for RNN concept models. However, the CNN concept is widely-used for image-based datasets, which have width, height, and depth dimensions. Hence, we converted these datasets into a 1440xDx1 pseudo image for each sample, where 1440 was the height, D the width and one the depth of the pseudo generated image corresponding to the total minutes in a day, the total number of recorded dates, and the number of activity types. Subsequently, for every participant from each dataset, we applied a 7-days moving forward window, with a 1-day moving step that covered 7 days for each sample from the beginning until the date on which the moving window reached the end of the collection term of the individual participant. In detail, we generated (Di −7) samples for each participant, where Di is the total days collected from participant ith. The moving forward window was designed in a different way depending on the deployed model (Figure 6). The numbers of generated samples are presented in Table 5. 7-Day moving forward window. A: The 7-Day moving forward window for sequence data with a length of 10,080, where 10,080 is the total minutes in 7 days. B: The 7-Day moving forward window for image-based data, which had a size of 7x1440; seven is the days that this window covers and 1440 is the total minutes for each day. Data descriptions of the two approaches. * Approximate distributed ratio. MHD: Mental health disorder.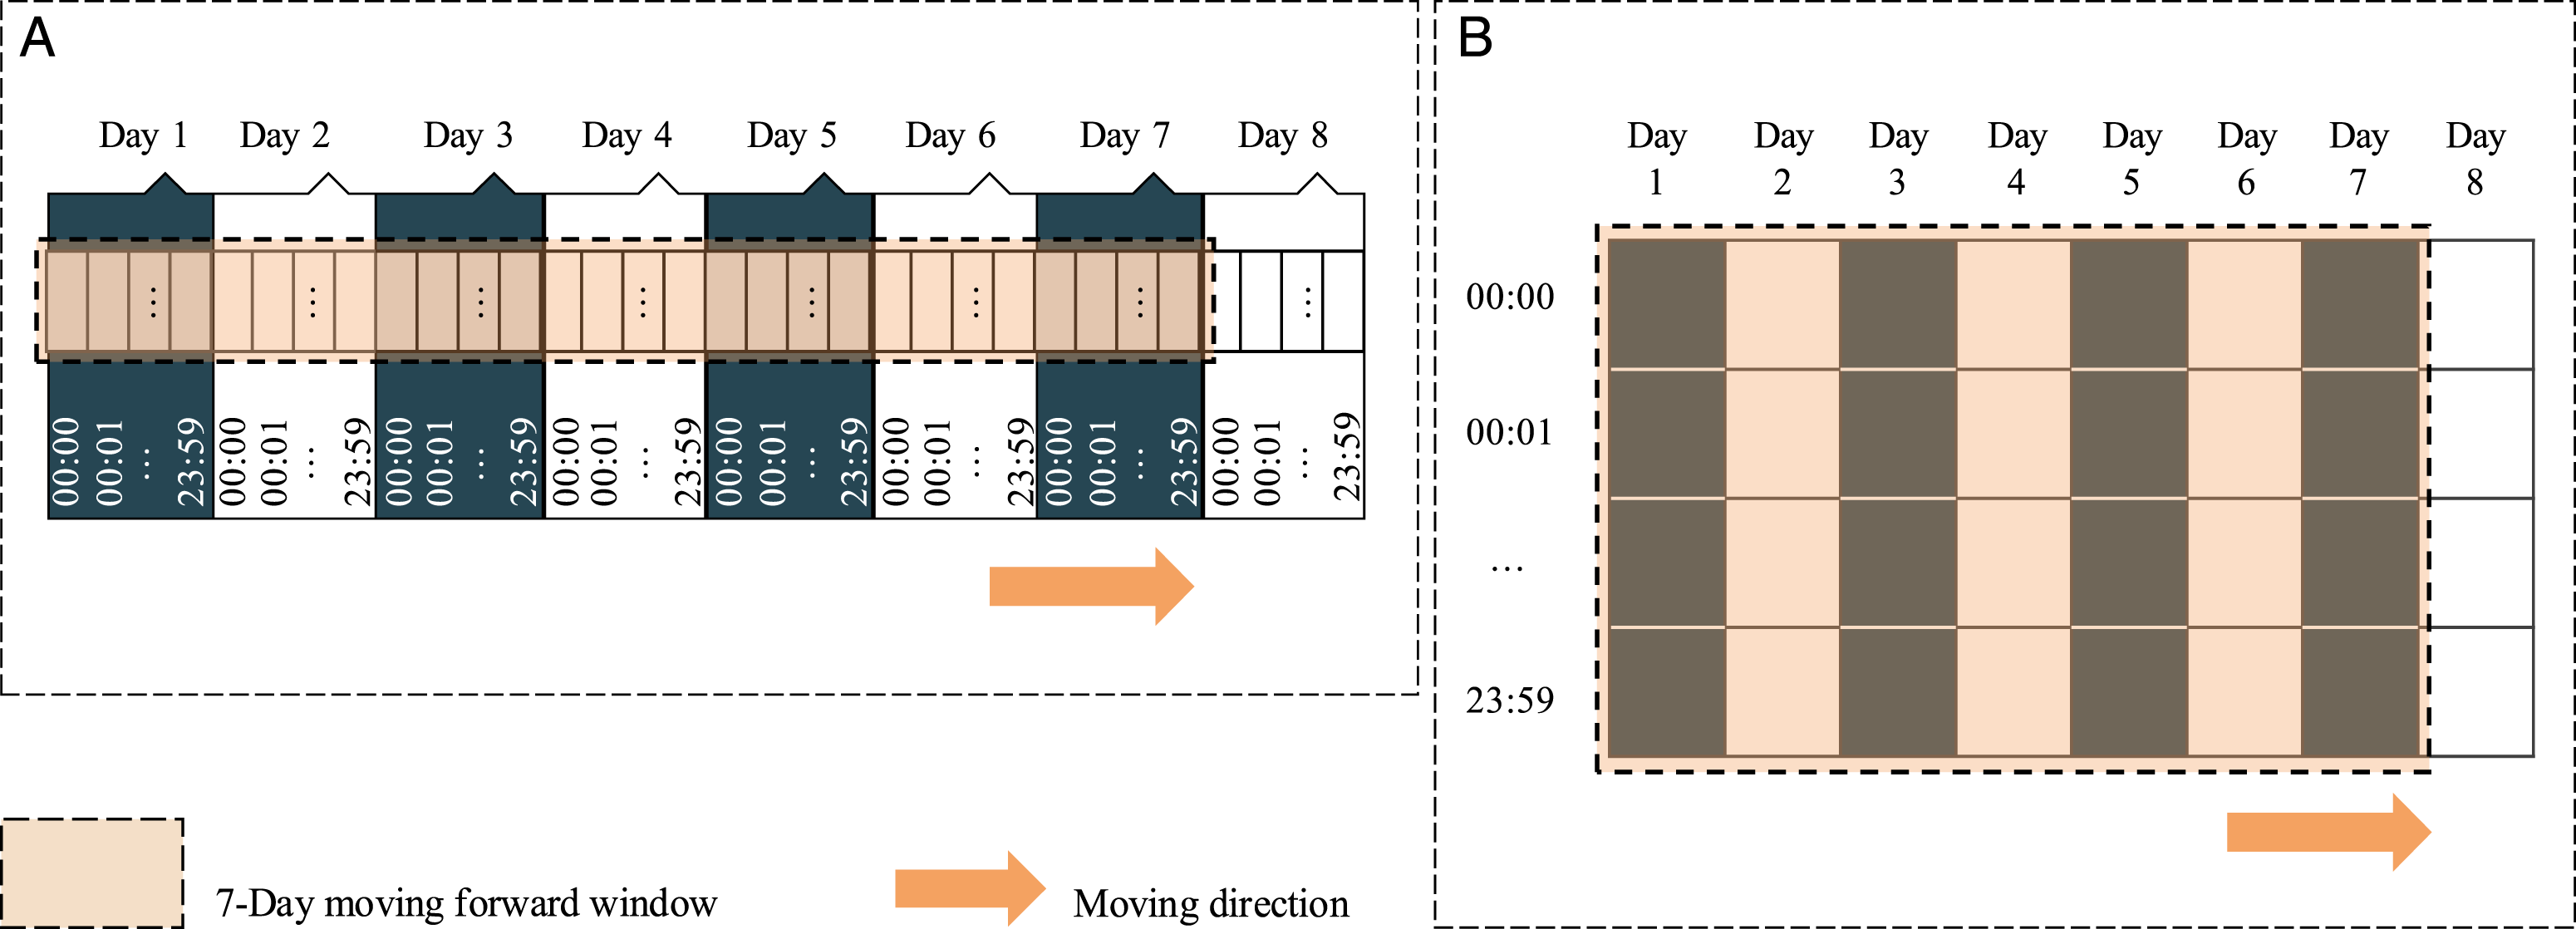
In phase 2, we have a different combination of these three individual datasets for each approach, which is described in section 4.2. Multiple DL models with different approaches were trained, namely Resnet50v2, VGG16, XceptionNet, and EfficientNetB1, which belong to the CNN concept (Tables A1-A4), and LSTM, GRU, Attention-based LSTM, and Attention-based GRU, which belong to the RNN concept (Tables A5-A8).
In phase 3, we evaluated and compared the approaches and models based on the proposed performance metrics. Finally, the well-trained models were saved for further applications. We implemented our experiments on Anaconda v1.10.0, Python 3.7, with free machine learning software and a DL library named Scikit-learn version 0.24.1 and Tensorflow version 2.1.0.62–64 We conducted the whole process on a computer with the following specifications: Intel(R) Core(TM) i9-10900K CPU, GeForce GTX 1080 Ti 11 GB GPU memory, and 32 GB DDR4 RAM.
Experiments
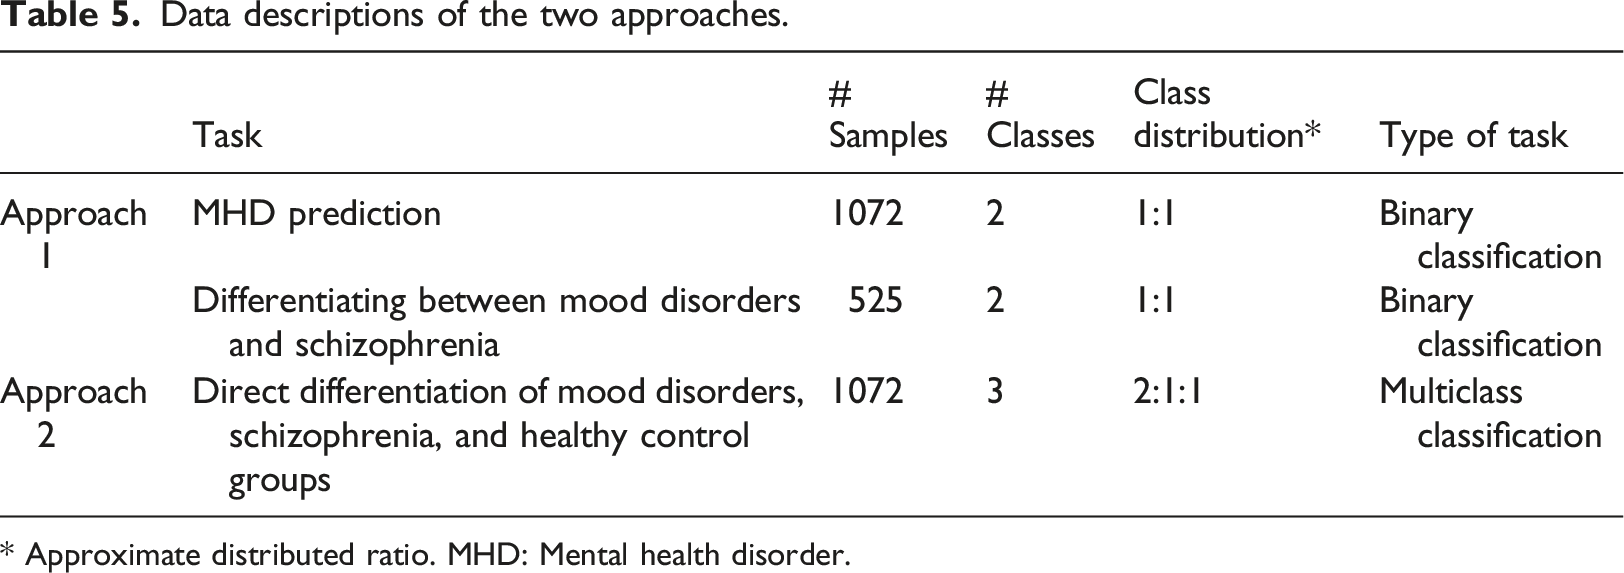
To prove the advantages of DL in differentiating MHDs using wearable device data, we conducted our experiments using two approaches (Figure 7). A description of the data in each approach is presented in Table 5.
In the first approach, we conducted the MHD prediction task and the Differentiating between mood disorders and schizophrenia task separately. In detail, the aim of the first task was to detect patients who have MHDs (no matter what type of disorder) from the participants. To do that, we first combined the Schizophrenia group and Mood disorders group into one, named the Mental health disorder group. The samples belonging to this made-up group were notated as class 1. On the other hand, the samples belonging to the Healthy control group were notated as class 0. The total samples in each group were 525 and 547, respectively. The objective of the second task was to classify the MHD among the patients. In this task, we only conducted the experiment on the Schizophrenia group and Mood disorders group. Specifically, the samples belonging to the Schizophrenia group were notated as class 1, and the samples belonging to the Mood disorders group were notated as class 0. The total samples in each group were 258 and 267, respectively. Hence, both of these two tasks are of binary classification, but with different aims. In fact, a physician could deploy these two tasks separately according to their specific requirements.
On the other hand, in the second approach, we conducted our experiment on all three datasets. Samples belonging to the Healthy control group were notated as class 0, samples belonging to the Mood disorders group were notated as class 1, and samples belonging to the Schizophrenia group were notated as class 2. The total numbers of samples of each class were 547, 267, and 258, respectively. Consequently, the second approach was a multiclass classification task with an imbalanced distribution.
By deploying 24 trained-by-task DL models, much effort was put into tuning and choosing the hyperparameters of the DL models. Essentially, we used the training data for training and tuning the hyperparameters and the test data for evaluating and comparing the optimal learned models. We considered two hyperparameters, namely, the number of epochs and the learning rate. A grid search over the hyperparameters based on the MCC was performed for each architecture. TableA10 presents the performance of each model in terms of deployed learning rate and epoch. The optimization algorithm for all models was fixed with the Adam optimizer. The selected hyper-parameter sets for each model are presented in TableA11. Some tricky techniques were used to improve the models’ learning performance. In detail, the LearningRateScheduler function was applied to scale down the models’ learning rate by 10% after every 40 epochs during the process of training, thereby enhancing the learning performance of the DL models. In addition, the ModelCheckpoint function was applied to save the best weight of the model once validation loss reached the minimum value. Proposed approaches. We conducted our experiment using two approaches. In approach 1, the MHD prediction task was performed to detect MHD patients out of the participants, and the Differentiating between Mood disorders and Schizophrenia task was to classify schizophrenia and mood disorder patients. These two tasks were conducted separately. Approach 2 combined the two tasks above into one prediction, in the Direct Differentiation of Mood disorders, Schizophrenia, and Healthy control groups task.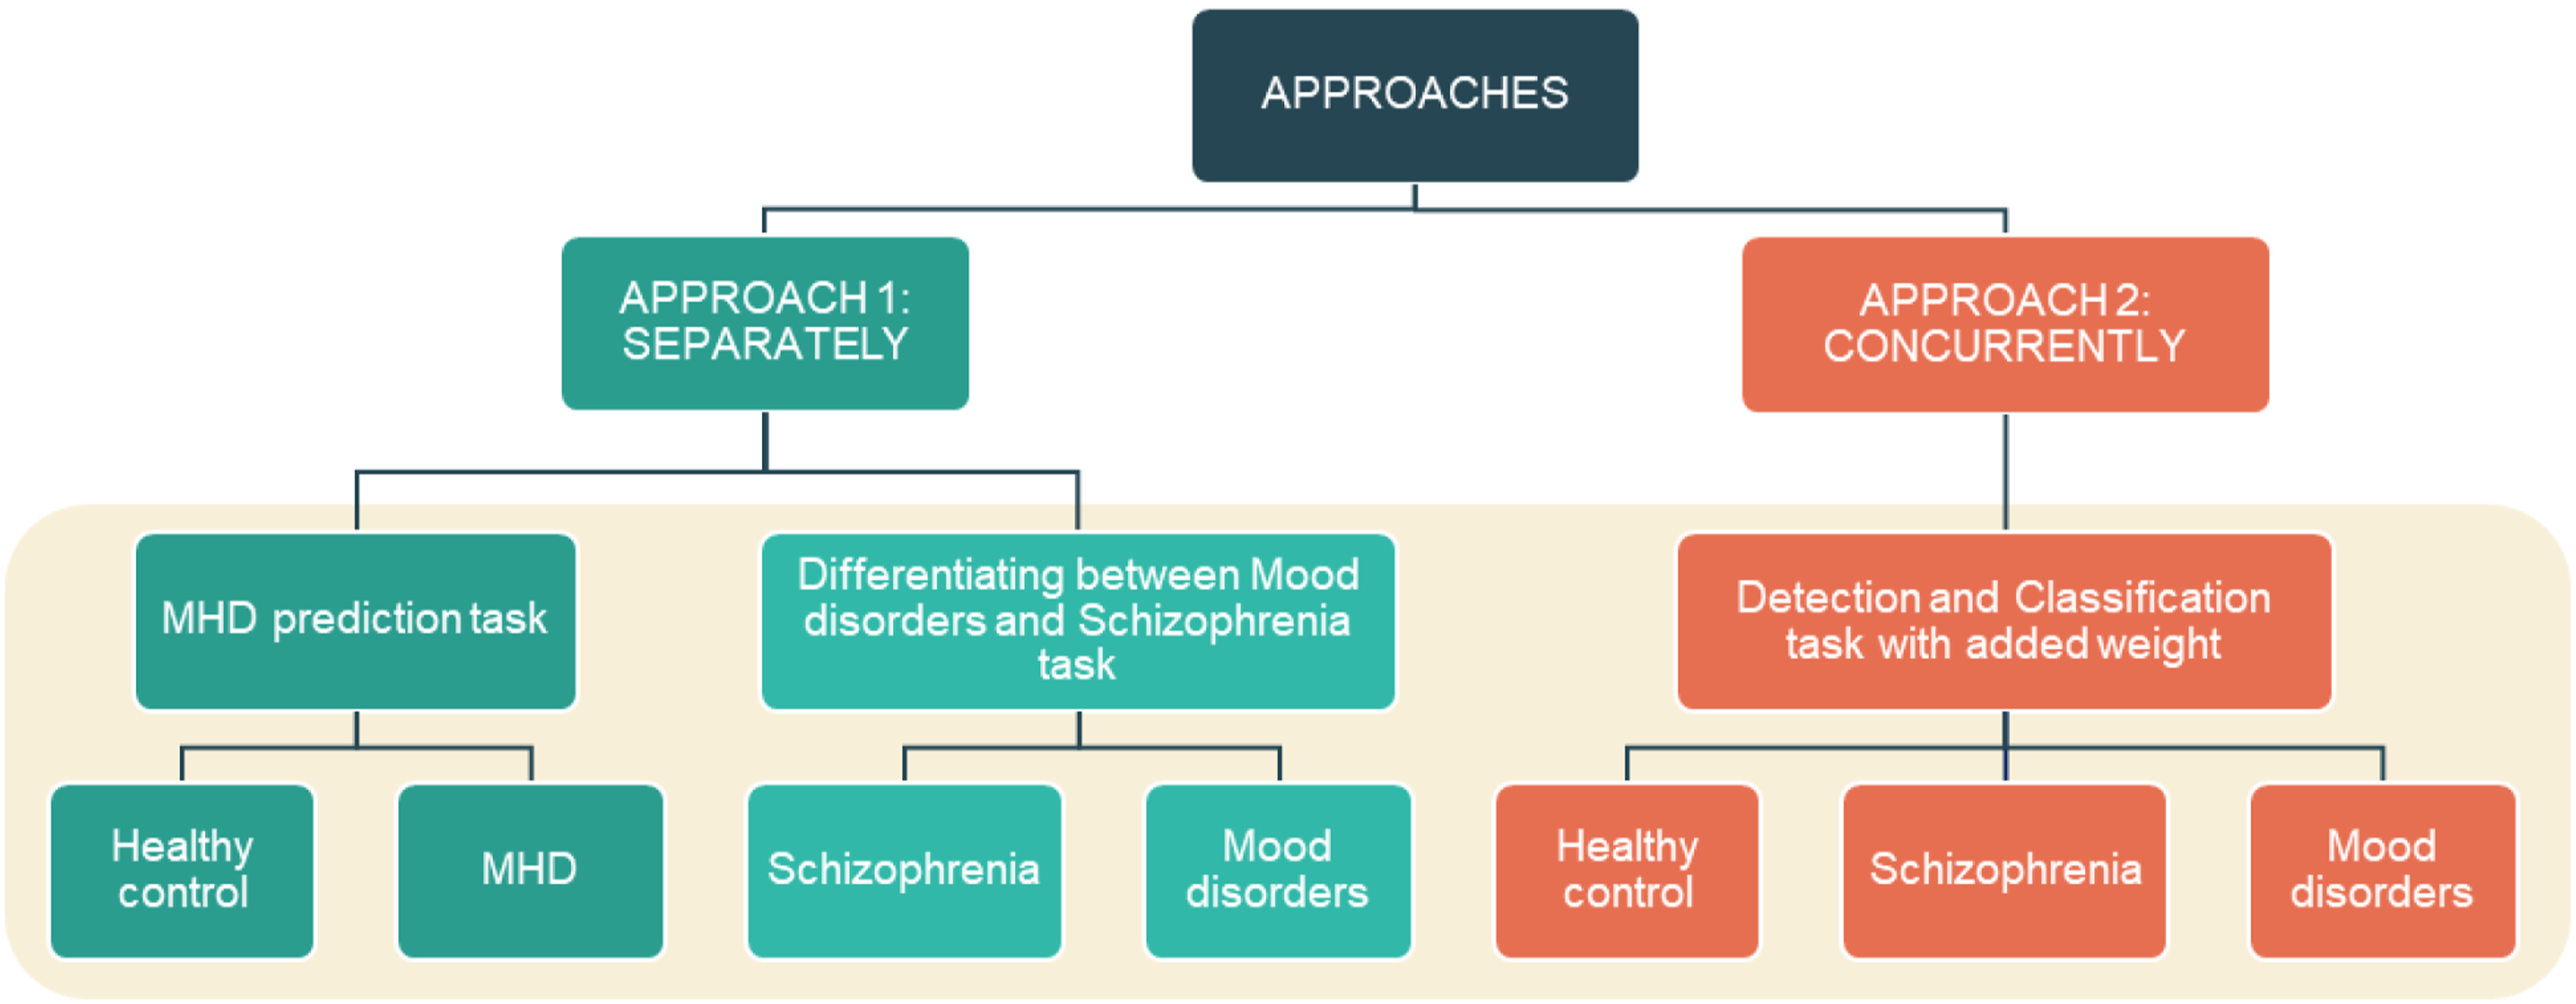
Results
In this study, we conducted experiments using eight well-known DL models belonging to the CNN and RNN concepts for every single task in each approach. In total, 24 trained-by-task DL models were deployed in our experiments; we conducted 16 trained-by-task DL models using the first approach and eight using the second approach. The average evaluation metrics on mean were calculated for each concept in order to make a comparison between them for each task.
Comparison of DL models in approach 1. Each model is repeated 5 times, corresponding to 5-fold validation. The average results are presented as the mean ± standard deviation across the five experiments, of the best hyper-parameter sets.
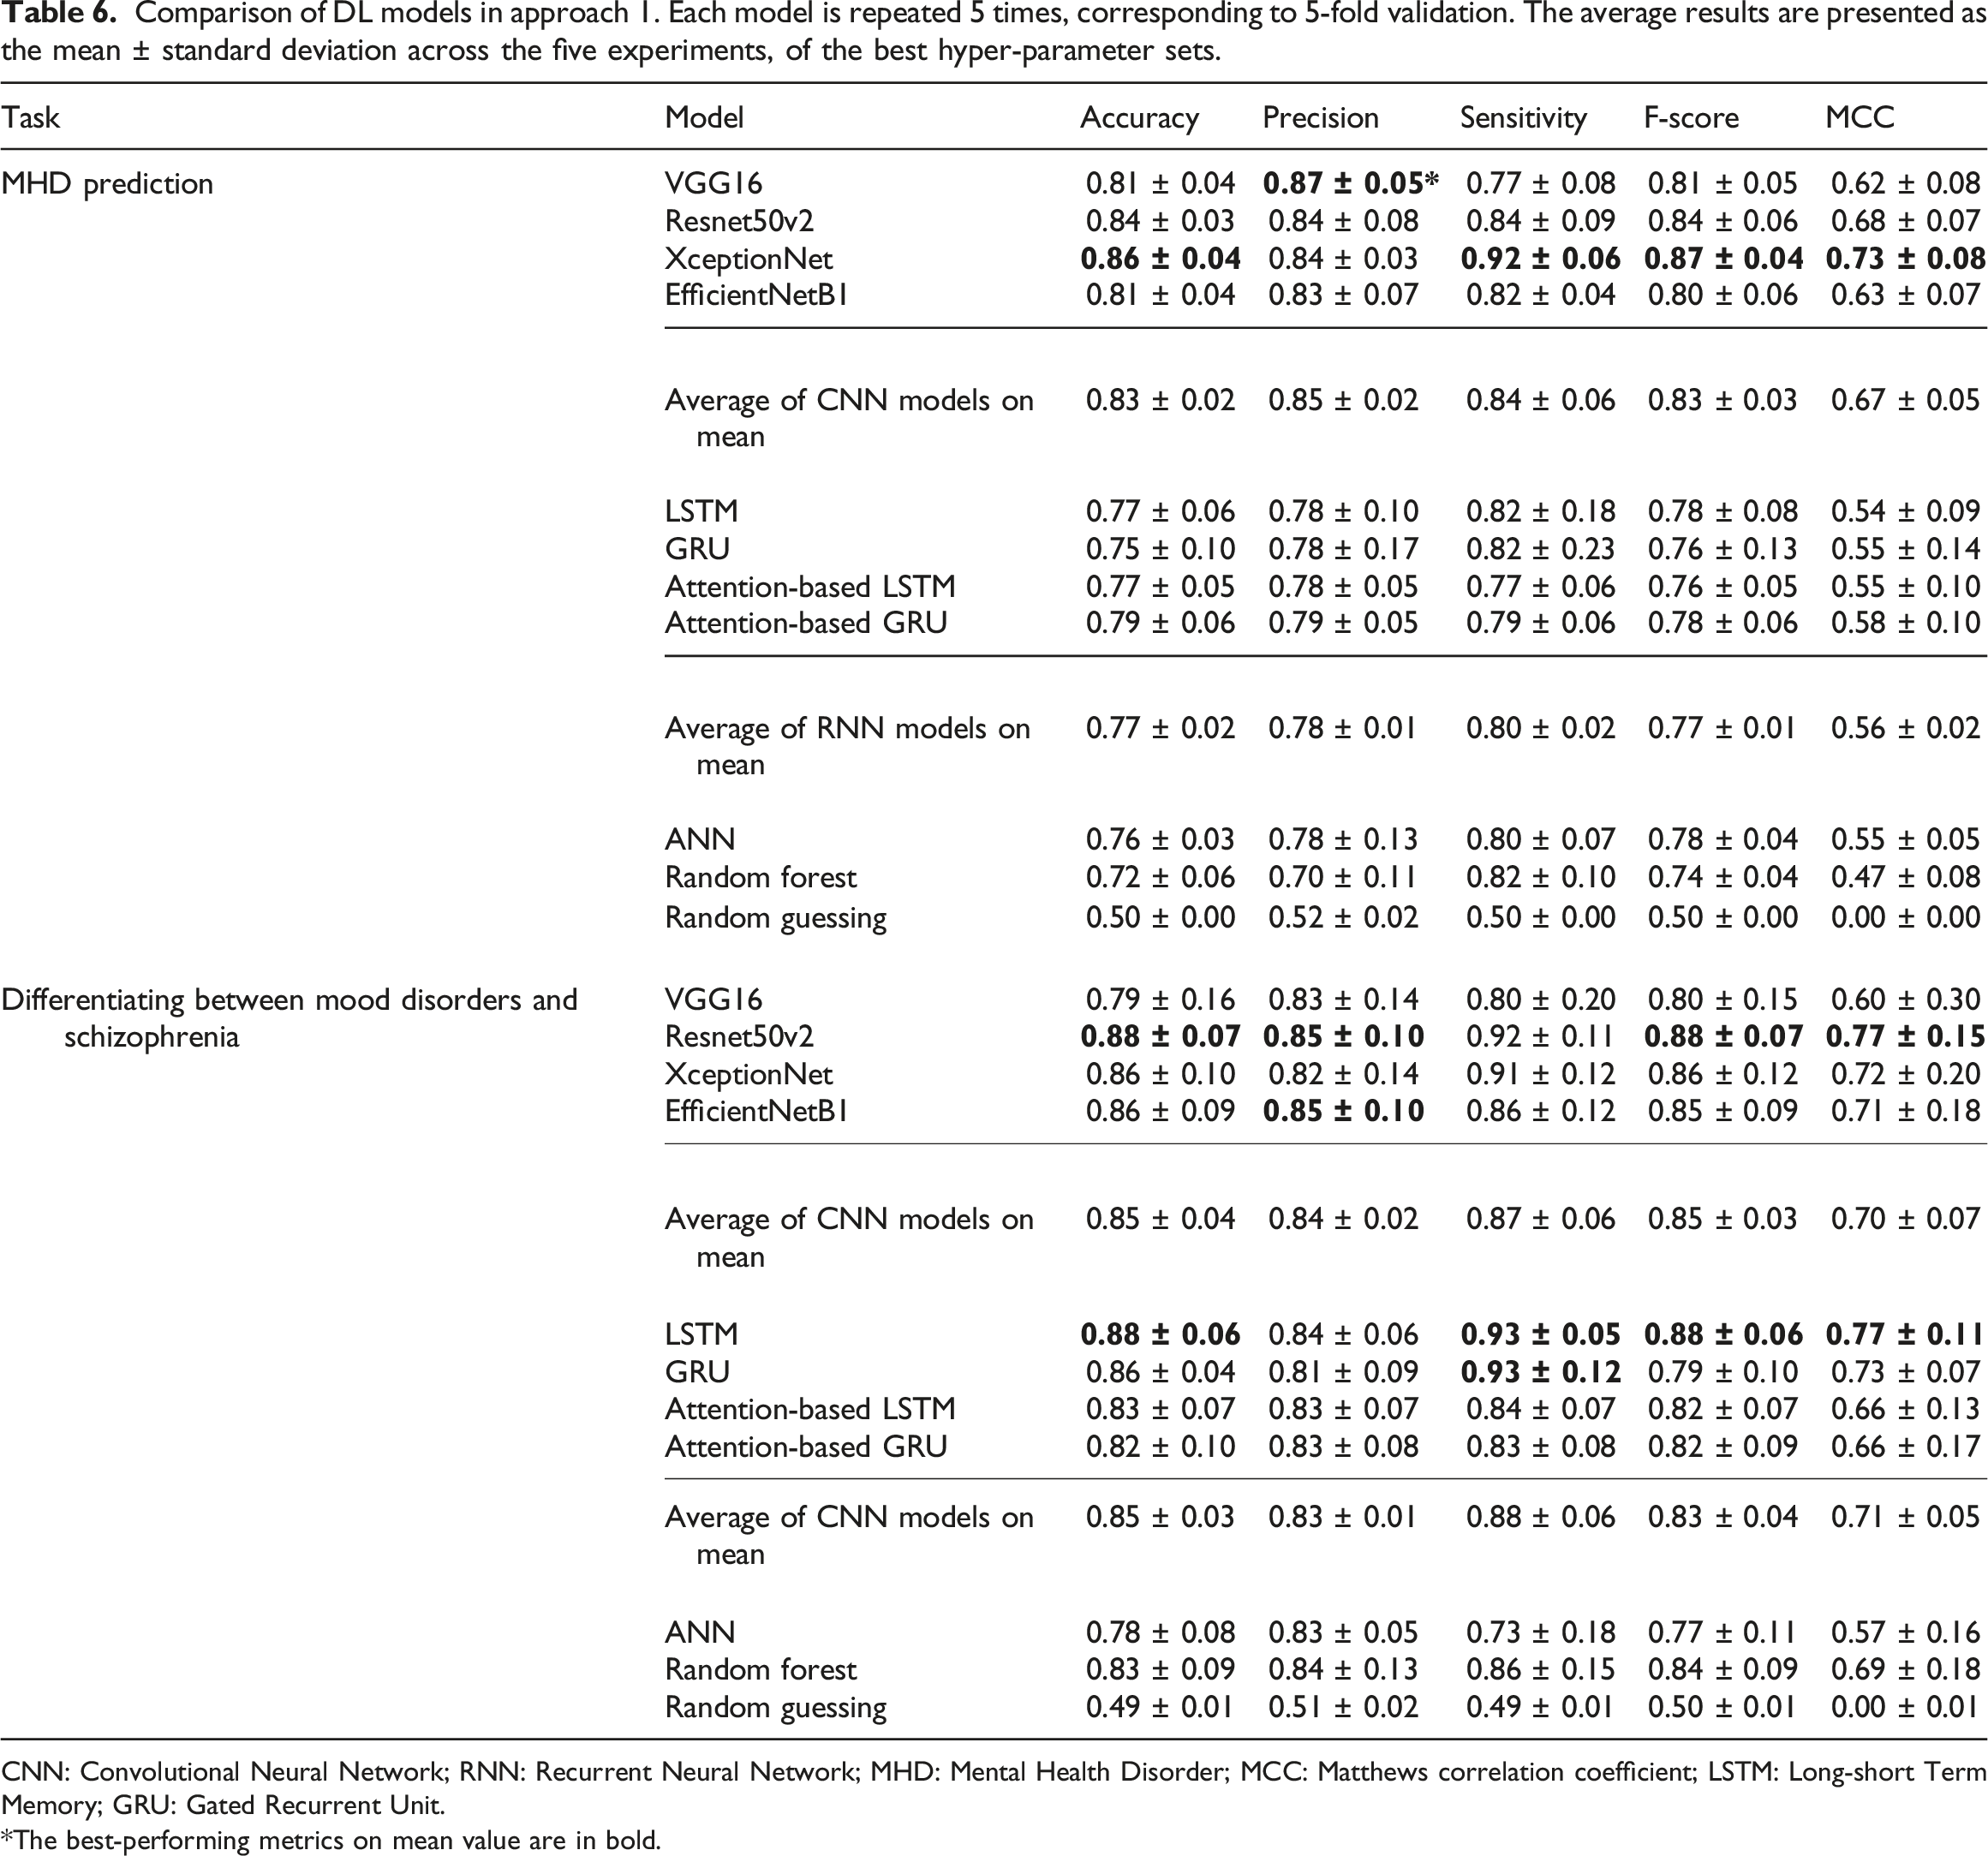
CNN: Convolutional Neural Network; RNN: Recurrent Neural Network; MHD: Mental Health Disorder; MCC: Matthews correlation coefficient; LSTM: Long-short Term Memory; GRU: Gated Recurrent Unit.
*The best-performing metrics on mean value are in bold.
Comparison of DL models in approach 2 using weight-added value. Each model is repeated 5 times, corresponding to 5-fold validation. The average results are presented as the mean ± standard deviation across the five experiments, of the best hyper-parameter sets.
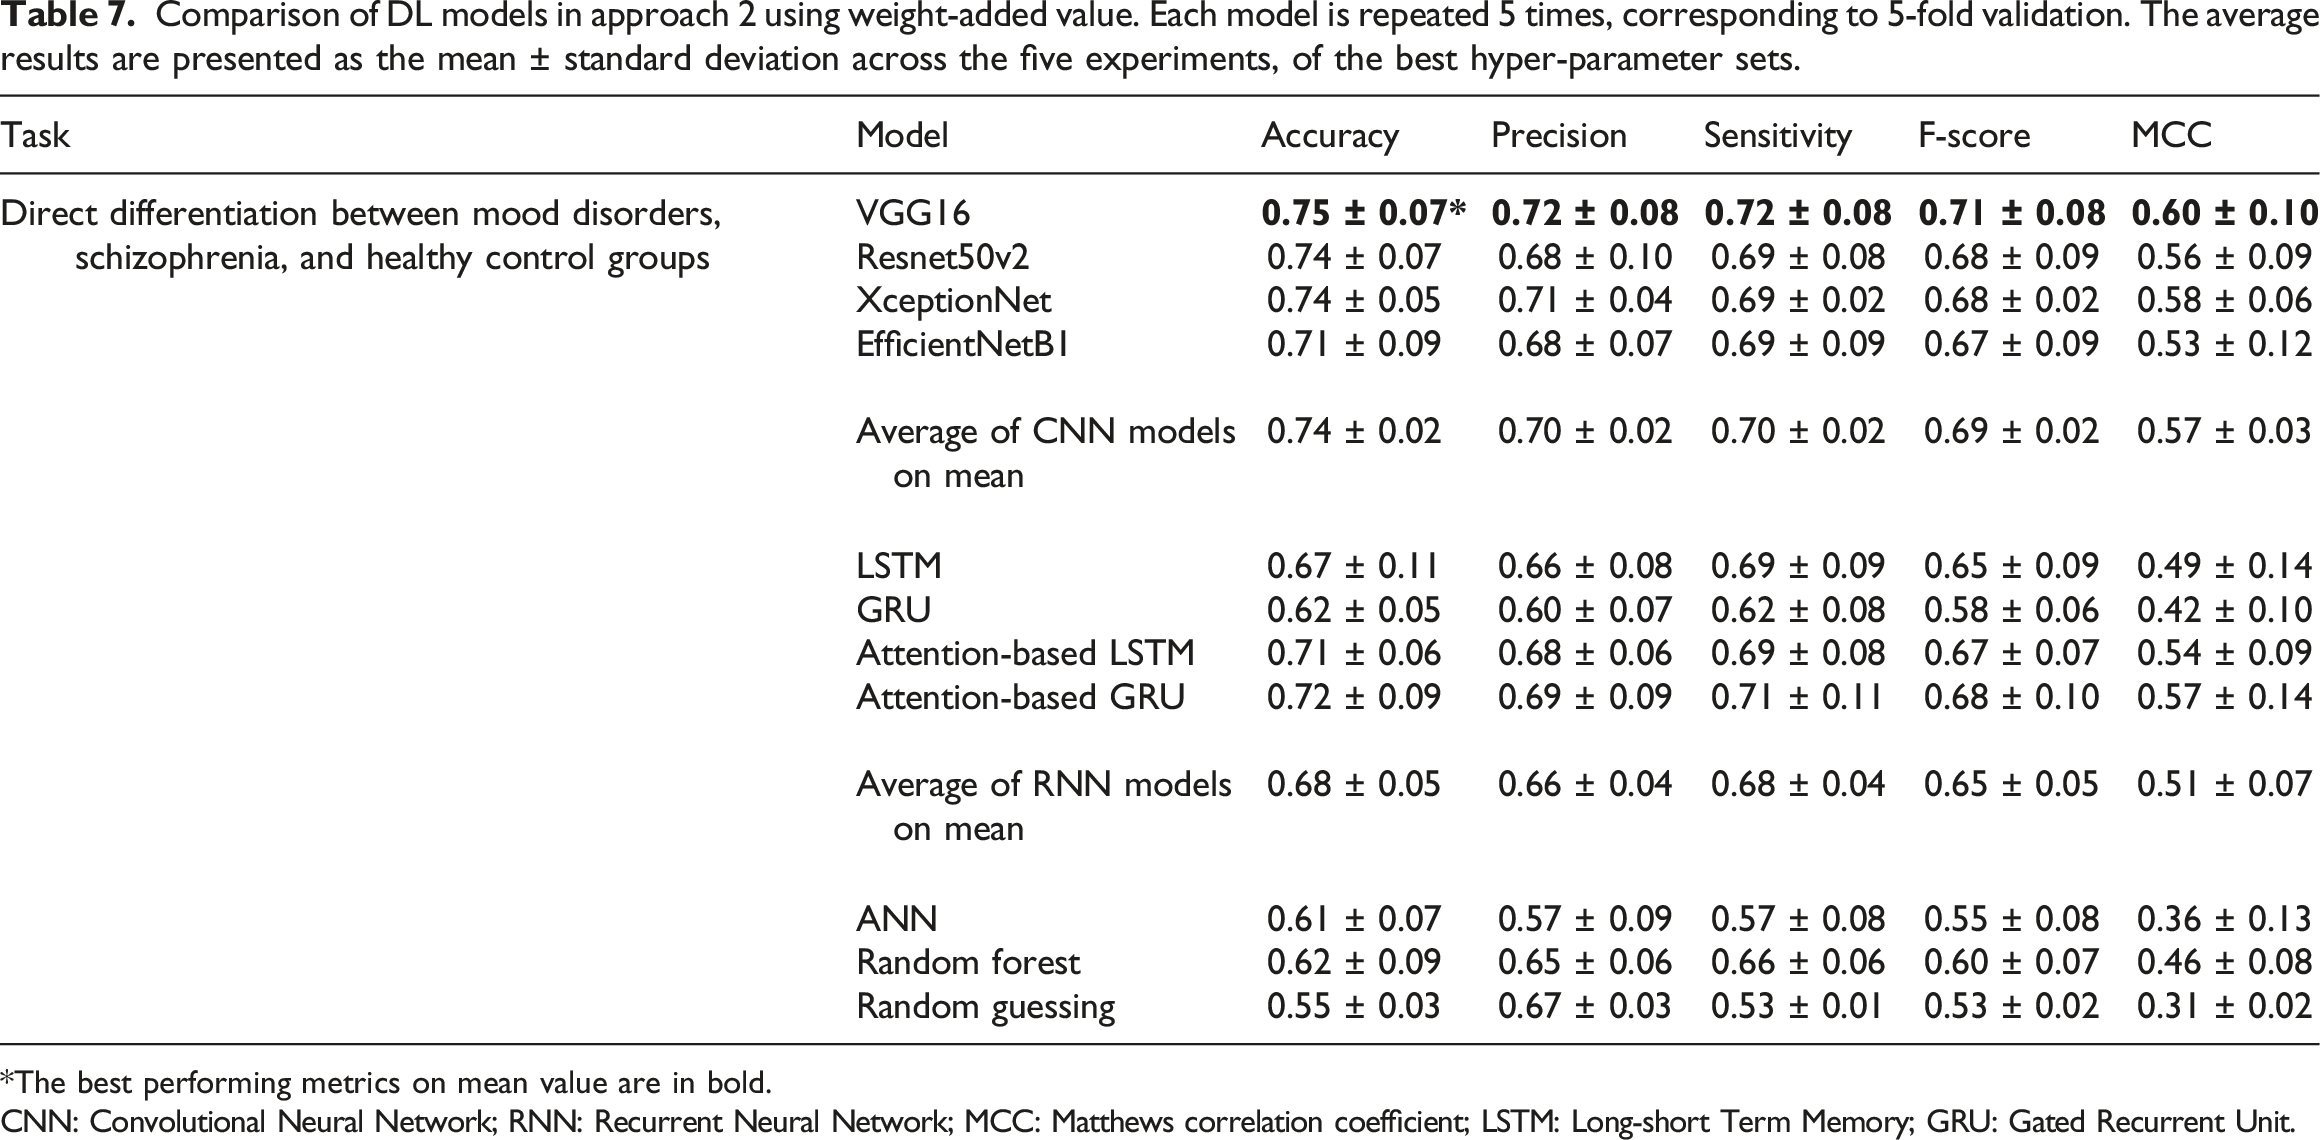
*The best performing metrics on mean value are in bold.
CNN: Convolutional Neural Network; RNN: Recurrent Neural Network; MCC: Matthews correlation coefficient; LSTM: Long-short Term Memory; GRU: Gated Recurrent Unit.
Overall, the models belonging to the CNN concept showed a better performance than the RNN-concept models under both approaches in corresponding tasks. In detail, in the first approach, XceptionNet dominated the others models in the MHD prediction task. Resnet50v2 and LSTM were in first place for the Differentiating between Mood disorders and Schizophrenia task. In the second approach, Resnet50v2 and XceptionNet showed good performances, staying in second place and closely following the best model - VGG16. VGG16 performed well in approach 2, dealing with the 3-class differentiation task. However, in both the MHD prediction and Differentiating between Mood disorders and Schizophrenia tasks in approach 1, VGG16 was overshadowed by other models. The Attention-based LSTM and Attention-based GRU models were the best-performing models based on the RNN concept, but nonetheless, they still could not surpass the CNN models.
Discussion and conclusion
In this study, we proposed a workflow and two approaches to apply DL with wearable device data to conduct a MHD prediction task, a Differentiating between Mood disorders and Schizophrenia task, and a Direct Differentiation between Mood disorders, Schizophrenia and Healthy control task. Overall, both proposed approaches using DL models were found to be suitable for the differentiation of MHDs in subjects sporting wearable devices. In approach 1, the first task was to detect patients among the participants, and the second differentiation task was to differentiate between two kinds of MHD among the patients. Both of these are binary-class classification tasks. According to the specific requirements, a physician could deploy these two tasks separately, or in sequence from MHD detection to Schizophrenia and Mood disorders differentiation. On the other hand, in approach 2, Healthy control, Schizophrenia, and Mood disorders differentiation were performed concurrently; hence, this is suitable for the classification of MHDs directly. In addition, these datasets were collected from different participants with distinct characteristics in terms of physical condition and habits. Furthermore, they contained missing data owing to subjective factors (e.g. the device needed to be charged, the participant removed their device when taking a shower or sleeping, etc.). Nevertheless, our proposed workflow and models still performed well. These datasets are time-series data, which basically work well for RNN-concept models; however, in this study, the CNN models showed a better performance than the RNN models in all approaches and their corresponding tasks. By treating the sequence data as images, our results showed that CNN-concept models work well not only on images, but also on sequence datasets.
In this study, bipolar disorder and unipolar disorder were combined into a single mood disorder category. However, these two disorders do have some differences, such as unipolar disorder being less episodic than bipolar disorder, and the treatment of unipolar disorder differs from that of bipolar disorder due to the risk of mania in the latter. Therefore, there is room for improvement in MHD differentiation using DL models to discriminate unipolar and bipolar disorders separately. There are several challenges in deploying wearable devices and using DL to analyze data in the healthcare setting. In particular, the collected data may experience noise and distortion due to the hairs on the skin and the constant body motion, leading to a decrease in adhesion between the wearable device and the skin. Furthermore, battery life is one of the major challenges that need to be considered in maintaining continual monitoring, as well as the general design of the wearable device. In addition, consideration of wearer data is important with regards to healthcare ethics, and the development of a platform for integration and data security is needed. On the other hand, DL has been demonstrated to perform well in diagnosis and prediction, as mentioned above. However, there is difficulty in tracing a prediction back to the importance of features, because DL is considered a black box. As a result, it becomes less preferable for use in healthcare, where the physician needs to clearly comprehend the hidden factors that cause a disease, and in situations where decisions become a matter of life and death. 65 Furthermore, DL techniques require a much greater hardware resource and a longer processing duration than other traditional ML techniques, in addition to more domain knowledge in order to fine-tune and deploy suitable models.
In fact, more kinds of data could be collected using these wearable devices, such as sleep quality, step count, heart rate, etc. Therefore, we still have room to improve the performance of DL models for MHD identification by including these kinds of data in the training and prediction steps. Furthermore, we conducted our experiment on a 7-days moving forward window; in other words, 7 days of gravitational acceleration signals were collected for each sample. We may change the number of this moving forward window to observe the differences in results and enhance the accuracy of prediction. On the other hand, to overcome the unintelligible DL ‘black box’, an explainable AI system could be deployed to encourage the use of DL in healthcare. 66 Furthermore, a federated learning system could be developed that is able to enhance privacy and enable the production of scalable smart healthcare networks and applications.
In conclusion, by analyzing data from wearable devices collected in 1 week using DL models, the experimental results showed that the proposed approaches provided a good performance. As a result, this may become an objective reliable resource that can assist physicians in making diagnostic decisions and ascertaining the best treatment plans for their patients, besides the usual diagnostic method of interview, questionnaire, follow-up, and examination. Applying DL to wearable device data is a prospective approach for MHD differentiation with high accuracy.
Supplemental Material
Supplemental Material - Decision support system for the differentiation of schizophrenia and mood disorders using multiple deep learning models on wearable devices data
Supplemental Material for Decision support system for the differentiation of schizophrenia and mood disorders using multiple deep learning models on wearable devices data by Duc-Khanh Nguyen, Chien-Lung Chan, Ai-Hsien A Li, Dinh-Van Phan and Chung-Hsien Lan in Health Informatics Journal
Footnotes
Declaration of conflicting interests
The author(s) declared no potential conflicts of interest with respect to the research, authorship, and/or publication of this article.
Funding
The author(s) disclosed receipt of the following financial support for the research, authorship, and/or publication of this article: This work was supported by the Ministry of Science and Technology, Taiwan (MOST 111-2221-E-155-024).
Supplemental Material
Supplemental material for this article is available online.
References
Supplementary Material
Please find the following supplemental material available below.
For Open Access articles published under a Creative Commons License, all supplemental material carries the same license as the article it is associated with.
For non-Open Access articles published, all supplemental material carries a non-exclusive license, and permission requests for re-use of supplemental material or any part of supplemental material shall be sent directly to the copyright owner as specified in the copyright notice associated with the article.