
Abstract
Background
Consumer wearable devices such as wristbands and smartwatches have potential application value in communicable disease surveillance.
Objective
We investigated the ability of wearable devices to monitor COVID-19 patients of varying severity.
Methods
COVID-19 patients with mobile phones supporting wearable device applications were selected from Dalian Sixth People Hospital. Physiological parameters from the wearable devices and electronic questionnaires were collected from the device wearing until 14 days post-discharge. Clinical information during hospitalization was also recorded. Based on imaging data, the patients were categorized into the milder group without pneumonia and the more severe group with pneumonia. We plotted the curves of the physiological parameters of the two groups to compare the differences and changes.
Results
Ninety-eight patients were included in the analysis. The mean age was 39.6 ± 10.5 years, including 45 males (45.9%). There were 24 asymptomatic patients, 10 mild patients, 60 moderate patients, and 4 severe patients. Compared with the milder group, the more severe group had higher heart rate-related parameters, while the heart rate variability (HRV) was the opposite. In the more severe group, the heart rate-related parameters showed a downward trend from 0 to 7 days after the fever resolution. Among them, the resting heart rate and sleep heart rate decreased on the 25th day after the onset and were close to the milder group 1 week after discharge.
Conclusions
Consumer wearable devices have the potential to monitor respiratory infections. Heart rate-related parameters obtained from these devices can be sensitive indicators of COVID-19 severity and correlate with disease evolution.
Trial registration
ClinicalTrials.gov NCT04459637.
Introduction
COVID-19 has rapidly swept the world due to its extremely high transmissibility and general susceptibility. This pandemic has had a profound impact on the global economy and social interactions and has placed an immense burden on the healthcare system. 1 To date, the cumulative number of reported cases has exceeded 700 million, with more than 6 million deaths. 2 In this tough period, patient prioritization, vigilant disease surveillance, and timely improvement of patient care will prove invaluable in reducing mortality and preventing the overwhelming depletion of medical resources.
Although direct observation in the field can provide reliable care for patients, limited medical staff numbers will be a major challenge. In addition, exposure to COVID-19 patients may place healthcare workers (HCWs) at high risk of cross-infection. 3
Most COVID-19 cases are mild 4 or asymptomatic and self-limited. Only a few cases progress to severe hypoxia, respiratory failure, or death, which warrant considerable attention and require proactive intervention. Previous practice in some countries has been to quarantine close contacts and asymptomatic or mild cases affected individuals at home, with hospital transfer only if the condition deteriorates. Given that the majority of patients are unable to detect early disease progression and HCWs can’t provide continuous surveillance for all individuals, this leads to an underestimation of disease severity, delayed intervention, and increased mortality. It is therefore imperative to identify practical and effective approaches to address this problem.
As technology advances, consumer wearable devices are becoming more cost-effective and versatile, allowing continuous monitoring of heart rate, sleep, physical activity, pulse oxygen saturation (SpO2), etc. These parameters have the potential to address the need for continuous and remote monitoring of COVID-19. Previous studies have used them to predict the onset and track the evolution of this disease at the individual level5–8 or to assess the strength of the epidemic. 9 However, there is currently a lack of prospective studies investigating the monitoring of COVID-19 evolution and the triage of different severities.
In this study, we applied smartwatches and wristbands for ongoing surveillance of COVID-19 patients during hospitalization and quarantine periods to explore their ability to assess the severity and evolution of COVID-19.
Methods
Subjects
Patients with COVID-19 hospitalized in Dalian Sixth People Hospital from July 2020 to September 2020 were screened. Eligible participants were from 18 to 75 years old and met the diagnostic criteria for COVID-19 according to the Chinese guideline. 10 They had mobile phones and could operate them on their own. Patients with severe comorbidities who couldn’t take care of themselves or cooperate were excluded. Detailed inclusion and exclusion criteria are provided in the Supplementary Appendix 1 (Table S1). All subjects signed electronic informed consent forms. The study protocol was approved by the Ethics Committee of Peking University First Hospital and was registered at www.ClinicalTrails.gov (NCT04459637).
Protocol
Firstly, patients scanned the QR code to obtain and sign the electronic informed consent form and then installed the APP of devices. After enrollment, they received smartwatches (AMAZFIT, Huami, China) or wristbands (Glory Bracelet 5, Huawei, China) along with usage instructions. They were required to wear the devices and fill out the electronic symptom questionnaires every day until 14 days after discharge. Physiological data, including heart rate, sleep, SpO2, and activity, were collected.
All clinical information during hospitalization was documented, including demographics, hospital stay, symptoms, time of symptom onset, physical and laboratory examinations, radiographic information, disease severity, treatment, and outcome. The compliance of patients was assessed according to available data and questionnaires. To assess the differences and changes between the two groups, physiological parameter-time curves were drawn based on the onset, fever cessation, or discharge day as day 0, respectively.
Wearable device monitoring system
The system consists of three main parts: wearable devices (commercially available Huami smartwatches or Huawei wristbands, which connect to smartphones via Bluetooth), APPs, and cloud platforms. Patients were required to manually upload data to the platform by opening APPs at least once each day.
Huami smartwatches and Huawei wristbands used two independent APPs and platforms developed by each company. The Huami smartwatch monitoring system is composed of the Huami smartwatch, the Amazfit APP, and the Amazfit health management platform. Through continuous 24-h pulse wave monitoring, we can get heart rate metrics such as resting heart rate (RHR), average heart rate, sleep heart rate, and awake heart rate. Monitoring activity throughout the day can provide the step count and effective activity energy expenditure. Overnight sleep monitoring can acquire parameters including total sleep time, deep sleep time, and light sleep time.
The Huawei wristband monitoring system includes the Huawei wristband, the Peking University First Hospital Epidemic Monitoring App, which was specially developed by the manufacturer for COVID-19 monitoring, and the HUAWEI Research platform. Data on users’ sleep, activity, and heart rate could be collected. Not quite the same as Huami, Huawei wristbands provide real-time and continuous monitoring of SpO2.
The validity of the devices used in the study or those of the same manufacturer to measure physiological parameters has been demonstrated in previous studies,11–15 with the exception of SpO2. Authorized HCWs could view all the information on both platforms.
Definition
COVID-19 was classified into five categories: asymptomatic, mild, moderate, severe, and critical disease according to the Chinese guideline. 10 Patients who have a positive nucleic acid test, but no clinical symptoms are considered to be asymptomatic. The mild patient has minor clinical symptoms but no evidence of pneumonia on imaging. The moderate patient has fever, respiratory symptoms, and radiographic manifestations of pneumonia. Symptoms or signs such as shortness of breath or decreased pulse oxygen saturation are considered severe. All of the patients were split into two groups, the milder group consisting of asymptomatic and mild patients, and the more severe group consisting of moderate to critical patients, due to the unequal distribution across the five categories and the lack of critically ill patients in our study.
The day of symptom onset in patients with mild, moderate, and severe disease and the day of positive nucleic acid testing in asymptomatic patients were defined as day 0 after the disease started. The 0th day after the fever cessation referred to the date of fever stop in mild, moderate, and severe patients and the date of admission in asymptomatic patients. The discharge date was defined as the 0th day after discharge, and the 14th day after discharge was the end of quarantine.
Patient compliance was evaluated using the accessible physiological data and questionnaires. The ratio of days with accessible data throughout the wearing period to the total wearing days was used to define the rates of analyzable data, which evaluated wearing compliance. The electronic questionnaire completion rate was the ratio of the actual days that the electronic survey was actually completed to the total wearing days. The period from the day the patient began wearing the device to the 14th day after discharge was referred to as the total number of wearing days.
The specific definition of each physiological parameter is shown in Table 1.
The specific meaning of each parameter from wearable devices.

Data sources and data processing of wearable devices
Wearable device companies retrieved physiological data from their large database by mobile phone number or ID number when patients registered for APPs. The data was exported to Excel. The registration information came from the electronic questionnaire that patients completed at enrollment.
The researchers excluded abnormal data, such as heart rates greater than 120 beats per minute (bpm) and less than 30 bpm, and total sleep time greater than 600 min and less than 240 min due to technical problems, or factors like not wearing a wristband or smartwatch, high activity affecting monitoring, charging, or upload failure. Some data of total sleep times were manually corrected based on the actual time to fall asleep and wake up judged by the smartwatch.
When plotting, the limited amount of data on both sides had an effect on data fitting and led to significant fluctuations. This made trend observation difficult and susceptible to bias. To decrease bias, data in each group underwent processing, whereby the data corresponding to the dates with a daily data volume of less than three cases on both sides were excluded.
Statistical analysis
Continuous variables that conform to the normal distribution are expressed as the mean ± standard deviation, and the independent sample t-test is used for comparison between the two groups. Continuous variables not conforming to the normal distribution are expressed as quartiles, and the Mann–Whitney U test is used for the comparison between the two groups. Statistical analysis was performed using PASW Statistics 23 software. Graphs were generated using GraphPad Prism 9.0 software.
Results
Characteristic
A total of 103 people were enrolled in the study. Out of these, 71 patients used smartwatches, with one patient refusing to sign the informed consent form. The other 32 patients used Huawei wristbands, and two of them had no data due to an absent ID, while two had blank data since there was no upload. Finally, 98 patients were included in the analysis. The mean age was 39.6 ± 10.5 years, including 45 males (45.9%) (Table 2). There were 24 asymptomatic patients, 10 mild patients, 60 moderate patients, and 4 severe patients. The observation period was from 2 August 2020 to 12 September 2020. The median time from the onset of symptoms to wearing wearable devices was 11 days, and the median time from admission to wearing the devices was 10 days. The average length of hospital stay for symptomatic patients was 20.1 ± 6.4 days and the average length of hospital stay plus quarantine was 34.1 ± 6.4 days. The length of hospital stay for all patients was 18.5(14.0,23.3) [median(Q1, Q3)] days and the length of hospital stay plus quarantine was 32.5(28.0,37.3) [median(Q1, Q3)] days. The mean values of physiological parameters of the two groups during hospitalization and quarantine periods are shown in Supplemental material, Table S2 and Table 3.
Clinical characteristics of the study patients, according to disease severity.

a Milder Group included 24 (24.5%) asymptomatic patients and 10(10.2%) mild patients according to Chinese Diagnosis and Treatment Protocol for Novel Coronavirus Pneumonia (Trial Version 6).
b More Severe Group included 60(61.2%) moderate patients and 4(4.1%) severe patients.
Physiological parameters of two groups of patients during quarantine period.

a RHR: Resting heart rate.
b HRV: Heart rate variability.
Sleep data and average heart rate data were obtained from 28 patients wearing Huawei wristbands and 70 patients wearing Huami smartwatches. The data of RHR, sleep heart rate, awake heart rate, and heart rate variability (HRV) were collected from 70 patients wearing Huami smartwatches. SpO2 data was from Huawei wristbands.
Compliance
The rates of analyzable activity-related parameters, heart rate-related parameters, HRV, sleep-related parameters, and SpO2 collected by wearable devices were 68.1%, 62.6%, 43.7%, 56.2%, and 61.0%, respectively. The completion rate of the electronic questionnaire was 47.5%.
Physiological parameters after the onset of disease
Taking the onset day as day 0, average heart rate, RHR, awake heart rate, and sleep heart rate of the more severe group were higher than those of the less severe group (Figure 1(a)–(c)). RHR and sleep heart rate in the more severe group showed a decreasing trend on day 25 after disease onset, as determined by using the local weighted regression method for data fitting (Figure 1(e) and (f)). After disease onset, HRV was greater in the milder group than in the more severe group (Figure 1(d)).

Curves (a–d) and scatter plot (e–f) of heart rate-related parameters after the onset of disease in two groups. The 0 point on the abscissa is the date of onset. Data are presented as mean ± standard error. The local weighted regression was used to fit the data.
In the more severe group, steps and effective activity energy expenditure were greater than in the milder group (Figure 2). Steps in the more severe group showed a significant upward trend on day 14 after disease onset (Supplemental material, Figure S1(a)). The more severe group exhibited significantly greater deep sleep time and proportion of deep sleep, while the proportion of light sleep was reversed (Figure 3). However, there were no substantial differences in total sleep time and light sleep time between the two groups.

Curves of activity-related parameters after the onset of disease in two groups. The 0 point on the abscissa is the date of onset. Data are presented as mean ± standard error.
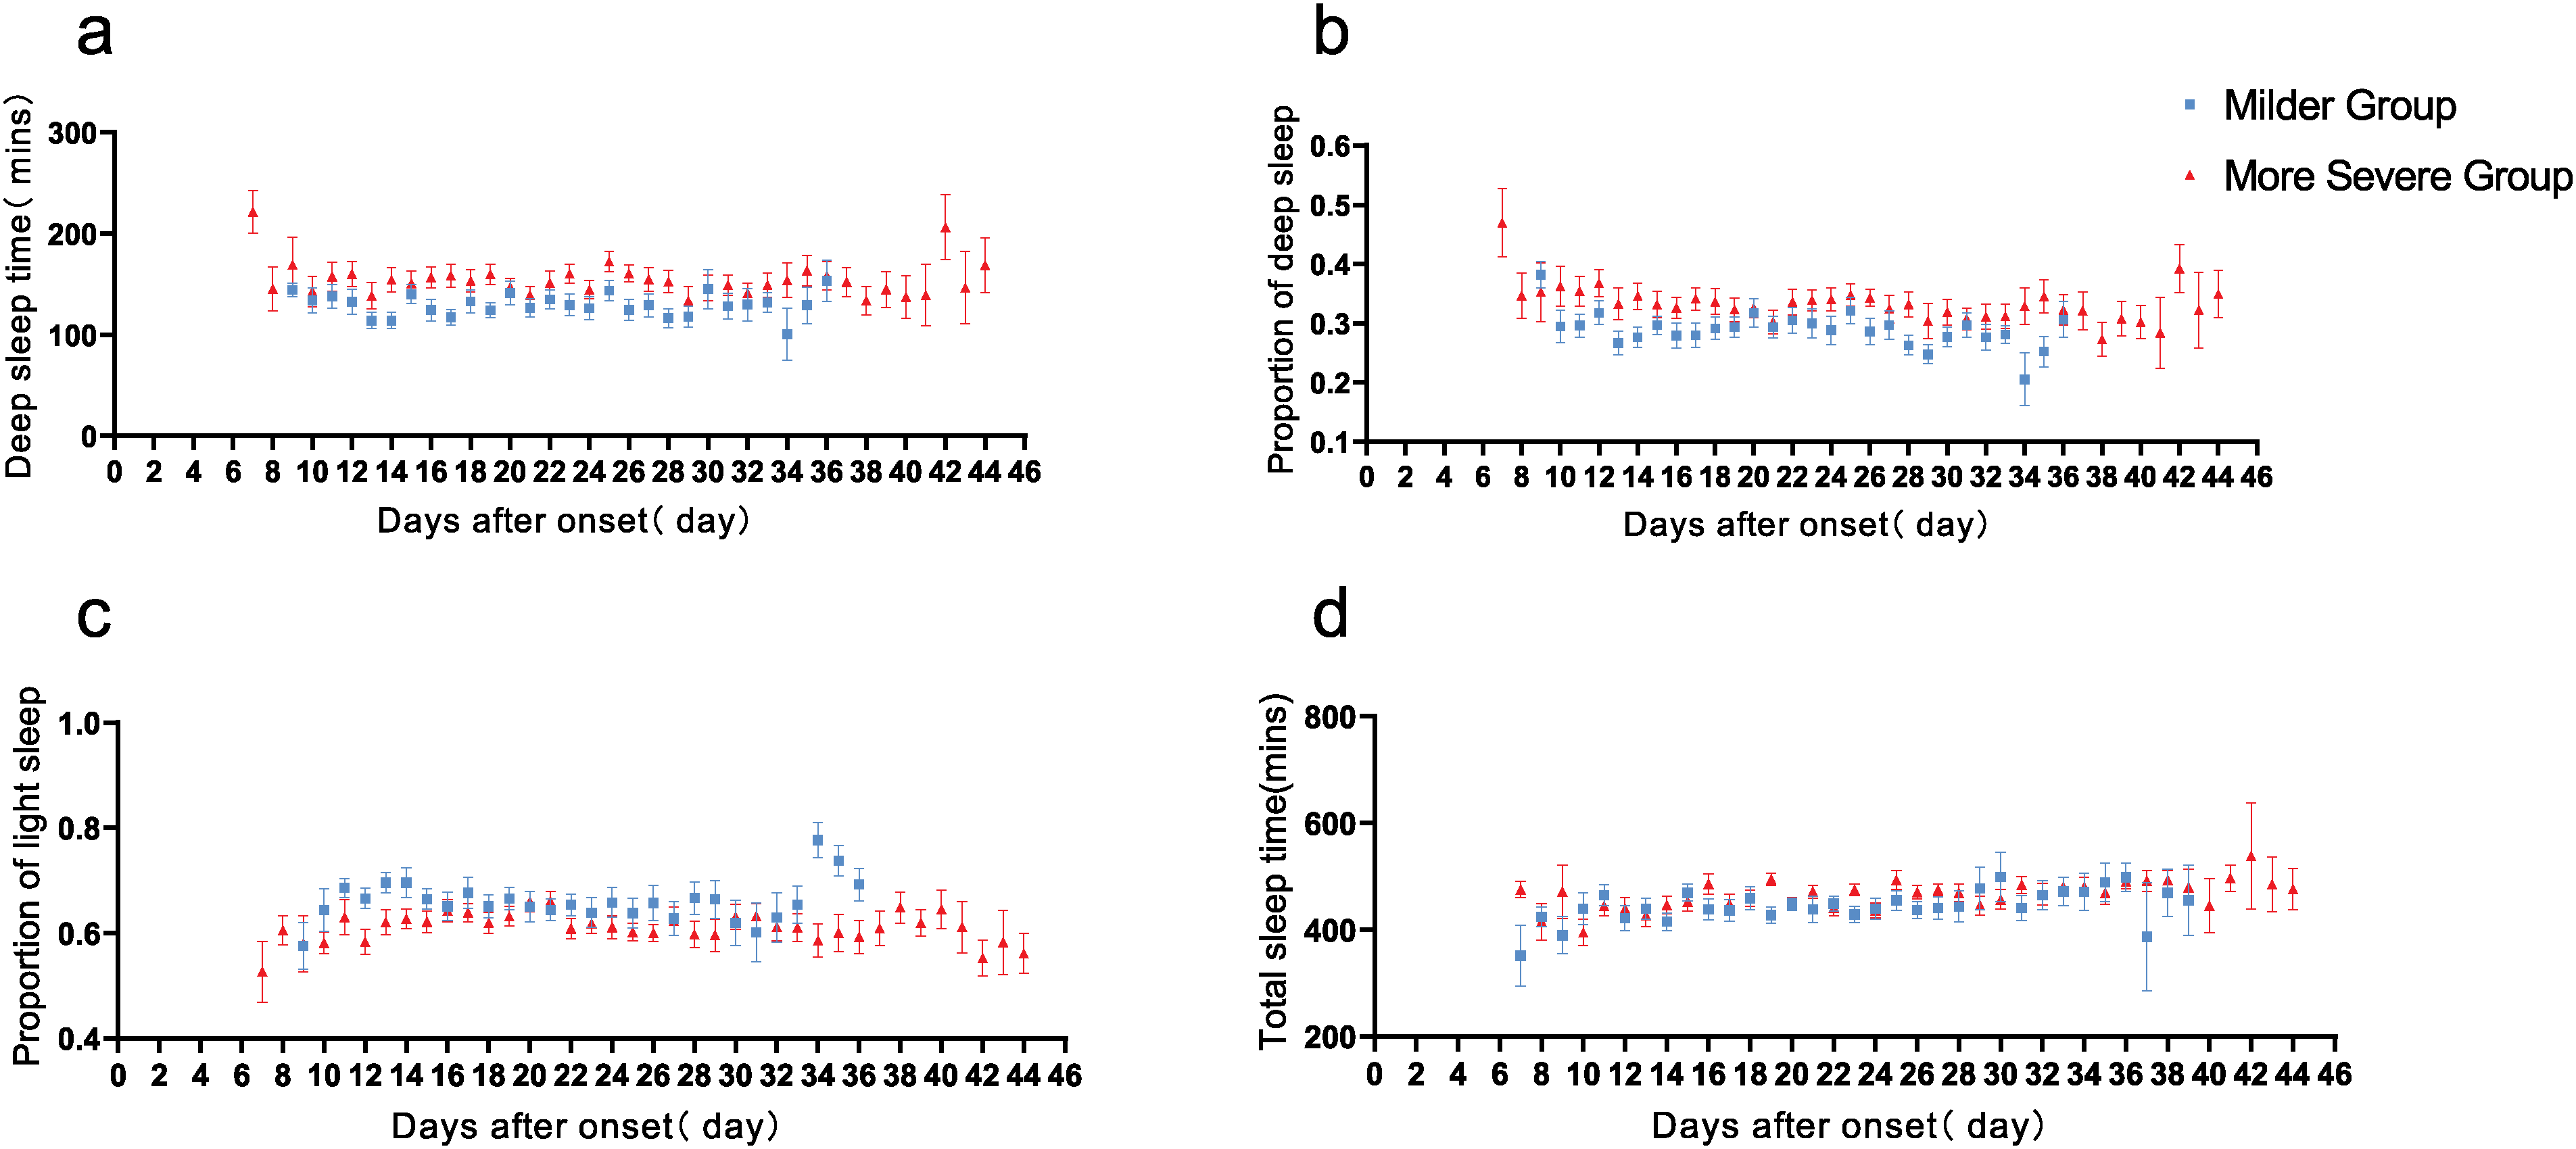
Curves of sleep-related parameters after the onset of disease in two groups. The 0 point on the abscissa is the date of onset. Data are presented as mean ± standard error.
Physiological parameters after the fever cessation
Taking the day of fever relief as day 0, average heart rate, awake heart rate, sleep heart rate, and RHR showed significant fluctuations in the more severe group, whereas the curves of heart rate-related parameters in the milder disease group were rather flat (Figure 4(a)–(d)). These parameters showed a downward trend about 0–7 days after fever cessation and were close to those of the milder group, then they gradually increased and were higher than those of the milder group (Figure 4(e)–(h)). Overall, during hospitalization, heart rate-related parameters except HRV were higher in the more severe group compared to the milder group (Supplemental material, Table S2).

Curves(a–d) and scatter plot (e–h) of heart rate-related parameters after the fever cessation in two groups. The 0 point on the abscissa is the date of fever cessation. Data are presented as mean ± standard error. The local weighted regression was used to fit the data.
Patients in the more severe group had more steps and effective activity energy expenditure during hospitalization (Supplemental material, Figure S1(c) and (d)). Steps in the more severe group increased over time until they gradually declined on day 19 after the fever stopped (Supplemental material, Figure S1(b)). The differences in sleep-related parameters after the fever cessation were similar to those after the disease onset (Supplemental material, Figure S2).
Physiological parameters after discharge
During the 14-day post-discharge quarantine period, average heart rate and awake heart rate were still higher in the more severe group than in the milder one (Supplemental material, FigureS3(a), Table 3). Sleep heart rate and RHR of the more severe group decreased and were close to those of the milder group approximately 1 week after discharge (Supplemental material, Figures S3(b), (c), (e), (f)). HRV was still higher in the milder group in this period (see Supplemental material, Figure S3(d), Table 3).
Steps and effective activity energy expenditure during the quarantine period were still greater in the more severe group than in the milder group (see Supplemental material, Figure S4). Sleep-related measures in both groups were comparable to those after the termination of fever (Supplemental material, Figure S5).
Discussion
Principal results
This study showed that consumer wearable devices can be used to monitor the severity and evolution of COVID-19, heart rate-related parameters have the potential to serve as indicators of COVID-19 severity and correlate with disease progression and recovery. The implications of this finding are significant for the effective management of respiratory infectious diseases during the pandemic. The use of these devices enables remote monitoring, protecting HCWs from direct exposure to COVID-19 patients. Furthermore, such findings may help stratify patients based on severity, thereby facilitating tailored care.
The use of these devices for early disease prediction and monitoring of disease progression appears justified. It is well known elevated RHR is associated with the inflammatory response of the immune system caused by infection. Previous studies have shown that RHR may be a more sensitive marker for early diagnosis of COVID-19, as patients admitted to medical facilities were more likely to have an abnormal heart rate (>100 bpm) (43.1%) than fever (30.7%). 16 Several studies have established models for predicting SARS-CoV-2 infection or monitoring symptoms using one or more physiological parameters from consumer wearable devices.5,6,8,17–21 Mishra et al. found abnormal increases in RHR before the onset or disease diagnosis. 6 Allison Shapiro et al. also found physiological data from consumer wearable devices showed an increase in RHR around the onset of symptoms. 19 Natarajan et al. showed that patients’ heart rates increased abnormally around the time of onset, began to decrease 1 week after onset, and returned to baseline around the 21st day after onset. 5 In their later study of long COVID, 22 they observed that RHR (the average heart rate during sleep) undergoes three distinct phases: (a) a rise during the onset of symptoms with an average peak increase relative to baseline, (b) a subsequent decline, reaching a minimum approximately 13 days after symptom onset, and (c) a subsequent increase, culminating in a second peak around 28 days after symptom onset, returning to baseline levels on average about 112 days after symptom onset. Similar changes were seen in the study by Radin et al. 23 In our study, we observed a significant decrease in RHR and sleep heart rate in the more severe group at day 25 after onset, similar to the third stage of RHR change found by Natarajan et al. Probably because our sample size was small and our observation period was not long enough, the pattern of RHR changes found by Natarajan et al. was not fully represented in our study.
In addition, heart rate is closely related to temperature and was found to increase by 8.5 bpm for every 1°C increase in body temperature. 24 It can be concluded that when the body temperature is normal, the heart rate will also drop. This change was also monitored by wearable devices in our study, the average heart rate, RHR, awake heart rate, and sleep heart rate were associated with disease change and show a downward trend as fever stops. In our study, there was a higher proportion of fever in patients with more severe disease, both on admission and in hospital, and therefore a correspondingly higher heart rate in the more severe group.
Interestingly, approximately 1 week after the resolution of the fever, heart rate-related parameters in the more severe group decreased to the lowest level, comparable to that of the milder group, before gradually increasing. The later increase in heart rate may be due to increased activity levels in the more severe patients, possibly as a result of increased daily walking during recovery. 25 Additionally, the average heart rate and awake heart rate increased abnormally on day 0 (discharge day) and day 14 (end of quarantine day), while the sleep heart rate and RHR remained unchanged. This phenomenon seems to be related to the patient's transfer into and out of the hospital on those 2 days. Thus, RHR and sleep heart rate may be more reliable for disease monitoring.
As for HRV, our findings suggest its usefulness in assessing disease severity. HRV may reflect autonomic nervous system function and is associated with inflammation.26–32 A meta-analysis of 2238 patients from 51 studies showed a negative correlation between HRV and inflammatory response. 33 Consistent with these findings, our study showed COVID-19 patients with more severe symptoms had lower HRV levels. It indicated that HRV monitored by smartwatches may help differentiate COVID-19 patients of varying severity. Previous studies found that decreases in HRV as measured by smartwatches have been linked to the onset and worsening of COVID-19.7,34 Natarajan et.al found RMSSD exhibits a similar three-stage temporal evolution as RHR, except that the phase is reversed, that is, when RHR increases, RMSSD decreases and vice versa. 22 However, contrary to previous research, we found no dynamic changes in HRV with the progression and exacerbation of the disease. This may be due to the less severe patients and shorter observation periods in this outbreak.
In addition, our results suggest that step monitoring may be more useful for activity monitoring and rehabilitation guidance, 35 rather than disease monitoring, due to the variety of external factors that influence step count. Within our study, it was observed that more severe patients had higher step counts than those with milder conditions, and their steps showed a notable upward trend during hospitalization. Subsequent telephone follow-up with these patients revealed their engagement in daily walking exercises within the ward. This phenomenon is likely due to the increased attention and encouragement provided by HCWs, resulting in a greater emphasis on rehabilitation efforts. The low values in the steps of the two groups may be due to the fact that these subjects were in the quarantine hospital and their activities were somewhat restricted. However, in our study, the sleep pattern is contrary to previous studies which have shown that sleep quality in COVID-19 patients is negatively correlated with severity. 36 The explanation may be that more severe patients engage in more activities, which may improve sleep quality through exercise.37,38 In addition, previous studies have shown that consumer wearable devices may overestimate the user's deep sleep time, and our devices may also have such a problem, resulting in a high proportion of deep sleep in all patients.14,39,40
Limitations
Our study has some limitations, the first being the inability to compare physiological data before and after the onset. The main reason for this is the sudden outbreak which made device delivery challenging. The second is unsatisfactory compliance with the wearable devices, which is similar to previous studies in which the data collection rate varied from 47.5% to 72.3%.41,42 The third is that patients over the age of 75 were excluded due to concerns about their ability to operate the mobile application. Finally, despite the importance of SpO2 for COVID-19 indicator, 43 because of the limited number of patients who measured SpO2 and the lack of published study of measuring validity, its correlation analysis with disease severity was not performed.
Conclusions
In conclusion, this study demonstrated that consumer wearable devices can be used to monitor COVID-19 patients of varying severity and suggests the potential of wearable devices for disease self-monitoring in the general population during a future respiratory pandemic. RHR and sleep heart rate obtained from these devices may be sensitive indicators of COVID-19 severity and correlate with disease evolution. HRV may be more sensitive to differentiate the severity of COVID-19. Sleep structure was also correlated with the severity of the disease. In addition, physical activity was related to the severity of the disease but influenced by other factors, so it is more suitable for activity monitoring and rehabilitation guidance.
Supplemental Material
sj-docx-1-dhj-10.1177_20552076241247374 - Supplemental material for COVID-19 surveillance based on consumer wearable devices
Supplemental material, sj-docx-1-dhj-10.1177_20552076241247374 for COVID-19 surveillance based on consumer wearable devices by Chunbo Zhang, Aijun Sun, Jiping Liao, Cheng Zhang, Kunyao Yu, Xiaoyu Ma and Guangfa Wang in DIGITAL HEALTH
Supplemental Material
sj-docx-2-dhj-10.1177_20552076241247374 - Supplemental material for COVID-19 surveillance based on consumer wearable devices
Supplemental material, sj-docx-2-dhj-10.1177_20552076241247374 for COVID-19 surveillance based on consumer wearable devices by Chunbo Zhang, Aijun Sun, Jiping Liao, Cheng Zhang, Kunyao Yu, Xiaoyu Ma and Guangfa Wang in DIGITAL HEALTH
Footnotes
Acknowledgements
We would like to thank Mrs. Rui Su and Mrs. Lian Wu for their technical supporting in this research.
Contributorship
JL and GW conceived and designed the study. CBZ and JL were involved in protocol development and gaining ethical approval. AS, CZ, KY, and XM contributed to patient recruitment and the data collection. CBZ, JL, CZ, and XM performed statistical analyses. CBZ and KY were responsible for drawing the figures. CBZ, AS, and JL wrote the manuscript. CBZ, AS, JL, CZ, KY, XM, and GW contributed to the discussion of the findings and revised the manuscript accordingly. All authors approved the final version of the manuscript.
Declaration of conflicting interests
Huami company and Huawei company provided the wearable devices used in this study.
Ethical approval
The ethics committee of Peking University First Hospital approved this study (REC number: 2020-055).
Funding
This study was supported by the Beijing Natural Science Foundation (M21028) and the Capital's Funds for Health Improvement and Research (CFH 2022-1G-4073).
Guarantor
GW
Supplemental material
Supplemental material for this article is available online.
References
Supplementary Material
Please find the following supplemental material available below.
For Open Access articles published under a Creative Commons License, all supplemental material carries the same license as the article it is associated with.
For non-Open Access articles published, all supplemental material carries a non-exclusive license, and permission requests for re-use of supplemental material or any part of supplemental material shall be sent directly to the copyright owner as specified in the copyright notice associated with the article.