
Abstract
Stratification modeling in health services is useful to identify differential patient risk groups, or latent classes. Given the frequency and costs, repeated emergency department (ED) may be an appropriate candidate for risk stratification modeling. We applied a method called group-based trajectory modeling (GBTM) to a sample of 37,416 patients who visited an urban, safety-net ED between 2006 and 2016. Patients had up to 10 ED visits during the study period. Data sources included the hospital’s electronic health record (EHR), the state-wide health information exchange system, and area-level social determinants of health factors. Results revealed three distinct trajectory groups. Trajectories with a higher risk of revisit were marked by more patients with behavioral diagnoses, injuries, alcohol & substance abuse, stroke, diabetes, and other factors. The application of advanced computational techniques, like GBTM, provides opportunities for health care organizations to better understand the underlying risks of their large patient populations. Identifying those patients who are likely to be members of high-risk trajectories allows healthcare organizations to stratify patients by level of risk and develop early targeted interventions.
Keywords
Introduction
The concept of risk, that patients possess the differing underlying severity of disease or different probabilities of negative outcomes, is fundamental to effective clinical care and population health management.1,2 Increasingly common is the application of advanced data mining models to predicting information about patient risk from within big healthcare data repositories. 3 Healthcare organizations have assimilated data mining to improve physician practices, disease management, resource exploitation 4 and prediction models exist for a host of outcomes ranging from specific disease development, to disease prognosis, to mortality, and health care costs.
One such application of risk data mining (specifically prediction modeling) is in the area of repeat emergency department 1 (ED) visits. Over utilization of ED services is a particular challenge for health systems worldwide and ED revisit are common 5 and can be utilized as performance or quality metric.6–8 Moreover, ED revisits might be avoidable if it was possible to detect individuals with higher risk of revisiting into the ED at their first visit. 9 Critically, ED revisits may be an appropriate candidate for risk prediction modeling as prior studies have identified different driving factors return visits, 10 including the kind of disease, 11 medical errors, 12 patient satisfactions, 13 and lack of initial evaluation or treatment.14,15
In this work, we extend risk stratification modeling for health service utilization through an advanced computational technique which enables including the effect of multiple instances of ED revisits by the same patient over time.16,17 Specifically, this study analyzes longitudinal forms in ED visits exploiting a unique method called group-based trajectory modeling (GBTM). In addition, we model distinct trajectories and their structure, and the association of these trajectories to several patient traits. To illustrate the value of the longitudinal approach of modeling changes in individual patient risk over time, we contrast GBTM with a standard clustering approach (K-means). Furthermore, beyond typical ED data reported in previous research, our study utilizes data collected from many distributed sources, thereby availing more ED data for track patients’ risk of ED revisit.
Identifying effective, and implementable approaches to risk stratification may assist clinicians in fitting personalized medical care to prevent ED revisit and enable healthcare organizations to more efficiently deliver population health management interventions.
Patients’ risk for early ED revisits may change over time. Risk profiling approaches by specifically identifying the relative developmental risk over time, could allow healthcare institutes to prepare involvements and plans to patients’ varying needs. This is the reason our paper will focus on time-series model rather than the classical traditional clustering method (e.g. K-means).
Background
ED visits and Revisits
EDs play a critical role in healthcare systems by performing acute interventions for emergent situation and as a source of primary care that is widely accessible within communities. 18 Return visits to the ED are common with estimates ranging between 10–26% depending on the subpopulation.9,19,20 Repeat ED visits may or may not result in an inpatient admission. In addition, the ED visit may or may not be for the same reason as the previous visit, or may not even be to the same institution. ED revisits could be as a result of reduced care quality or for unanticipated complications. 11 Also, a return visit to the ED can also result from a patient’s over-estimation of the urgency of their medical conditions, 21 which could have been treated on other points of care outside the ED (e.g., community clinics). In terms of clinical conditions, for instance asthma and diabetes are associated with higher ED revisits. 11 ED revisits are problematic because each visit suggests the potential for an increased risk of side-effects, like functional deterioration and infections.22,23 Numerous clinical and social factors are associated with an increased risk of an ED revisit. For example, age, loneliness, residence in a long-term care facility, or receiving in-home assistance services each have been associated with ED revisits.18,23 In addition, limited English proficiency patients are more likely to have an unplanned revisit than English speakers. 24
Clustering methods and machine learning
Clustering, a fundamental method in unsupervised machine learning, 25 may be useful in identifying and segmenting patient populations at differing levels of risk for experiencing an ED revisit. Clustering algorithms allocate items into clusters by using some distance measures between an item and the centroid of the cluster and the method does not depend on any distributional assumptions. 26 A common clustering algorithm is the K-means clustering which finds clusters by diminishing the sum of squared deviations between the each distinct item and their cluster means. 27 Hao et al. 11 used decision trees to produce scores approximating the probability of the ED revisit within 1 year of the visit history. Retrospective and prospective testing results along with a case study summary displayed the algorithm’s effectiveness in the discovery of patients with different ED revisit risks with decent sensitivities. 21 Other works have used logistic regression, 28 Two-Class Boosted Decision Trees, 20 and hidden Markov models. 10
Materials and methods
We modeled the trajectories with a higher risk of an ED revisit in a 10-year longitudinal patient panel using group-based trajectory modeling (GBTM).
Study setting and data
The study sample included 145880 ED visits among 37,416 patients at an urban safety-net hospital located in Indianapolis, Indiana, USA between 2006–2016. Due to the requirements of a prior study, these secondary data were limited to Indiana residents that had at least one primary care visit at the hospital’s outpatient primary care clinics before and after 2011.
We combined four data sources. The primary data source was the safety-net hospital’s electronic health record (EHR). The EHR data were joined with data from the statewide health information exchange (HIE) data repository. We classified data from the EHR as either associated with: 1) the current ED visit or 2) historical EHR data (i.e. data generated prior to the current visit). Third, we extracted data from the Indiana Network for Patient Care (INPC). The INPC includes patient information from more than one hundred different hospitals and thousands of health care providers from across the state and is one of the US′ largest and oldest multi-institutional clinical data repositories. 29 Lastly, we joined area-level social determinants of health. 30 Each measure was at the census tract level. Census tract level is defined by the US Census Bureau. These are sub-county areas of approximately 4000 individuals.
Features & feature selection
From the four data sources, we extracted a total of 73 different features. From the hospital’s EHR, we obtained current visit and patient information including demographics (age, gender, race/ethnicity), timing of visit (AM/PM and weekday/weekend) and reason for the visit, such as a non-emergency and identified visits associated with injury, alcohol, or substance abuse according to the NYU algorithm.
31
Also from the hospital’s EHR, we obtained historical information, i.e., generated prior to the ED visit, such as prior diagnoses, Charlson comorbidity index scores,
32
the number of outpatient visits and hospitalizatῐῐions in the prior 30 days. From the HIE data, we calculated the following measures reflective of healthcare visits beyond those at the hospital: additional prior diagnoses, a recalculated Charlson comorbidity index scores (based on EHR and HIE data), total number of outpatient visits and hospitalizations in the prior 30 days from any provider organization, and determined the total number of unique prescriptions in the past 30 days from all providers. From the area-level dataset we included various measures of socioeconomic status and public safety. To facilitate presentation, we labeled features as: 1) Current ED visit and patient data (7 features with an “ed” prefix and age, gender, and race), 2) Historical EHR data (15 features with an “ehr” prefix), 3) HIE data (14 features with an “hie” prefix), and 4) Area-level social determinant (34 features with a “ct” prefix).
Group-based trajectory modeling (GBTM)
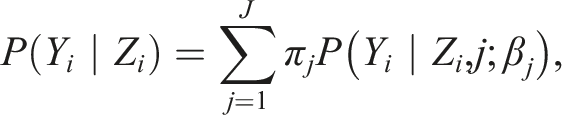
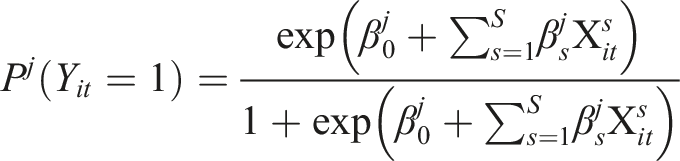
We used group-based trajectory modeling (GBTM), a longitudinal trajectories analysis method, to study the developmental path of ED revisits risk of each patient. GBTM is a fixed mixture modeling, assuming that the population distribution of trajectories rises from a finite mixture of unknown order J.
33
It models the distribution of dependent variables conditional on a time-related metric such as time from the beginning of the first period or event, represented by
Modeling and generating the ED revisit trajectories
The unit of analysis was the ED visit and the time-related metric of interest was the risk of a repeat ED visit at each visit. We implemented the GBTM models using the user-developed Traj procedure
34
in STATA version
Feature selection methods
The first step before starting the GBTM modeling was to identify the most important features in our data sets and to reduce the number of variables in the GBTM model.
Two selected methods for feature selection (FS) were used. Gini Importance 36 and Information Gain (IG) (using Entropy). 37
We used Python to perform the feature selection methods. The results were compared across both Gini and IG methods. We picked the five most impactful variables in each category (to use it on GBTM Full Model) as we elaborate bellow in section 4.2.
The Dependent variable–ER revisit
Repeat ED visit within 30 days was identified as dependent variable. ED revisits could happen at any ED in the Indiana state and were not at all bounded to visits to the same institution. For each patient in the sample, we selected their first to their 10th ED visit (above 10 visits the data were too sparse). ED revisit appeared and used also in earlier works.
Figure 1 depict the main steps of our paper. Graphical view of the main steps.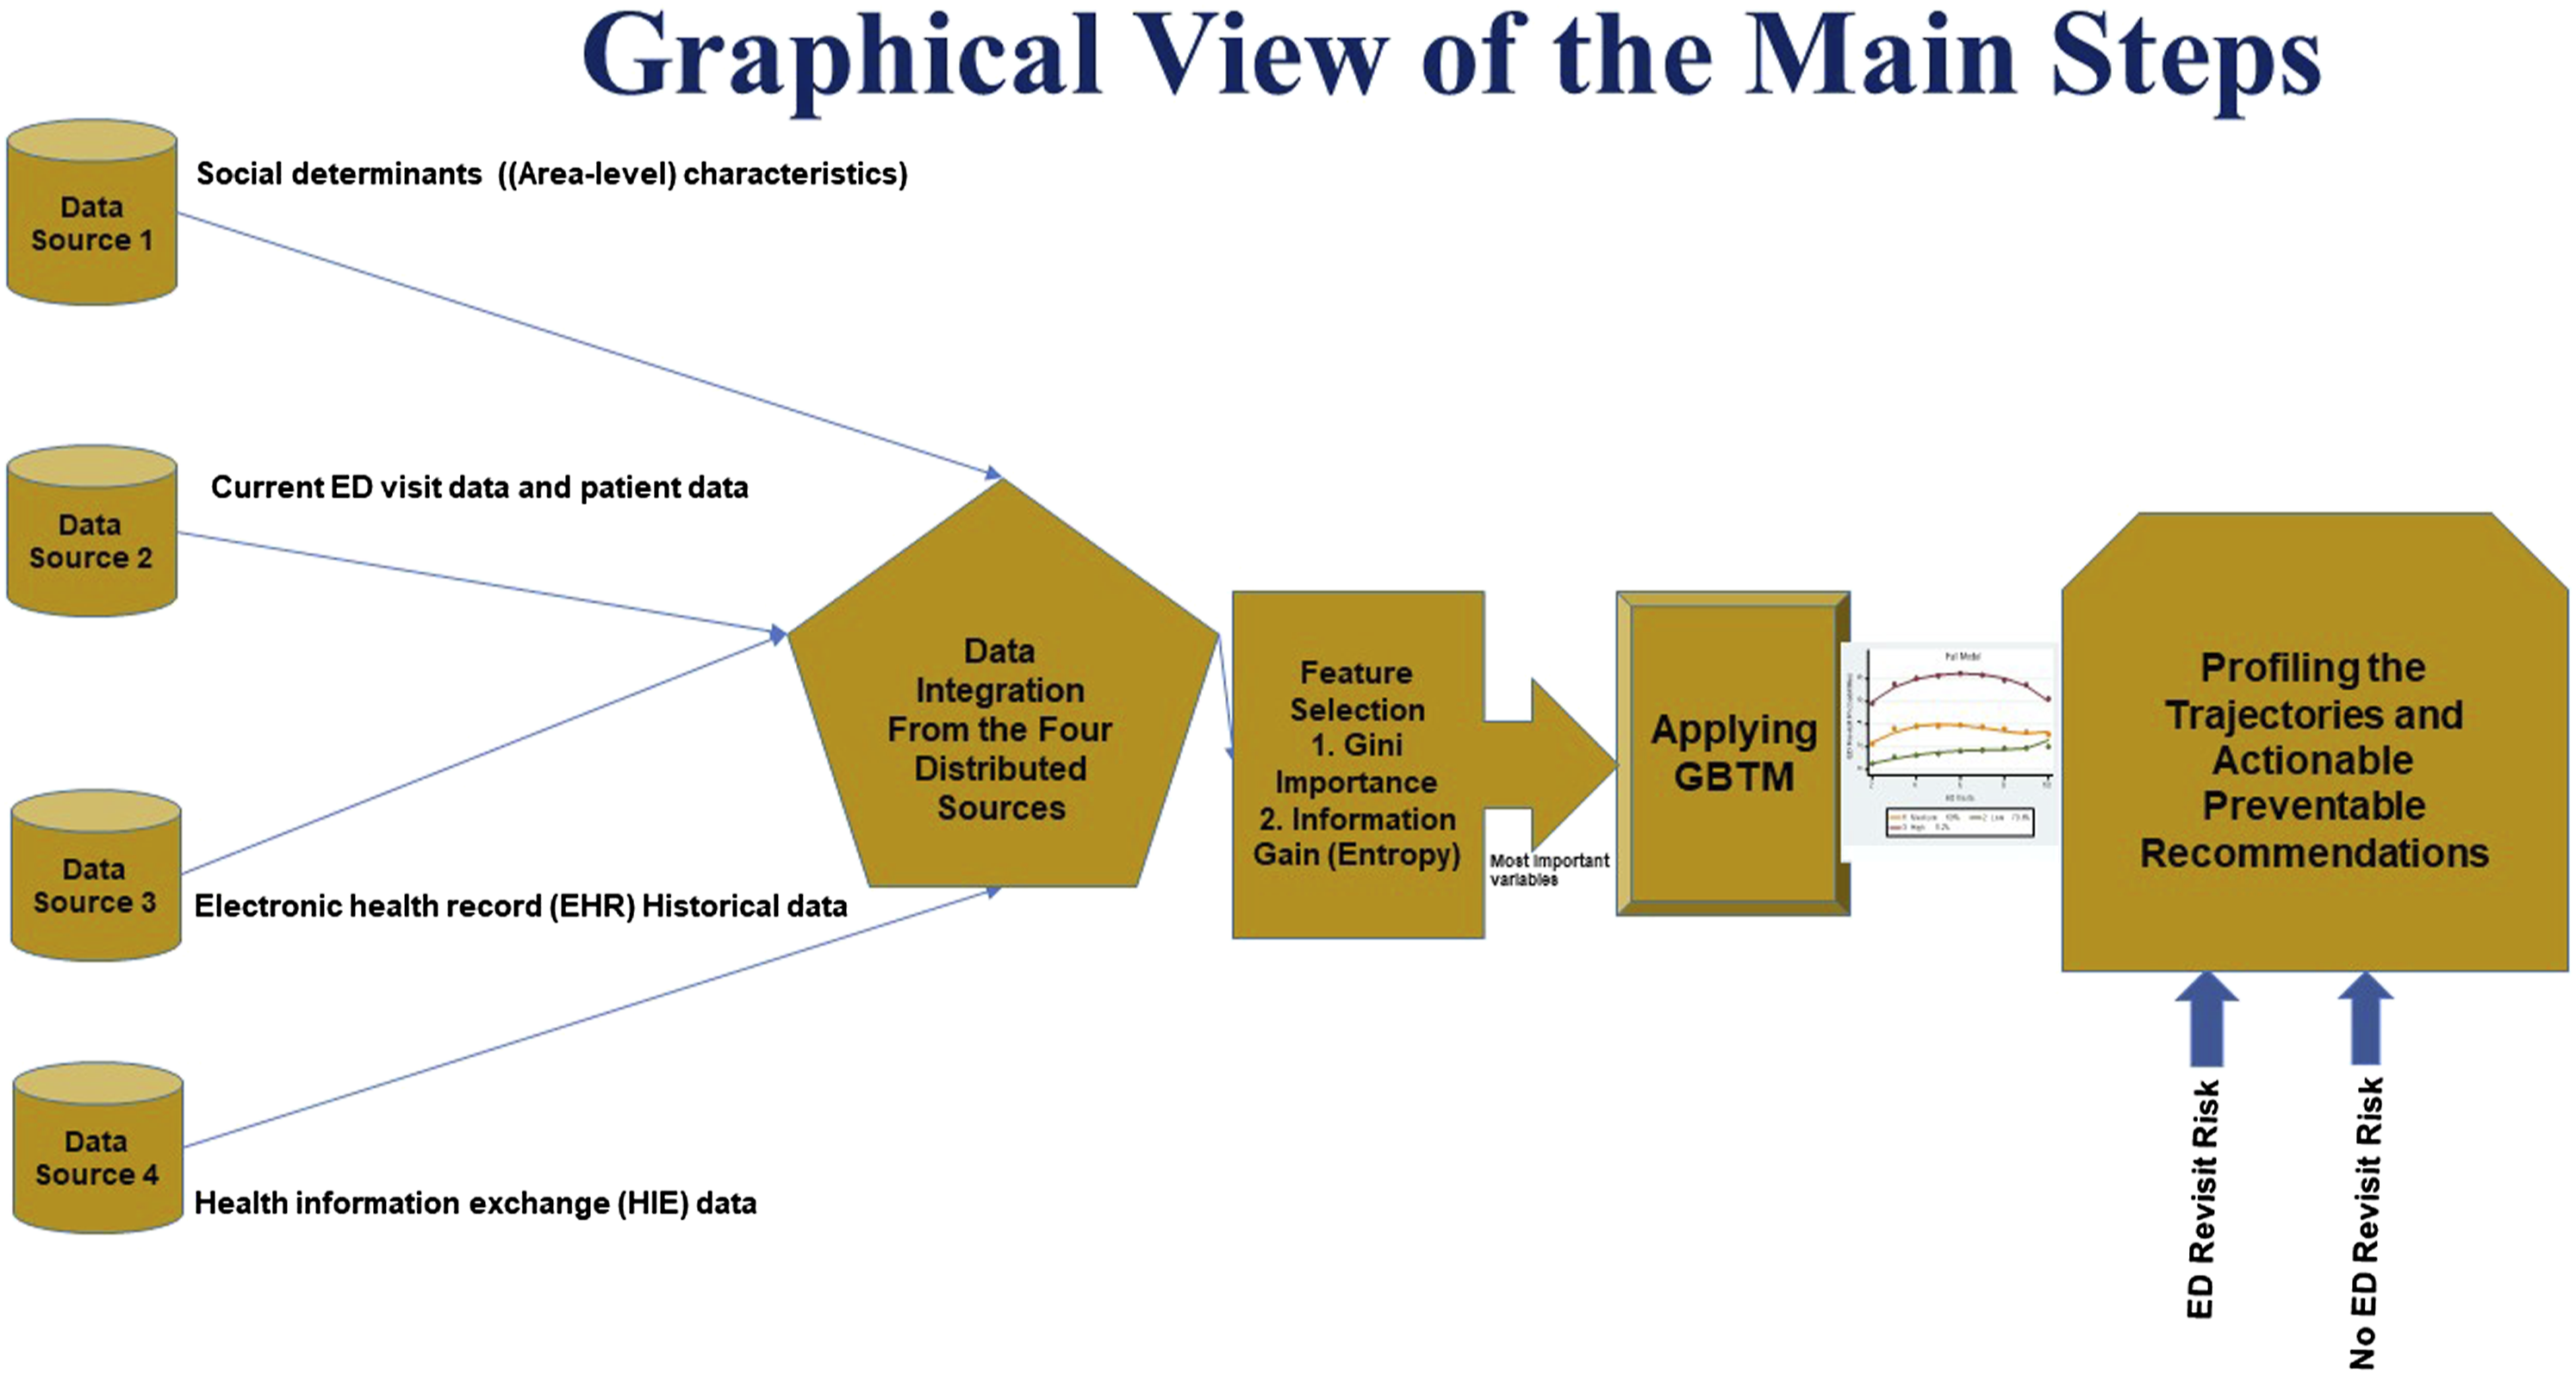
Results
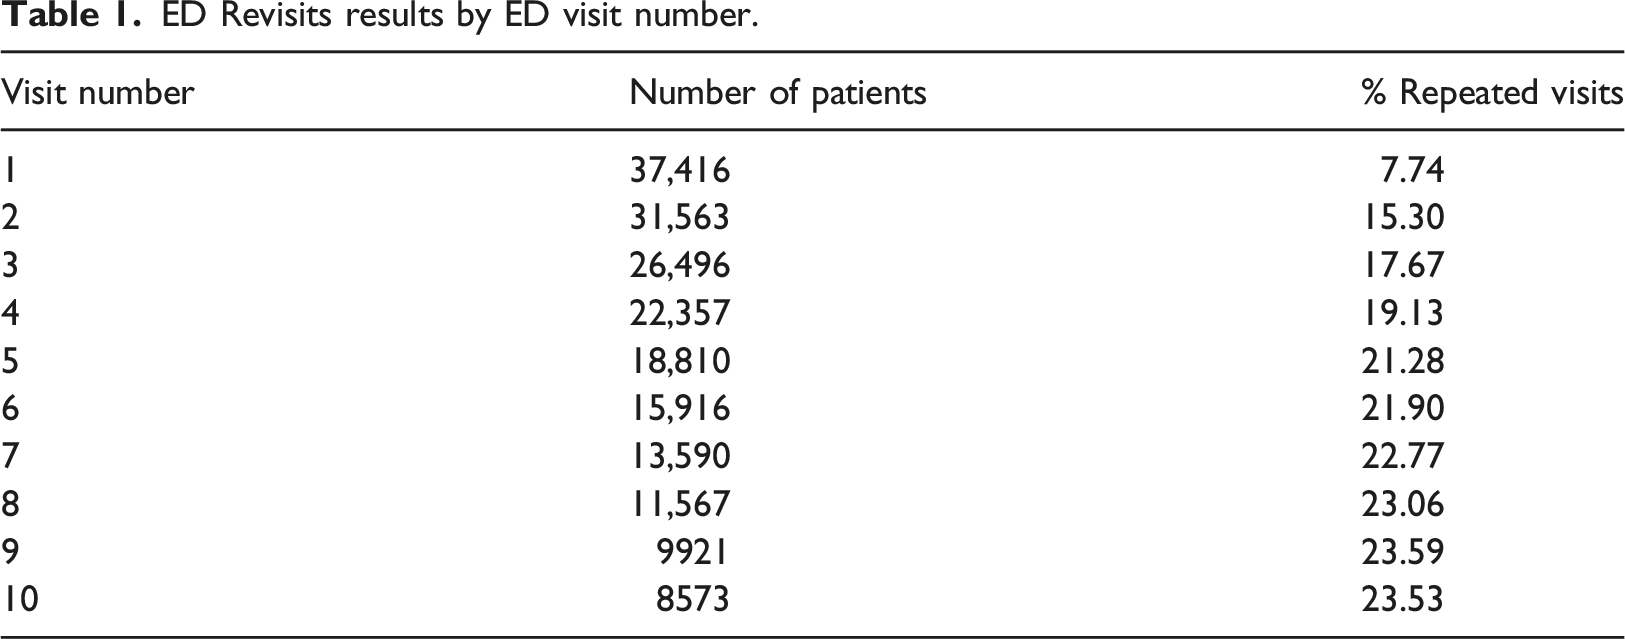
Descriptive statistics
ED Revisits results by ED visit number.
Feature selection
After comparing results across the Gini and IG methods, we retained the five most impactful variables in each category for use in GBTM modeling. One of the first steps was to identify the key features in each class of variables.
Figure 2 illustrates the similarities of comparing the two FS methods for the class of Current ED visit and patient data (besides ED visit associated with psychological diagnosis, visit was due to an emergency that switched their places). Similar stable ranking was achieved in all three other classes of variables (HIE data, area-level and EHR data). Example for feature selection using both methods.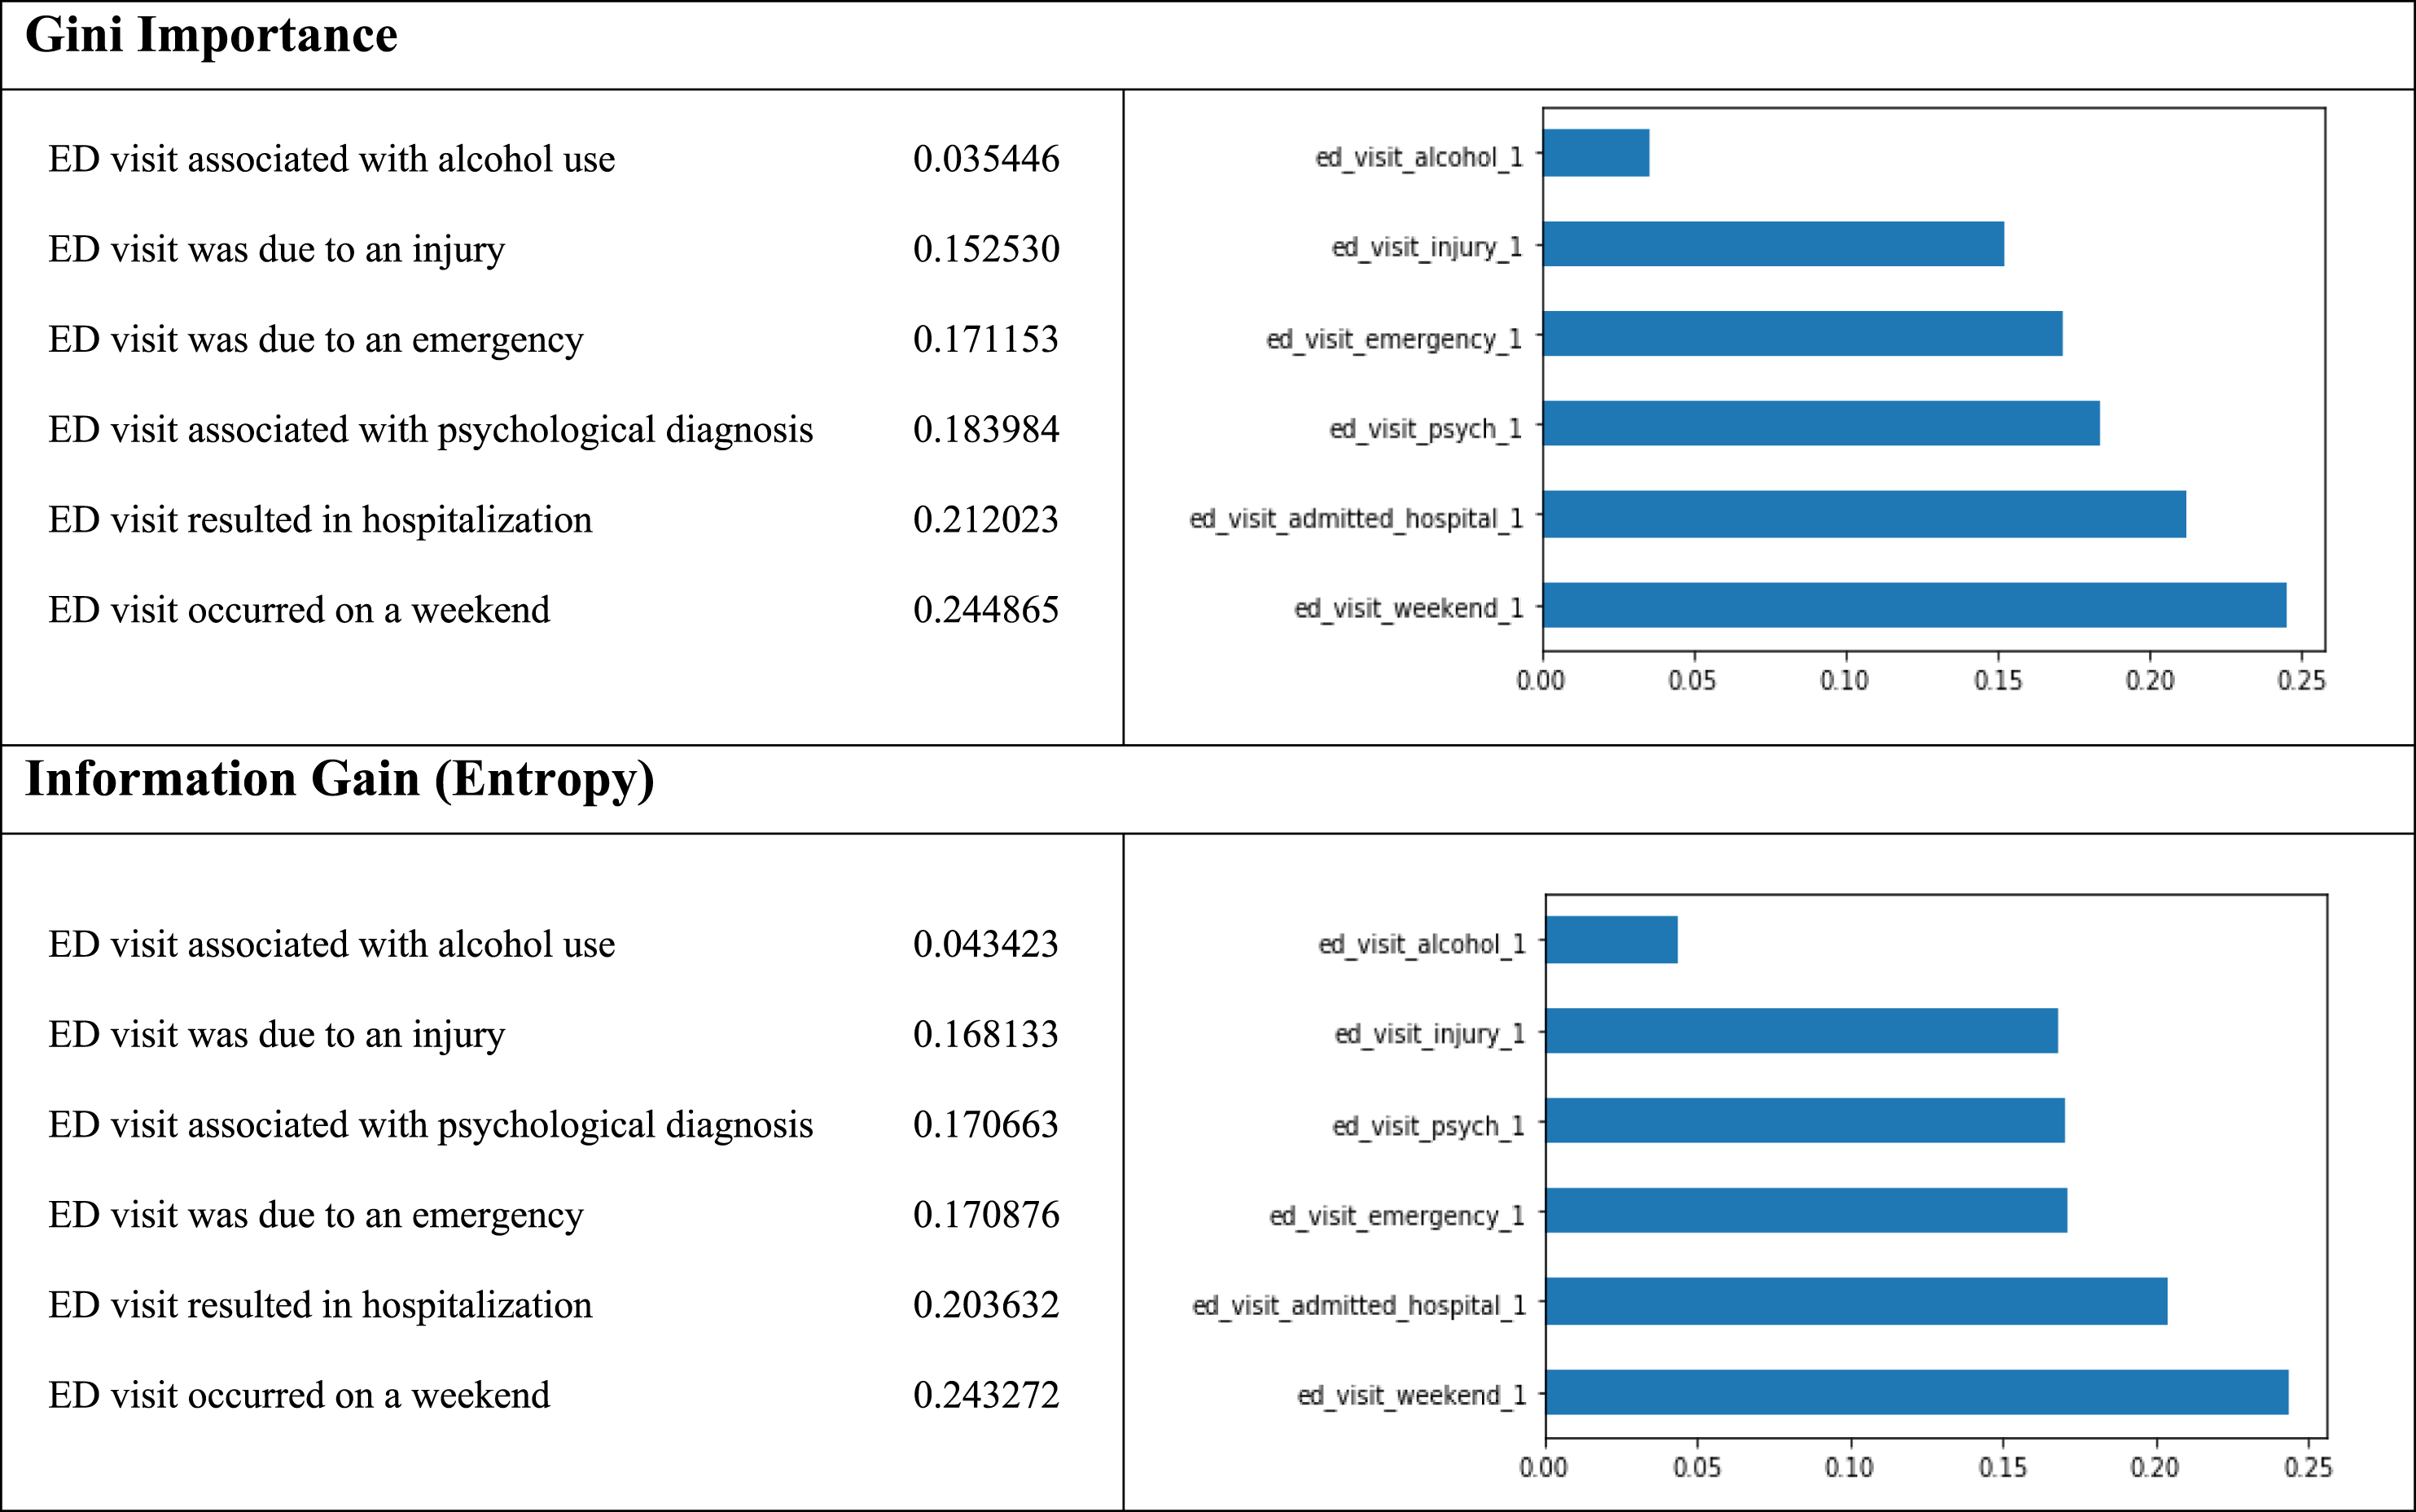
We divided the variables into time-stable and baseline variables and time-varying variables. The time-varying variables included: 6 variables from the class ‘Current ED visit data and patient data’, 15 variables from the class ‘EHR Data’, 14 variables from the class ‘HIE Data’ and 10 variables from the class ‘Area-level characteristics’ that are changing over time. The first run of feature selection (FS) time-stable and baseline variables include 24 Area-level characteristics, age, gender, and race. Then, we run the FS in all three other classes of variables (Current ED visit data and patient data, EHR Historical data and HIE data).
Eventually, for building the GBTM model, we tried to run the GBTM using the strongest five variables from each class of data, including the combination (having 20 variables by taking the five strongest variables from each class of data) of all of them. We received the best GBTM goodness of fit measurements when we used the five most impactful variables (all received from the class ‘Current ED visit data and patient data’). Thus, the best model included these variables: weekend visit, admitted to the hospital via the ED, ED visit associated with psychological diagnosis, visit was due to an emergency, and ED visit was due to an injury.
Analyzing the ED visits using the GBTM
GBTM goodness of fit tests
Comparison between goodness of fit for two and three trajectories.
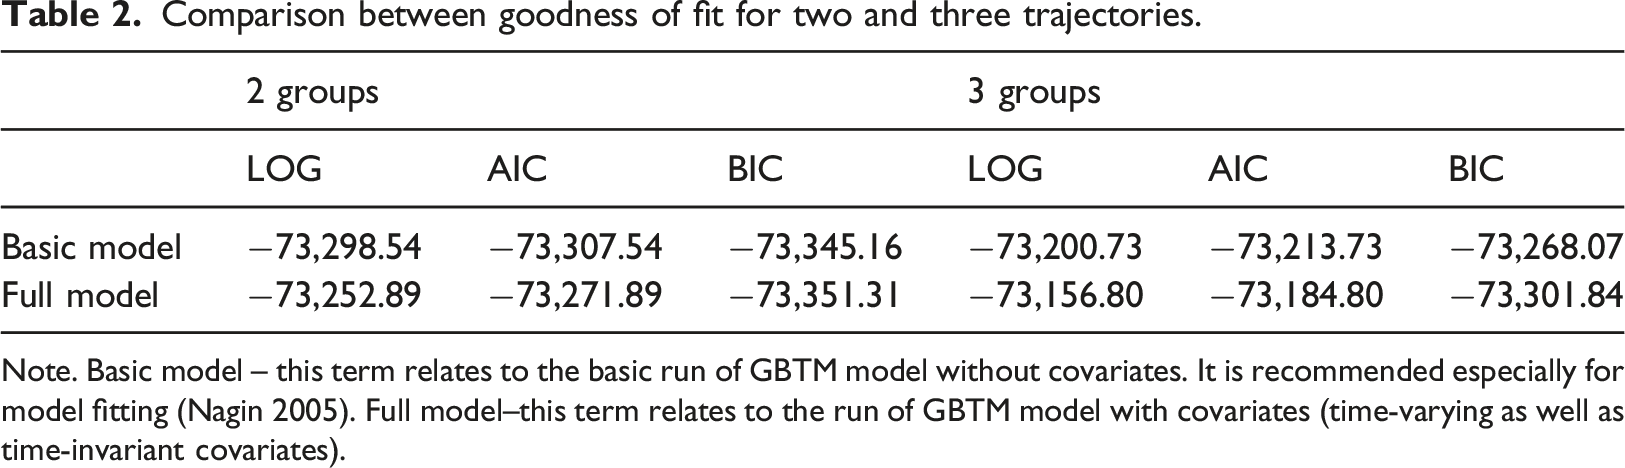
Note. Basic model – this term relates to the basic run of GBTM model without covariates. It is recommended especially for model fitting (Nagin 2005). Full model–this term relates to the run of GBTM model with covariates (time-varying as well as time-invariant covariates).
Basic and full GBTM
Using the GBTM statistical software (STATA), we examined the features of the patients and their visits in each of their trajectory groups to understand the factors that described them. The full model of patients’ over up to 10 visits to the EDs is appeared in Figure 3, where the X-axis displays the number of ED visits and Y-axis displays the probabilities for ED revisit (within 30 days). Applying the BIC criterion for model selection to the study setting showed that the GBTM clustered 37,416 patients into three distinct trajectories based on patients’ ED revisit risk levels. According to the GBTM model, the low risk group included 79.6% of the population who were in relatively stable health, with their average number of ED revisits is 0.61, which continued to increase their likelihood to ED revisit slightly over the entire study period. The medium risk level included 19.1% of the population, which almost unchanged over the multiple visits (increasing their likelihood to ED revisit slightly until visit 6 and then decreasing until visit 9), with their average number of ED revisits is 4.15. The high-risk group (average number of ED revisits is 8.14) included only 1.2% of the population, that was defined as the Worsening group. It started at a high ED risk level which continued to increase their likelihood to ED revisit until visit 7, and after visit 7 the risk level is levelling off a bit (also due to a decrease in the number of patients–Table 3) but without intersection with any other trajectory and stays as the riskiest group for ED revisits. The shapes of the trajectories over the ED visits.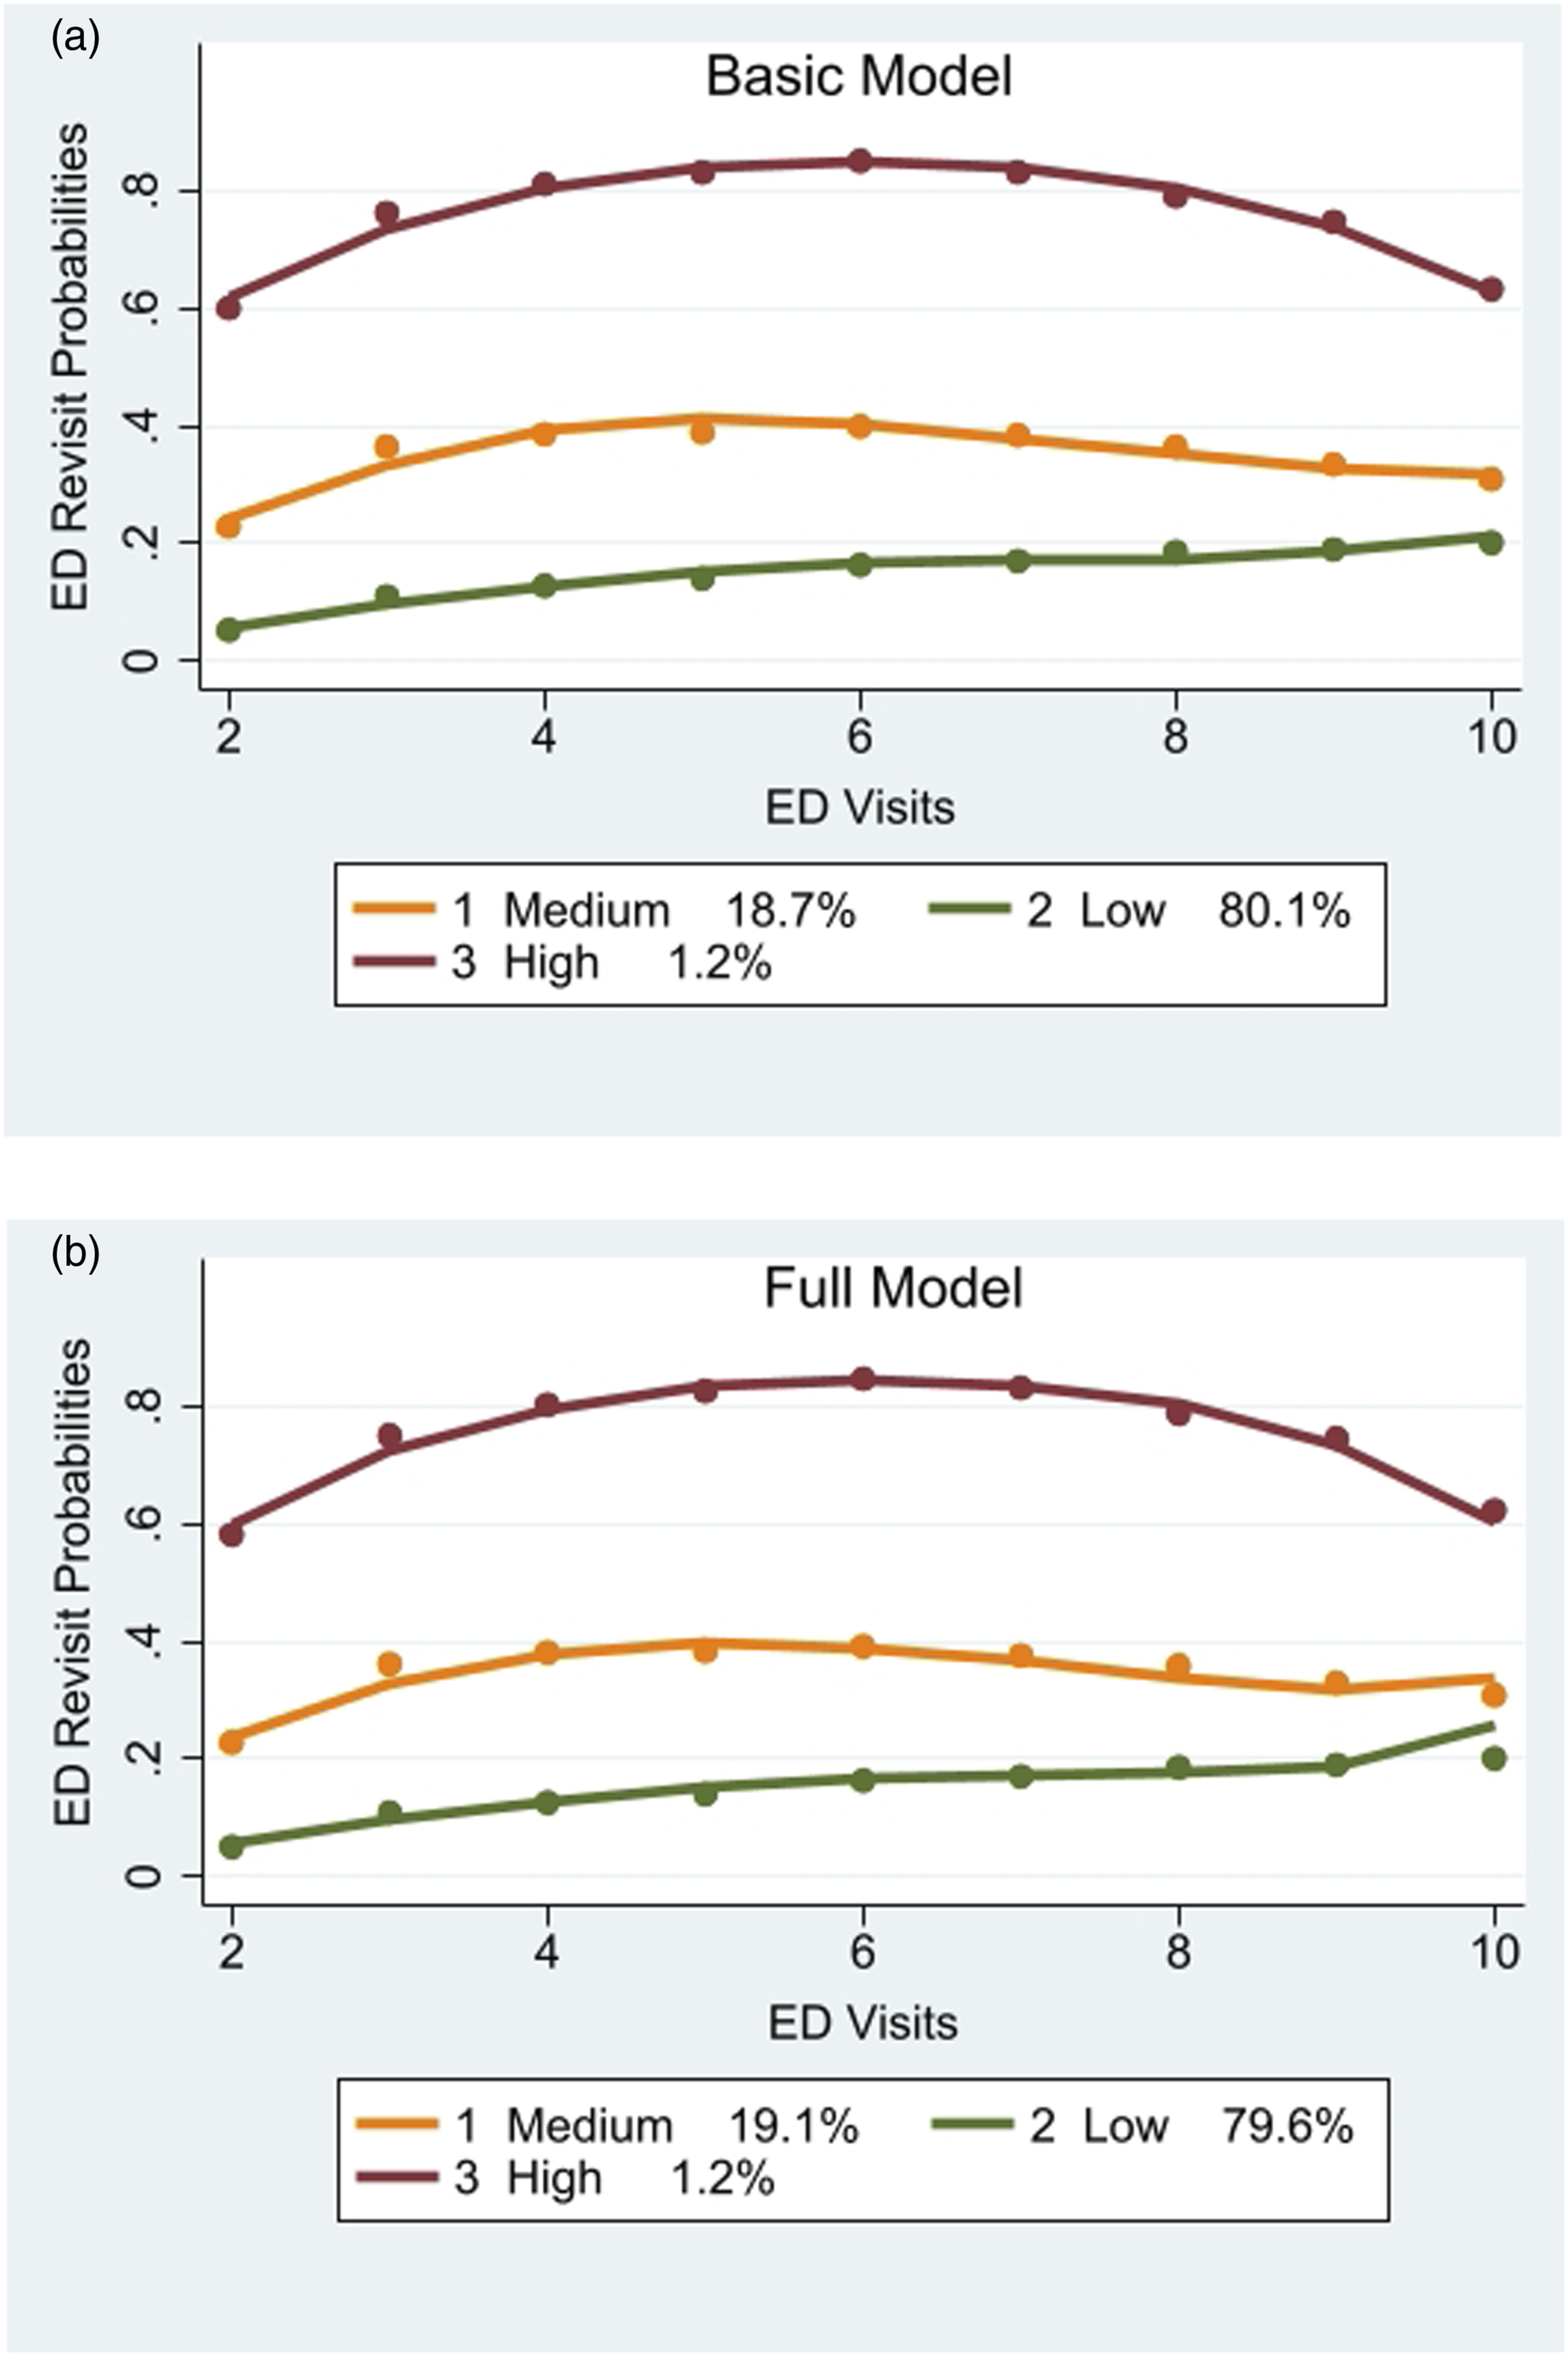
The best significant results for the shapes of each trajectory of both basic and full models were Cubic (for the low trajectory), Cubic (for the medium trajectory) and Quadratic (for the high trajectory) shapes for the first, second and third trajectories respectively. The basic model (Figure 3) shows very similar trajectories, which strength the stability of the GBTM full model results.
Distribution of patients by trajectories over the ED visits
Revisits results by ED visit number by trajectories.
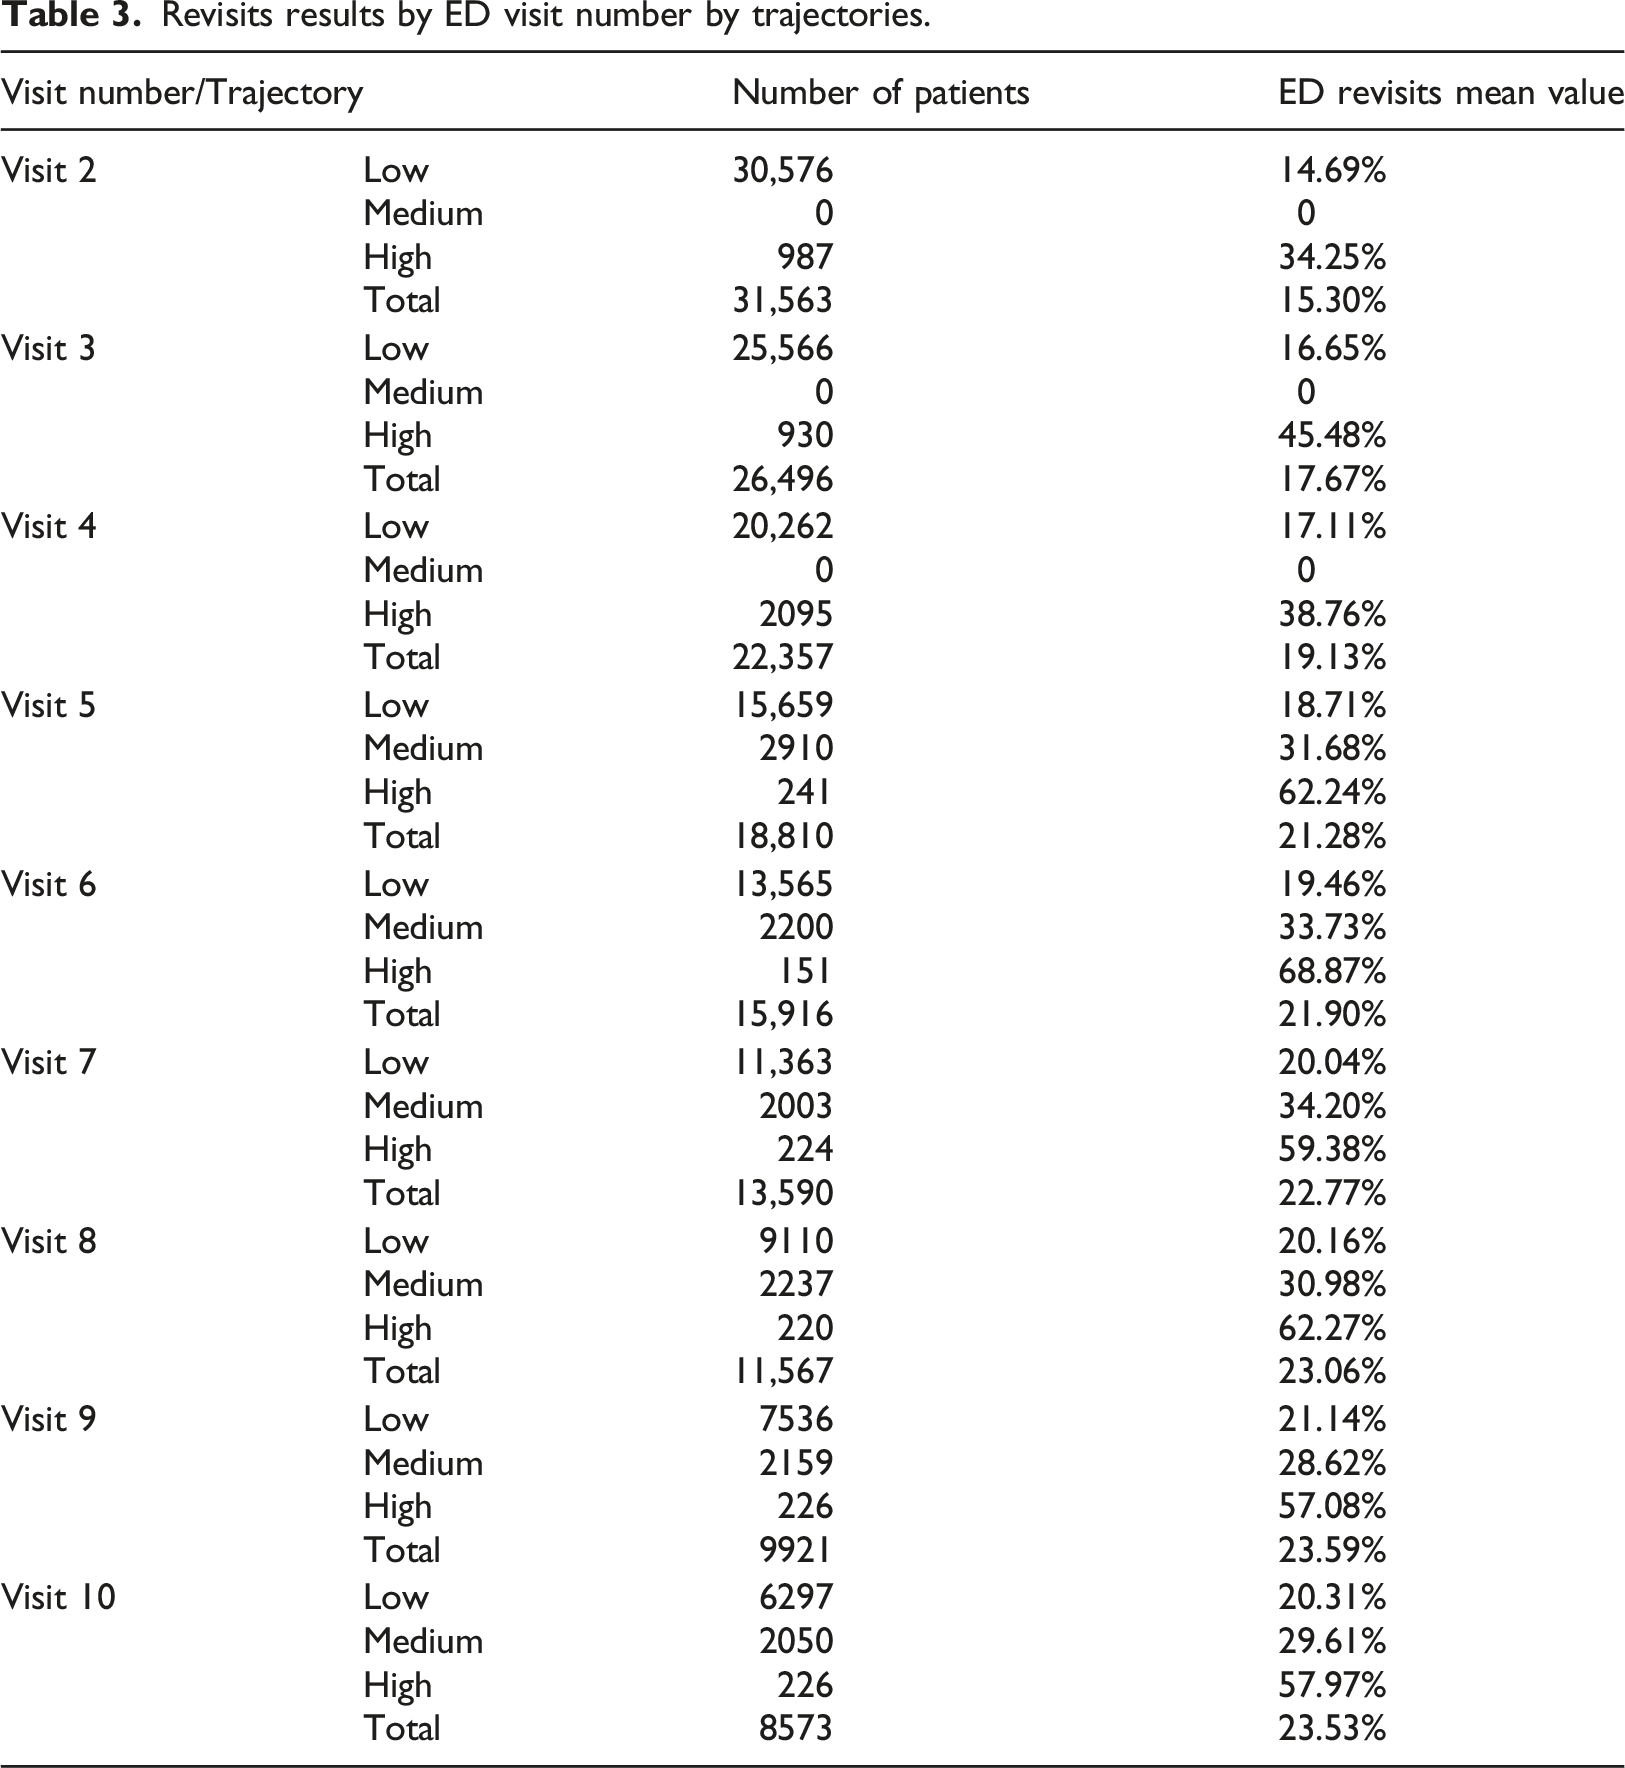
Figure 4 shows the progressive assignments of trajectory affiliation as the number of visits are increasing and more information regarding time-varying variables are captured and utilized (the number of patients on each visit and on each trajectory is shown). GBTM distributes patients to one of the trajectories based on their highest posterior probabilities for trajectory affiliation, with one goal to achieve prompt assignments of the latent trajectory affiliation. We can see that the riskiest trajectory, patients are assigned into their final trajectories by the second visit whereas patients in the medium and high-risk levels are assigned into their final trajectory only from the fourth/fifth visit. The progressive assignments of trajectory affiliation as the number of visits.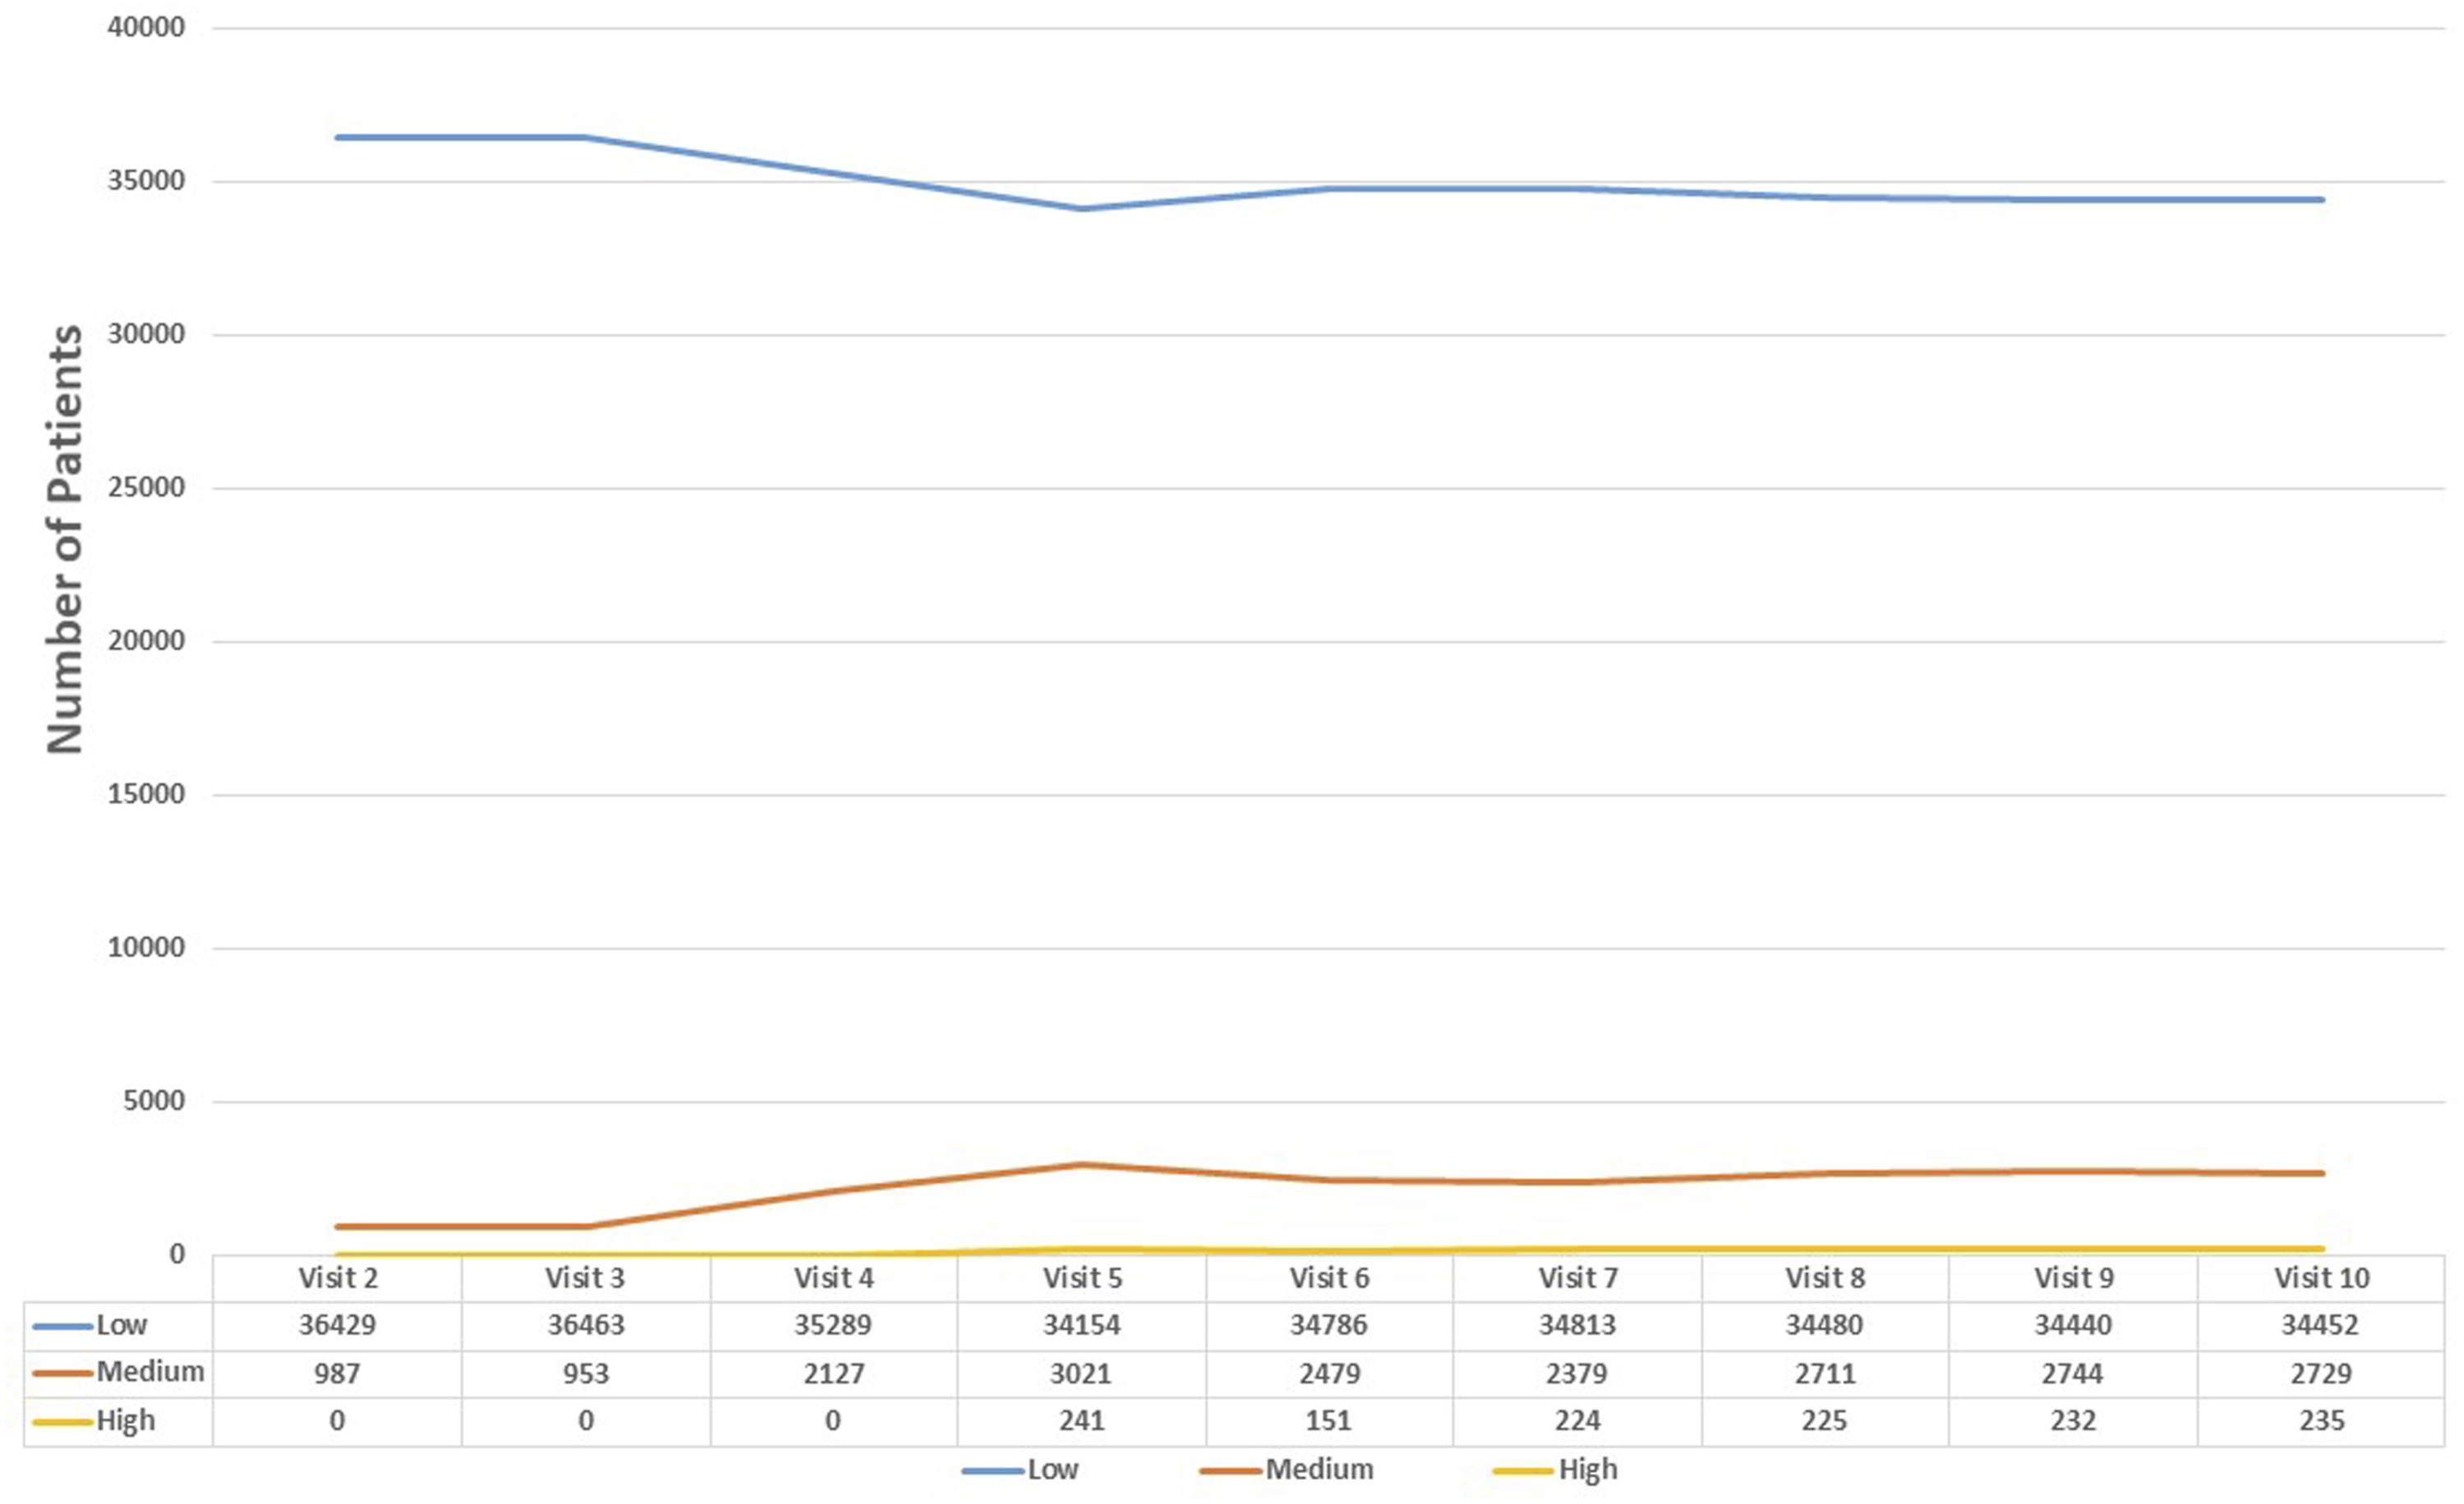
For the lower risk group, the average last ED revisit rate (each patient may have up until 10 visits so this average is not the 10th visit as each patient may has its own number of visit) was 11.1%, for the medium group 26.68% and the higher trajectory was 56.59%.
Profiling the GBTM trajectories
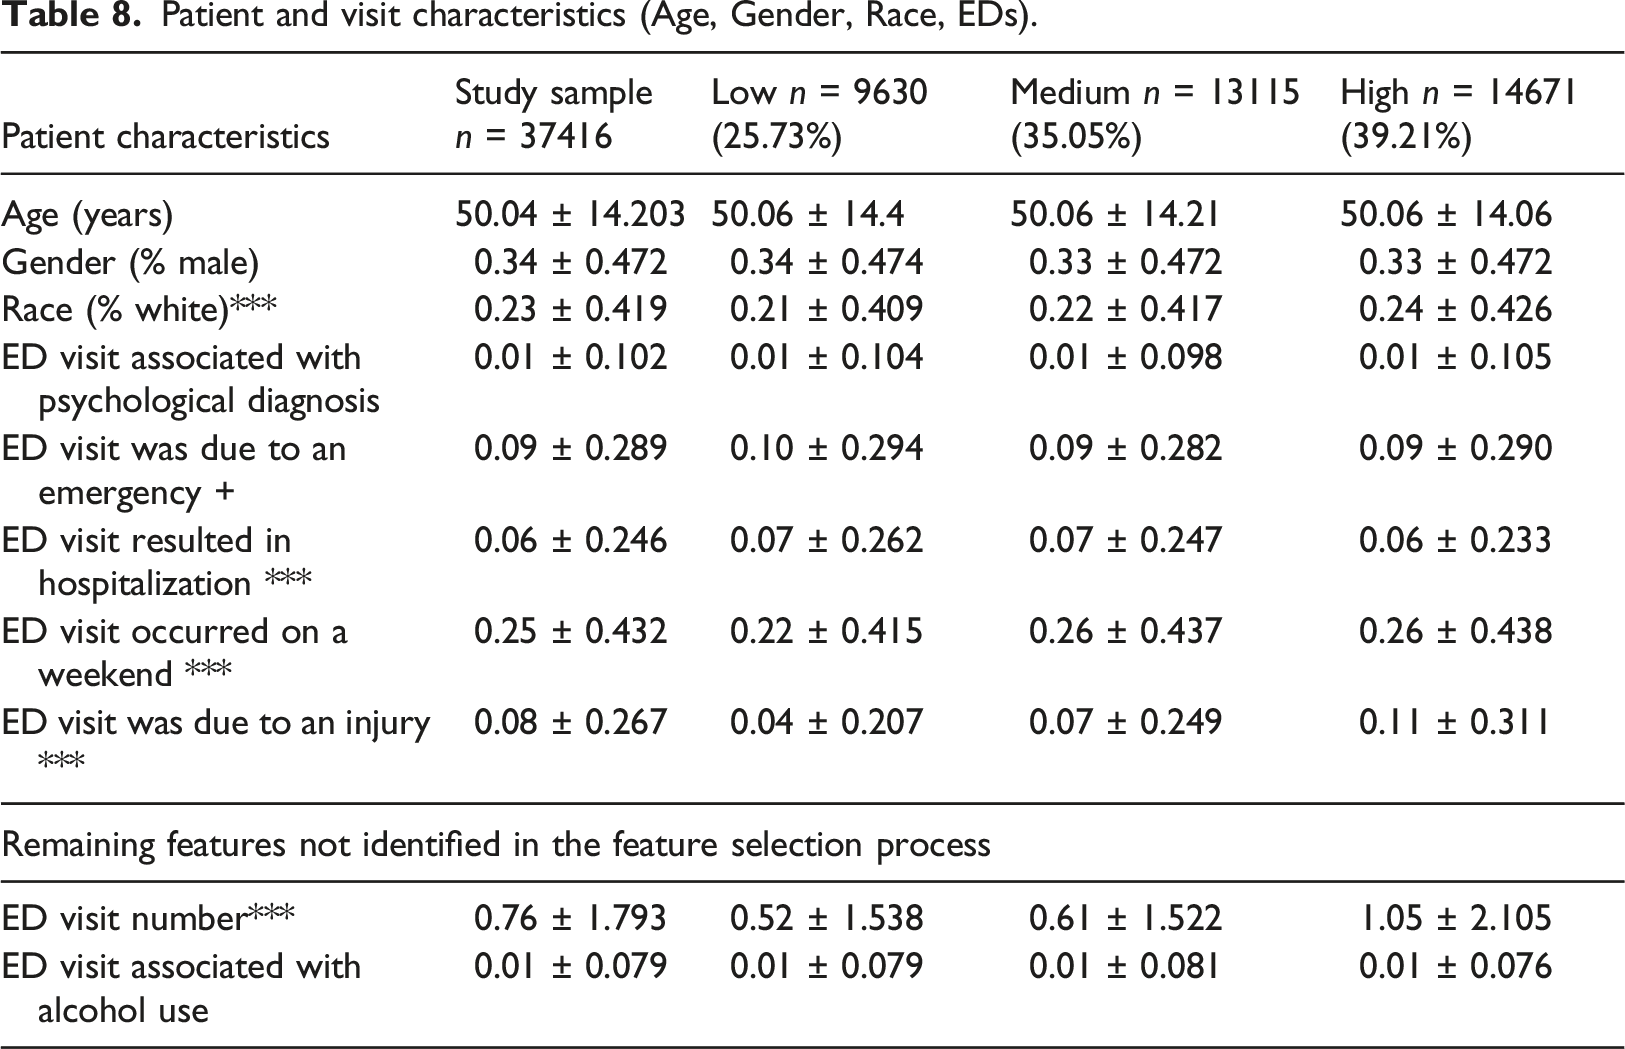
Patient and visit characteristics (Age, Gender, Race, EDs).
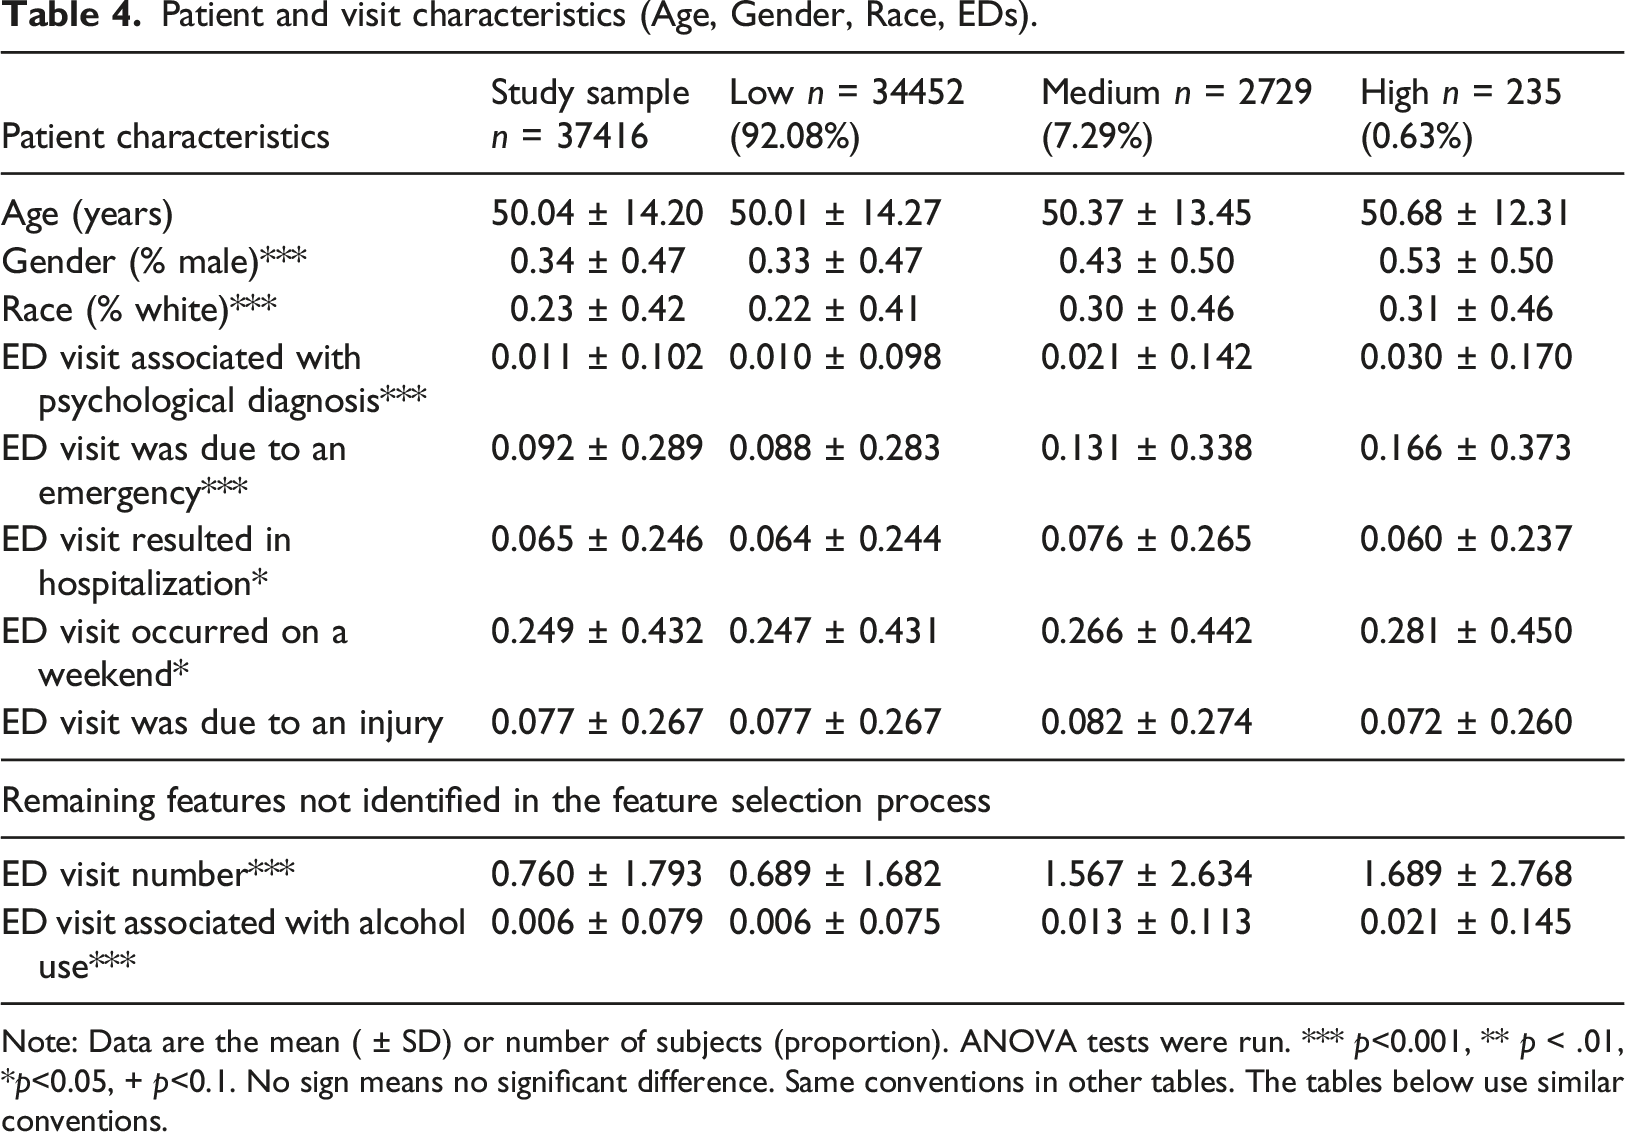
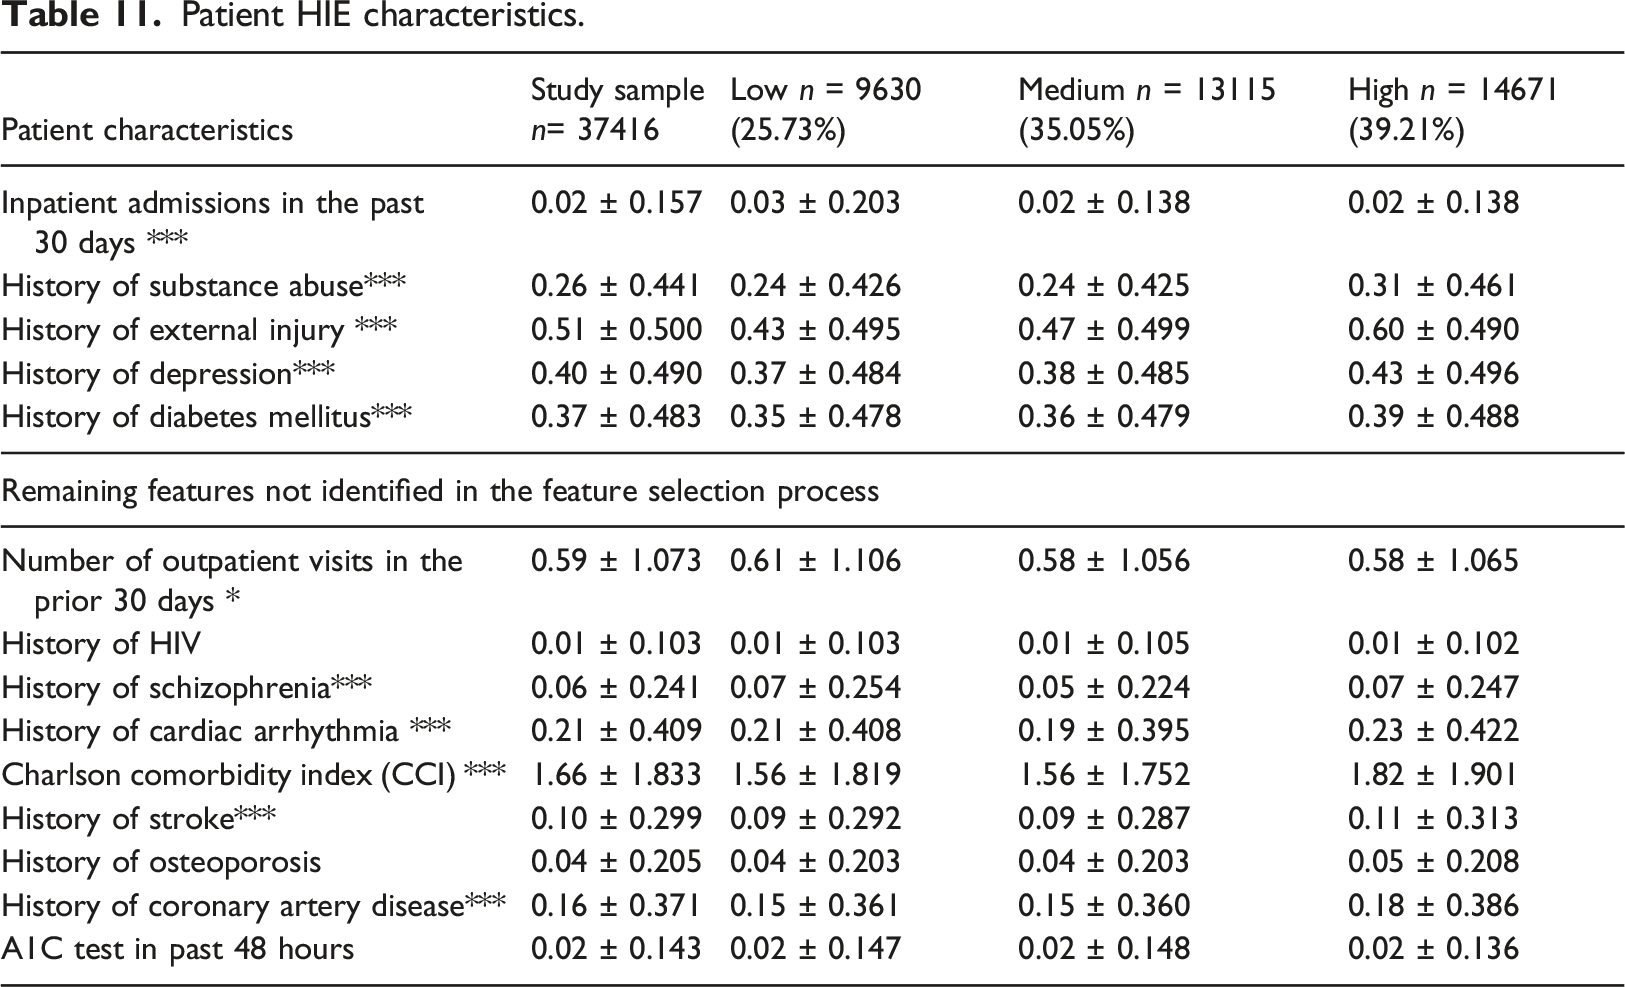
Note: Data are the mean ( ± SD) or number of subjects (proportion). ANOVA tests were run. *** p<0.001, ** p < .01, *p<0.05, + p<0.1. No sign means no significant difference. Same conventions in other tables. The tables below use similar conventions.
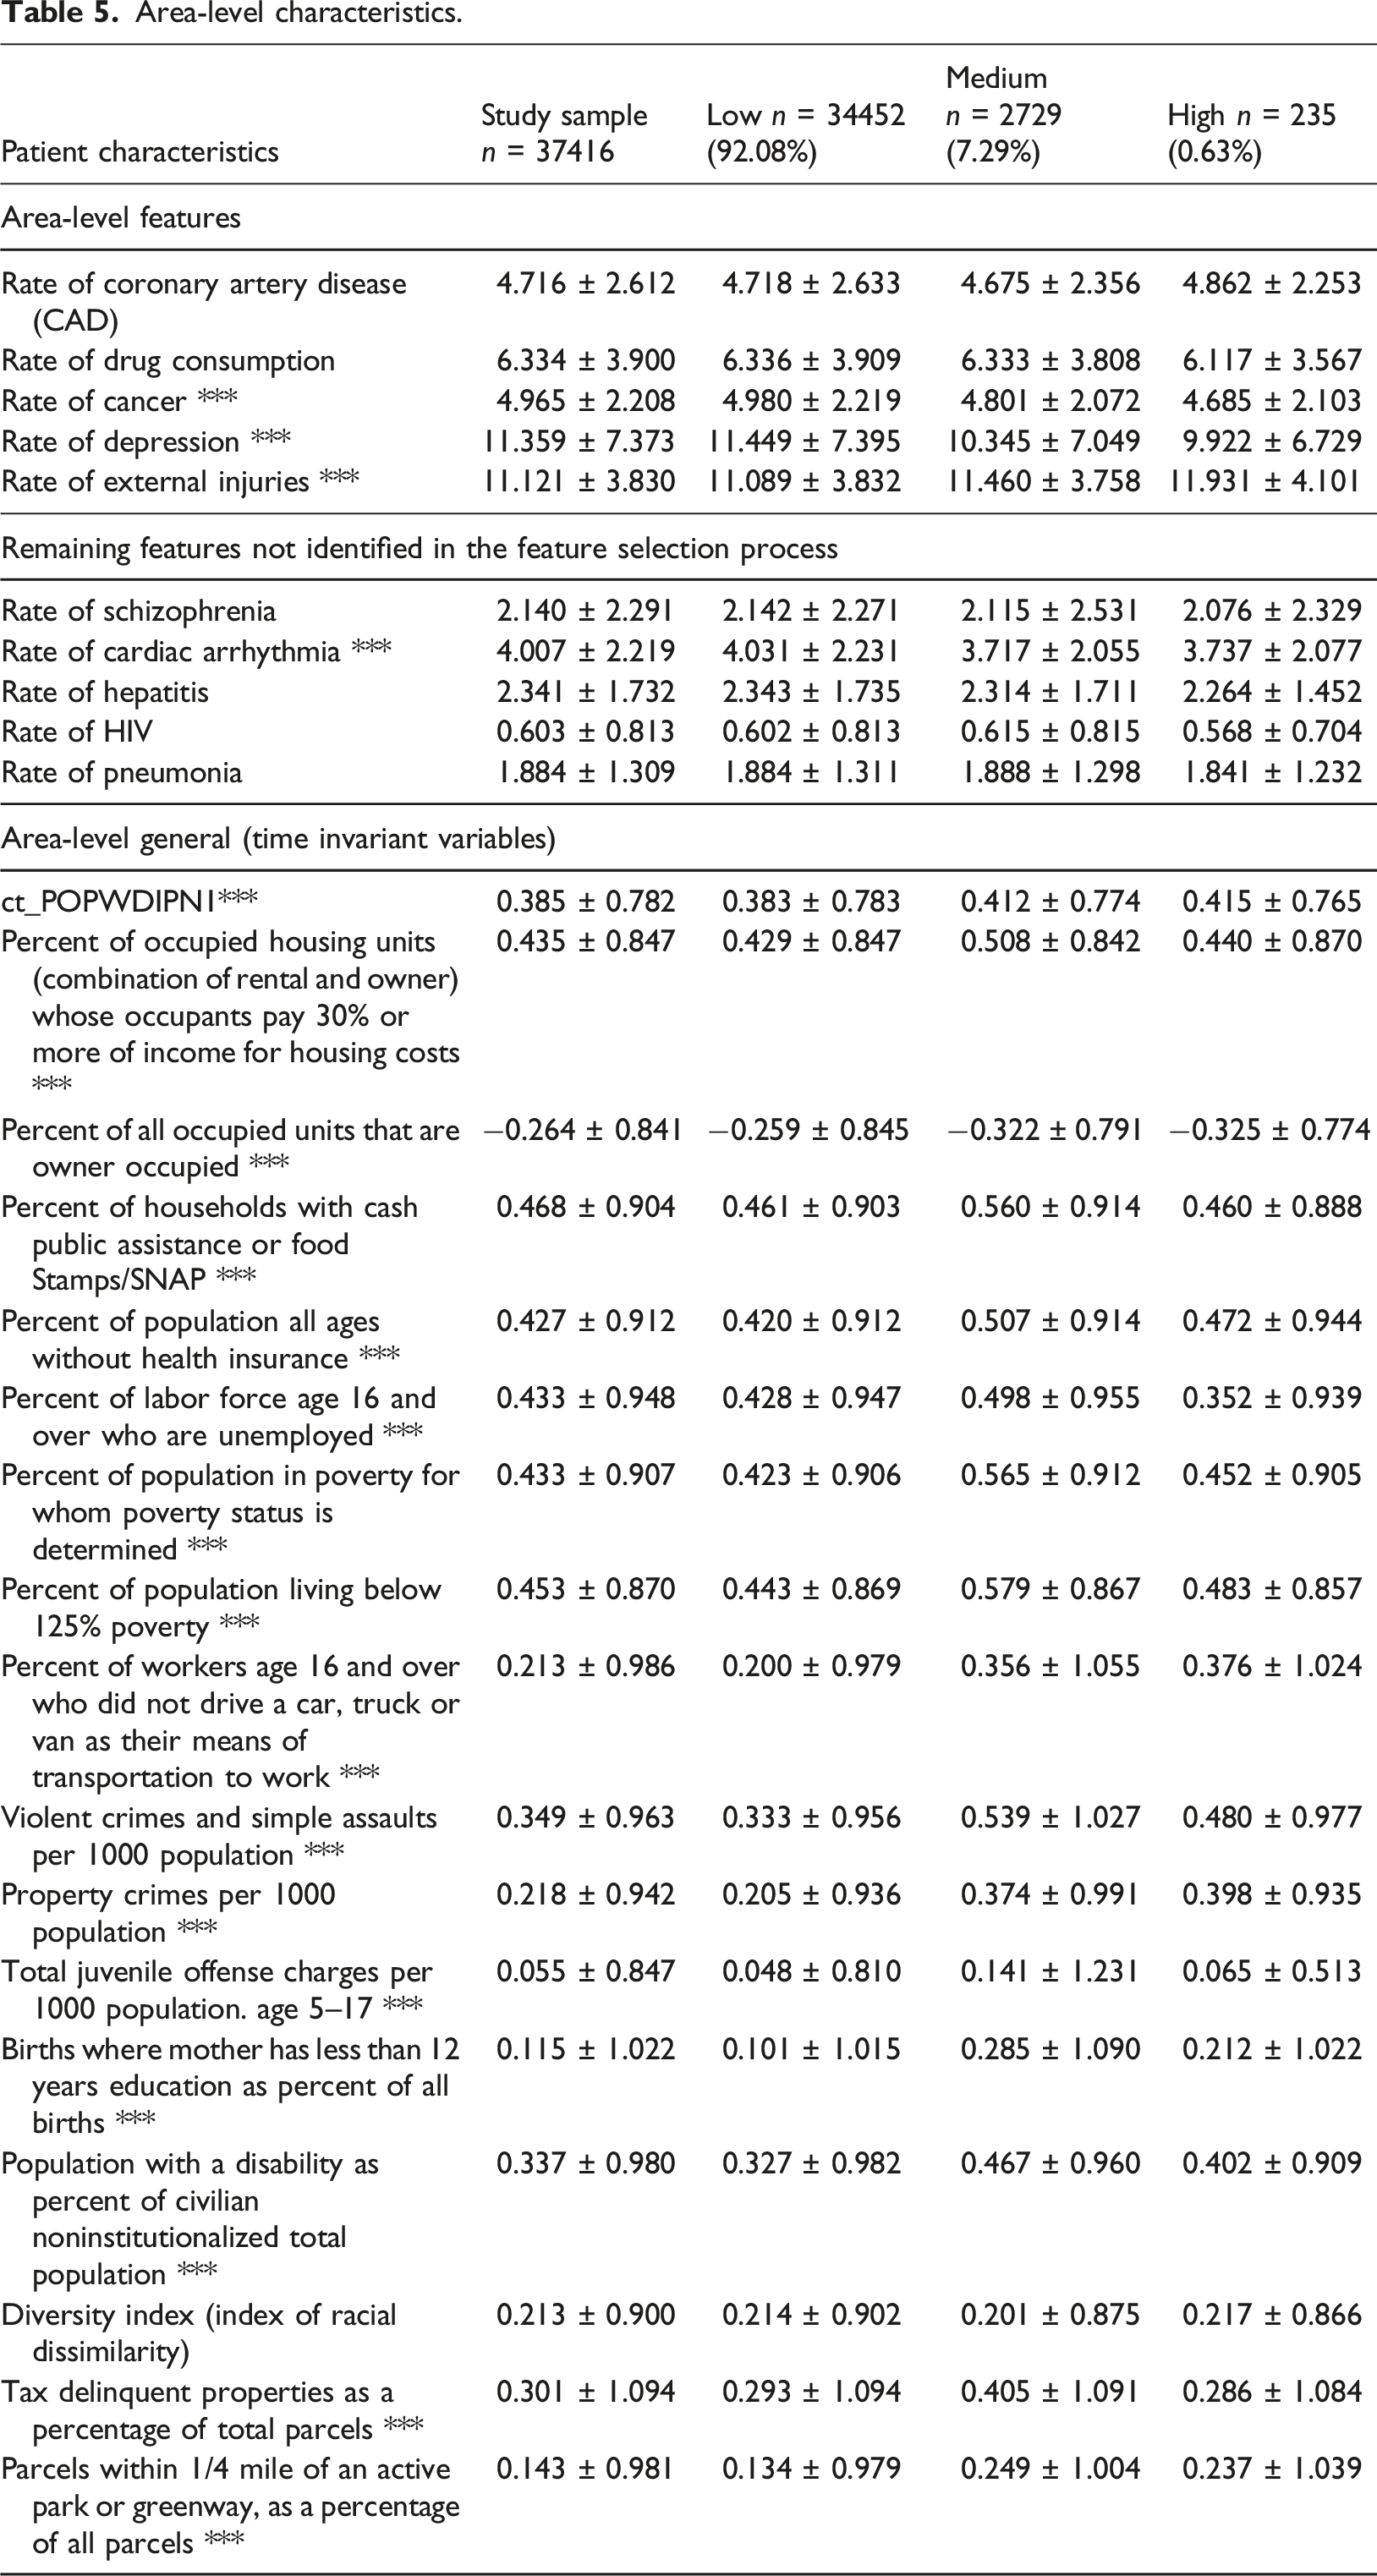
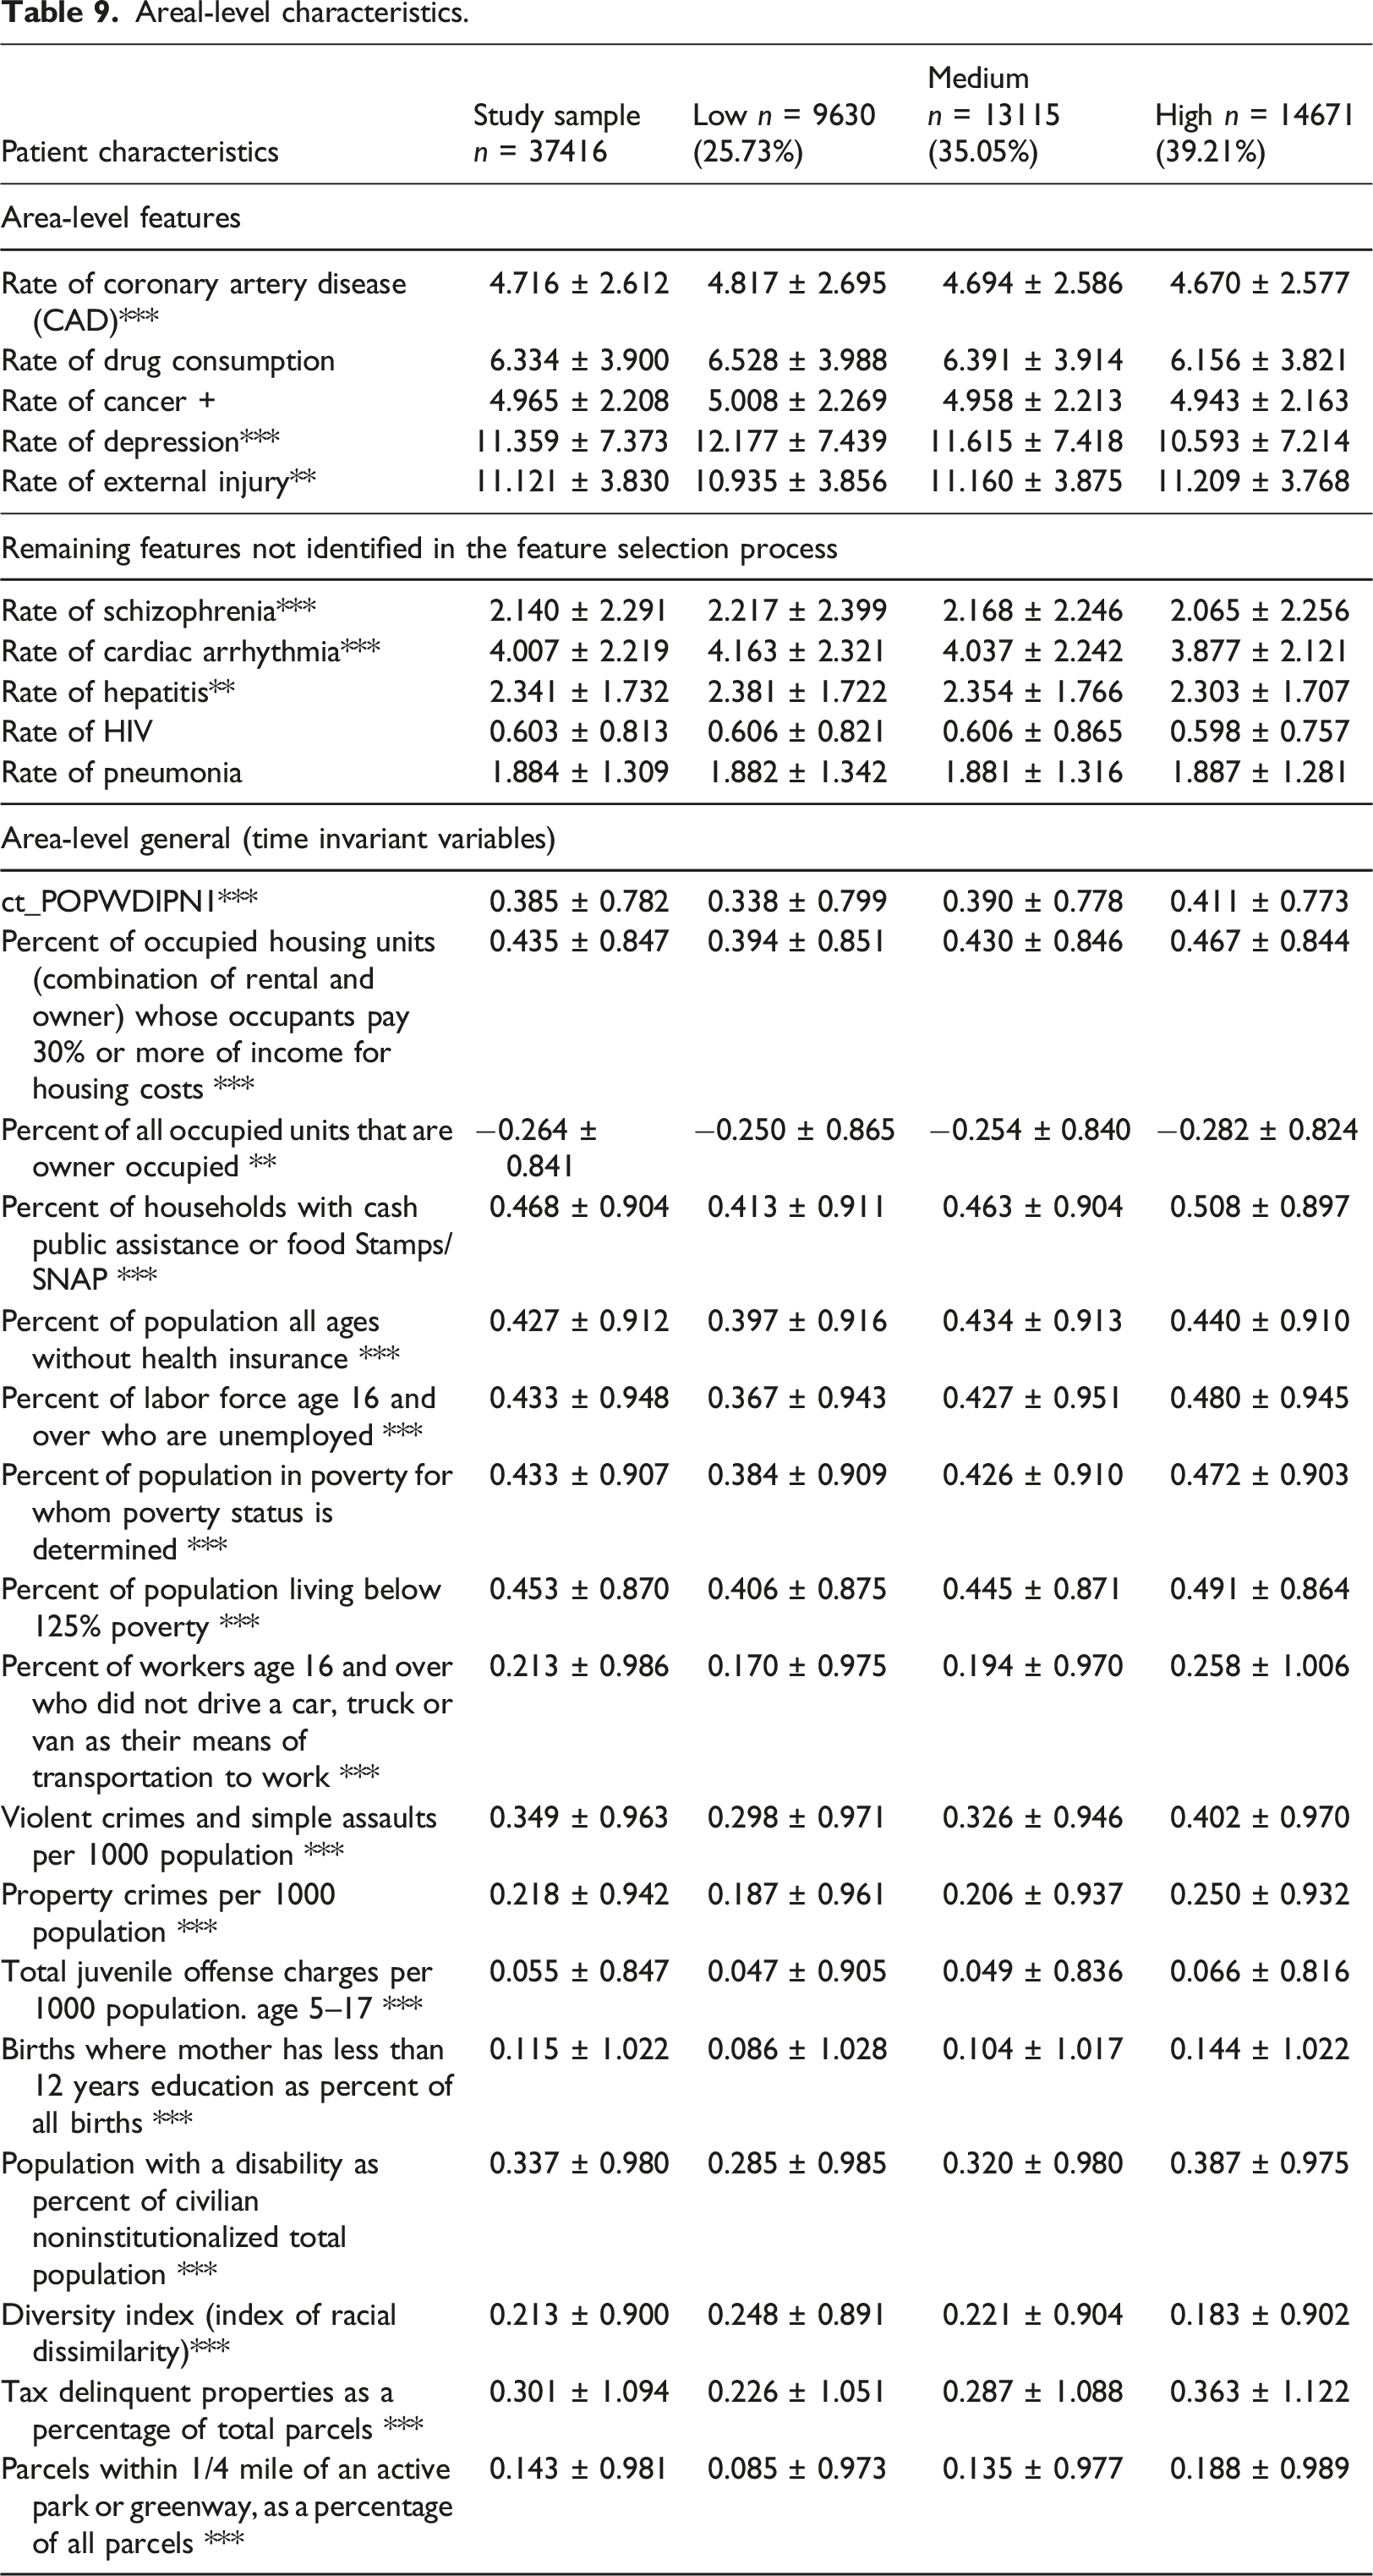
Area-level characteristics.
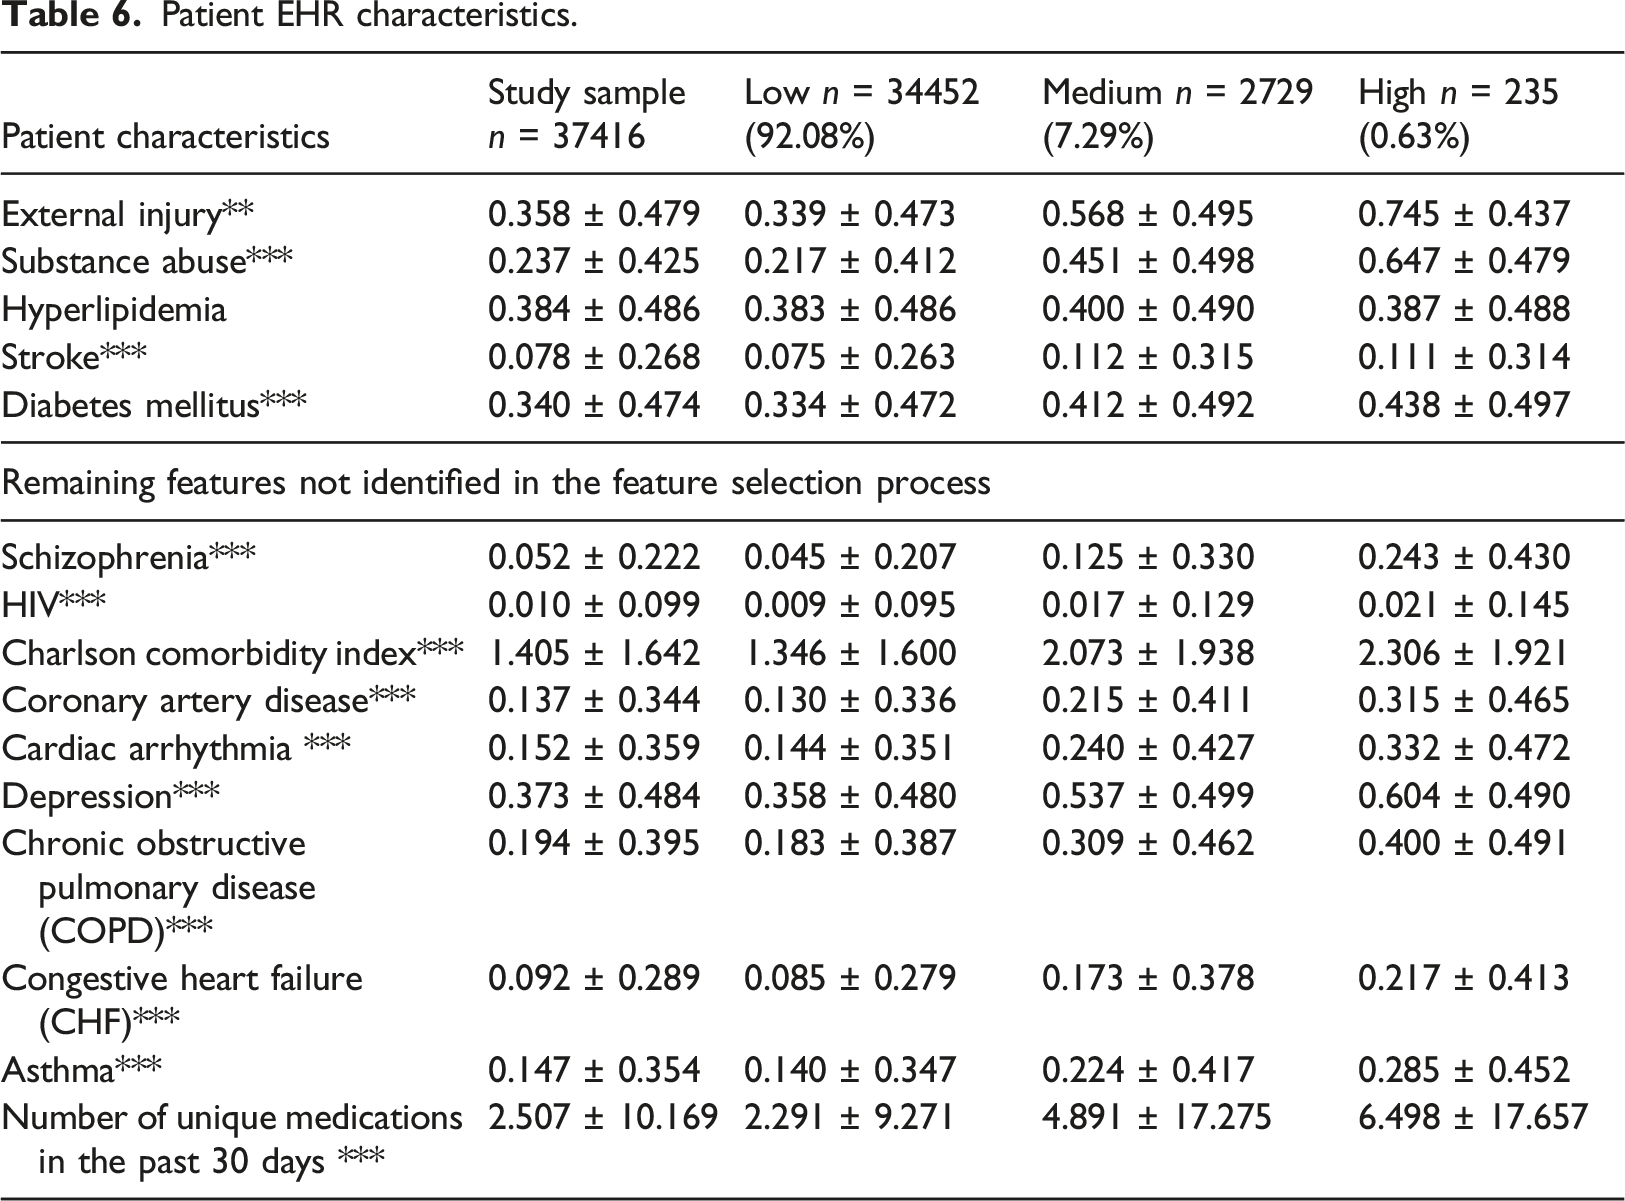
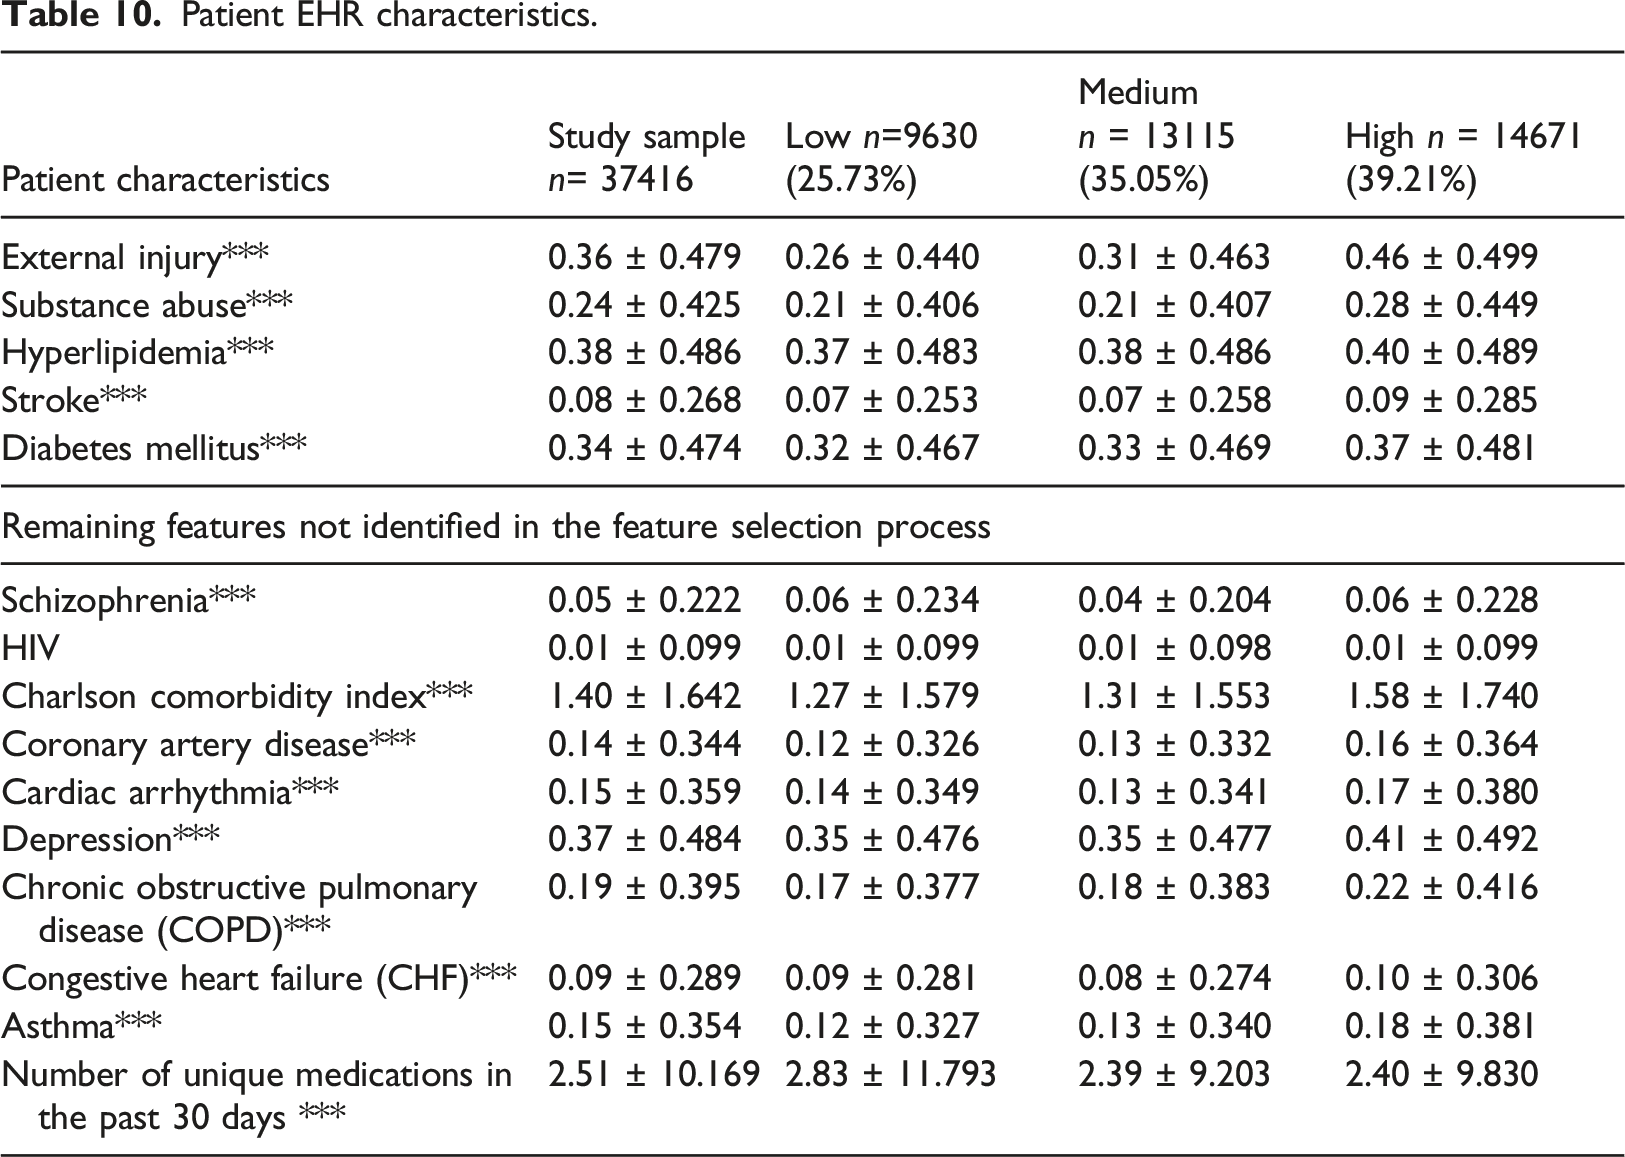
Patient EHR characteristics.
Patient HIE characteristics.
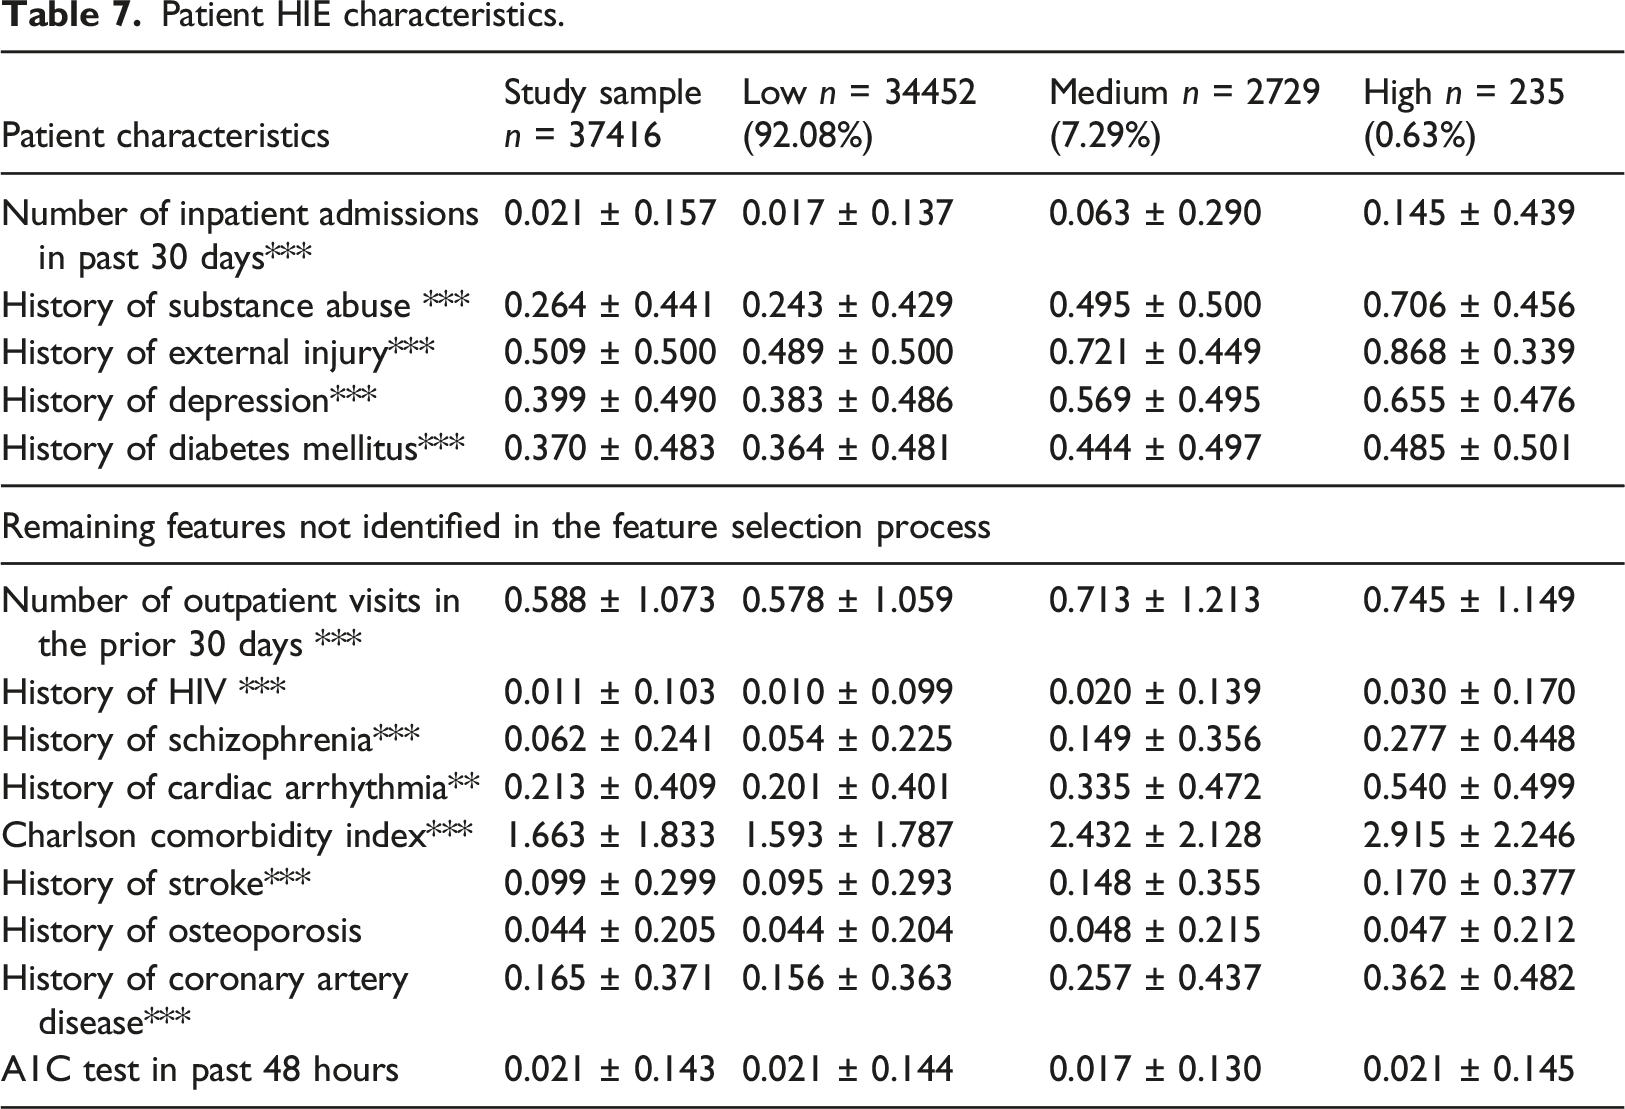
Another key issue is regarding the values of the variables. For the time-invariant variables such as age, gender and race, we show the basic value received from the first visit. For the time-variant variables such as the reason for the ED visit and its related diagnoses, we show the last and most-recent value received from the last visit that each patient has in our data (if a patient has three visits it would be the third value, and if she had eight visits it would be the eighth one).
Gender and Race were significantly different across the groups, as well as the average number of ED visits (Table 4). The mean age is approximately 50 in all trajectories. The riskier groups the higher the percentage of male patients, the higher the percentage of White, and the greater number of visits. For riskier groups (medium and high as compared to low risks groups), there were more ED visits associated with behavioral diagnoses, emergency conditions (as opposed to a non-emergent issue), and alcohol usage. Riskier groups were more likely to occur during weekends (Table 4).
Table 5 shows that all area-level characteristics were significantly different across the groups except the diversity index measure. Concerning the area-level properties, only cancer and depression (lower rates for the riskier groups) and injury rates (higher for the riskier groups) were significantly different across the groups (For riskier trajectories, there are fewer patients with consumption of drugs, cancer and depress high rate).
All Patient EHR characteristics were significantly different across the groups beside a history of hyperlipidemia (Table 6). The trend was that there are more patients with injuries, consumption of drugs, stroke, and diabetes mellitus as well as all the rest EHR characteristics (prevalence of diseases) as the risk of ED revisits is growing.
Table 7 describe that all patient HIE characteristics were significantly different across the group and much higher for riskier groups (except from history of osteoporosis and having an A1C test in past 48 hours).
Profiling the K-means Clustering
Patient and visit characteristics (Age, Gender, Race, EDs).
Areal-level characteristics.
Patient EHR characteristics.
Patient HIE characteristics.
For the lower risk group, the average last ED revisit average rates was 10.75%, for the medium group 11.69% and the higher one was 14.43%. Overall, the K-means show little differences between the averages of the last ED revisit rates. The superiority of the GBTM model was firstly pronounced with the GBTM big differences between the averages of the last ED revisit rates (GBTM: 11.1%, 26.68% and 56.59% from low, medium and high-risk groups respectively).
Race and average number of ED visits were significant different across the clusters (Table 8). For riskier clusters (medium and high as compared to low risks groups), there are more patients in that are associated with injury reasons. As compared to GBTM, the K-means the identified only 5 out of 10 variables as significantly different among the three clusters, whereas the GBTM identified 8 out of 10 variables as different.
It appears from Table 9 that all area-level general characteristics were significantly different across the clusters except the HIV and pneumonia rate. Concerning the area-level properties, only injury rates were lower for the low riskier groups. In both Tables 5 and 9, all area-level general characteristics were significantly different across the groups. The K-means model identified 24 out of 27 variables as significantly different among the three clusters, whereas the GBTM identified 20 out of 27 variables as different. However, the higher prevalence of the variables values in the K-means runs
All Patient EHR characteristics were significantly different across the groups beside HIV prevalence (Table 10). The trend was that for the riskiest cluster, there are substantially more patients with injury, consumption of drugs, stroke, and diabetes mellitus as well as most of the rest EHR characteristics (prevalence of diseases). The K-means and the GBTM models both identified 14 out of 15 variables as significantly different among the three groups.
Table 11. echoes somewhat the results of Table 10 describing that most patient HIE characteristics were significantly different across the group and much higher for riskier groups. As compared to GBTM, the K-means the identified 11 out of 14 variables as significantly different among the three clusters, whereas the GBTM identified 12 out of 14 variables as different.
According to the results, there are several quality differences between the two models. First, the Low-risk group identified by the GBTM is higher (92.08%) in contrast to K-means (25.73%) and the High-risk group identified by the GBTM is much smaller (0.63%) in contrast to K-means (39.21%), therefore the K-means cluster is much less deterministic (Table 4 vs. Table 8.), while the GBTM is much more actionable in terms of pinpointing the risky patients with much smaller group of high-risk patients. Second, the K-means shows little differences between the averages of the last ED revisit rates (10.75%, 11.68% and 14.43% from low, medium and high-risk groups respectively). The GBTM model has big differences between the averages of the last ED revisit rates (11.1%, 26.68% and 56.59% from low, medium and high-risk groups respectively).
Discussion and conclusions
This study found three distinct trajectories of ED revisit probabilities among a large sample of adult, urban, safety-net patients. The GBTM modeling approach used longitudinal data and shows the improved performance over other clustering methods. The application of advanced computational techniques, like GBTM, provide opportunities for health care organizations to better understand the underlying risks for the broader patient populations.
The heterogeneous nature of ED patients can make characterizing the entire population a challenge. Patients seek ED care for urgent, life threatening issues, but at the same time, the ED is a routine source of primary care for many, and especially unserved patients.38,39 Additionally, evidence shows that small percentages of patients accounts for the majority of ED visits. 40 Such variance requires risk stratification in order to find interventions to prevent revisits and to facilitate transitions to other care settings. 19 Consistent with this situation, we identified three distinct subpopulations with widely varying probabilities for a revisit within a single ED setting. The highest risk group had higher proportions patients with ED visits associated with behavioral diagnoses, alcohol & substance abuse, injuries, COPD diagnosis and diabetes. Each of these factors individually have been associated, to various degrees, with ED over utilization.40,41 Identifying those patients who are likely to be members of high-risk trajectories enables healthcare organizations to develop early interventions.
The identification of distinct trajectories of ED revisit probabilities within the population has practical considerations for both clinicians as well as health care managers. For clinical care, inferences about individual patient prognosis and eventual clinical outcomes are useful in treatment decisions and care management planning. Health care managers have the responsibility of ensuring and planning for adequate organizational resources to effectively support care plans and clinical decisions. Understanding the entire number of patients at different probabilities for revisits helps staffing and resource allocation. Likewise, following changes in trajectory size or composition over time, may be tools for health care leaders to better assess and monitor dynamics and changes within their overall patient populations.
Additionally, ED revisit risk groups varied by characteristics derived from HIE data as well as area-based measures. The former illustrates the potential value of additional datasets in risk stratification data. 20 For example, the average number of hospital visits in the prior 30 days increased substantially across risk groups. Through the HIE, we were able to obtain accurate counts from such admissions from across the state. Data from a single institution would have underestimated the total number of visits. The differences between the area-level measures across the risk groups also illustrates the role of social and environmental contexts in patient utilization. Our models included both “traditional” measures of social determinants like area poverty, household composition, employment, etc. as well as area-level measures of disease burden. While differences existed by social determinant measures, the extent was minimal because the sample was drawn from a single urban area (thus minimizing socioeconomic variation). Our models do indicate, however, that area-level measures cannot be substitutes for individual level measures. 42 The highest risk group had the lowest area prevalence of depression and substance abuse, which is opposite from the individual-level measures.
Methodologically, this paper contributes through the comparison of GBMT with the more widely used clustering method, K-means. The better performance of GBTM is important; K-means was less deterministic than the GBTM meaning the High-risk group identified by the K-means has much more patients than the GBTM high risk group. As access to longitudinal data increases and the computational requirements for such advanced data mining models becomes easier, time-series methods like GBTM are better positioned to be more informative approaches to risk stratification. The methodology presented here is generalizable to larger cohort sizes with a differing number of ED visits as well.
Finally, as access to longitudinal data increases and the computational requirements for such advanced data mining models becomes easier, time-series methods like GBTM are better positioned to be more informative approaches to risk stratification. The methodology presented here is generalizable to larger cohort sizes with a differing number of ED visits as well.
Limitations
Our work has several limitations. First, the study was limited to a single healthcare organization in the United States. As such the factors associated with high risk for revisits may not be generalizable other countries with differing health system structures as readmission rates vary widely internationally. 43 Similarly, the results may not generalize to another outcome measures such as length of stay.
Future research
Our work can be immediately expanded into two ways that increase external validity. First, the approach of employing time-series methodologies for longitudinal stratification, instead of cross-sectional methods, could be applied to other outcomes of interest such as hospital readmissions or kept (or no-show) appointments. Second, the work on ED revisit could be expanded to additional populations and areas to assess the consistency of the identified trajectories.
Conclusions
Risk stratification may be a step to help address the challenge of ED service utilization. GBTM is an advanced computational technique that effectively identified at risk groups by leveraging the longitudinal information.
Footnotes
Declaration of conflicting interests
The author(s) declared the following potential conflicts of interest with respect to the research, authorship, and/or publication of this article: JV is a founder and equity holder in Uppstroms, LLC, a health technology company.
Funding
The author(s) disclosed receipt of the following financial support for the research, authorship, and/or publication of this article: This work was supported by the Robert Wood Johnson Foundation through the Systems for Action National Coordinating Center (ID: 75549).