
Abstract
Repeated emergency department visits have become a serious challenge worldwide. Despite prior research indicating that laboratory results may provide early alerts about such patients on their upcoming adverse events, few studies have examined their role as a critical indicator of the stability of a patient’s medical condition over time. We model and analyze the developmental trajectories of patients’ creatinine levels, a key laboratory marker of serious illness, as a potential risk stratification mechanism across many emergency department visits. We apply group-based statistical methodology to electronic health record data of 70,385 patients, with 3–15 emergency department visits, to identify and profile these trajectories for the entire population, for males and for females. Results reveal three distinct creatinine-based trajectory groups over time with significantly differing characteristics that may enable targeted interventions for each group. Future research will incorporate additional disease markers to identify longitudinal factors leading to repeated emergency department visits.
Keywords
Introduction
The problem of repeat visits to the emergency department (ED) by the same patients has become a challenge worldwide due to care quality, patient satisfaction, and financial concerns.1,2 There is a long and rich history of investigating patients’ ED visits, particularly to understand who is likely to be hospitalized,3–5 and understanding the factors contributing to this behavior. In this article, an ED visit refers to a patient presenting at a hospital’s ED unit for emergency care that may/may not result in a hospitalization, whereas a hospitalization refers to an inpatient stay. Such patients are especially challenging for health systems; however, there are only limited studies that have explored repeat ED visits by the same patients. Previous studies mostly do not follow multiple ED visits leading to hospitalizations for the same person over time.6,7 This study proposes a longitudinal perspective for exploring patterns in this behavior using the value of laboratory markers as a potential indicator of serious illnesses that result in multiple ED visits.
By leveraging the availability of a rich and unique multi-year healthcare dataset extracted from the electronic health record (EHR) and the health information exchange (HIE) systems of the largest healthcare maintenance organization (HMO) in Israel, this study analyzes longitudinal patterns in ED visits using group-based trajectory models (GBTM), estimated using a specific laboratory-based clinical marker of serious illness. In particular, using a routinely collected laboratory test result, our research question was to understand how the trajectory of its progress over 3–15 separate ED visits stratifies the patient population with potentially differing repeat-visit risk profiles. We examine the distinct trajectories and their composition, and the relationship of these trajectories to some patient characteristics. This is important because the knowledge from this analysis can help health systems to identify those patients who are likely to be stratified into high-risk trajectories of ED visits and develop early interventions to treat and respond to the factors leading to such occurrences. Insights from this analysis may also provide new evidence of the impact of laboratory markers and spur investigation of additional markers for this increasingly complex problem.
Background
ED visits in Israel
In Israel, an advanced information technology-enabled healthcare delivery system and universal coverage have led to relatively stable repeat ED visits and hospitalization and readmission rates in the last decade. 8 Israel’s Ministry of Health has deployed an incentive program for health maintenance organizations (HMOs) implementing initiatives to reduce these occurrences, including extensive use of health information technology. To facilitate these interventions, physicians send the patient’s medical records through an HIE to the relevant clinicians in the community. 2 Policy implications and concrete steps to lower these rates are also starting to emerge. However, despite these efforts, they remain unacceptably high. 9
Creatinine level as a clinical indicator of patient health stability
Despite intense research over the past decade, models of patient level factors such as medical comorbidities, basic demographic data, and clinical variables are much better able to predict mortality than repeat visits or readmission risk.10–12 Broader social, environmental, and medical factors such as access to care, social support, and functional status contribute to this risk in some models, but the utility of such factors has not been widely studied. 13 With healthcare organizations operating under constrained resources, there is increasing interest in identifying patients at the highest risk of costly complications and repeat ED visits and resultant hospitalizations using routinely collected laboratory data. 14
In this study, we investigate the role of patients’ creatinine level, which is routinely obtained via a blood test for most ED patients, in tracking and identifying patients at high risk of repeat ED visits. The level of serum creatinine in the blood is a key indicator of kidney function. Increased creatinine levels in the blood point to possible diseases or conditions that affect kidney function and frequently lead to multiple ED visits. Studies have shown that the creatinine level is an important indicator for tracking repeat visits and many types of complications, particularly for multi-morbid patients. The standard normal values for the test range between 0.6 and 1.2 mg/dL, with variations in the ranges based on gender and age. We used creatinine results (retrieved from the EHR) for each patient who had between 3 and 15 visits during the study period of 4 years, which provided sufficient data from a sizable population to generate some useful insights.
Study setting and data
This study is based on data from a large Israeli HMO, listed as one of the world’s largest non-governmental HMOs, serving over 3.8 million customers and employing more than 9000 physicians. About 14 years ago, the HMO deployed an EHR and established an HIE network linking all the hospitals in its network. The system gathers historical clinical and administrative data from the HMO’s hospitals, community clinics, and other points of care such as labs and imaging facilities. The data include patients’ demographics, medications, sensitivities, lab and imaging results, past diagnoses, and clinical procedures.
We extracted data from the EHR and the HIE system on ED visits from 2005 to 2008. There were 815,114 ED visits at the seven main hospitals owned by the HMO, with creatinine results (at discharge) available. We apply a longitudinal, statistical method to test our hypothesis that laboratory results, such as creatinine levels, can be useful in stratifying patients at higher risk of repeat ED visits. We selected 70,385 patients with 501,047 ED visits who experienced between 3 and 15 ED visits for varied conditions. We chose three or more ED visits (that may or may not have resulted in hospitalization) in order to obtain at least three episodes for the same patients to enable the longitudinal analysis. Similarly, we decided to limit the data to at most 15 visits since the number of patients with 16 or more visits dropped off significantly in our dataset.
For the reasons described earlier, we targeted serum creatinine levels from the laboratory results for analysis of potential progression in the severity of patients’ health conditions that may indicate increased likelihood of multiple ED visits. Consultations with collaborating physicians resulted in the identification of several covariates for analysis that could impact this outcome. These included both time-stable covariates, such as gender that was measured at the outset of the study, as well as a time-varying covariate, namely, the current age of the patient at each visit (recorded in the EHR). A developmental trajectory analysis method, applying a semi-parametric, group-based, statistical approach, was used to generate the trajectories of creatinine levels in the patient population15,16 that may capture the changing disease severity status, resulting in increased risk of repeat ED visits.
Methods
Background on longitudinal trajectories
Longitudinal trajectories of an outcome of interest, such as multiple ED visits, are important to analyze to develop better interventions at the appropriate time to mitigate adverse effects in heterogeneous populations. Under different assumptions and empirical approaches, finite mixture models such as growth mixture models (GMMs), 17 covariate latent class models, 18 and GBTM 19 and others aim to identify and profile a small set of latent trajectories that group individuals into distinct longitudinal clusters that best match the patients’ evolving characteristics. Thus, GBTM and its recent modeling extensions 20 allow discovery of latent trajectories over time for group-based analysis versus individual-level analysis, such as the typical shape of ED visits of subgroups in the population, identify how population subgroups are statistically distinct, examine influence of covariates of interest, and so on. This is not possible with standard fixed effects models or difference-in-difference approaches.
Trajectory analysis
A developmental trajectory describes the course of an outcome over age or time.
15
We applied a method called group-based trajectory modeling (GBTM) to study the developmental course of creatinine levels in the body over multiple ED visits of each patient. GBTM is an application of finite mixture modeling, assuming that the population distribution of trajectories arises from a finite mixture of unknown order J.
15
It models the distribution of outcomes conditional on a time-related metric such as time from the onset of treatment; that is, the distribution of outcome trajectories is denoted by
GBTM model produces (1) the shape of the trajectory for each group, which may differ not only in terms of level but also in terms of the direction and rate of movement, and (2) the size of the group, which is the proportion of population following the trajectory. The method has been widely applied not only in the social and behavioral sciences to study phenomena such as technology adoption in healthcare 21 and crime 15 but also in clinical settings to study the developmental course of disease progression. 16
Model selection is based on the Bayesian information criterion (BIC) that determines the number of trajectory groups as well as the order of the polynomials for each trajectory group. 15 We tested models with a minimum of three trajectories and a maximum of five trajectories and compared their results to select the model with maximum BIC. Further details on the methodology are available in Vermunt. 18
Modeling and generating the creatinine trajectories
In building the GBTM model, we assumed that the unit of analysis was the ED visit and the time-related metric of interest was the creatinine level of each patient at each visit, which was noted in the EHR at the time of each discharge. Age and gender were included as time-stable covariates measured at the start of the study, while the current age of the patient at each visit was modeled as a time-varying covariate. The GBTM implementation in STATA was used with the BIC criterion to determine the number of trajectories and the order of the polynomial function over time that identified the shape of each trajectory. 22
Results
Descriptive statistics
Table 1 provides a brief summary of the key characteristics of patients and their visits to the EDs, as captured in the data. The average duration per patient between the first and last visit to the ED is slightly higher for females than it is for males; the creatinine levels are higher than the norm for both men and women; however, the male creatinine levels, as well as the number of admissions and the number of actual admission days (length of stay (LOS)) for admitted patients, are significantly higher.
Patient characteristics and comparison between male and female subjects.
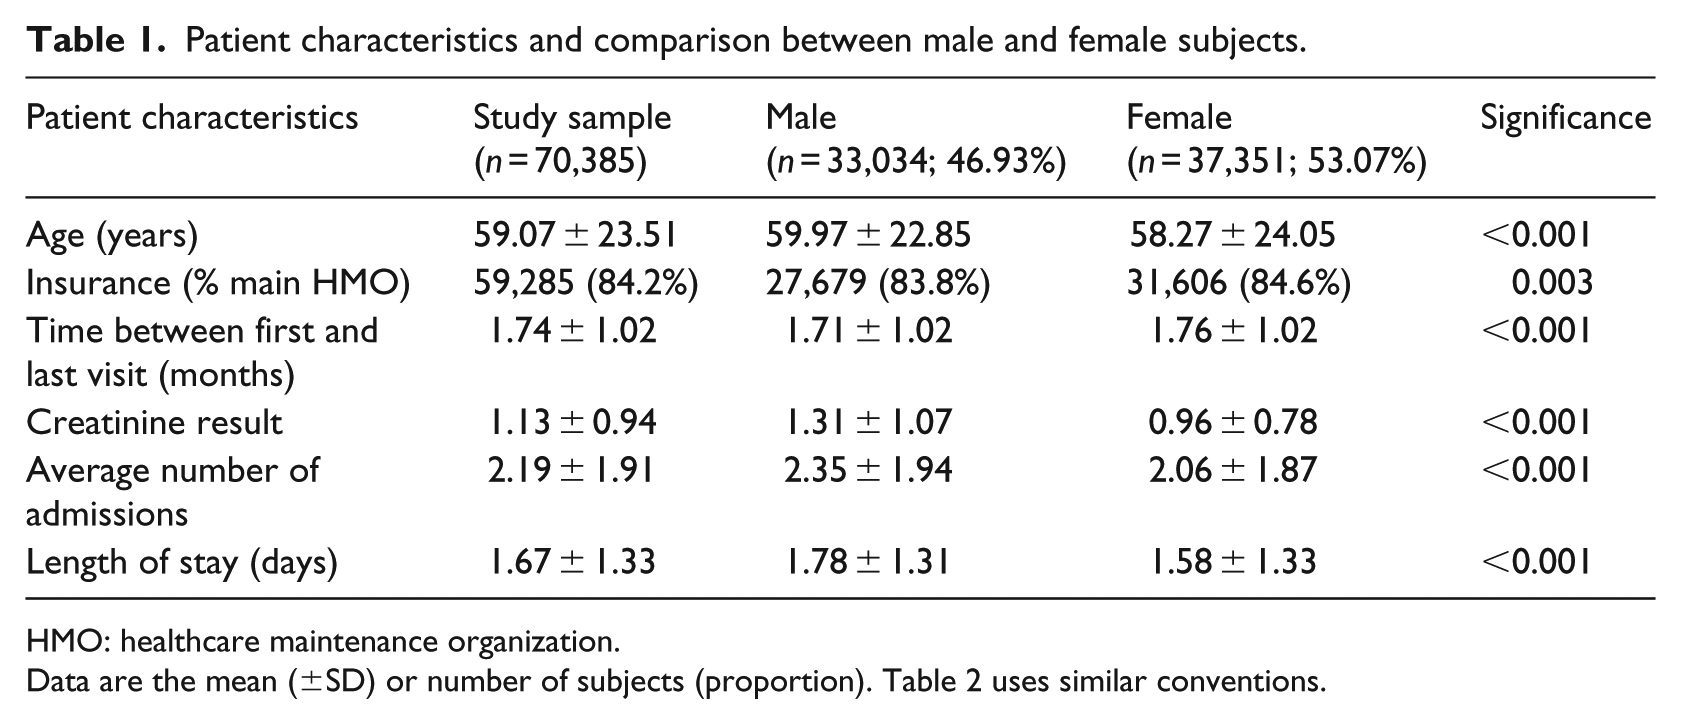
HMO: healthcare maintenance organization.
Data are the mean (±SD) or number of subjects (proportion). Table 2 uses similar conventions.
Analyzing ED visits
Descriptive statistics
Table 2 shows a decrease in the number of patients as the number of visits increases, as expected. However, we also observed a consistent increase in the mean and standard deviation of the creatinine values.
Creatinine results by ED visits.
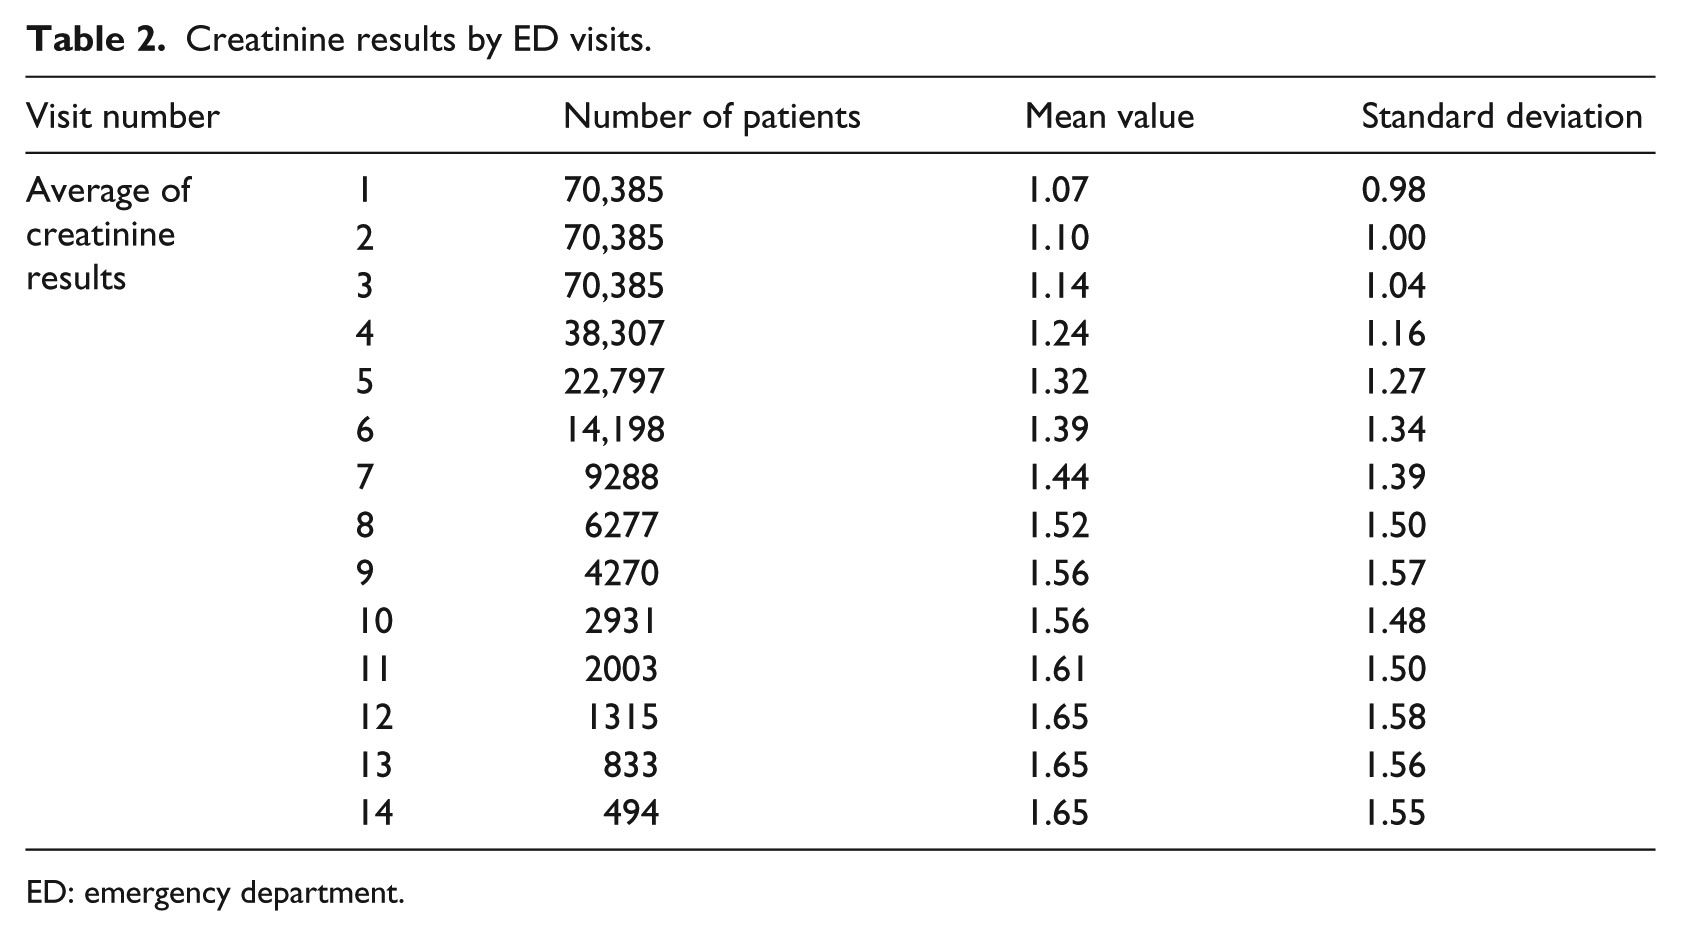
ED: emergency department.
Trajectory analysis results
Using the GBTM statistical software (STATA), we examined the characteristics of the patients and their visits in each of their trajectory groups to better understand the factors that delineated them. The full model of patients’ creatinine levels over 3–15 visits to the EDs in each of the seven hospitals is depicted in Figure 1, where the X-axis shows the number of visits and Y-axis shows the average creatinine level of each group at each visit. Applying the BIC criterion for model selection to the study setting showed that the GBTM clustered 70,385 patients into three distinct trajectories based on patients’ creatinine levels. Group 1, the first level, included 52 percent of the population who were in relatively stable health, with their average creatinine level almost unchanged over the multiple visits, and was dubbed the Stable group. Group 2 included 41.4 percent of the population with increasing average creatinine levels over the study period and was defined as the Worsening group. Group 3, with 6.6 percent of the population, started at a high average creatinine value which continued to increase over the entire study period and was called the Chronic group.
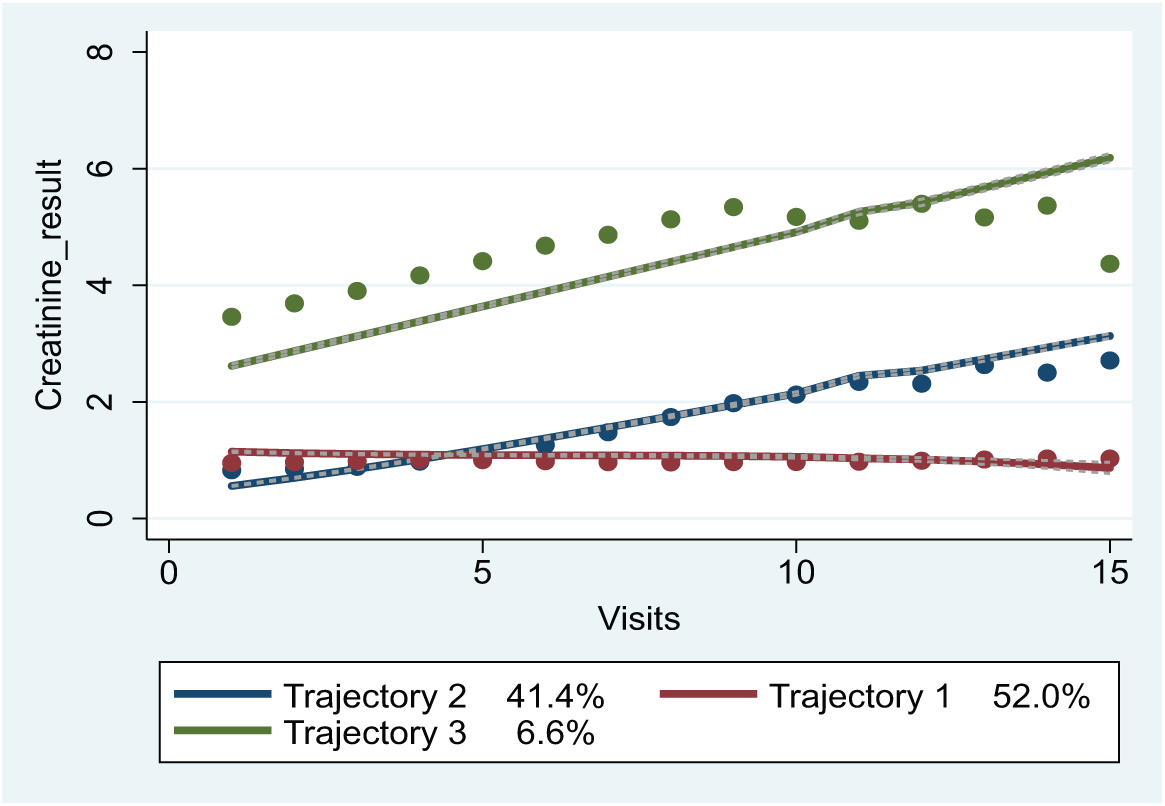
Model trajectories (line—predicted; dot—actual).
Table 3 also shows an increase in the number of admissions to inpatient stay in this order: Group 2, Group 1 and Group 3 for both males and females. Aside from “Time between first and last visit,” Group 3 had the highest values for number of admissions, number of visits, LOS, and age. When comparing groups 1 and 2, surprisingly, all parameters aside from age were higher for Group 1; however, the average age of Group 2 patients was the lowest. Group 2 may have been younger patients developing serious health conditions who have high creatinine values.
Characteristics of the trajectory groups and comparison between male and female subjects across the three groups.
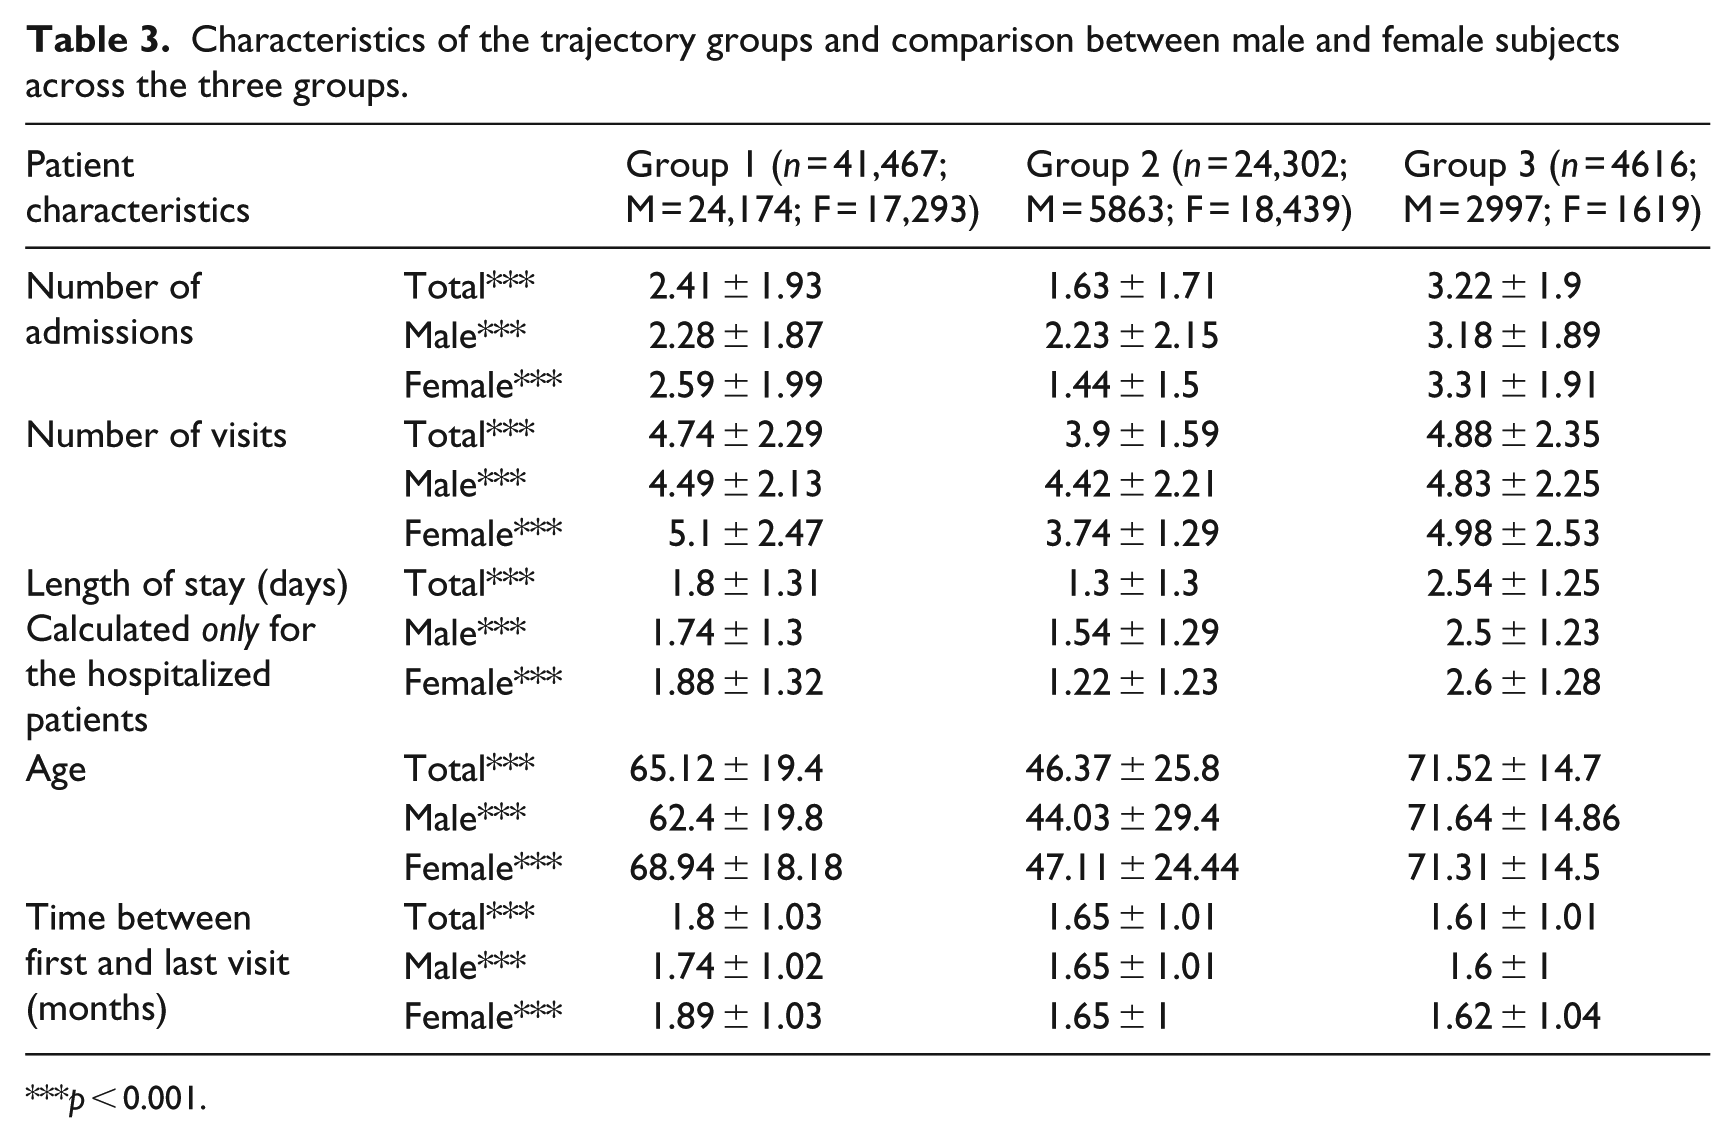
p < 0.001.
Table 4 shows the changes in the average levels of creatinine over time and by group membership. Group 3 showed the highest average creatinine levels over the entire study period which increased until the tenth visit and then became stable. When comparing Groups 1 and 2 only, Group 1 had higher average levels of creatinine on the first four visits and from the fifth visit Group 2 had higher average levels of creatinine (as also shown in Figure 1 above).
Average creatinine results by ED visits and trajectories.
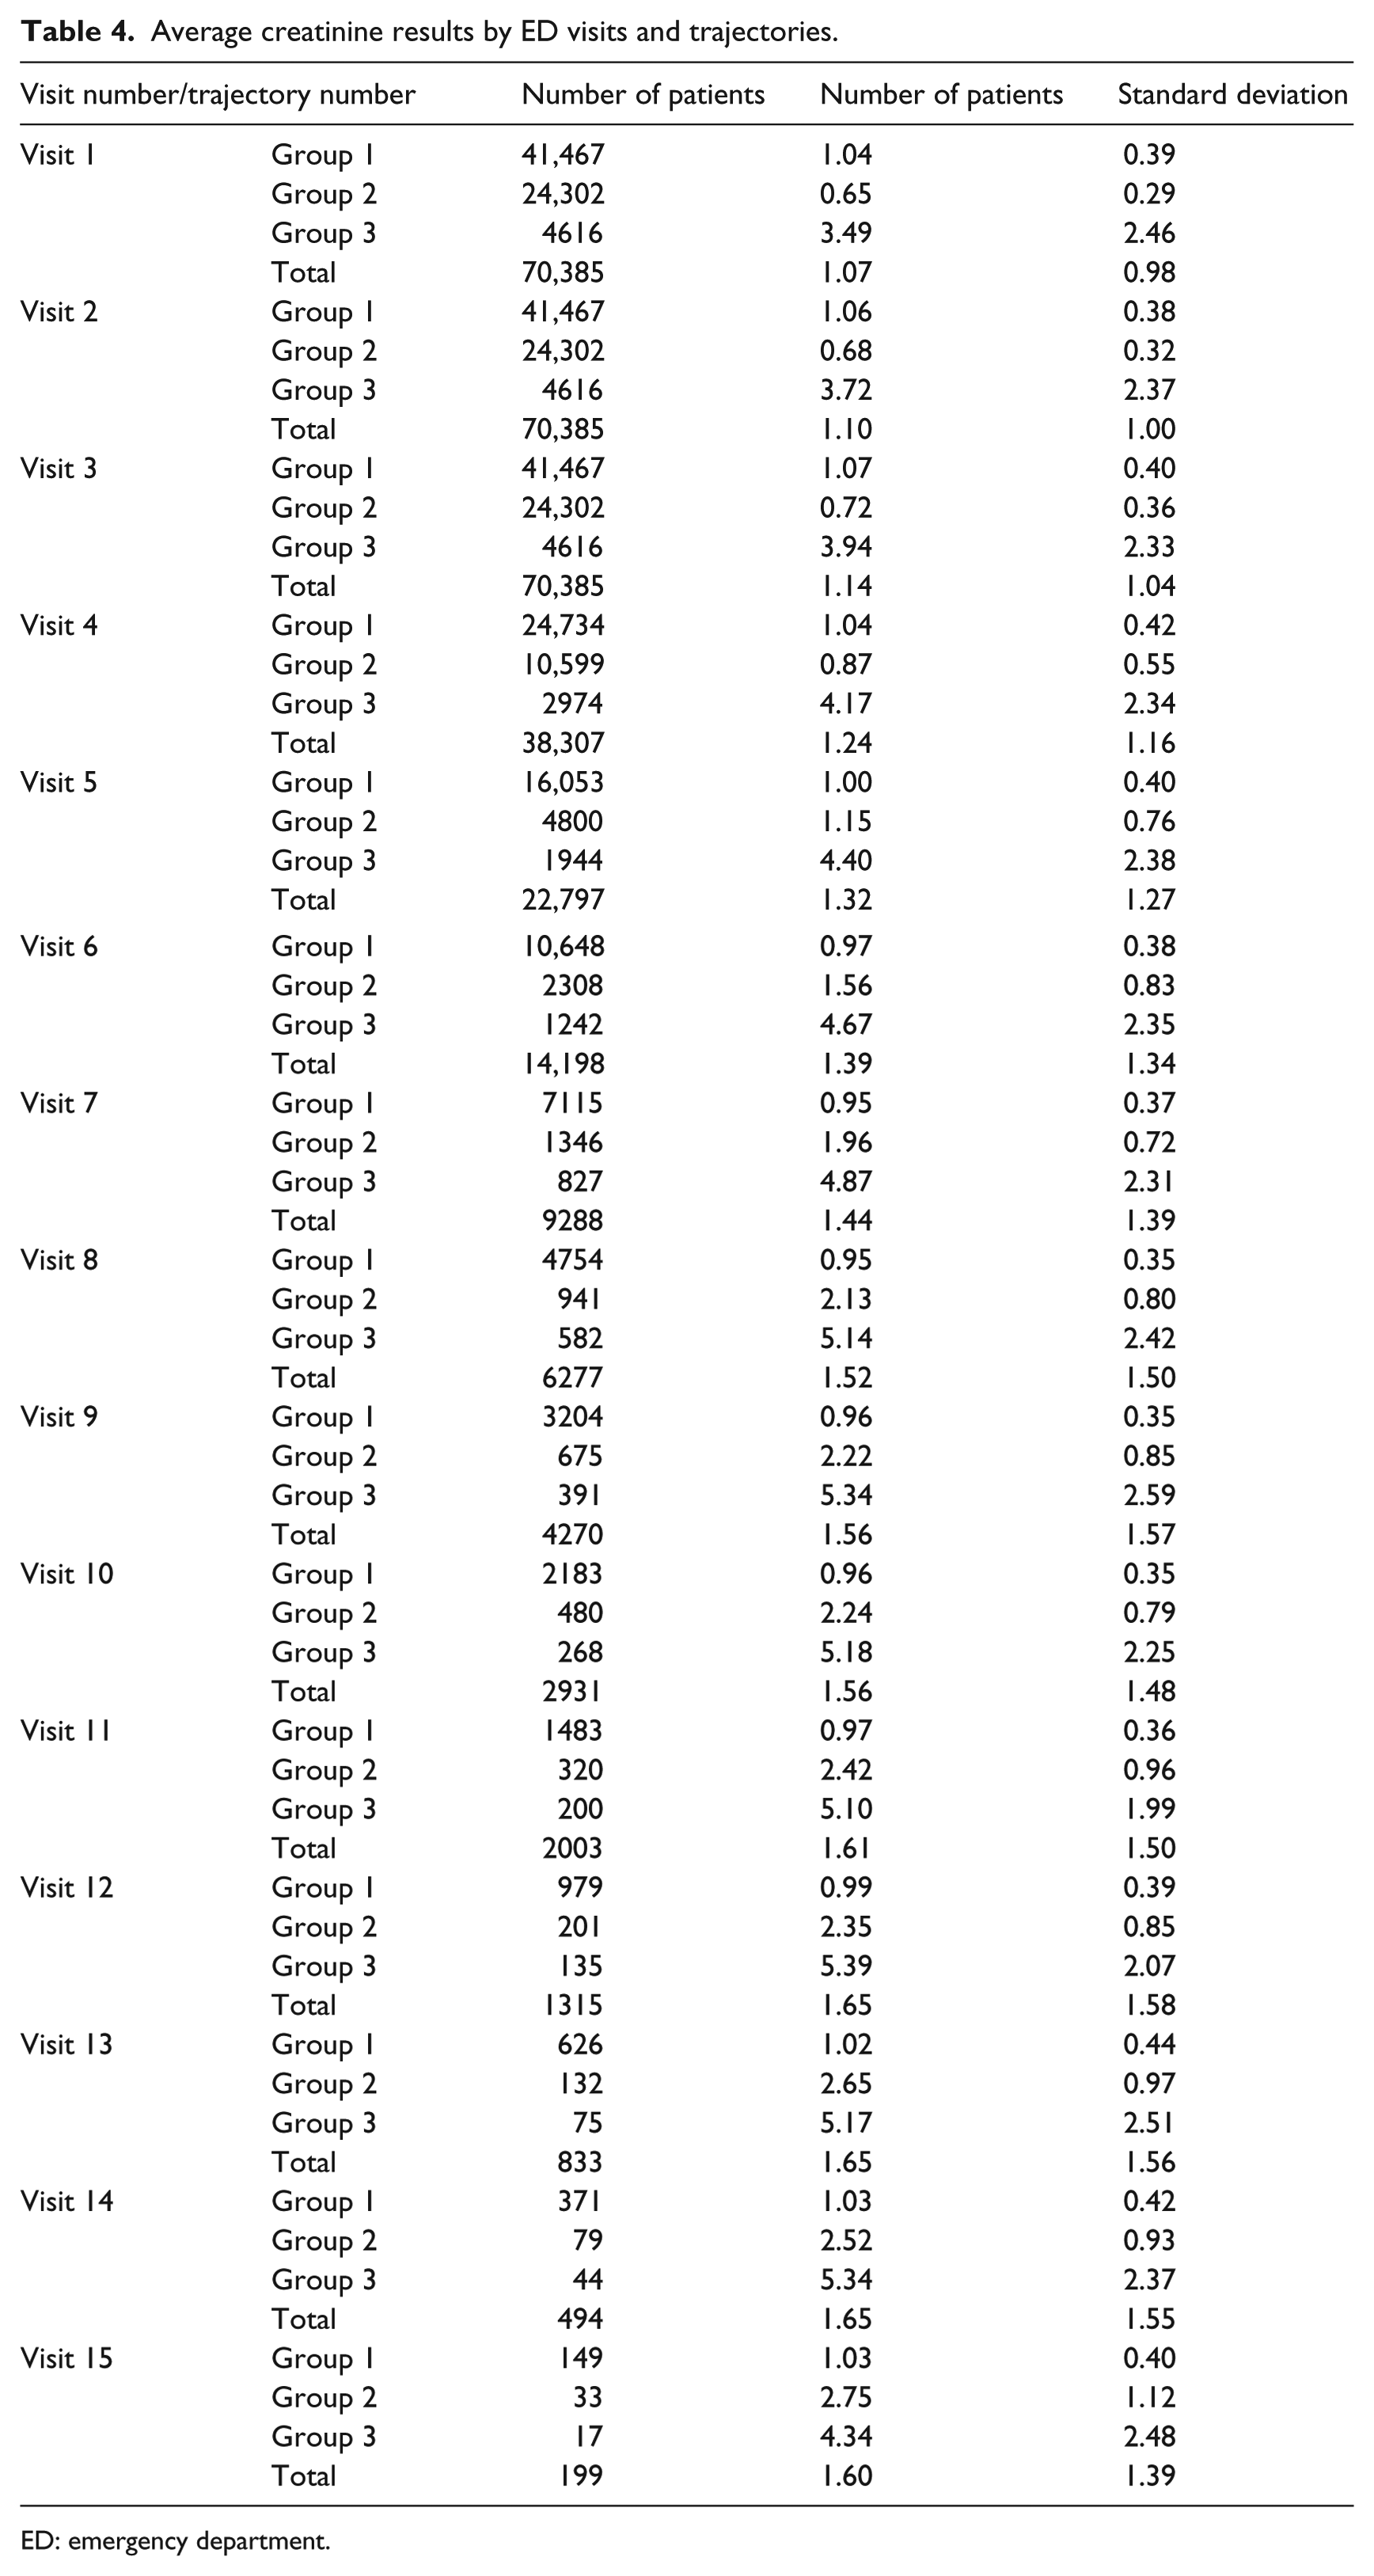
ED: emergency department.
This may in part be explained by the results in Table 5 that summarize the distribution of the top 10 diagnoses across the three groups. It is interesting to note that Group 3 patients had a low likelihood of being discharged with an inconclusive diagnosis (as compared to Groups 1 and 2) and also had a higher prevalence of serious diagnoses including heart diseases, nephritis, nephrotic syndrome, urinary tract infection (UTI), and nephrosis, indicating that they may have multiple, complex health conditions that increase their repeated ED visits. A larger proportion of Group 1 patients had heart disease, which is common in older patients and results in longer lengths of stay. Similarly, when using creatinine as the marker of disease progression, patients in Groups 2 and 3 had a similar likelihood of being diagnosed with kidney disease and related conditions but less than Group 3. Group 2 patients had the highest likelihood of being diagnosed with non-infective enteritis and colitis. Note that the creatinine results obtained in many ED visits in all groups helped differentiate diverse groups of patients with undefined diagnoses. The two main diagnoses (“General Symptoms” and “Ill-Defined and Unknown Causes of Morbidity and Mortality”) accounted for 36.7 percent of all cases. Thus, the method suggested here may lead to early detection of problems and a better assignment of patients to groups with more similar problems when a definite diagnosis has not been made.
Distribution of the 10 main diagnoses across groups.
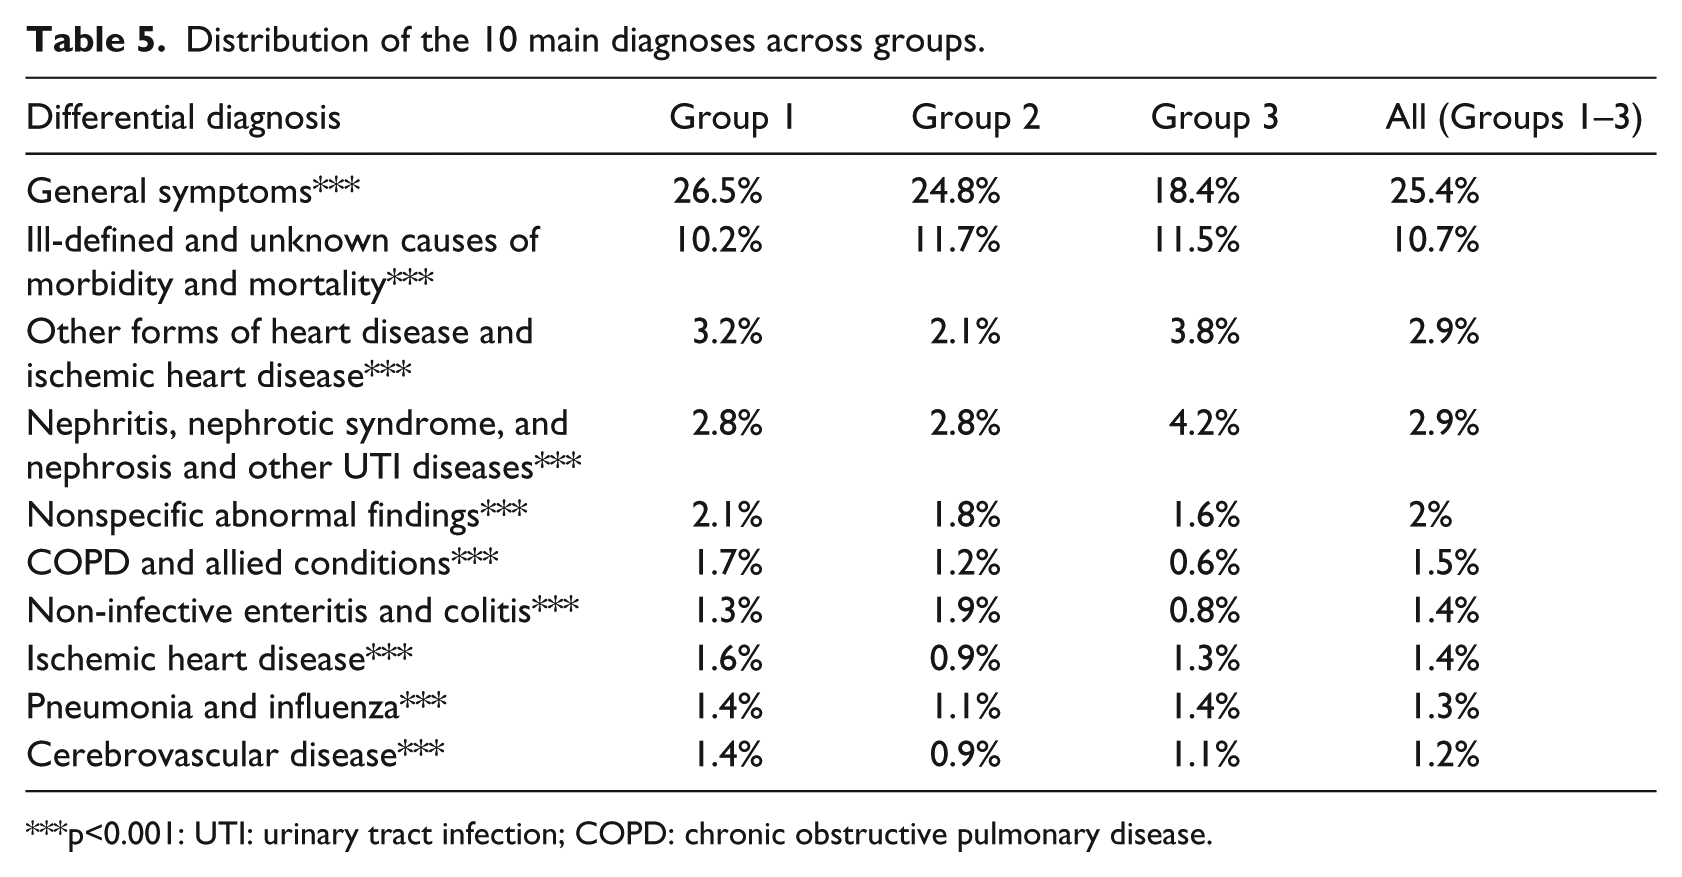
p<0.001: UTI: urinary tract infection; COPD: chronic obstructive pulmonary disease.
Trajectory analysis results—comparison between genders
The results were further analyzed by running the models again separately for gender, given the baseline differences in creatinine levels in males versus females. Figure 2 shows the full model for males versus females, and Tables 6 and 7 summarize the distribution of the top 10 diagnoses across the three groups.
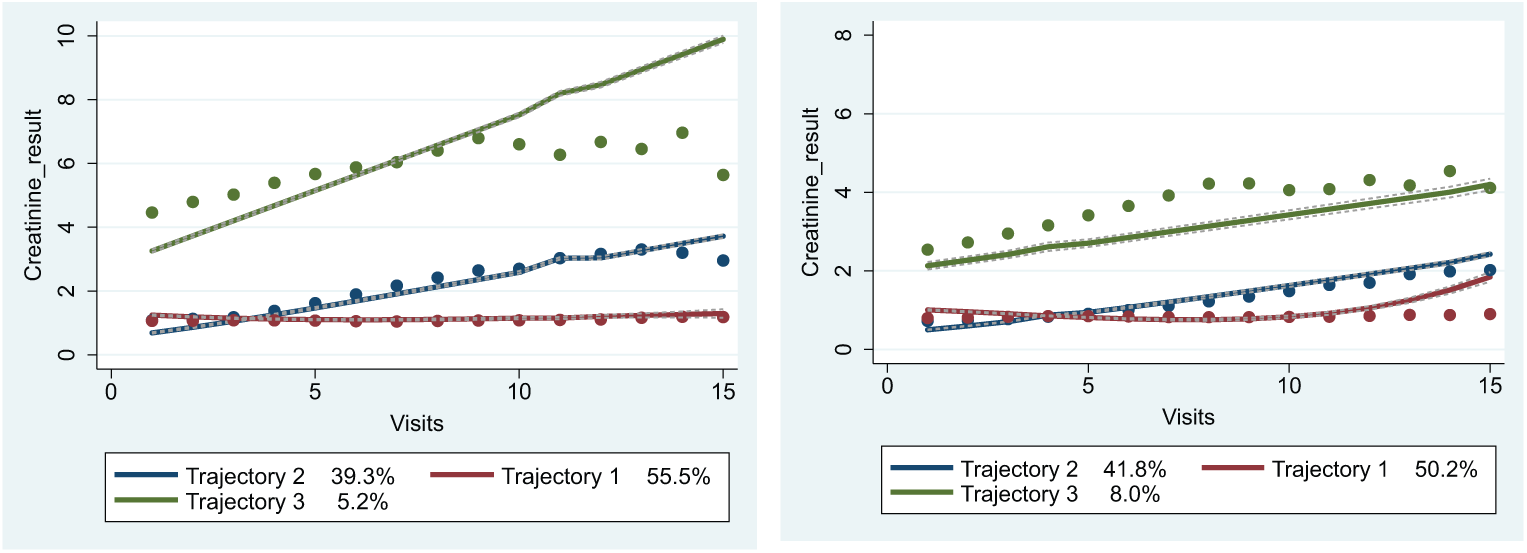
Estimated trajectories for (a) males and (b) females (line—predicted; dot—actual).
Distribution of the 10 main diagnoses across males in all groups.
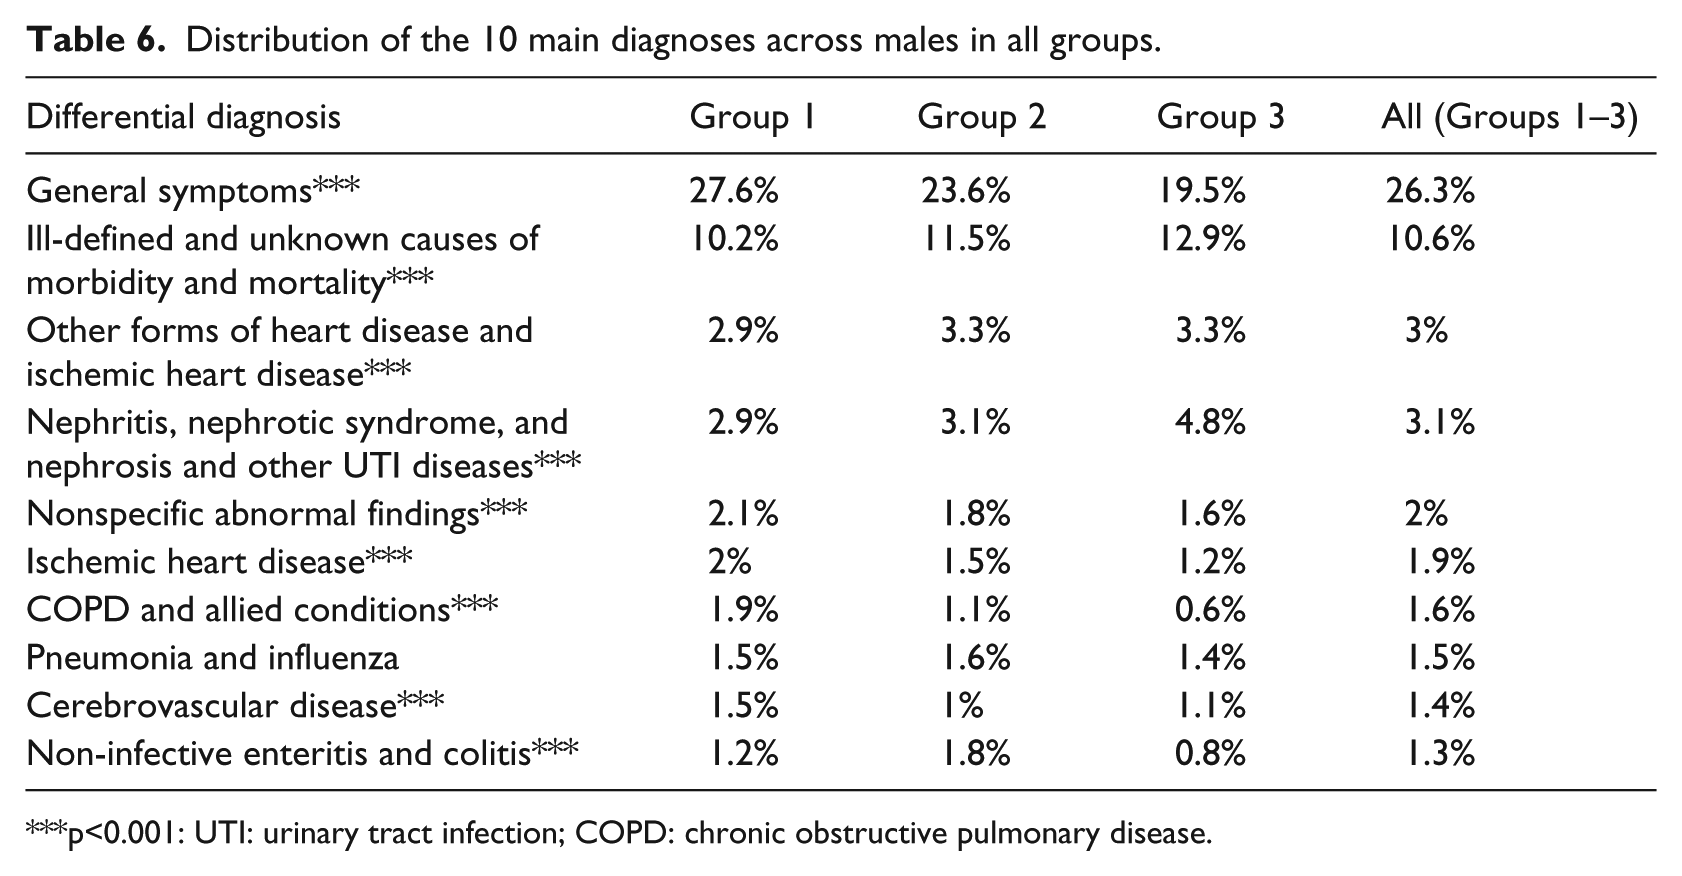
p<0.001: UTI: urinary tract infection; COPD: chronic obstructive pulmonary disease.
Distribution of 10 main diagnoses across females in all groups.
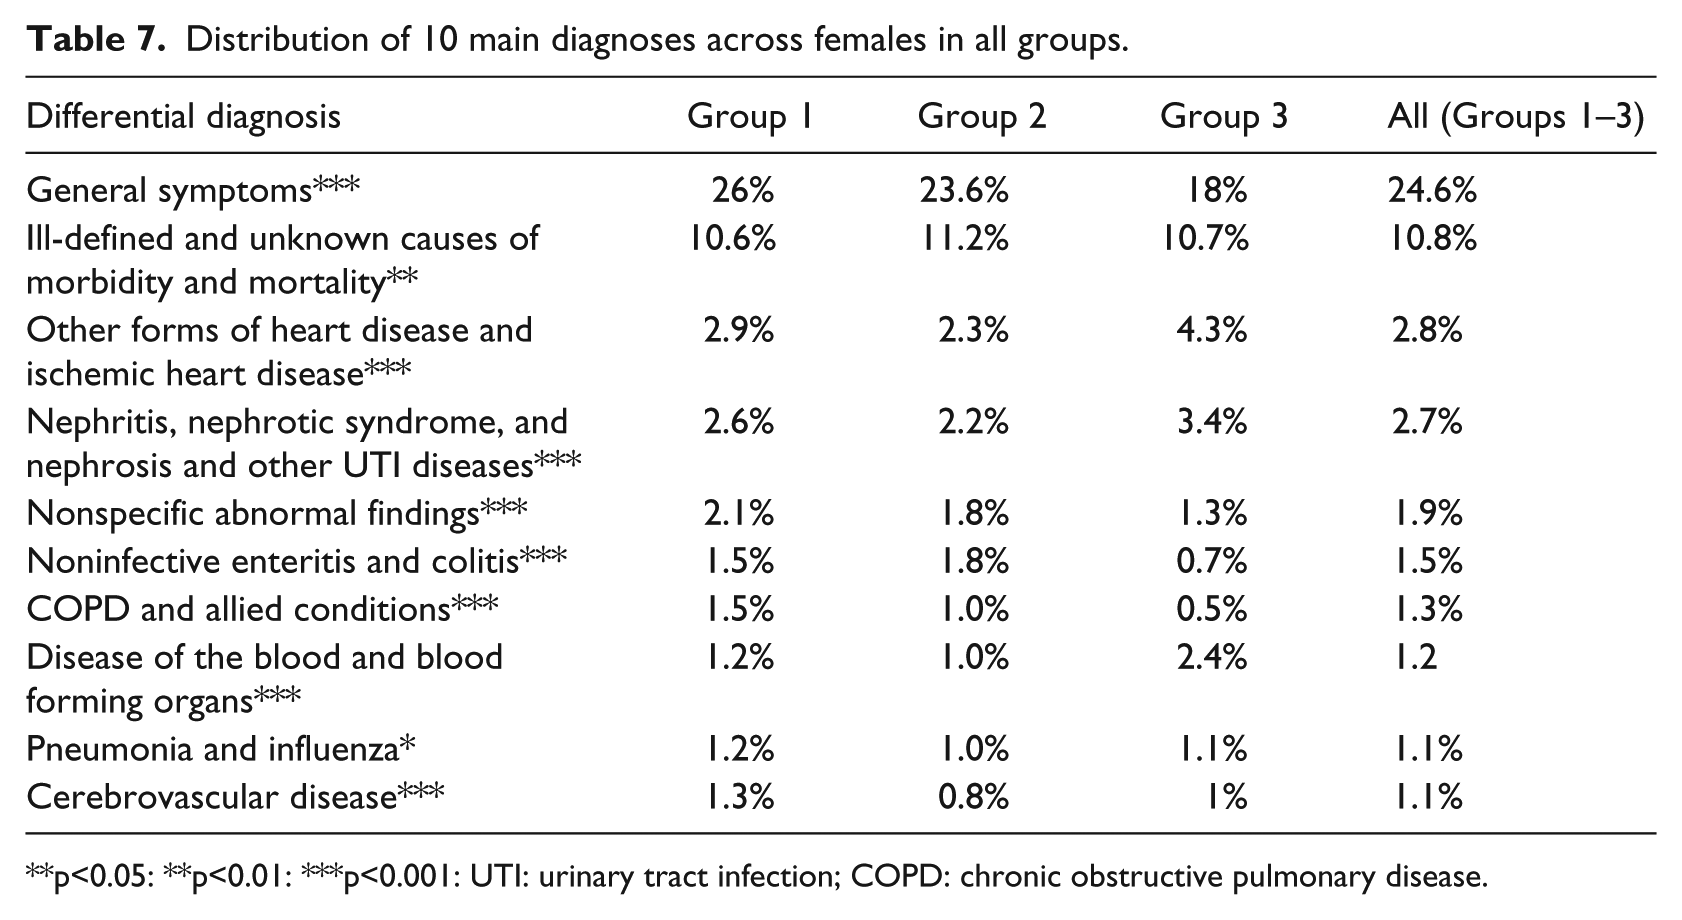
p<0.05: **p<0.01: ***p<0.001: UTI: urinary tract infection; COPD: chronic obstructive pulmonary disease.
Trajectory analysis results: comparing gender
For the males (Figure 2(a)), we obtained very similar trajectories for the full patients’ model (Figure 1) showing clear differences across the trajectories over time. In Group 1, the first level included 55.5 percent of the population who are in relatively stable health, whose average creatinine level remained almost unchanged over the multiple visits. Group 2, the Younger Patient Group, included 39.3 percent of the population with increasing average creatinine levels over the study period who may be developing high levels of creatinine over time (even younger than the full patients’ model—see Table 3). Group 3, the Chronic Group with 5.2 percent of the population, showed high and increasing average creatinine levels over the entire study period,
For the females (Figure 2(a)), we obtained close but somewhat less similar trajectories to the full patients’ model than to the men’s model (Figure 1) showing clear differences between trajectory 3 (Chronic group) and the other two trajectories but small differences between trajectories 1 and 2 over time. Group 1, the first level, includes 41.8 percent of the population, Group 2 includes 50.2 percent of the population and Group 3, with 8 percent of the population.
Trajectory analysis results: Distribution of 10 main diagnoses across gender
Tables 6 and 7 summarize the distribution of the top 10 diagnoses across the three groups for each gender. Overall, for males, we observed the same 10 main diagnoses (Table 6) in the same order as the full patients’ model (Table 5) for the first five main diagnoses and minor deviations for the remaining five main diagnoses, with slightly more diagnoses of Ischemic Heart Disease and chronic obstructive pulmonary disease (COPD) and fewer diagnoses of Non-infective Enteritis And Colitis.
Overall, for females, the 10 main diagnoses were similar except for one difference with the full patients’ model (Table 5). Instead of the ischemic heart disease diagnosis, the disease of the blood and blood forming organs was the 10th main diagnosis for women (Table 7), and there were fewer diagnoses of pneumonia and influenza, COPD, and no ischemic heart disease within the 10 main diagnoses.
Discussion and conclusion
The objective of this study was to utilize a clinical laboratory marker of disease progression to track and stratify ED visit patients at high risk of repeat ED visits. When applying GBTM to patient data from EDs across Israel, our findings suggest that creatinine level–based risk stratification can potentially identify distinct groups of patient trajectories based on their presentation in the ED. These groups differ by age, gender, admission rates, number of ED visits, and average LOS that may enable risk stratification of the patient population for targeted interventions. More specifically, applying GBTM to patient data helped identify a small group of elderly patients with repeat ED visits who showed high initial creatinine values which increased over the entire study period. This chronic group may be specifically targeted for interventions that require close oversight and intensive management. The young group (Group 2) who appeared to have rising creatinine to moderate levels could also be targeted for intervention. Preventing chronic kidney impairment in younger patients may have considerable effects on their burden of illness and provision of healthcare over many years. The gender-based models show some differences that may allow for the design of more personalized services since there is a known difference between gender in their creatinine values. Converting the creatinine values to the glomerular filtration rate (GFR) that standardizes creatinine measurements by adjusting for age and gender (which used in many parts of the world) is a viable approach to overcoming the current limitation. It is important to note that overall, we observed similar trajectories for both genders, which reinforces the strength of the full model. Furthermore, all the models identified one small group of chronic patients who may benefit from highly targeted interventions.
Finally, the findings may enable health policy makers to better understand the potential of HIE networks and interoperability between various points of care by showing the value of information regarding laboratory tests and its potential to analyze patient ED visits, in terms of repeat-visit risk. This could promote the utilization and implementation of such systems. The methodology is generalizable to larger cohort sizes with a differing number of ED visits as well. This research followed multiple visits for the same patients over a long time period as compared to previous studies which mainly account for the first consequence of the first visit.6,11,23
An important limitation of this study is that it only deals with the retrospective data of ED patients, which is very different from prospectively risk stratifying ED patients. Future research should address this important issue to provide valuable information to hospital decision makers at the point of patient discharge. Furthermore, the current model only includes only one laboratory variable, though a highly critical one (this is the only clinical marker that is consistently captured in our database). Future research should further investigate other clinical markers of complex diseases and include additional risk factors such as critical vitals and other laboratory values, both time-stable and time-varying, to facilitate more nuanced risk prediction for ED visits. Similarly, insights from this study may be applied to encourage the use of A1C to identify high-risk patients with diabetes and endocrine diseases, lipid levels for cardiac diseases, and other clinical markers for other serious chronic conditions. These markers may be modeled jointly to yield useful and realistic insights for clinicians, particularly in the context of multi-morbid patients. This methodology and analysis can be applied to patient populations in any setting, independent of the organization of healthcare delivery.
Footnotes
Declaration of conflicting interests
The author(s) declared no potential conflicts of interest with respect to the research, authorship and/or publication of this article.
Funding
The author(s) disclosed receipt of the following financial support for the research, authorship, and/or publication of this article: This work was supported by a grant (No. 2015153) from the United States-Israel Binational Science Foundation (BSF).