
Abstract
Unplanned hospital readmissions have a high prevalence and substantial healthcare costs. Preventive intervention during hospitalization holds the potential for reducing readmission risk. However, it is challenging to develop individualized interventions during hospitalization because the causes of readmissions have not been clearly known and because patients are heterogeneous. This work aimed to identify potentially modifiable risk factors of readmission to help clinicians better plan and prioritize interventions for different patient subgroups during hospitalization. We performed the analysis of associations between the changes of potentially modifiable risk factors and the change of readmission status with association rule mining and statistical methods. Twenty-nine risk factors were identified from the association rules, and twenty-five of them were potentially modifiable. The association rules with potentially modifiable risk factors can be recommended to different patient subgroups to support the development of customized readmission preventive interventions.
Introduction
Unplanned hospital readmissions have imposed a significant economic burden on American society. In 2011, the total hospital costs for 30-day hospital readmissions reached $41.3 billion. 1 According to a 2019 report by the Healthcare Cost and Utilization Project (HCUP), 17.1% of Medicare beneficiaries experienced 30-day all-cause hospital readmissions in 2016, followed by Medicaid beneficiaries (13.7%), uninsured patients (11.8%), and patients with private insurance (8.6%). 2 As a result, reducing unplanned hospital readmissions has captivated policymakers as a goal that improves health care quality and reduces costs. 3 Since 2009, the Centers for Medicare and Medicaid Services (CMS) has been publicly reporting hospital-level 30-day risk-standardized readmission rates on the Hospital Compare 4 website, which allows patients to compare hospitals with government ratings. 5 In 2012, the Affordable Care Act 6 implemented the Hospital Readmission Reduction Program (HRRP) 7 to financially penalize hospitals with excessive readmission rates. As of January 2020, the HRRP has considered readmissions following acute myocardial infarction (AMI), chronic obstructive pulmonary disease (COPD), heart failure (HF), pneumonia (PN), coronary artery bypass graft (CABG), and total hip or knee arthroplasty (THA/TKA) in the calculation of readmission penalties due to high cost, substantial morbidity and mortality, and marked performance variations across hospitals. 8 The percentage of penalized hospitals and the amount of penalty have increased since the implementation of the HRRP. 9 In fiscal year 2020, 83% of 3129 HRRP eligible hospitals will be penalized with an estimated $563 million reduction in Medicare payments. 10
Existing unplanned hospital readmission (hereafter, referred to as “readmission”) reduction programs tend to focus on care transition and post-discharge interventions. However, one limitation of this approach is that they are mostly initiated near or after discharge when clinicians are no longer impactful on inpatient care. Preventive intervention during hospitalization is an under-explored area that holds the potential for reducing readmission risk. However, there are two challenges to deliver interventions during hospitalization. First, it is difficult to foresee the causes of readmissions because patients can be readmitted for many reasons. The CMS uses index admissions’ principal diagnosis codes and procedure codes to define the six HRRP eligible cohorts, but imposes no restriction on the causes of readmissions. According to an analysis of 217,767 index admissions with readmissions by Rosen et al. 11 about 60% of readmissions have different principal diagnoses, different diagnosis-related groups (DRG), or different procedures from the precedent index admissions. Second, it is challenging for clinicians to find a universal solution to reduce their readmission risk because patients are heterogeneous. Even if they share the same principal diagnoses and procedures in index admissions, they may have different combinations of comorbidities and social factors. It has been found that direct or indirect complications of patients’ comorbidities are the top causes of readmissions. 12 Social factors, such as demographics and socioeconomic status, can also influence readmission risk.13,14 Therefore, interventions should be customized for different patients based on their specific clinical and social factors.
Modifiable risk factors are risk factors that can be potentially controlled or treated by interventions. 15 It has been shown that the management of modifiable risk factors was effective in reducing the risk of undesired outcomes.16–19 Several works have investigated the identification or management of modifiable readmission risk factors. Stephens et al. 20 conducted a literature review and found that multi-faceted interventions and post-discharge clinic visits may be effective for reducing readmissions in children with medical complexity. Maddocks et al. 21 purposed to use rehabilitation to modify COPD readmission risk. Kelly et al. 22 reported that discharge to a skilled nursing facility was a modifiable risk factor for postoperative readmissions in major gastrointestinal resections. Brodsky et al. 23 found that the lack of a primary care provider and the number of hospital admissions caused by vaso occlusive pain episodes in the previous year were modifiable readmission risk factors for adults with sickle cell disease. Singh et al. 24 reported that obesity, comorbidities, medical complications, and hospital factors were modifiable readmission risk factors for THA. Garcia-Aymerich et al. 25 showed that a higher level of usual physical activity was a modifiable protective factor of COPD readmission. Boraiah et al. 26 obtained eight modifiable risk factors by performing a regression analysis on modifiable THA/TKA risk factors reported by other studies and clinical experience. Most of the reported modifiable risk factors are not timely, such as discharge disposition, medical history in last year. In addition, all of these modifiable risk factors were identified by population-based regression analyses and were not customizable for patient subgroups with different demographic and clinical background. As a result, they cannot be used in the delivery of interventions during hospitalization.
In this work, we purposed to identify patterns with potentially modifiable risk factors and recommend them to different patient subgroups to support the development of customized interventions. To identify potentially modifiable risk factors, we investigated a novel method to compare different index admissions of the same patients. Compared to traditional logistic regression-based approach 27 which can only study associations between risk factors and readmission status, this method allows us to further explore associations between changes of modifiable risk factors and the change of readmission status. It can also automatically identify patient subgroups based on demographic and clinical factors. This makes it possible to customize interventions for different patient subgroups. We focused on medical services for AMI, COPD, HF, and PN because they are targeted by the HRRP. Surgical services were not included in this analysis because surgical readmissions tend to be related to postoperative complications, 11 which are undesired outcomes of medical care. Surgical readmissions can be potentially reduced by minimizing the risk of complications during the care process.
Materials and methods
Study design
This study was a retrospective analysis of clinical data. We identified pairs of index admissions of the same patients and recorded the element-wise difference of each diagnosis’ existence and the difference of readmission status in each pair. For example, a patient has a pair of index admissions 1 and 2. This patient has diagnosis A in both index admissions and diagnosis B in index admission 1 only. Index admission 1 was followed with a readmission, and index admission 2 was not. The change of diagnosis in these two index admissions was “diagnosis B: true (T) → false (F)” and the change of readmission status was “readmission → no readmission.” Each patient has one pair of index admissions. We looked for associations between changes of diagnoses’ existence and the change of readmission status.
Data source and inclusion criteria
We purchased the 2014 Nationwide Readmissions Database (NRD) from the Agency for Healthcare Research and Quality (AHRQ). 28 The NRD is a discharge-level database available for each calendar year from 2010 to 2016 (as of November 2019). We chose the 2014 NRD because this data was the latest database including comorbidity information. The 2015 and 2016 NRDs do not contain this information. The 2014 NRD is about 12 GB with information from about 15 million discharges. It was derived from inpatient hospitalization data of 2048 hospitals in 22 states, which accounted for 51.2% of the U.S. population and 49.3% of all hospitalizations. 28 Patients can be tracked across different hospitals within a state by the verified and de-identified patient linkage numbers. 28
We constructed four separate cohorts for AMI, COPD, HF, and PN patients with the following criteria: (1) We captured index admissions with a discharge month from January to November in 2014. Index discharges in December were excluded because December was the last month available in the data and 30-day unplanned readmissions cannot be tracked. Eligible index admissions had a principal discharge diagnosis of AMI, COPD, HF, or PN based on the International classification of diseases, ninth revision, clinical modification (ICD-9-CM) codes used by the CMS. 29 The length of stay was longer than 1 day. (2) Patients were older than 18 at admission. They were not transferred to other hospitals and were alive at discharge. They did not leave against medical advice. (3) The gap between index admission discharge and readmission was between one and 30 days (inclusive). Patients could be readmitted for all causes except elective services or other scheduled care according to version 4.0 (ICD-9-CM) of the planned readmission identification algorithm used by the CMS. 29
Data preprocessing and transformation
The 2014 NRD contains information about admissions, patient demographics, hospital characteristics, diagnoses, and procedures. Diagnoses are available in both ICD-9-CM codes and Clinical Classification Software (CCS) categories. 30 We only kept the CCS-level diagnoses since ICD codes are too granular for this data mining analysis. They are represented as one principal diagnosis (DX1) and up to 29 secondary diagnoses (DX2 to DX30). We reshaped diagnoses into a sparse matrix by using the CCS-level diagnoses as attributes and values of true (T) and false (F) representing the presence and the absence of the corresponding diagnoses. We captured pairs of index admissions of the same patients. For each pair of index admissions, we took the element-wise differences of the readmission status and CCS-level diagnoses. We also extracted patients’ characteristics from the first index admission of each pair, including age, sex, primary insurance payer, type of the patient’s residing county, and median household income in the patient’s zip code. We only used one pair of index admissions of each patient. Attributes of the derived dataset are shown in Table 1.
Attributes of the derived dataset.
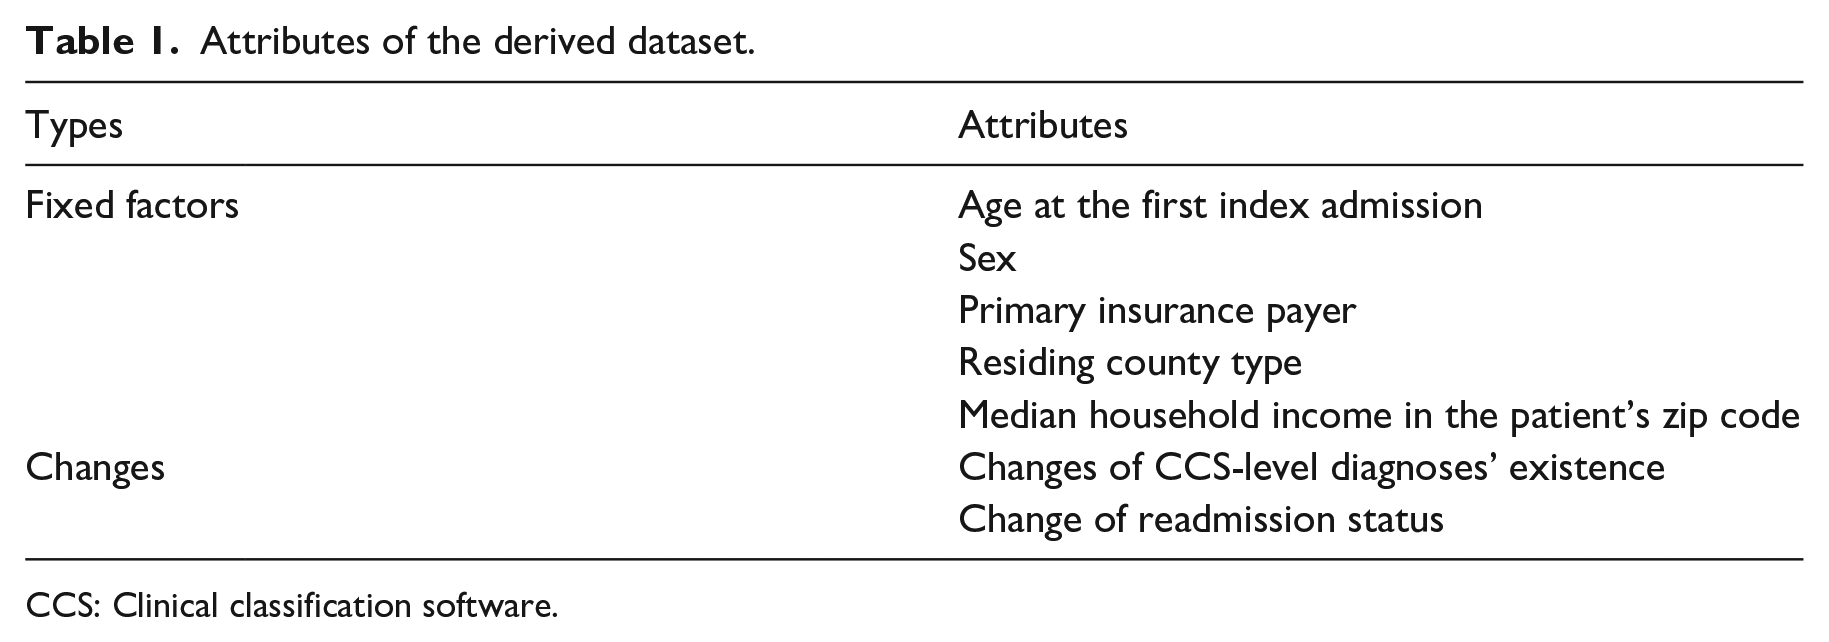
CCS: Clinical classification software.
Association rule mining
We performed association rule mining 31 to unearth association’s rules between changes of diagnoses and the change of readmission status. Association rule mining is an unsupervised data mining approach to discover associations between itemsets in the form of “IF {antecedent} THEN {consequent}.” We used the Apriori algorithm 32 to identify association rules with the consequent being the change of readmission status (e.g. “readmission → no readmission”). To ensure the association rules were interesting and non-trivial, we used support, confidence, and lift to filter out trivial association rules. The support is the frequency of a pattern occurring in all transactions ranging from 0 to 1. The confidence measures the percentage of transactions with the consequent given it contains the antecedent. The lift is the ratio of the observed support to expected support given the antecedent and the consequent are independent. A lift greater than 1 indicates the antecedent and the consequent are dependent on each other. Because the standard association rule mining may generate numerous spurious rules, 33 we performed Fisher’s exact test 34 to measure the statistical significance of the positive correlation between the antecedent and the consequent. We used a significance level of 0.05. A p-value greater than 0.05 indicates a spurious association rule occurring by chance. For all association rule mining experiments, we used 0.001, 0.75, and 1 as the minimum support, minimum confidence, and minimum lift, respectively. We also assessed each rule’s medical soundness and only kept rules with positive associations between a diagnosis change of “T → F” or “F → T” and “readmission → no readmission” or “no readmission → readmission.”
Results
Readmission rate and time gap
We found 70419, 313837, 349548, and 431149 eligible index admissions for the AMI, COPD, HF, and PN cohorts with the readmission rate of 14.1%, 18.6%, 19.9%, and 14.4%, respectively. Figure 1 shows distributions of gaps (in days) between discharges and readmissions for the four cohorts. It can be seen that as time goes towards the end of the monitoring window (30 days), the number of readmissions decreases. This indicates that readmissions tend to occur early after discharge.
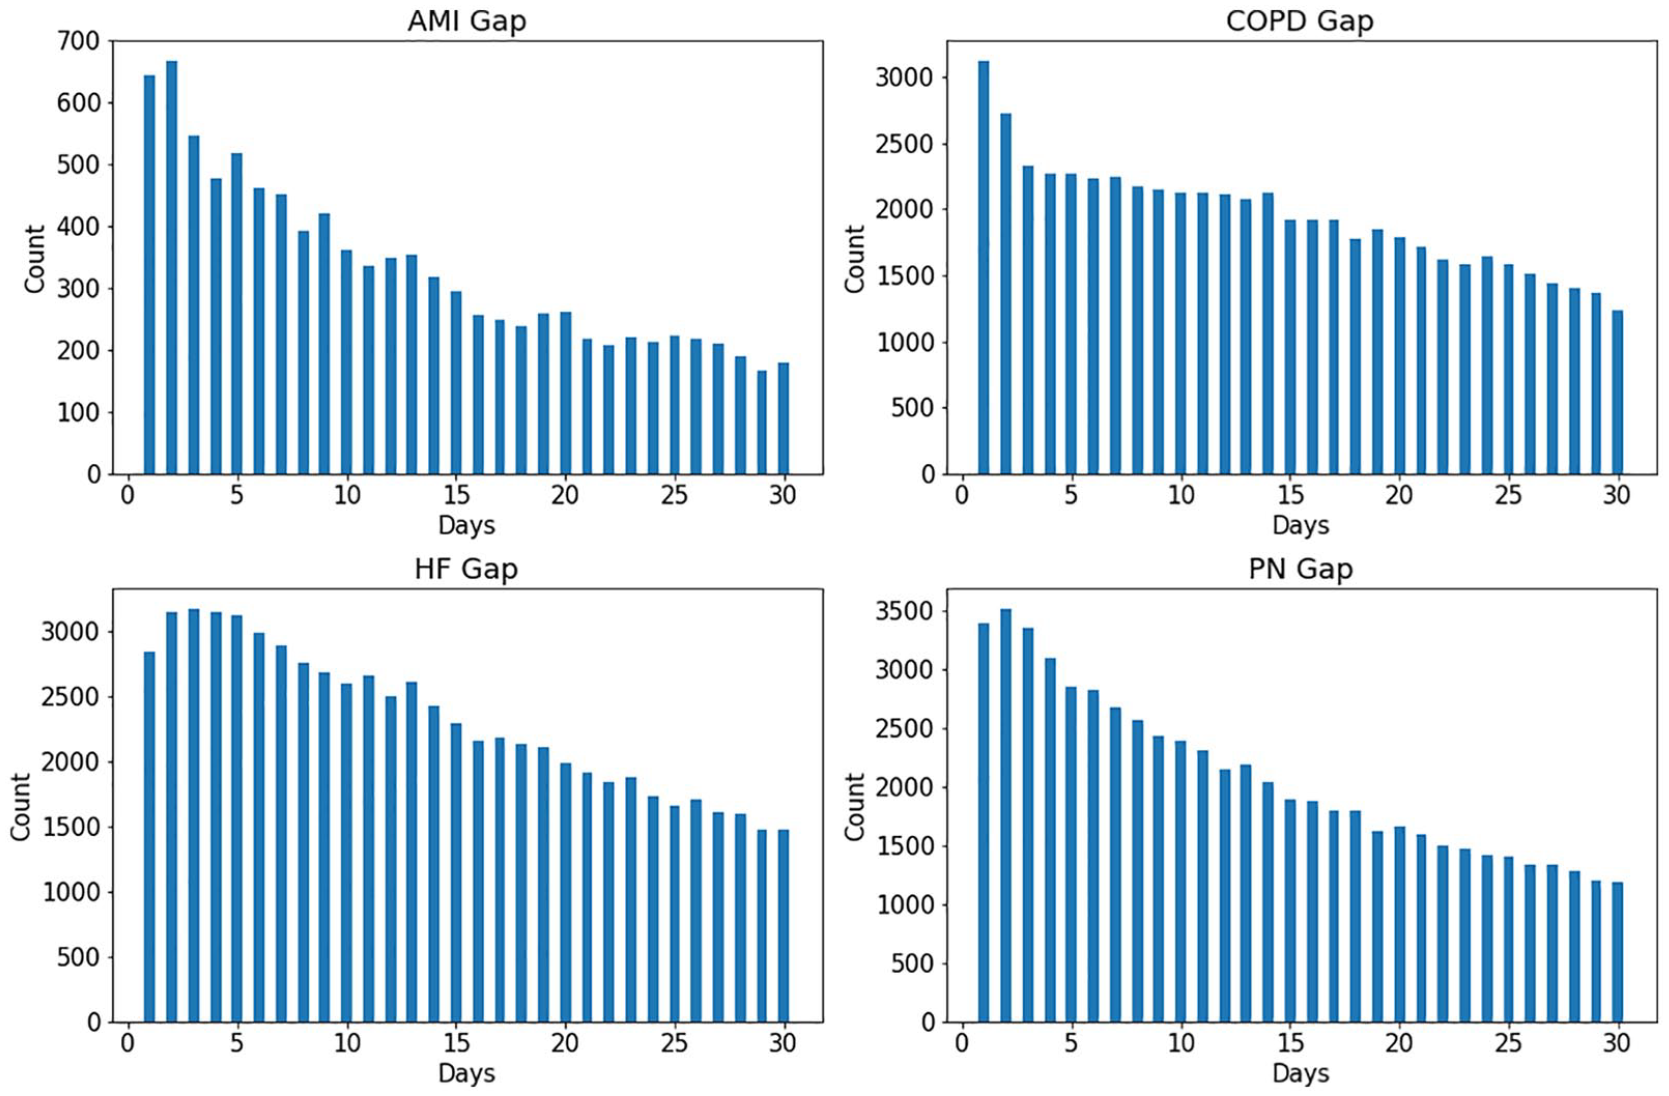
Distributions of gaps (in days) between discharges and readmissions for cohorts of AMI, COPD, HF, and PN.
Patient characteristics
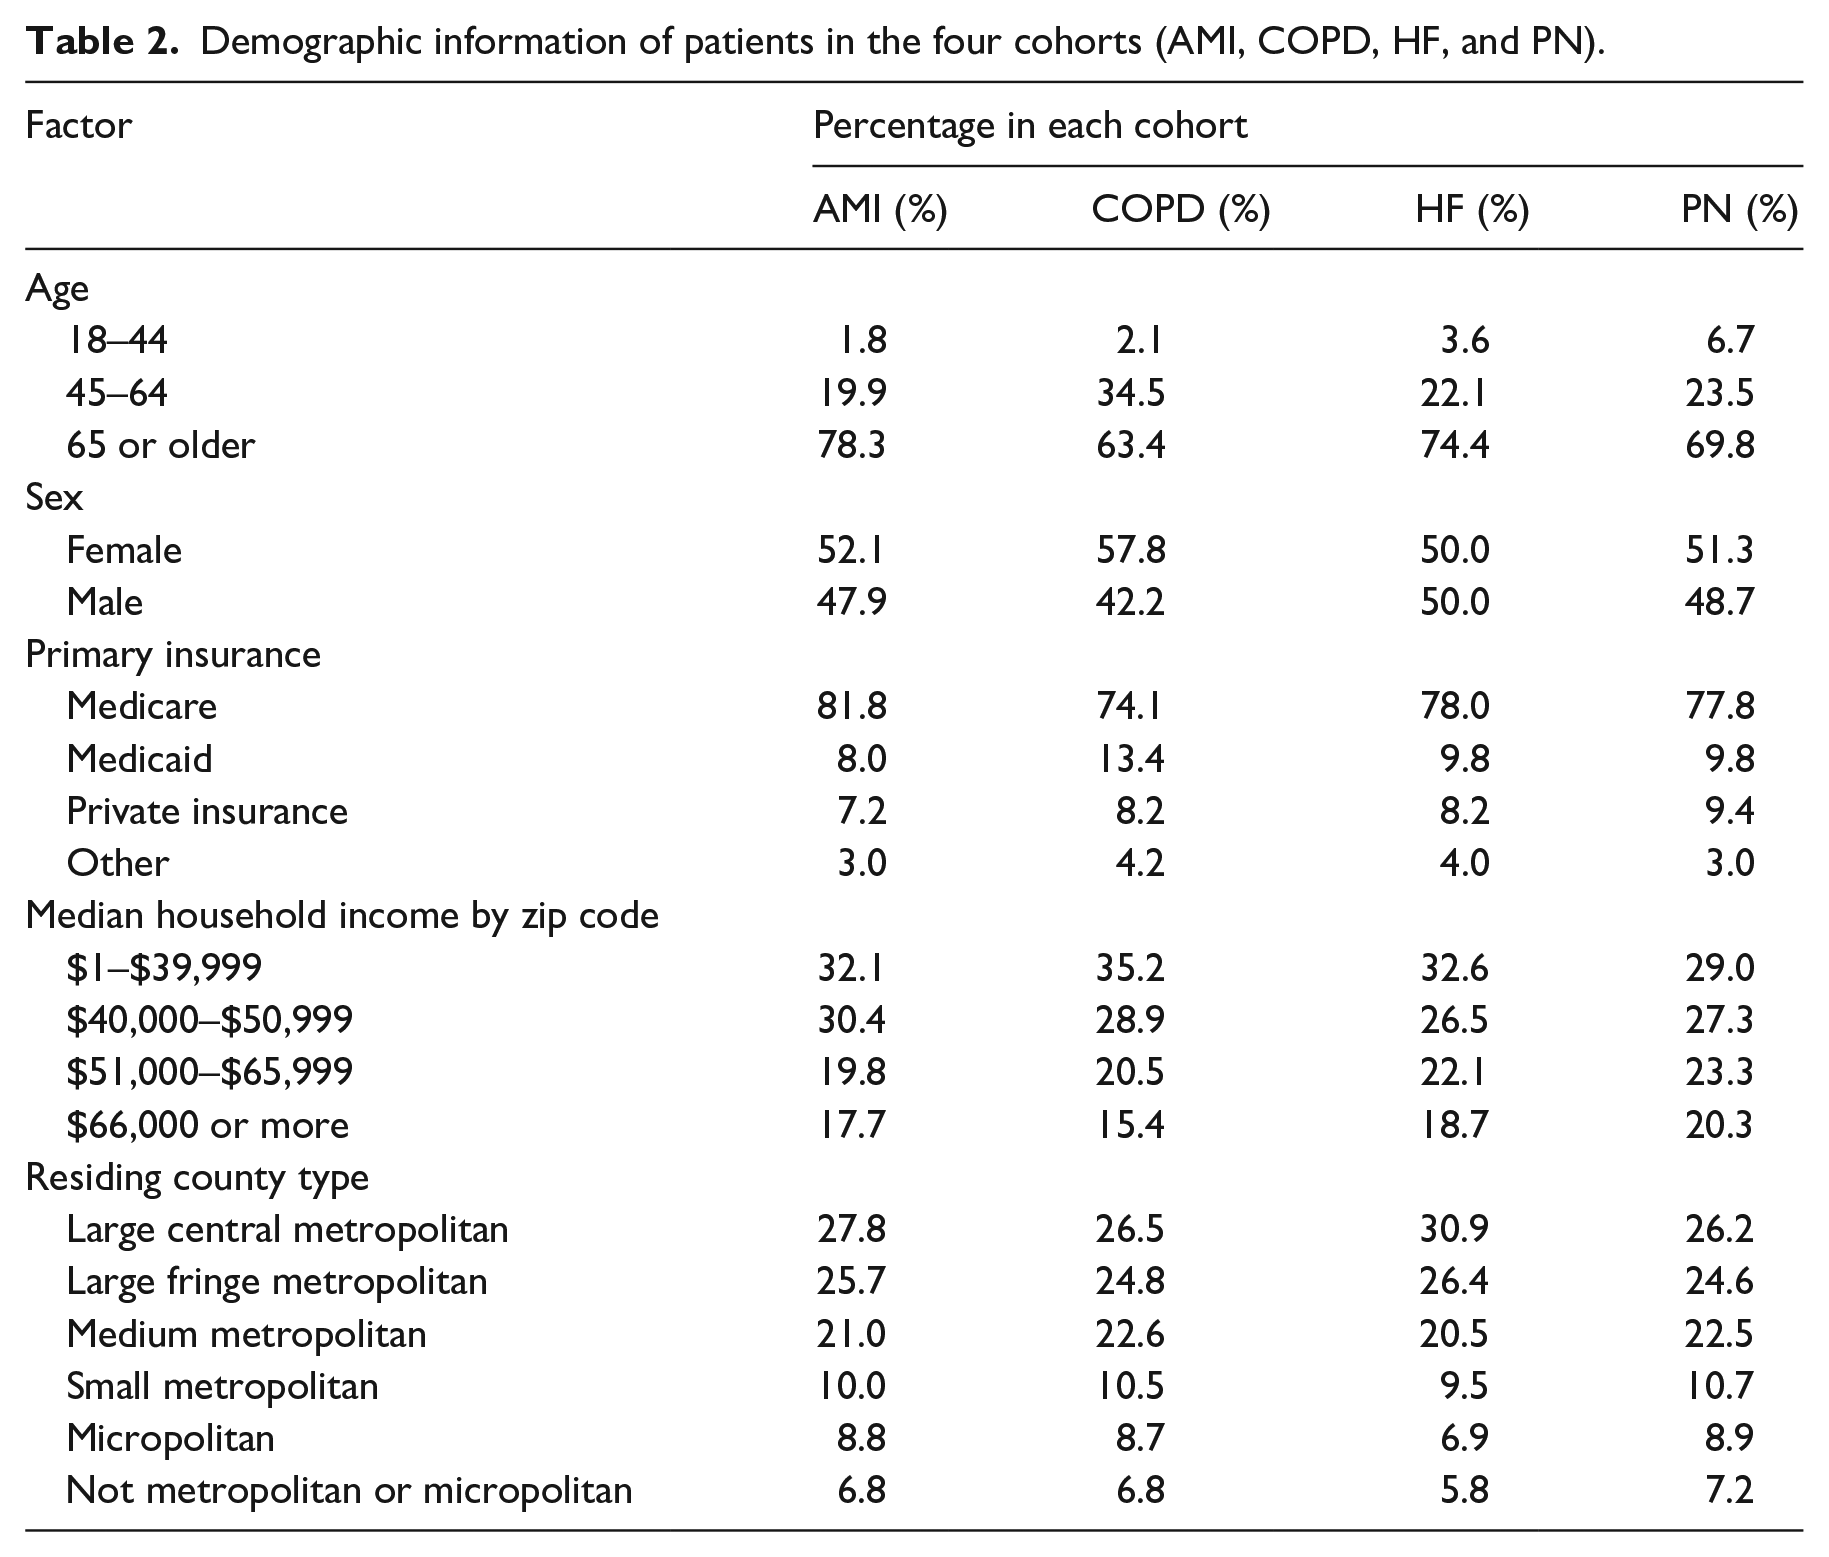
We performed a Chi-square analysis to test the association between patients’ demographic information and readmission status. All of the demographic variables are significantly associated (p < 0.05) with readmission risk for the four cohorts except sex of the HF cohort (p = 0.886). The result is shown in Table A1 in the appendix. We further identified 853, 10820, 14343, and 11275 pairs of index admissions from the AMI, COPD, HF, and PN cohorts, respectively. Each pair of index admissions belongs to a unique patient. Table 2 shows their demographic information. It can be seen that the majority of patients are older than 65 and are Medicare beneficiaries. There are slightly more female patients. Most patients live in large central metropolitans and neighborhoods with a median household income (zip code level) less than $40,000.
Demographic information of patients in the four cohorts (AMI, COPD, HF, and PN).
Association rule mining
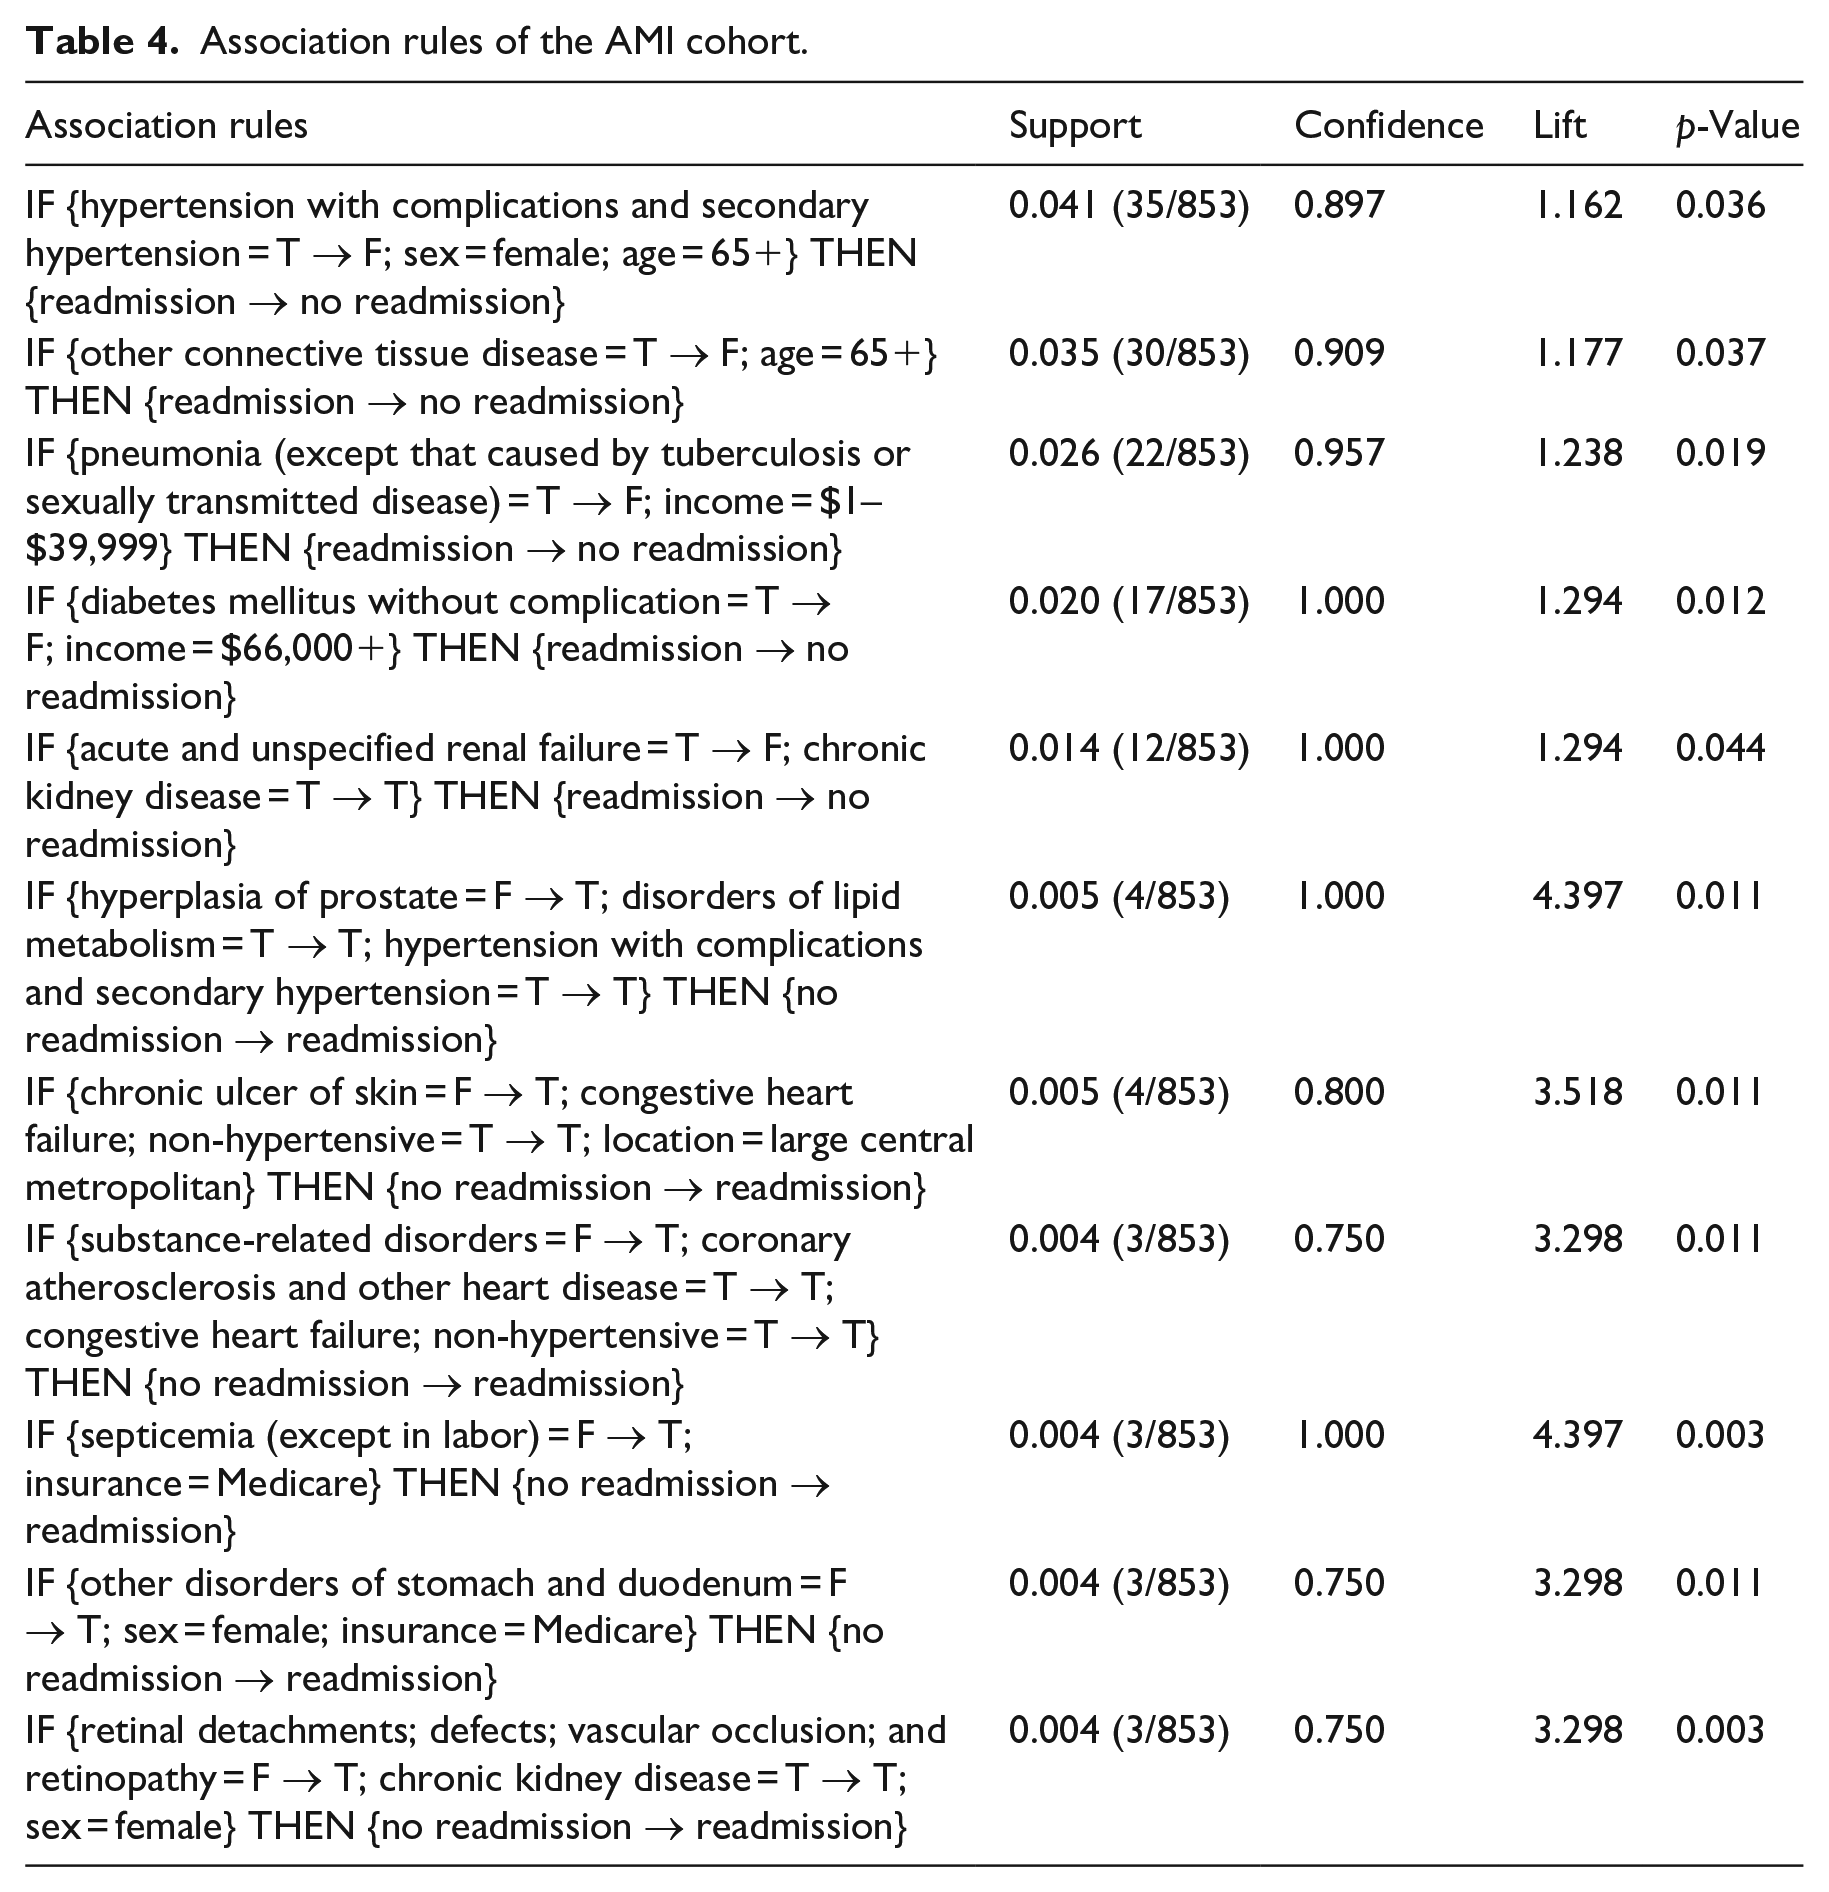
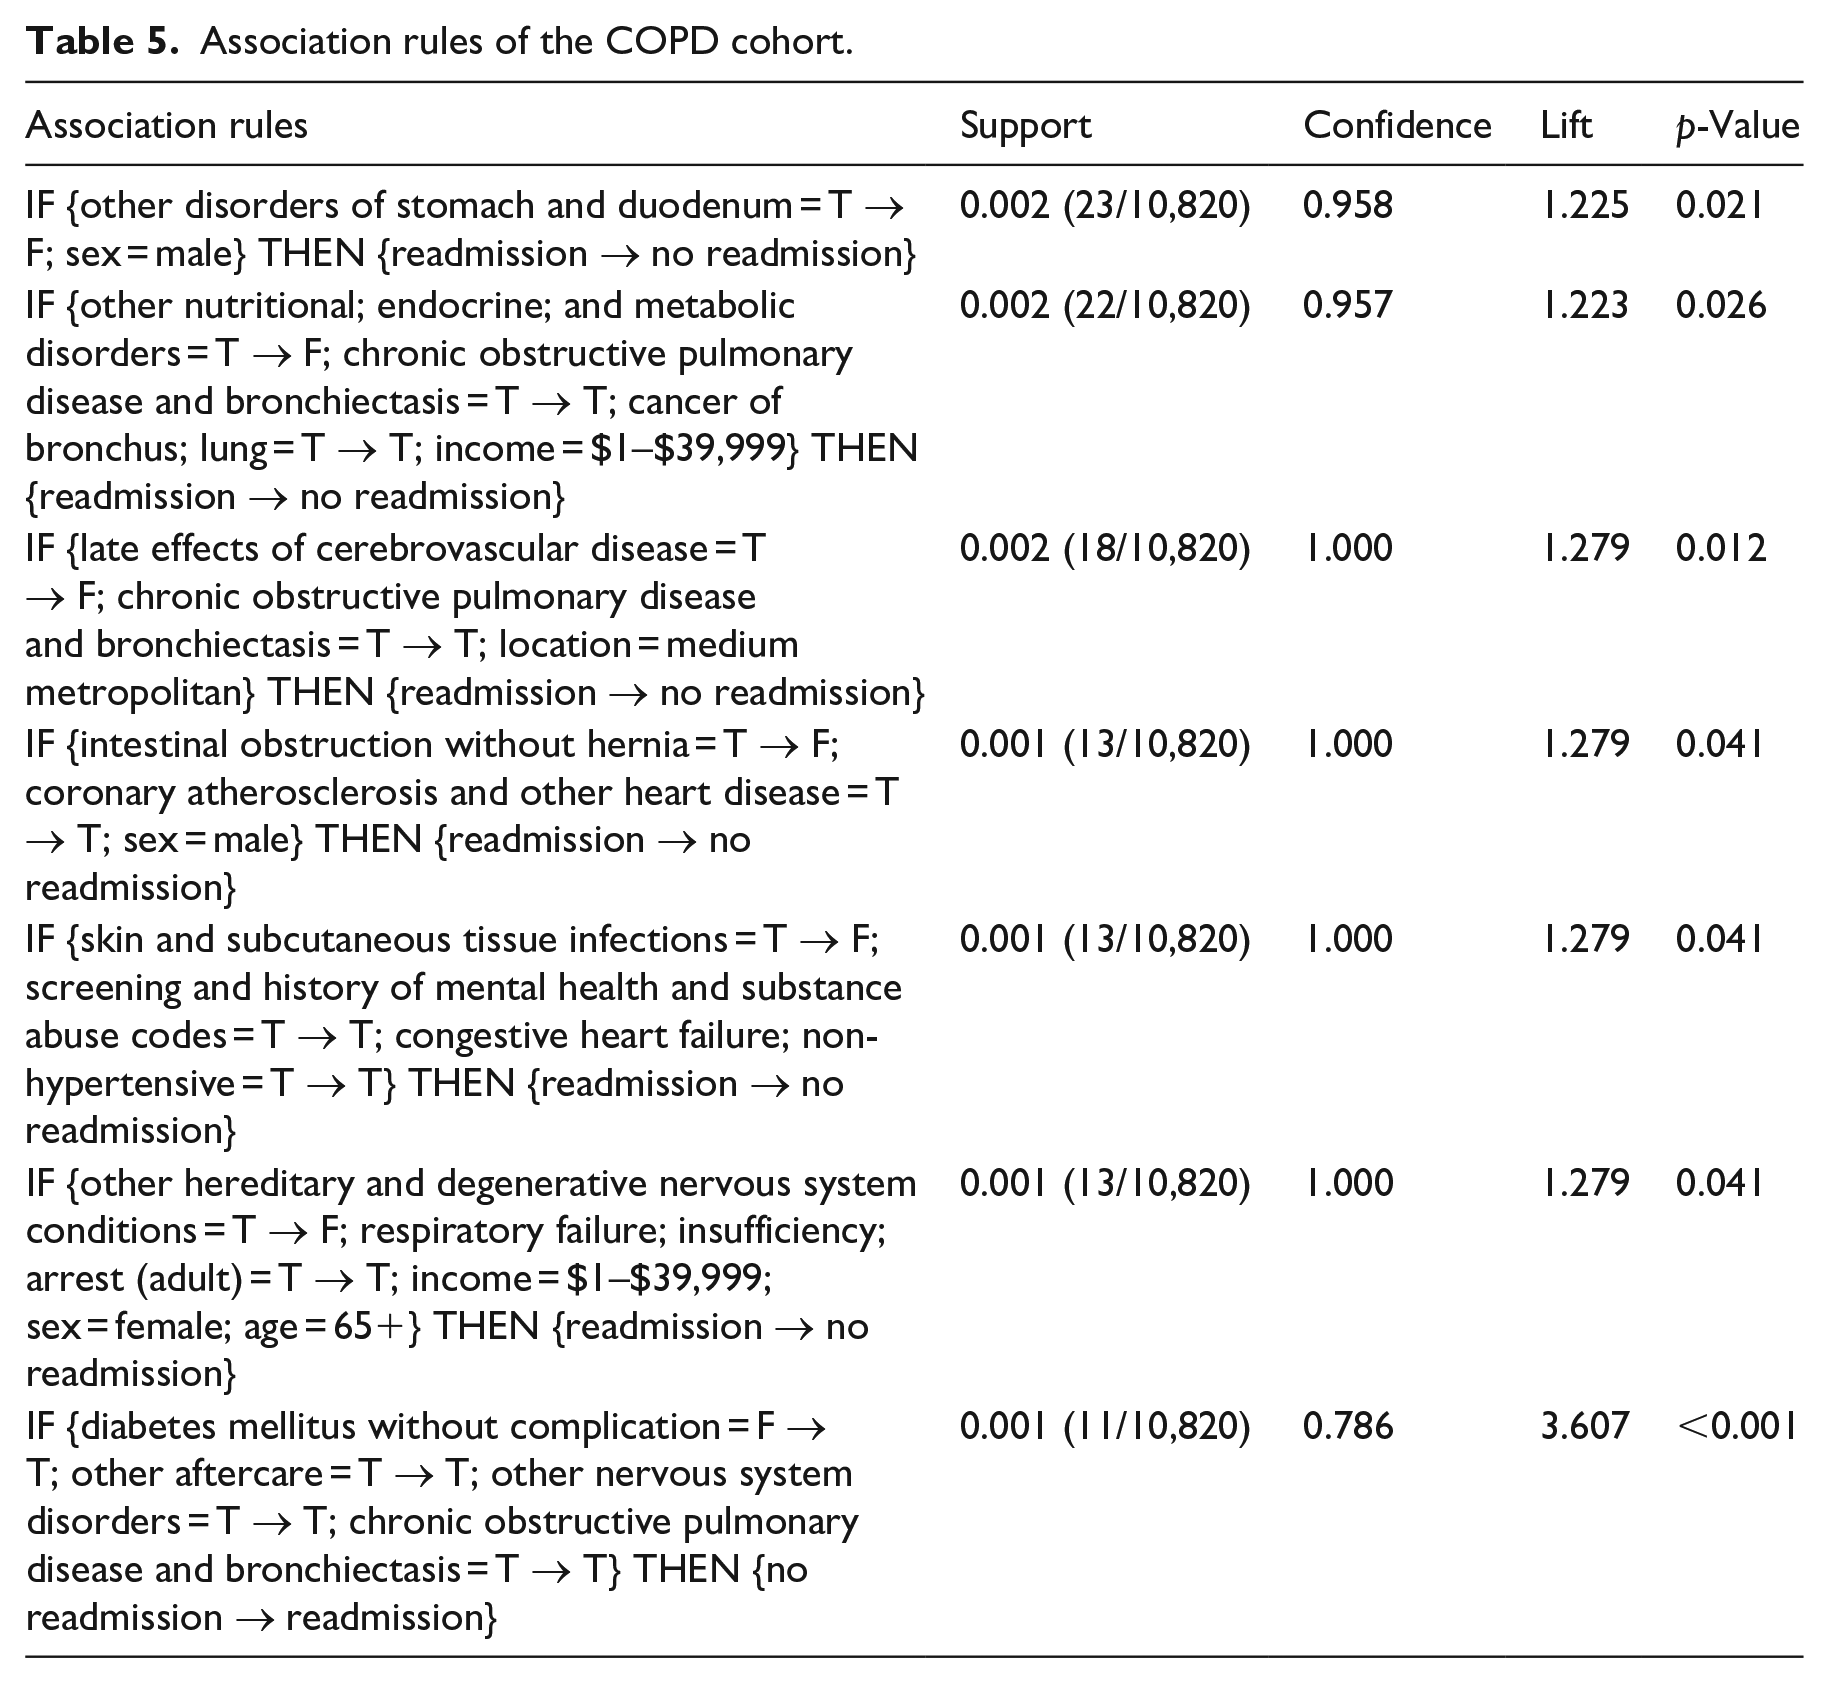
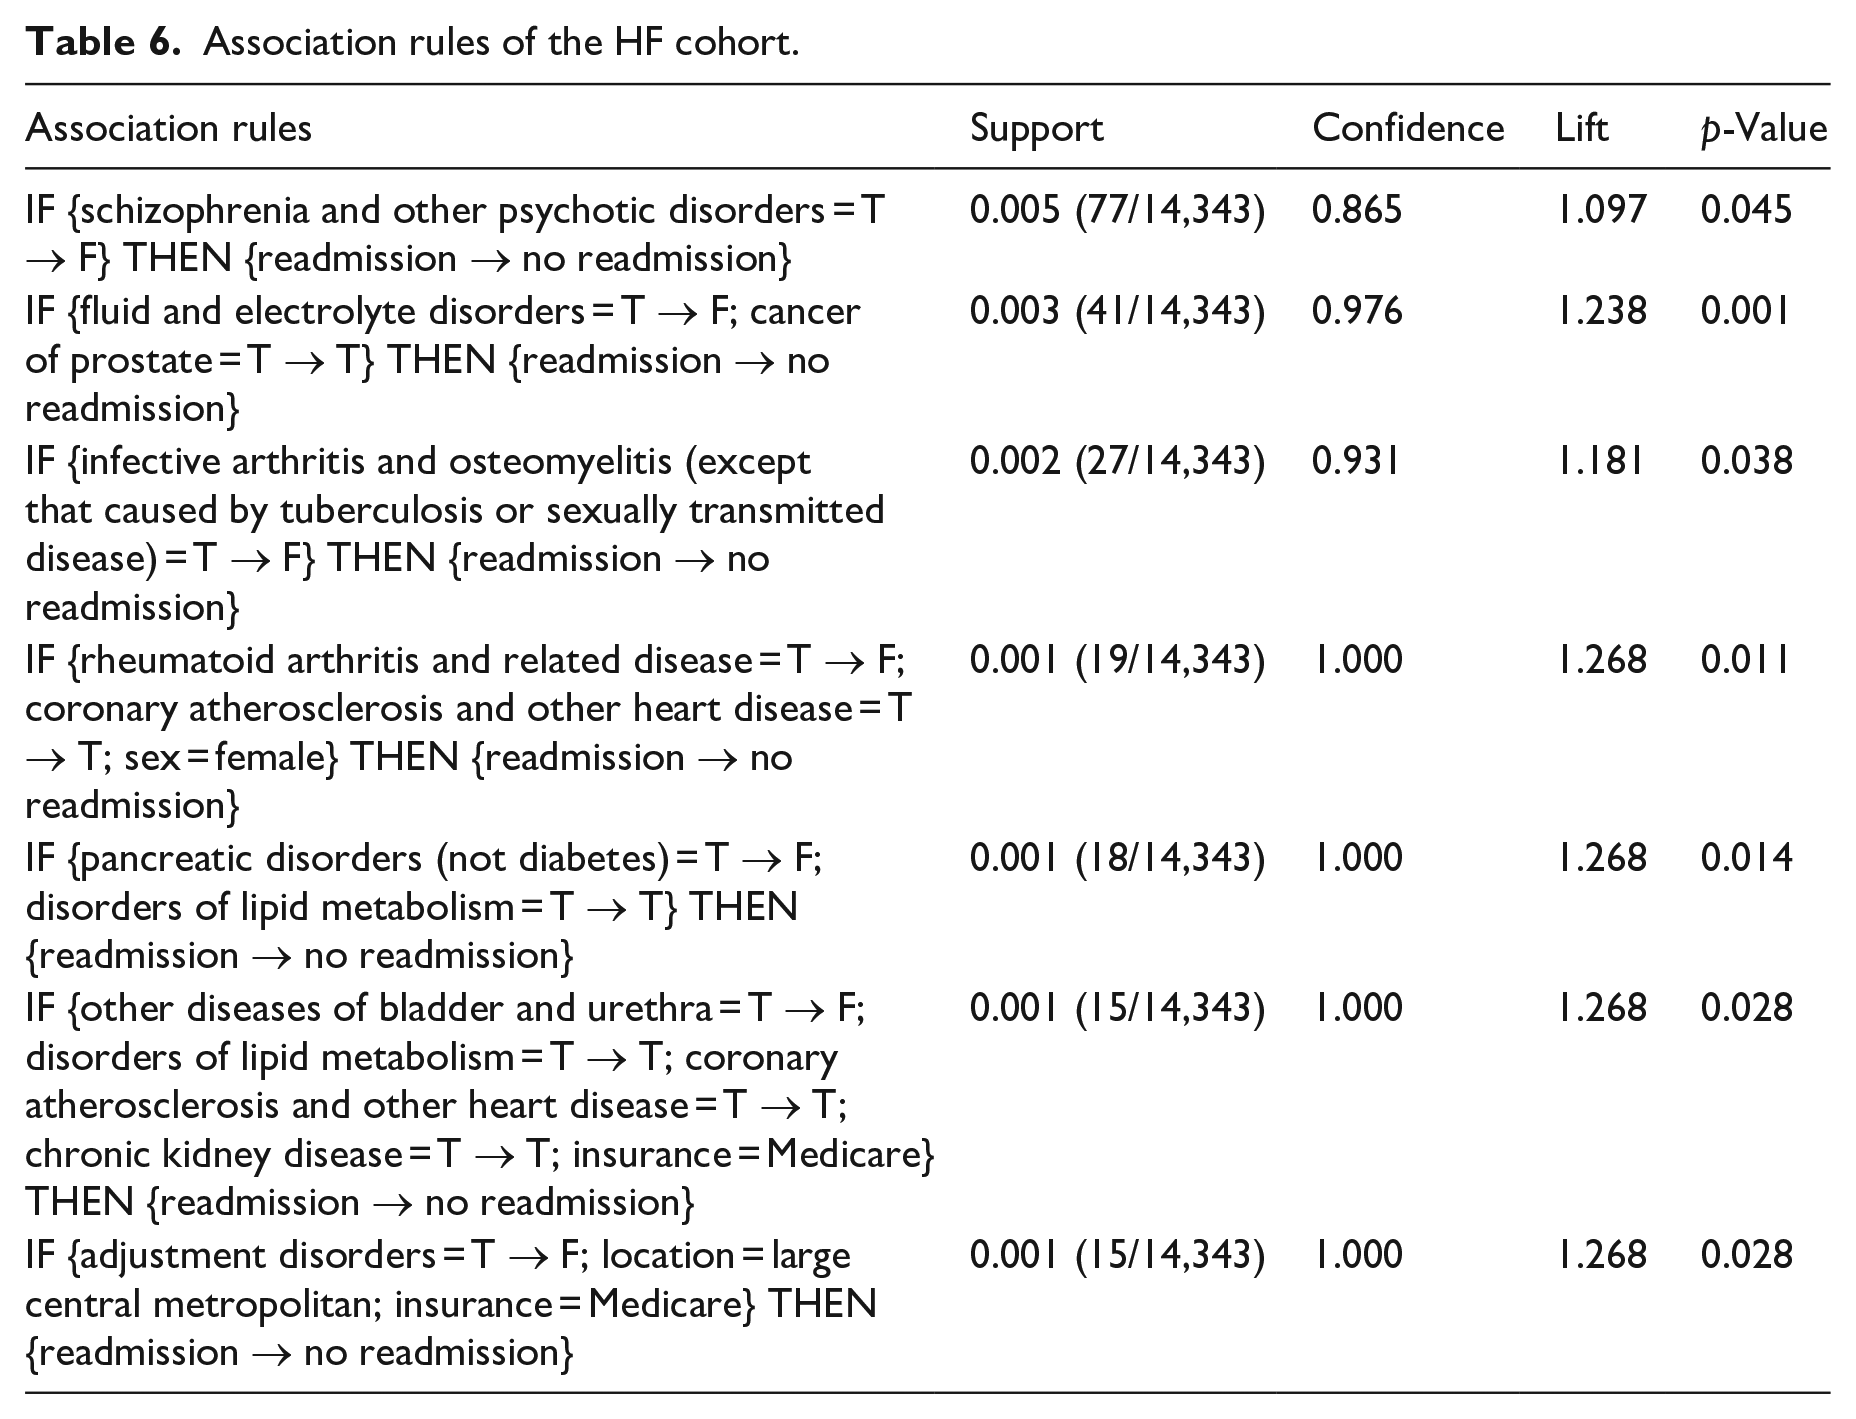
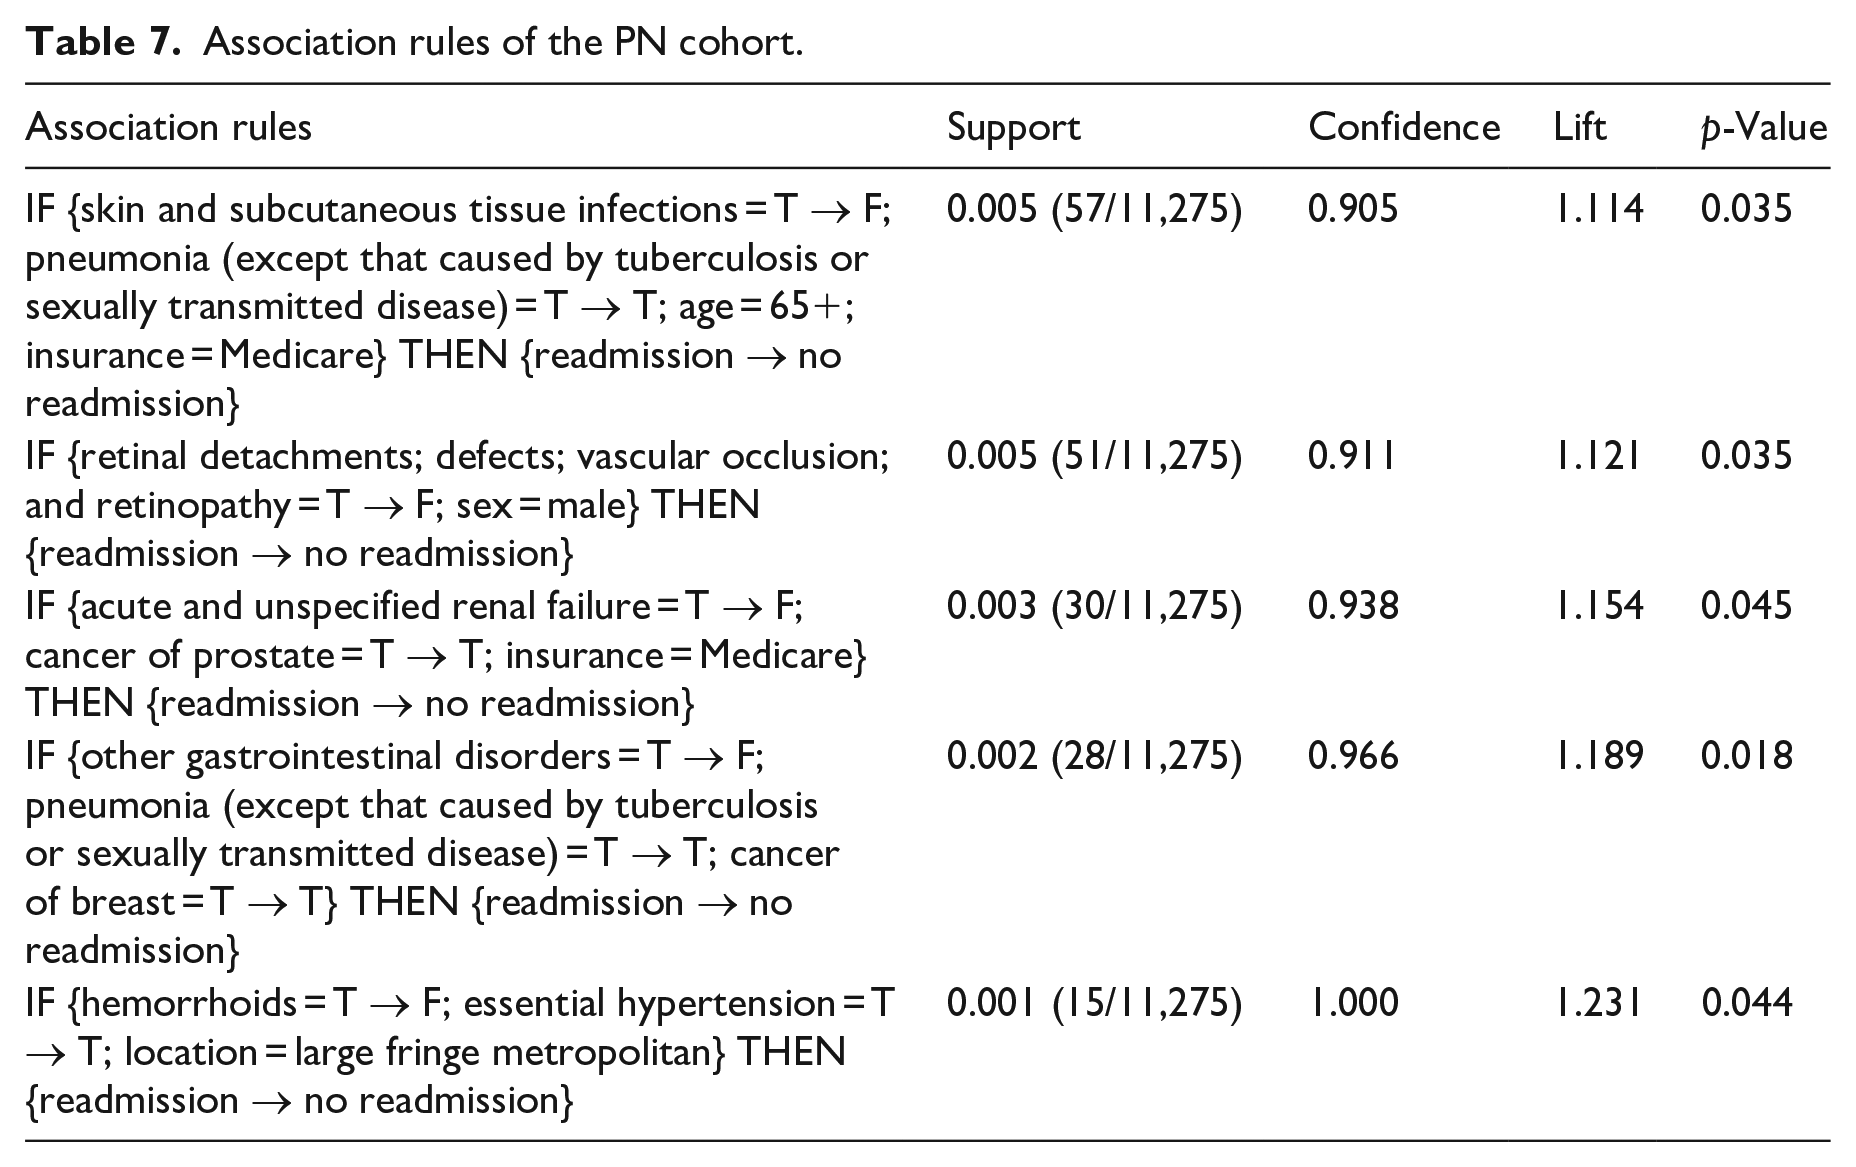
We obtained 108, 72, 81, and 58 eligible association rules for AMI, COPD, HF, and PN cohorts, respectively, after applying the rule quality criteria. From each rule, we extracted the diagnosis with changed status (i.e. “T → F” or “F → T”) in the antecedent and quantified the strength of its association with readmission by odds ratio (OR). We found 29 diagnoses with a significantly positive association with readmission (risk factor, OR > 1, p < 0.05) and showed them in Table 3, where “Y” indicates the diagnosis is a risk factor of the cohort. For risk factors that have been reported by other studies, we put citations after “Y.” It can be seen from Table 3 that only 5/29 (17%) of risk factors are shared by two cohorts and no other risk factor is commonly found in three cohorts. This indicates that the readmission patterns or risk factors of AMI, COPD, HF, and PN cohorts are different. In Tables A1 to A4 in the appendix, we showed readmission rates of the four cohorts with and without each risk factor, OR, and 95% confidence interval (CI) of OR. For each risk factor that can be potentially modified, we showed one association rule with the highest support in Tables 4 to 7.
Risk factors of readmission of the four cohorts.
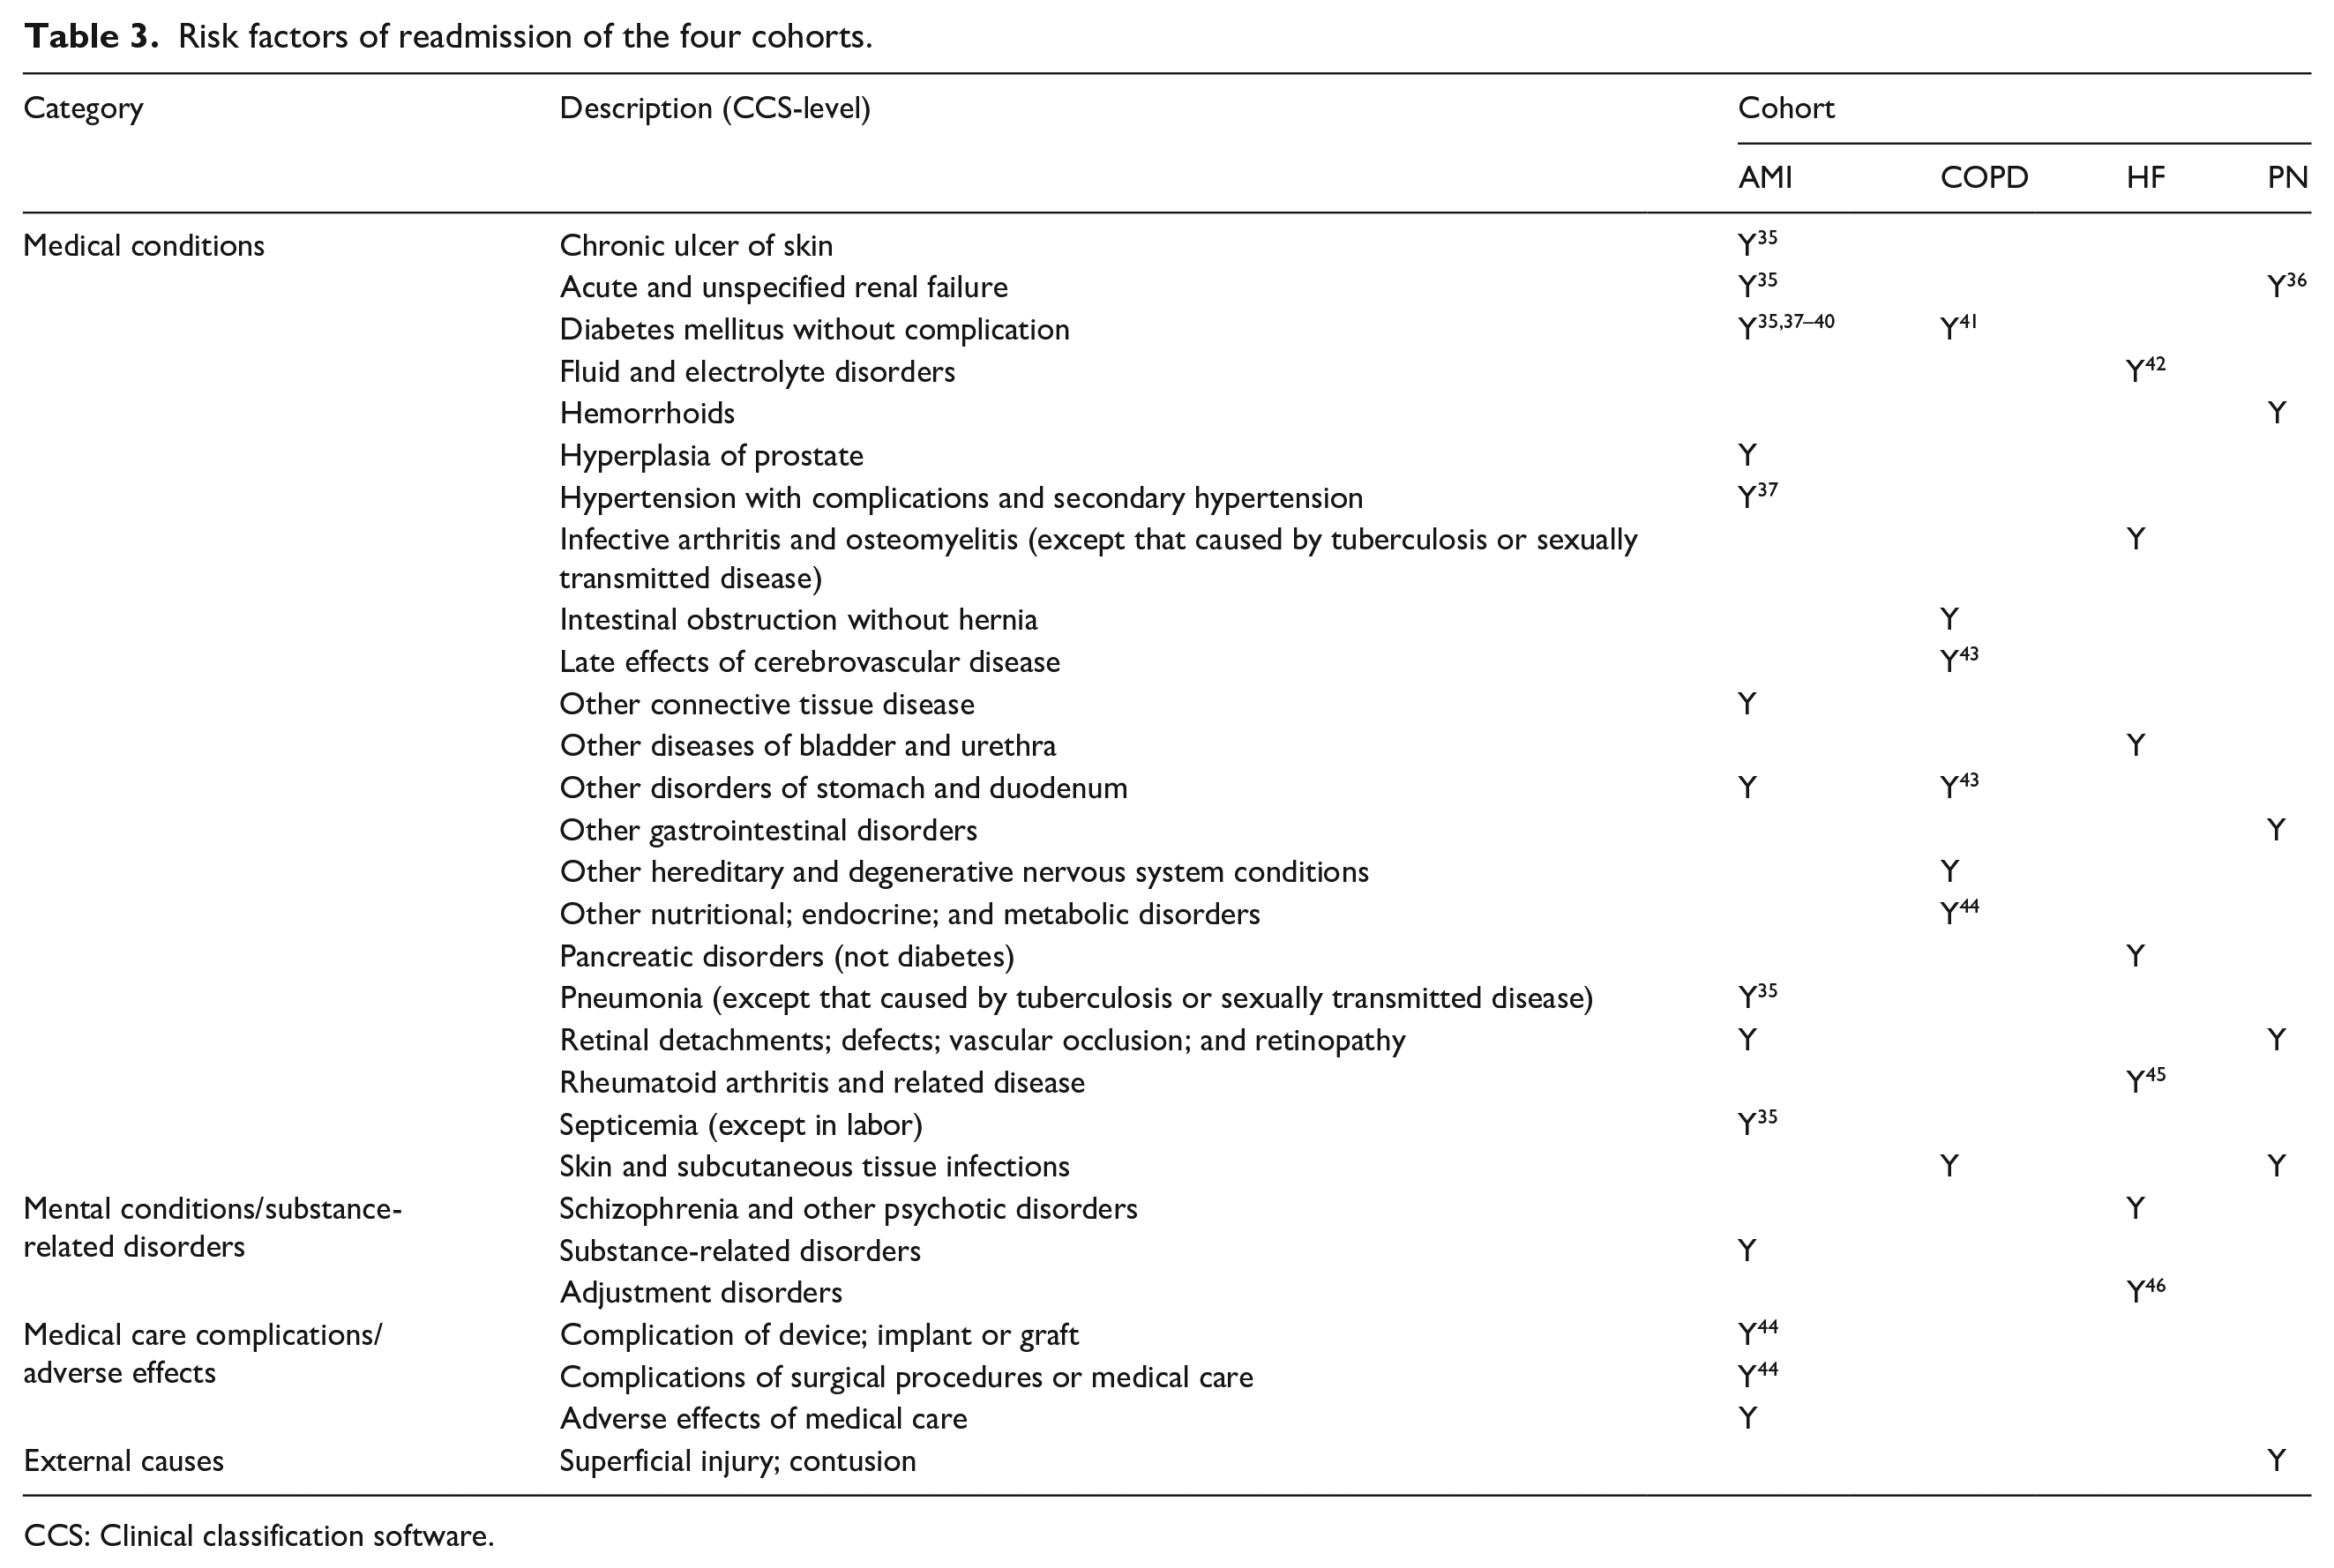
CCS: Clinical classification software.
Association rules of the AMI cohort.
Association rules of the COPD cohort.
Association rules of the HF cohort.
Association rules of the PN cohort.
Discussion
Analysis of changes
To our knowledge, this is the first study to analyze changes of modifiable risk factors of readmission with a combination of data mining and statistical methods. Our method has two advantages. First, by comparing the different causes (in ICD code) of index admissions of the same patients, we can better understand readmission through associations between potentially modifiable risk factors and readmission. Second, our method can provide more information about the potential effect of risk factor modification. The traditional logistic regression-based risk factor identification method only evaluates the association between the presence of a factor and the response (e.g. readmission). However, this does not necessarily mean the modification of this risk factor is associated with the reduction of readmission. Our method moves a step further to directly test the association between the changes of risk factors and the change of readmission status.
Potentially modifiable risk factors
By comparing the presence and the absence of the same diagnosis in two different index admissions of the same patient, we can computationally test if the change of the diagnosis is positively associated with the change of readmission status. It is noteworthy that the absence of a diagnosis in the index admission does not necessarily mean the patient is free of the condition, since it is possible that the condition is inactive and does not impact inpatient care. 47 For example, although diabetes mellitus is a nearly incurable chronic condition, this disease can be well-controlled by medications and lifestyle adjustments and changes.
There are four main categories of these 29 risk factors, including medical conditions, mental conditions or substance-related disorders, medical care complications or adverse events, and external causes. We do not consider medical care complications or adverse events as potentially modifiable risk factors because they will only occur after medical care as an outcome. Their risk should be anticipated and minimized during the care process. Similarly, external causes are not patient factors and are not under the control of hospitals. The remaining 25 medical and mental risk factors can be potentially modified by interventions, such as medication, surgery, and psychotherapy. According to the Charlson comorbidity index, 48 five of these 25 risk factors have a mortality risk score greater than zero, including acute and unspecified renal failure, chronic ulcer of skin, diabetes mellitus without complication, late effects of cerebrovascular disease, and other connective tissue disease. These conditions are more severe and should receive more attention in the development of interventions.
Recommendation by association rules
Tables 4 to 7 show that the antecedent of each association rule is composed of patients’ non-modifiable factors (e.g. age, sex) and the change of a potentially modifiable risk factor. Because each association rule represents a patient subgroup, it can be used to recommend the modification of readmission risk factors for patients falling into the subgroup. For example, the association rule of “IF {Hypertension with complications and secondary hypertension = T → F; Sex = Female; Age = 65+} THEN {Readmission → No readmission}” in the AMI cohort can be recommended for female AMI patients older than 65 having the comorbidity of hypertension with complications and secondary hypertension. Besides the treatment of the principal condition of AMI, the intervention of hypertension should be prioritized for these patients to minimize the readmission risk. For each association rule, we performed Fisher’s exact test to ensure the association between the antecedent and the consequent is significant. Here, we provide potentially modifiable risk factors instead of intervention plans (e.g. medications, treatment pathways) because we believe that they should be developed by clinicians based on their medical judgments.
Limitations
Our work has three potential limitations. First, because this is a retrospective analysis, there is no way to control the confounding effects. Although the association rules are represented in “IF-THEN” patterns, the relationship indicates an association not causality. This study cannot replace controlled experiments, such as case-control and prospective cohort studies. However, our results can potentially offer a data-driven hypothesis to a randomized controlled trial and guide other studies to truly disclose the causal relationships between the identified potentially modifiable risk factors and readmission. Second, we used the CCS-level diagnosis in the analysis because ICD-9-CM codes were too granular for data mining analysis. As a result, some diagnoses can only provide very general information, such as “other connective tissue disease.” Nevertheless, the purpose of this work is to provide information about potentially modifiable risk factors. Clinicians can potentially map patients’ problems and needs into these risk factors and design specific interventions. Third, we relied on ICD codes for identifying the changes of potentially modifiable risk factors. Because ICD codes are mainly designed for billing purposes instead of research, it is possible that some chronic diseases were not recorded in medical records if they did not affect the primary condition. However, this problem would not significantly impact on our findings since our data, the 2014 NRD (derived from inpatient hospitalization data of 2048 hospitals in 22 states) is large enough to considerably offset the coding issue since we measured the statistical significance of our findings.
Conclusions
In this work, we combined data mining and statistical methods to analyze the associations between the changes of potentially modifiable risk factors and the change of readmission status for Acute myocardial infraction (AMI), COPD, HF, and PN cohorts. Compared to other studies,21–26 which used the traditional logistic regression method to study associations between risk factors and readmission status, our approach moved a step further to analyze associations between changes of modifiable risk factors and the change of readmission status. It is imperative to identify modifiable risk factors associated with readmission because those risk factors can be used to predict and reduce readmissions. In addition, because each identified association rule represents a patient subgroup, clinicians can use it to customize interventions for patients falling in the subgroup. From the association rules, we identified 25 potentially modifiable risk factors of readmission. Our results would facilitate clinical research to further understand the causes of readmission.
Supplemental Material
sj-pdf-1-jhi-10.1177_1460458221995231 – Supplemental material for Potentially modifiable risk factors for 30-day unplanned hospital readmission preventive intervention—A data mining and statistical analysis
Supplemental material, sj-pdf-1-jhi-10.1177_1460458221995231 for Potentially modifiable risk factors for 30-day unplanned hospital readmission preventive intervention—A data mining and statistical analysis by Peng Zhao and Illhoi Yoo in Health Informatics Journal
Footnotes
Declaration of conflicting interests
The author(s) declared no potential conflicts of interest with respect to the research, authorship, and/or publication of this article.
Funding
The author(s) received no financial support for the research, authorship, and/or publication of this article.
Supplemental material
Supplemental material for this article is available online.
References
Supplementary Material
Please find the following supplemental material available below.
For Open Access articles published under a Creative Commons License, all supplemental material carries the same license as the article it is associated with.
For non-Open Access articles published, all supplemental material carries a non-exclusive license, and permission requests for re-use of supplemental material or any part of supplemental material shall be sent directly to the copyright owner as specified in the copyright notice associated with the article.