
Abstract
Background
An unplanned readmission is a dual metric for both the cost and quality of medical care.
Methods
We employed the random forest (RF) method to build a prediction model using a large dataset from patients’ electronic health records (EHRs) from a medical center in Taiwan. The discrimination abilities between the RF and regression-based models were compared using the areas under the ROC curves (AUROC).
Results
When compared with standardized risk prediction tools, the RF constructed using data readily available at admission had a marginally yet significantly better ability to identify high-risk readmissions within 30 and 14 days without compromising sensitivity and specificity. The most important predictor for 30-day readmissions was directly related to the representing factors of index hospitalization, whereas for 14-day readmissions the most important predictor was associated with a higher chronic illness burden.
Conclusions
Identifying dominant risk factors based on index admission and different readmission time intervals is crucial for healthcare planning.
Keywords
Introduction
Unplanned readmissions are increasingly being regarded as a dual indicator of medical cost and the quality of care. In line with this, health authorities in several countries have adjusted reimbursements to hospitals in accordance with readmission rates, providing a direct financial incentive to reduce the excessive health care costs caused by readmissions and to enhance the quality of medical care. 1 It is widely recognized that the predictive modeling technique can be used as a decision support tool for hospitals to identify patients with a high risk of readmission and to coordinate targeted interventions for such patients.2–5 However, most studies dedicated to accurately predicting readmissions are focused on a time frame based on a 30-day interval and are limited by lack of longitudinal data availability following discharge.3,6
On the one hand, it remains unclear whether hospitals should be held responsible for the quality of healthcare for such a long period of time after a patient’s discharge. While various time frames are used for identifying readmissions in several studies,7–10 analyses conducted using regression-based models often have poor prediction performance. 5 On the other hand, in order to be effectively helpful in a clinical operation, it is imperative to be able to predict patients with a high risk of readmission at the time of the admission, rather than after completion of the hospitalization, since early identification of high-risk patients for readmission would position clinicians to strategically coordinate timely tailored interventions. Recent studies utilize data available upon admission from electronic health records (EHRs) that might make possible early identification of high-risk patients.11–15 However, the analyses of such studies are mostly limited to specific diseases or cohorts and thus have potentially limited generalizability. Although machine learning (ML) algorithms have been used successfully to predict 30-day unplanned readmissions using large datasets at the time of admission,16–19 there are only few studies applying ML approach to identify patients at high risk of earlier unplanned readmissions.
The aim of this study is therefore twofold. First, we use an ML algorithm, which takes advantage of big data that are readily accessible at the initial stage of admission from EHRs, to facilitate an early and prospective risk identification of readmission for more coordinated, efficient in-hospital care. Second, we evaluate the likelihood of readmission and the importance of its risk factors which may vary according to the length of the post-discharge time frames.
Methods
Data source, outcome and predictive variables
For this retrospective cohort study, data were obtained from an academic medical center in Taiwan. We collected information on admission, discharge and readmission recorded by the hospital’s computer system for all of its patients who were discharged alive between 1 January, 2018 to 31 December, 2019. We examined a total of 99,436 hospitalizations.
The first outcome of interest was all-cause 30-day readmissions defined as readmissions due to the same or related diagnosis within 30 days after index hospitalization. Although a 30-day readmission is widely used both in the literature and as a quality indicator adopted by several countries, 1 we additionally considered a shorter length of the post-discharge time frames to measure readmission risk for two reasons. First, most studies have defined a preventable readmission as a readmission that takes place within the first 15 days20,21 Second, Taiwan’s Ministry of Health and Welfare (MHW) has adopted 14-day unplanned readmissions as an indicator of quality of medical care. To determine whether risk factors would differ between 30- and 14-day readmissions, we also employed a 14-day unplanned readmission as a second outcome measure in this study.
Predictors that are readily available within hours of the initial admission were selected for model construction. The ICD-10-CM/PCS (International Statistical Classification of Disease and Related Health Problems, 10th Revision, Clinical Modification/Procedure Coding System) codes in the primary or secondary diagnosis fields on hospital intake forms at index admission are used to identify patients’ comorbidities. These comorbidities are listed in Charlson comorbidity index (CCI) table. Note that although LOS and some laboratory tests are important factors related to readmissions, these data were not available at the time of index admission. Thus, our final model excluded these two factors for a real-time assessment of readmission upon admission. In addition, we also excluded predictors related to medical expenses such as coverage from National Health Insurance (NHI), deductibles, out-of-pockets, compensation from additional private health insurance and the patients’ payment method in the final model since these variables are also not readily accessible upon admission. We also excluded observation-unit stay, elective readmission, transit to another hospital, and discharge against medical advice or death (Figure 1). Sample selection criteria.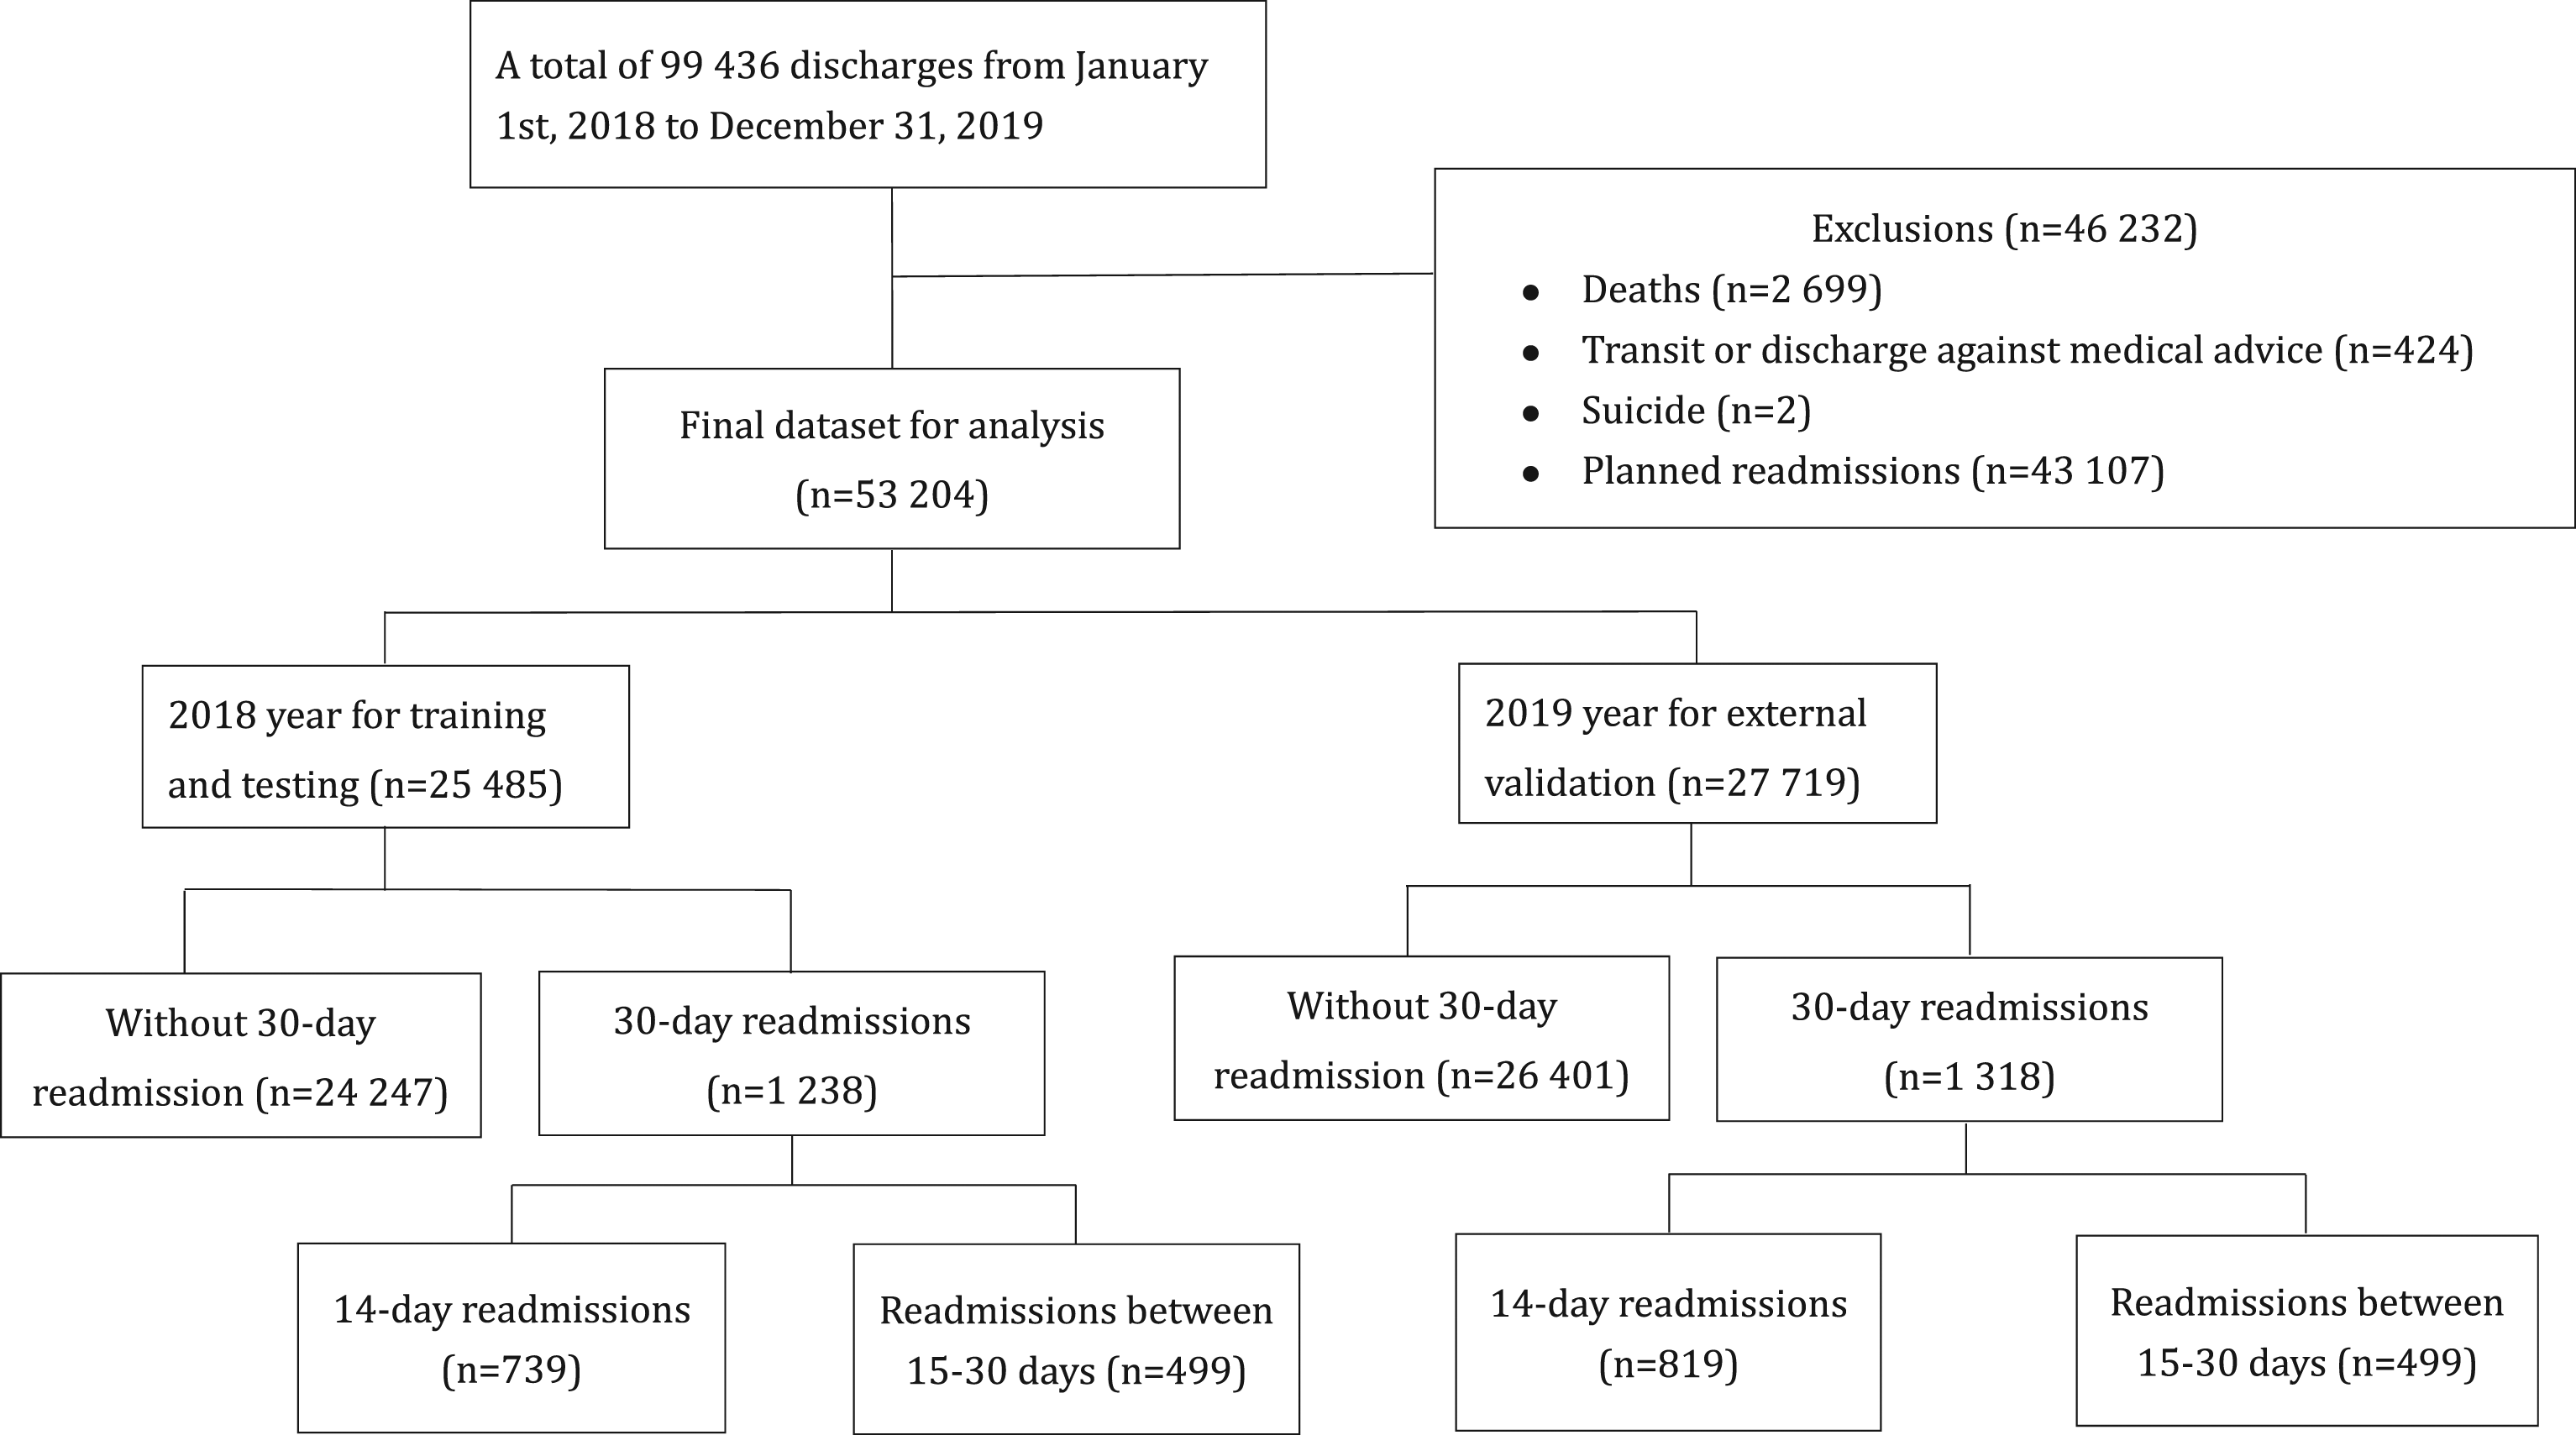
The random forest
We employed the Random Forest 22 (RF) method to develop the predictive model. Several studies have found that the RF method tends to perform better than other data-driven approaches for solving classification problems.18-19 It is less computationally expensive than other ML techniques and its built-in variable-importance score can provide some insight into how each variable contributes to the prediction model.
The RF model is comprised of an ensemble of individual decision trees. The ensemble learning algorithm averages predictions over many decision trees to produce more accurate and stable predictions. Each tree is built on a different bootstrap sample rather than on the original sample. At each split of the internal node, only a random subset of predictors was selected rather than the full set of all predictors. We used entropy as the splitting criterion and stopping condition at each split of the classification tree as follows:
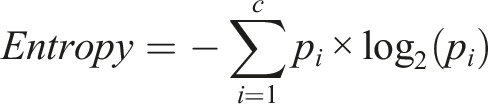
Through the process of bagging and random predictor selection, the RF encourages diversity among the trees and hence reduces overfitting and the variance of the estimator to improve the prediction accuracy of the model. The bootstrap process randomly leaves out about one-third of the observations, which constitute the out-of-bag (OOB) sample.22,23 This is due to the fact that the probability of an observation being omitted is
The variable importance score was calculated separately for each predictor by summing up the contributions to the information gain in the above split-criterion over all internal nodes of a tree and across all trees in the forest. 21 We normalized the variable importance score fall to within 100% by dividing all scores over the maximum score.
Statistical analysis and model evaluation
We use STATA, version 16.1 24 to perform all statistical operations and to implement RF modeling. Covariates were compared between the readmitted/non-readmitted groups using the Chi-square test for categorical variables and t-test for continuous variables. Final RF models were evaluated against the independent hold-out set of 27,719 patients in 2019, those that were not used in the development of the RF. We compared discrimination abilities of the RF and regression-based models with the areas under the ROC curves (AUROC) using DeLong’s test. 25 With regard to the predictive capabilities of the same RF approach between 30- and 14-day readmissions, we used the bootstrap method to compare the differences in the two AUCs. The optimal cut-point value in the ROC analysis for the current study was determined following Youden’s index rule. 26 At this point, the difference between true positive rate (sensitivity) and false positive rate (1-specificity) is maximized.
Results
Sample characteristics
The final data set after exclusion consisted of 53 204 hospitalizations for the 2 years of 2018 and 2019 (Figure 1). Exclusions of 46,232 hospitalizations included 43,107 for planned readmission and 3,125 for deaths, transit and discharge against medical advice during hospitalization. Overall, the 30-day unplanned readmission rate was 4.80% (2,556 out of 53,204) in the current study for the 2 years 2018 and 2019. Of the unplanned readmissions, 2.93% (1,558 out of 53,204) and 1.88% (998 out of 53,204) occurred within 14 days and 15–30 days, respectively.
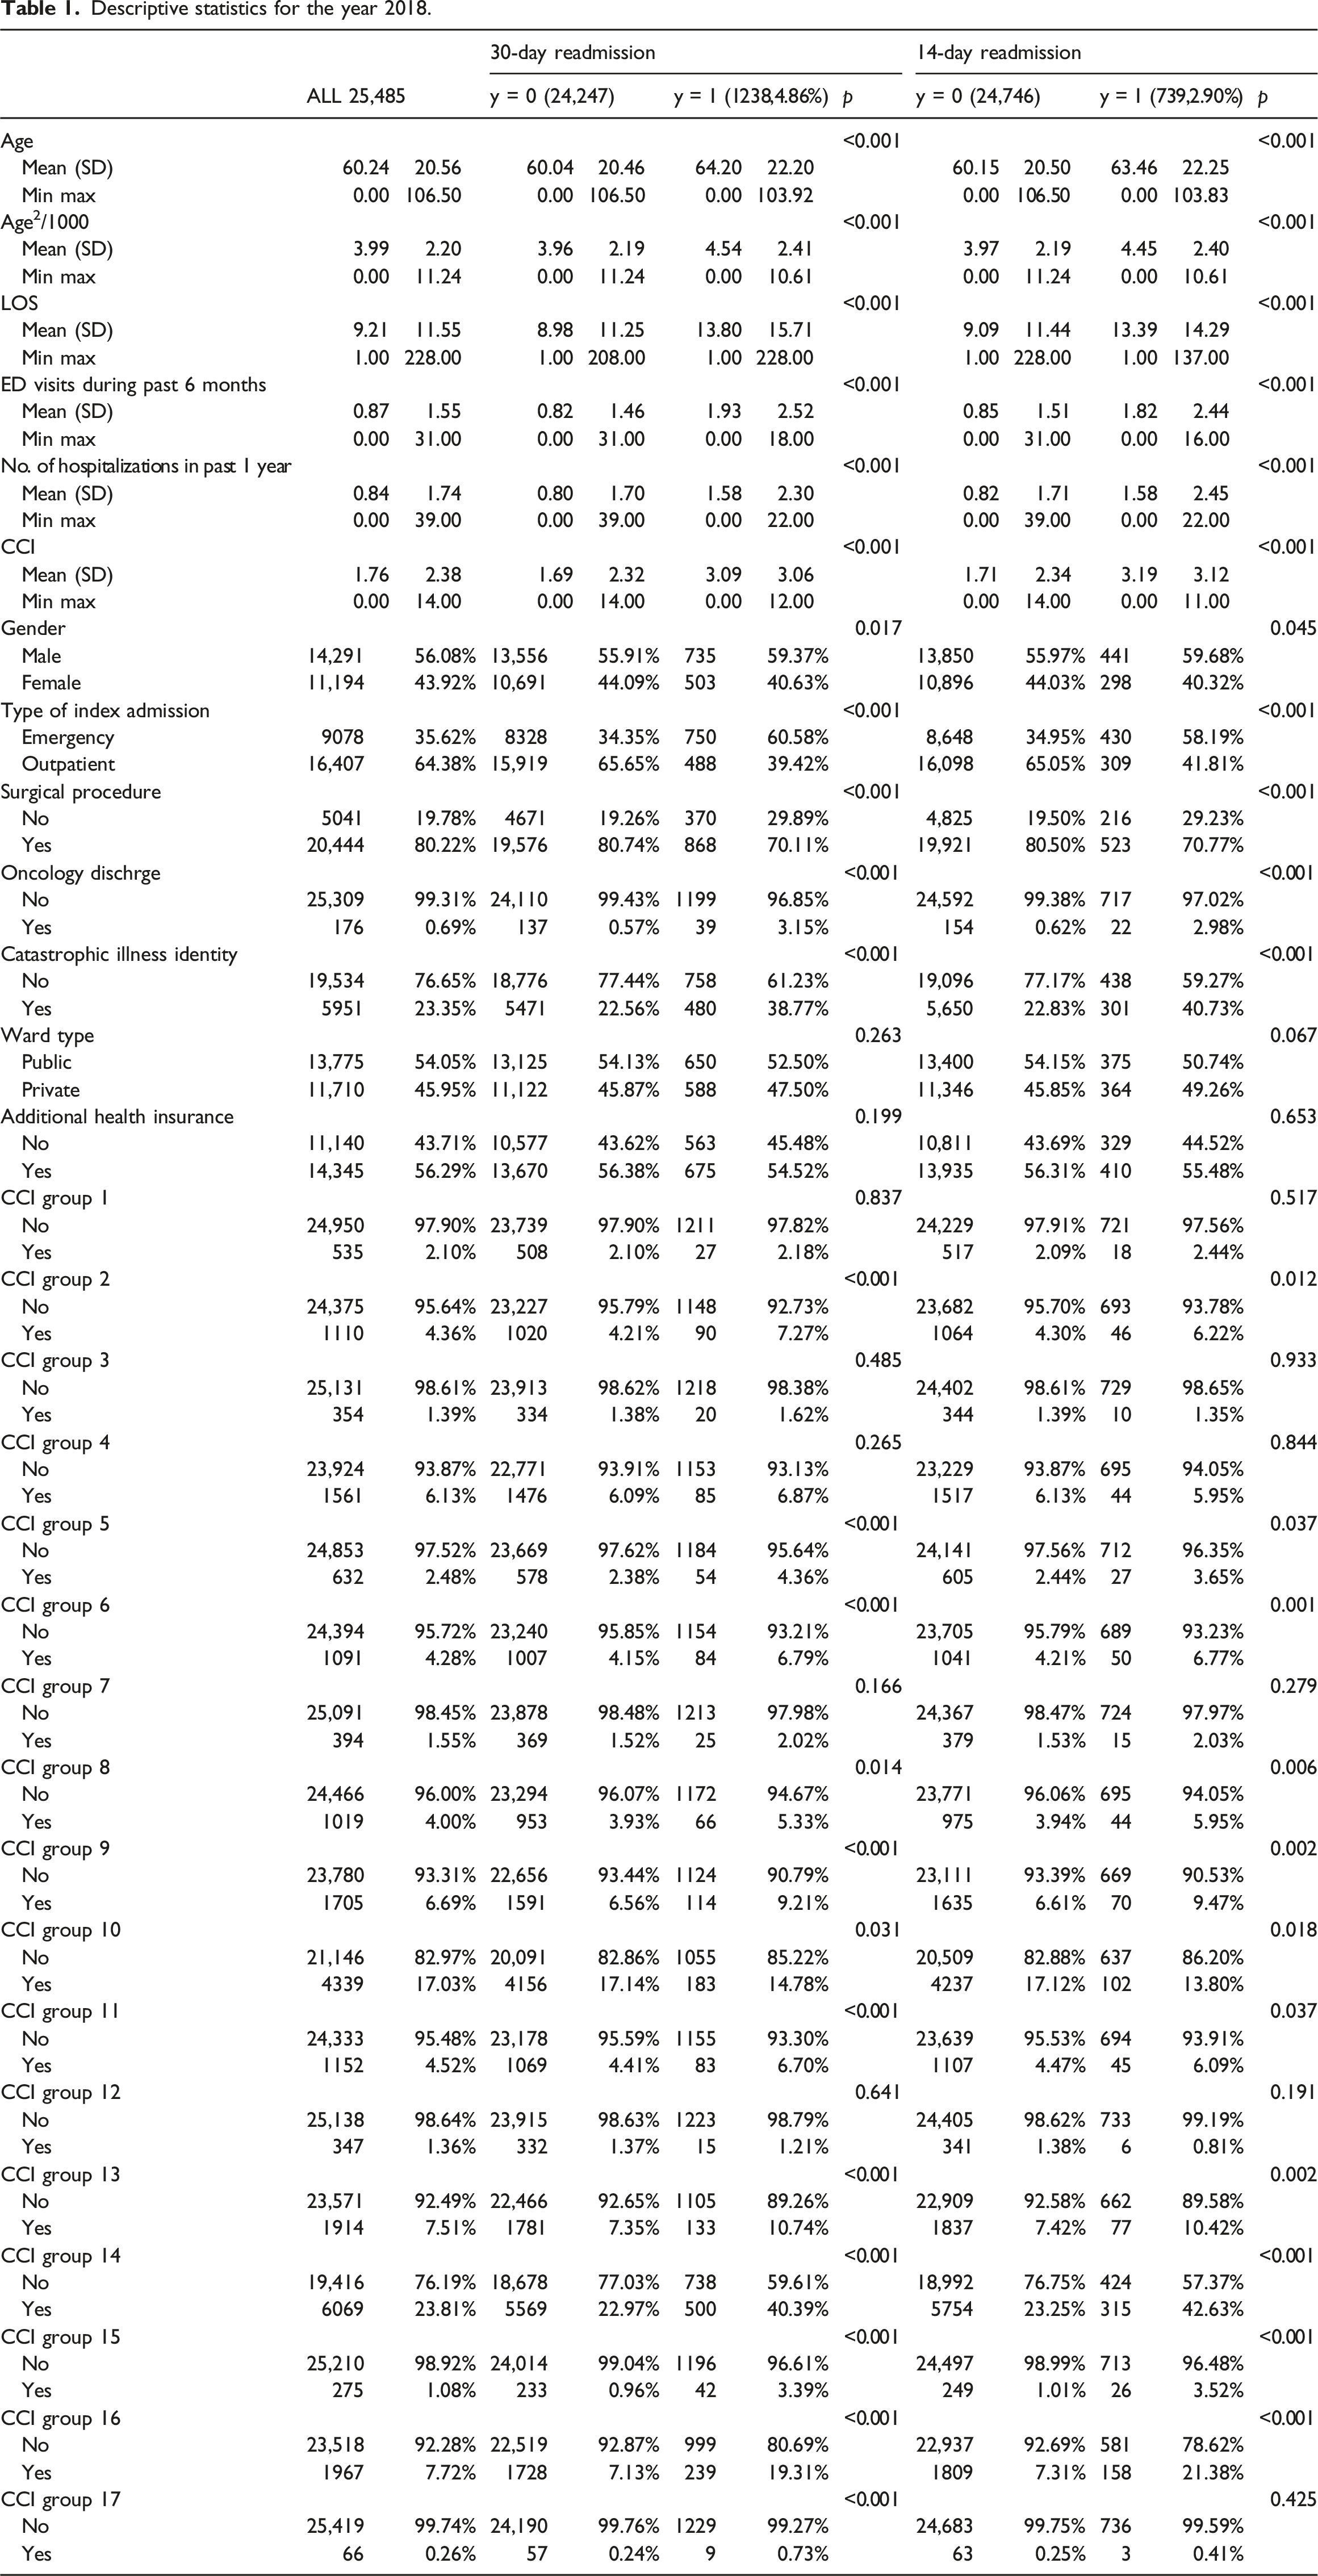
Descriptive statistics for the year 2018.
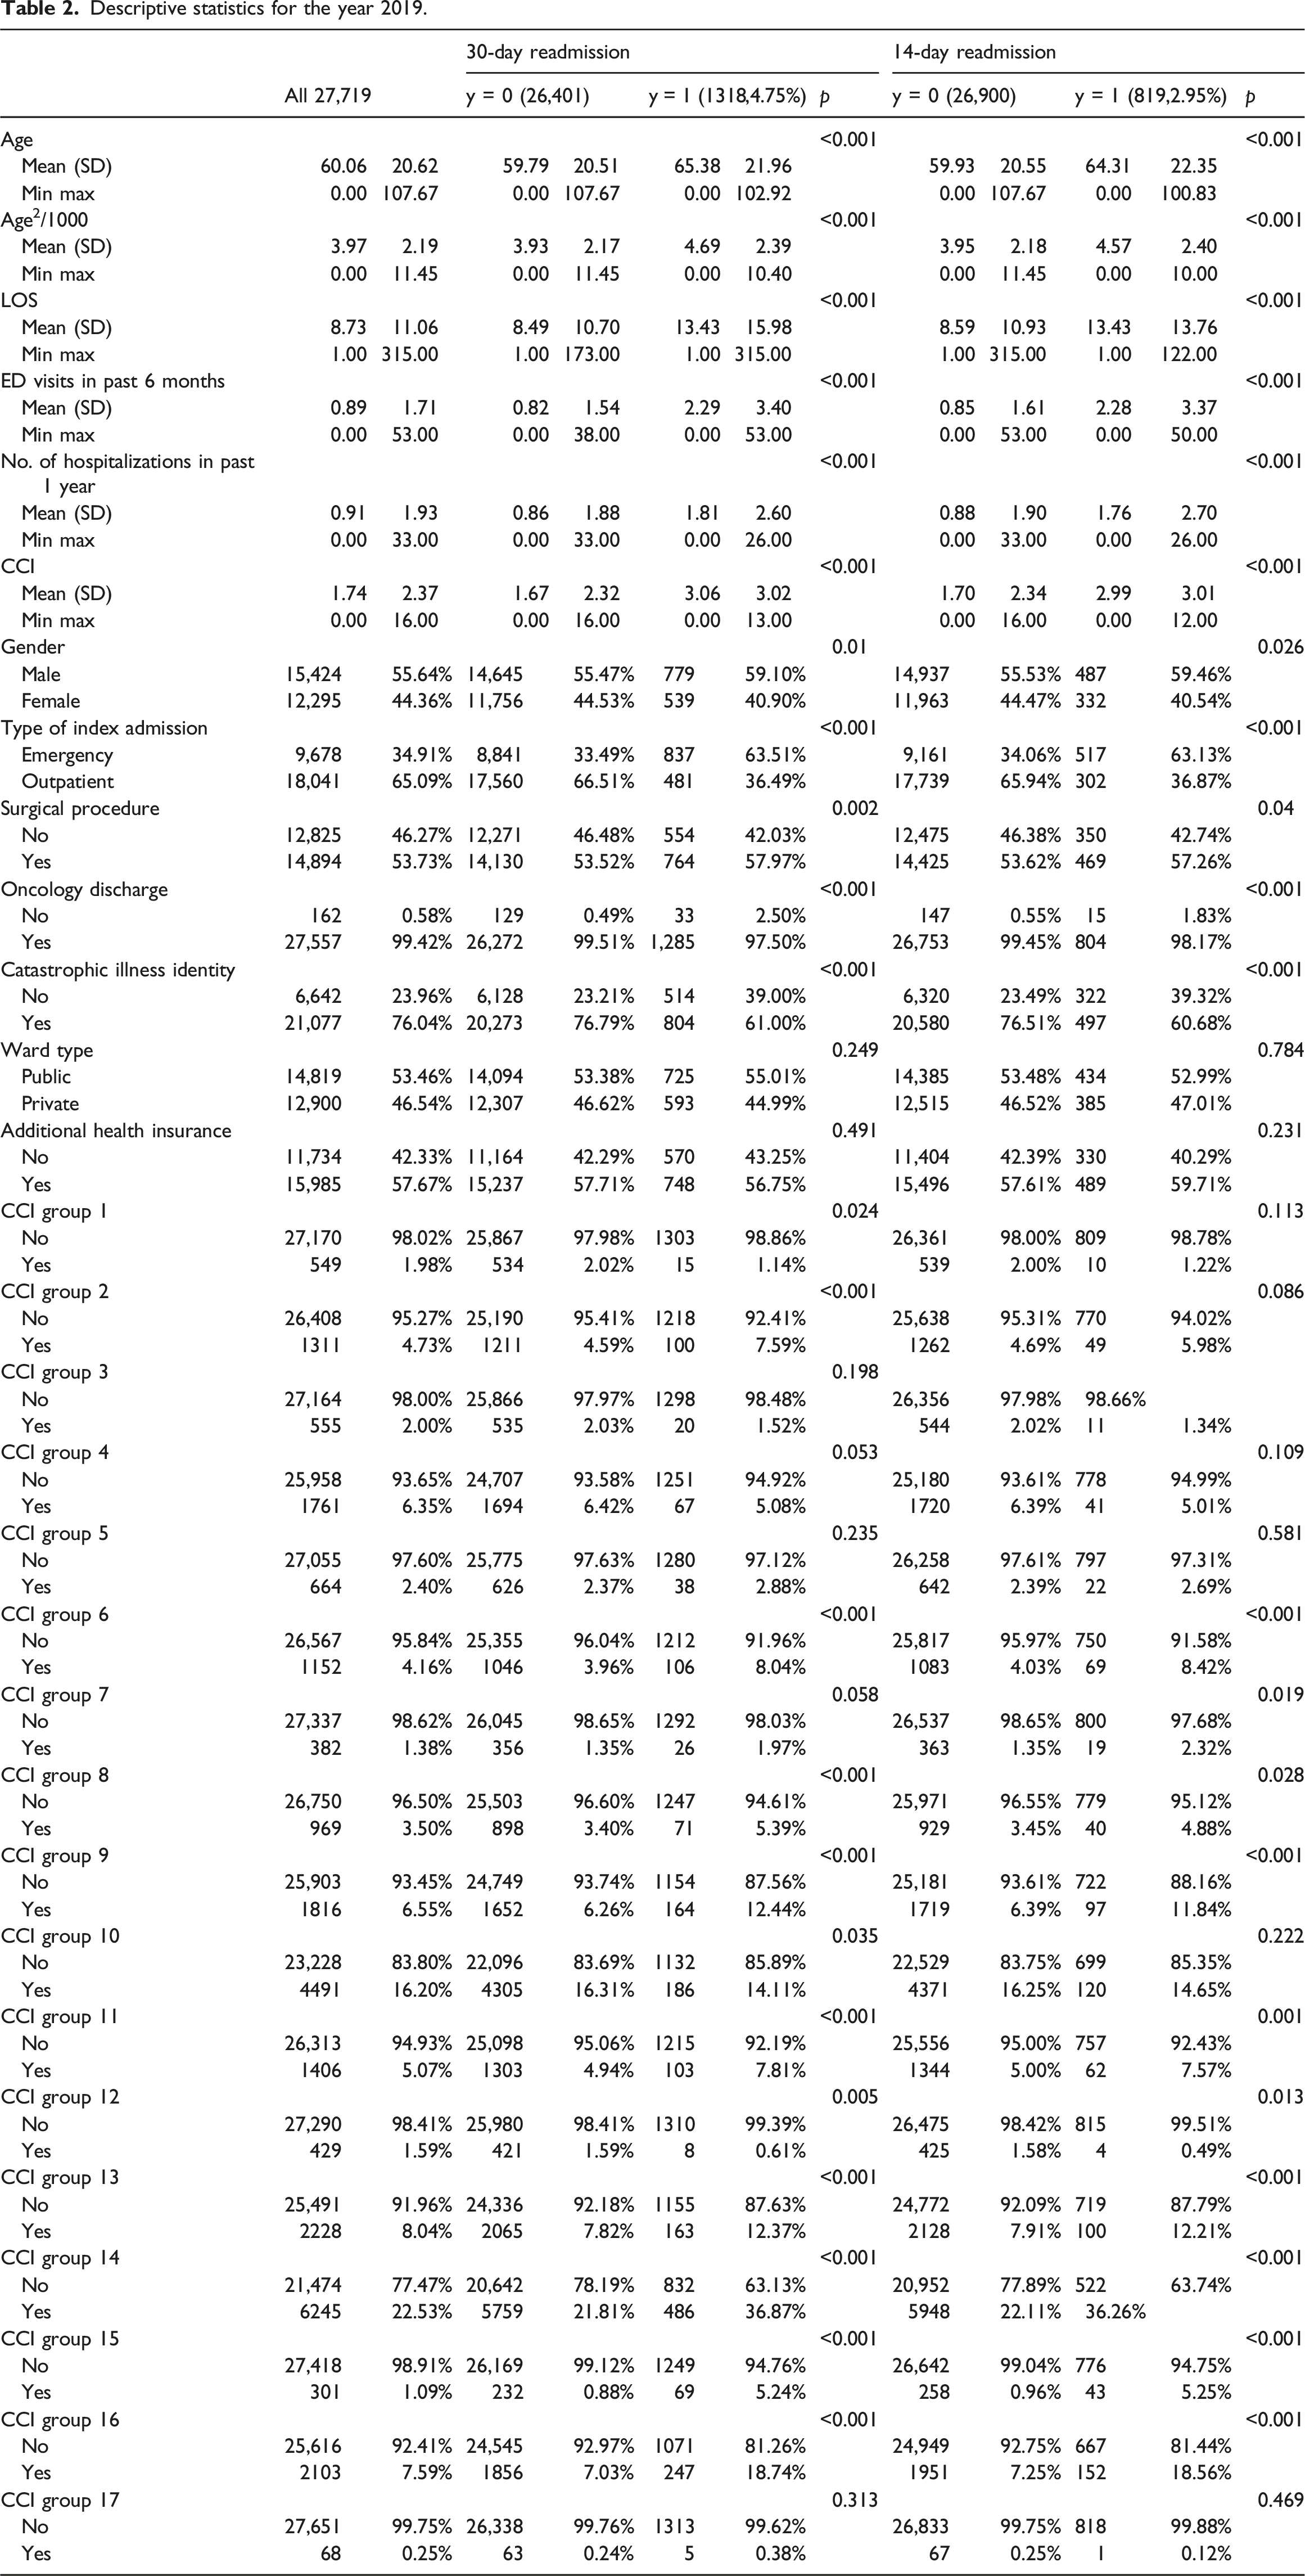
Descriptive statistics for the year 2019.
RF training and variable importance
Figure 2 shows that both the OOB and the validation errors stabilized below 2% when the numbers of subtrees, i.e., iterations, reached 500. We, therefore, set the numbers of iterations at 500 since we found that more than 500 iterations could result in overfitting. The numbers of trees, tree depth, and the size of the subset of predictors for the best-performing RF model were 500, 5 and 6, respectively. Out-of-Bag and validation errors versus iterations (the number of subtrees). Note: The number of subtrees starts at 5 and is incremented by 5 every time until it reaches 500. Each run produces a pair of OOB and validation errors in the plot.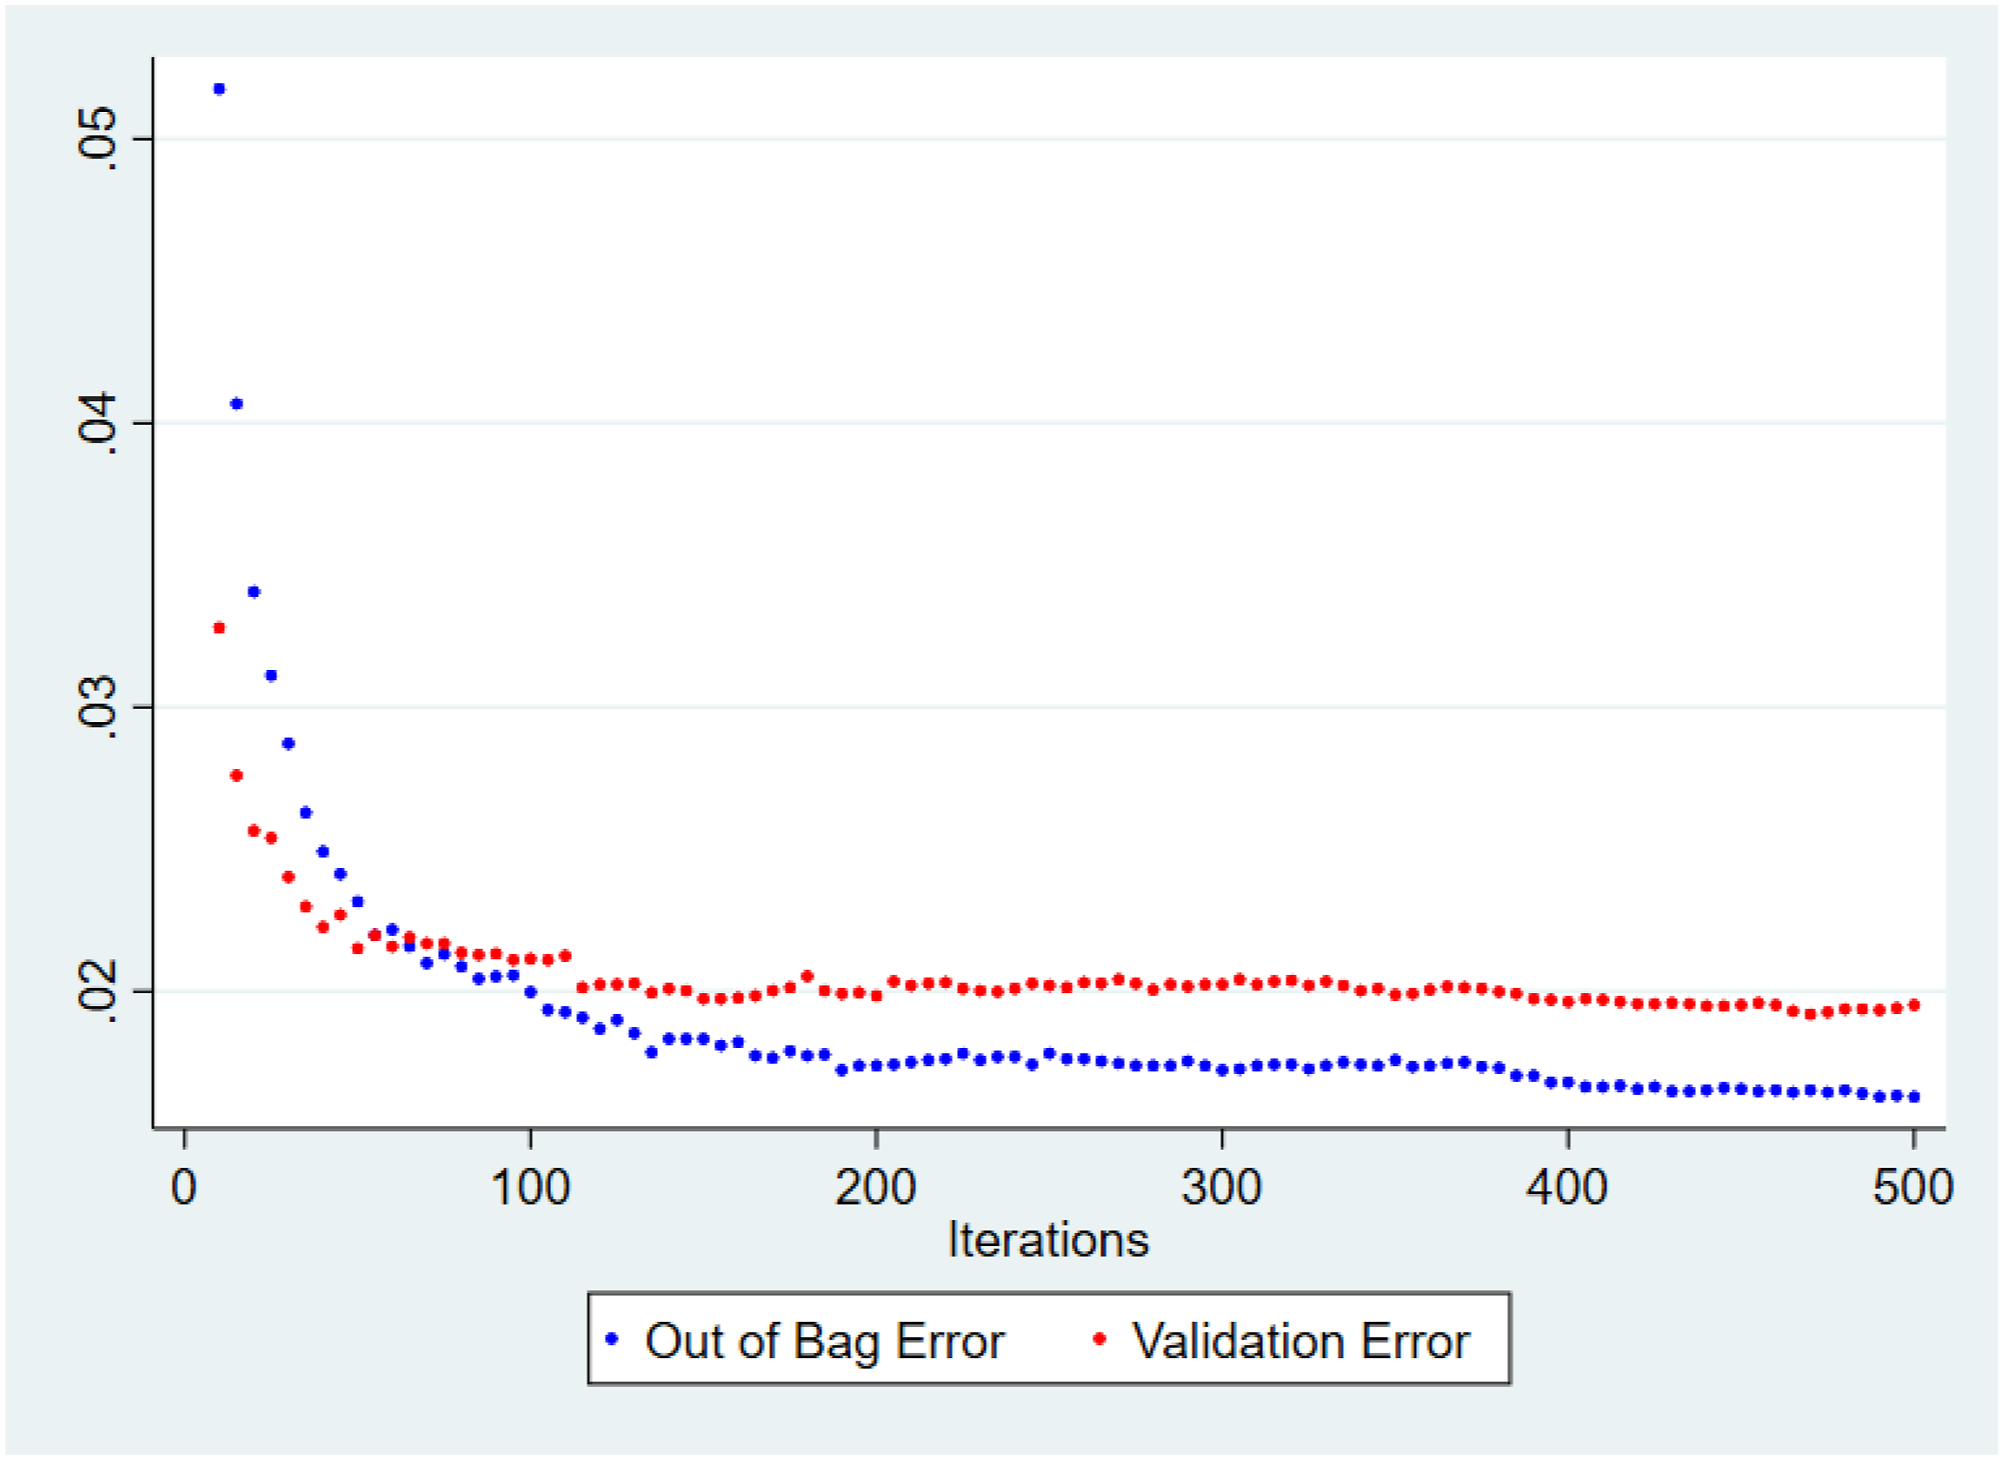
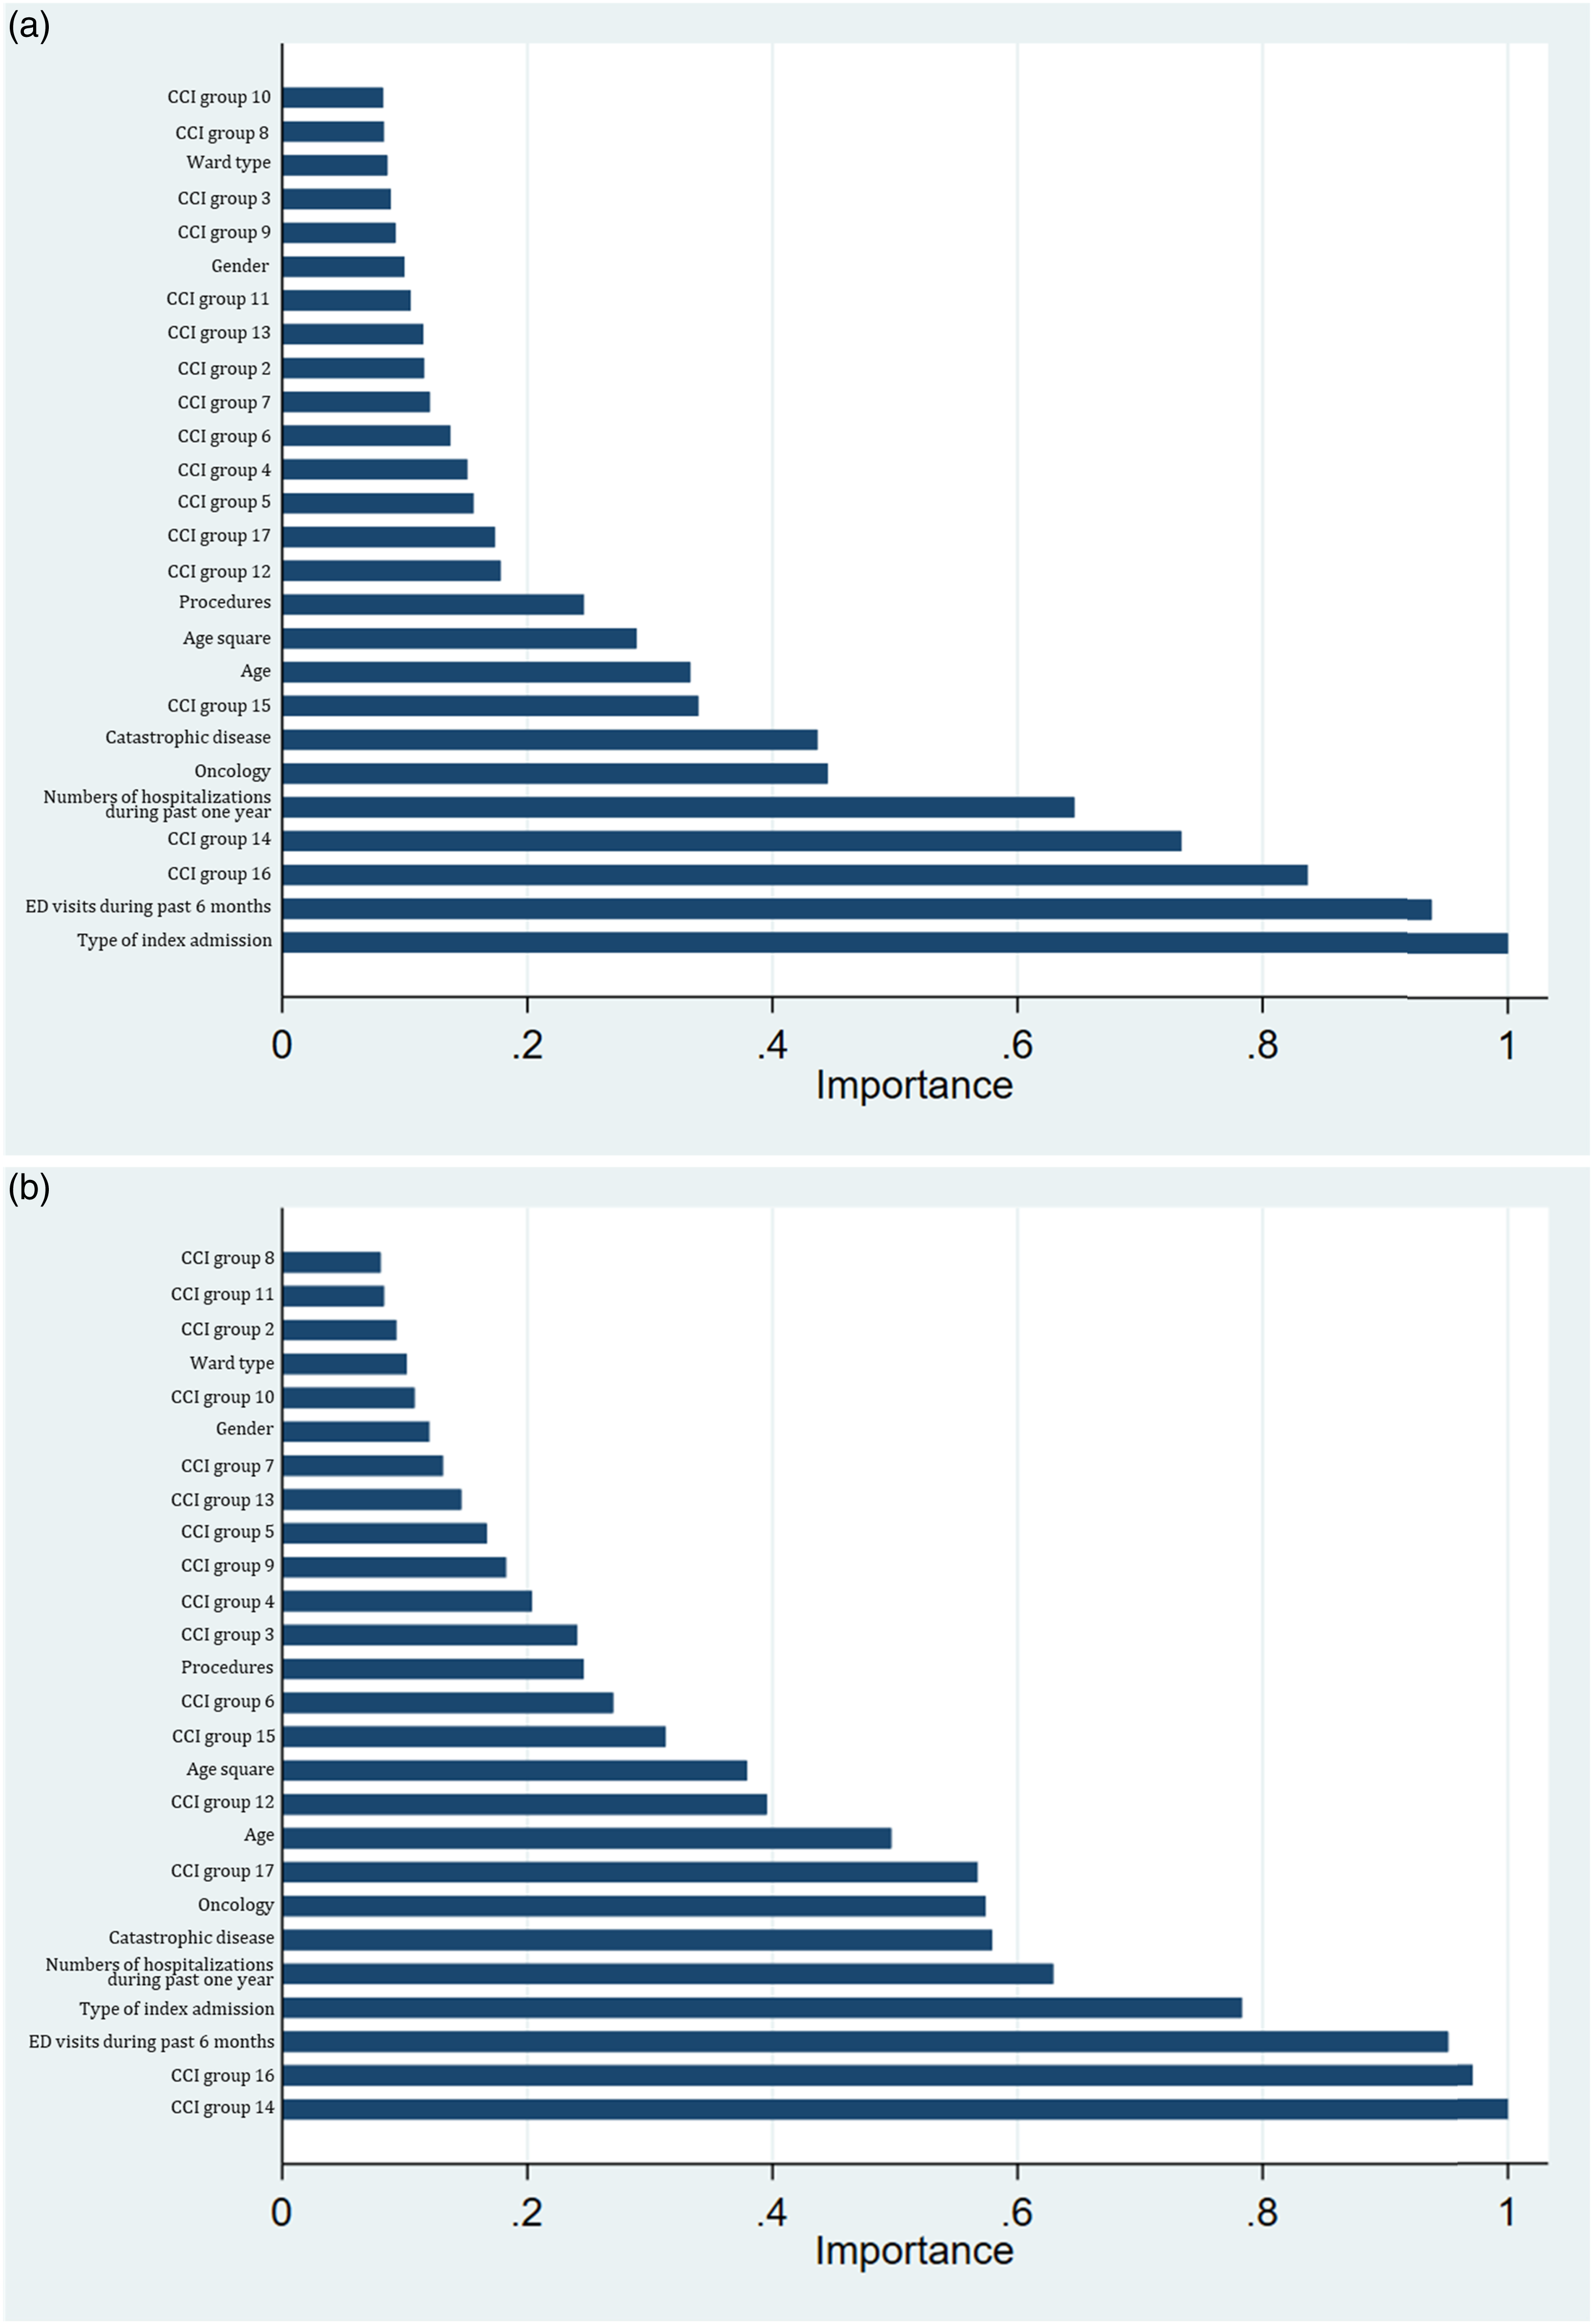
The variable-importance scores for the predictors are presented in Figure 3 and Figure 4 for 30- and 14-day readmission predictions. The three most important predictors for 30-day readmissions were type of index admission, ER visits in the past 6 months, and comorbidities of metastatic solid tumors, while those for 14-day readmissions were comorbidities of any malignancy and metastatic solid tumors and ER visits in the past 6 months. Final predictors included in the RF model were those that had high variable importance scores and were available at the initial stage of admission, as shown in Figures 4(a),(b). (a). Variable importance scores for 30-day readmissions using all predictors. (b) Variable importance scores for 14-day readmissions using all predictors. Note: ED, emergency department; LOS, length of stay; CCI group 1–17, 17 groups by Charlson Comorbidities; HGB, hemoglobin; cc, credit card. (a). Variable importance scores for 30-day readmissions using predictors available at admission. (b). Variable importance scores for 14-day readmissions using predictors available at admission. Note: ED, emergency department; LOS, length of stay; CCI group 1–17, 17 groups by Charlson Comorbidities.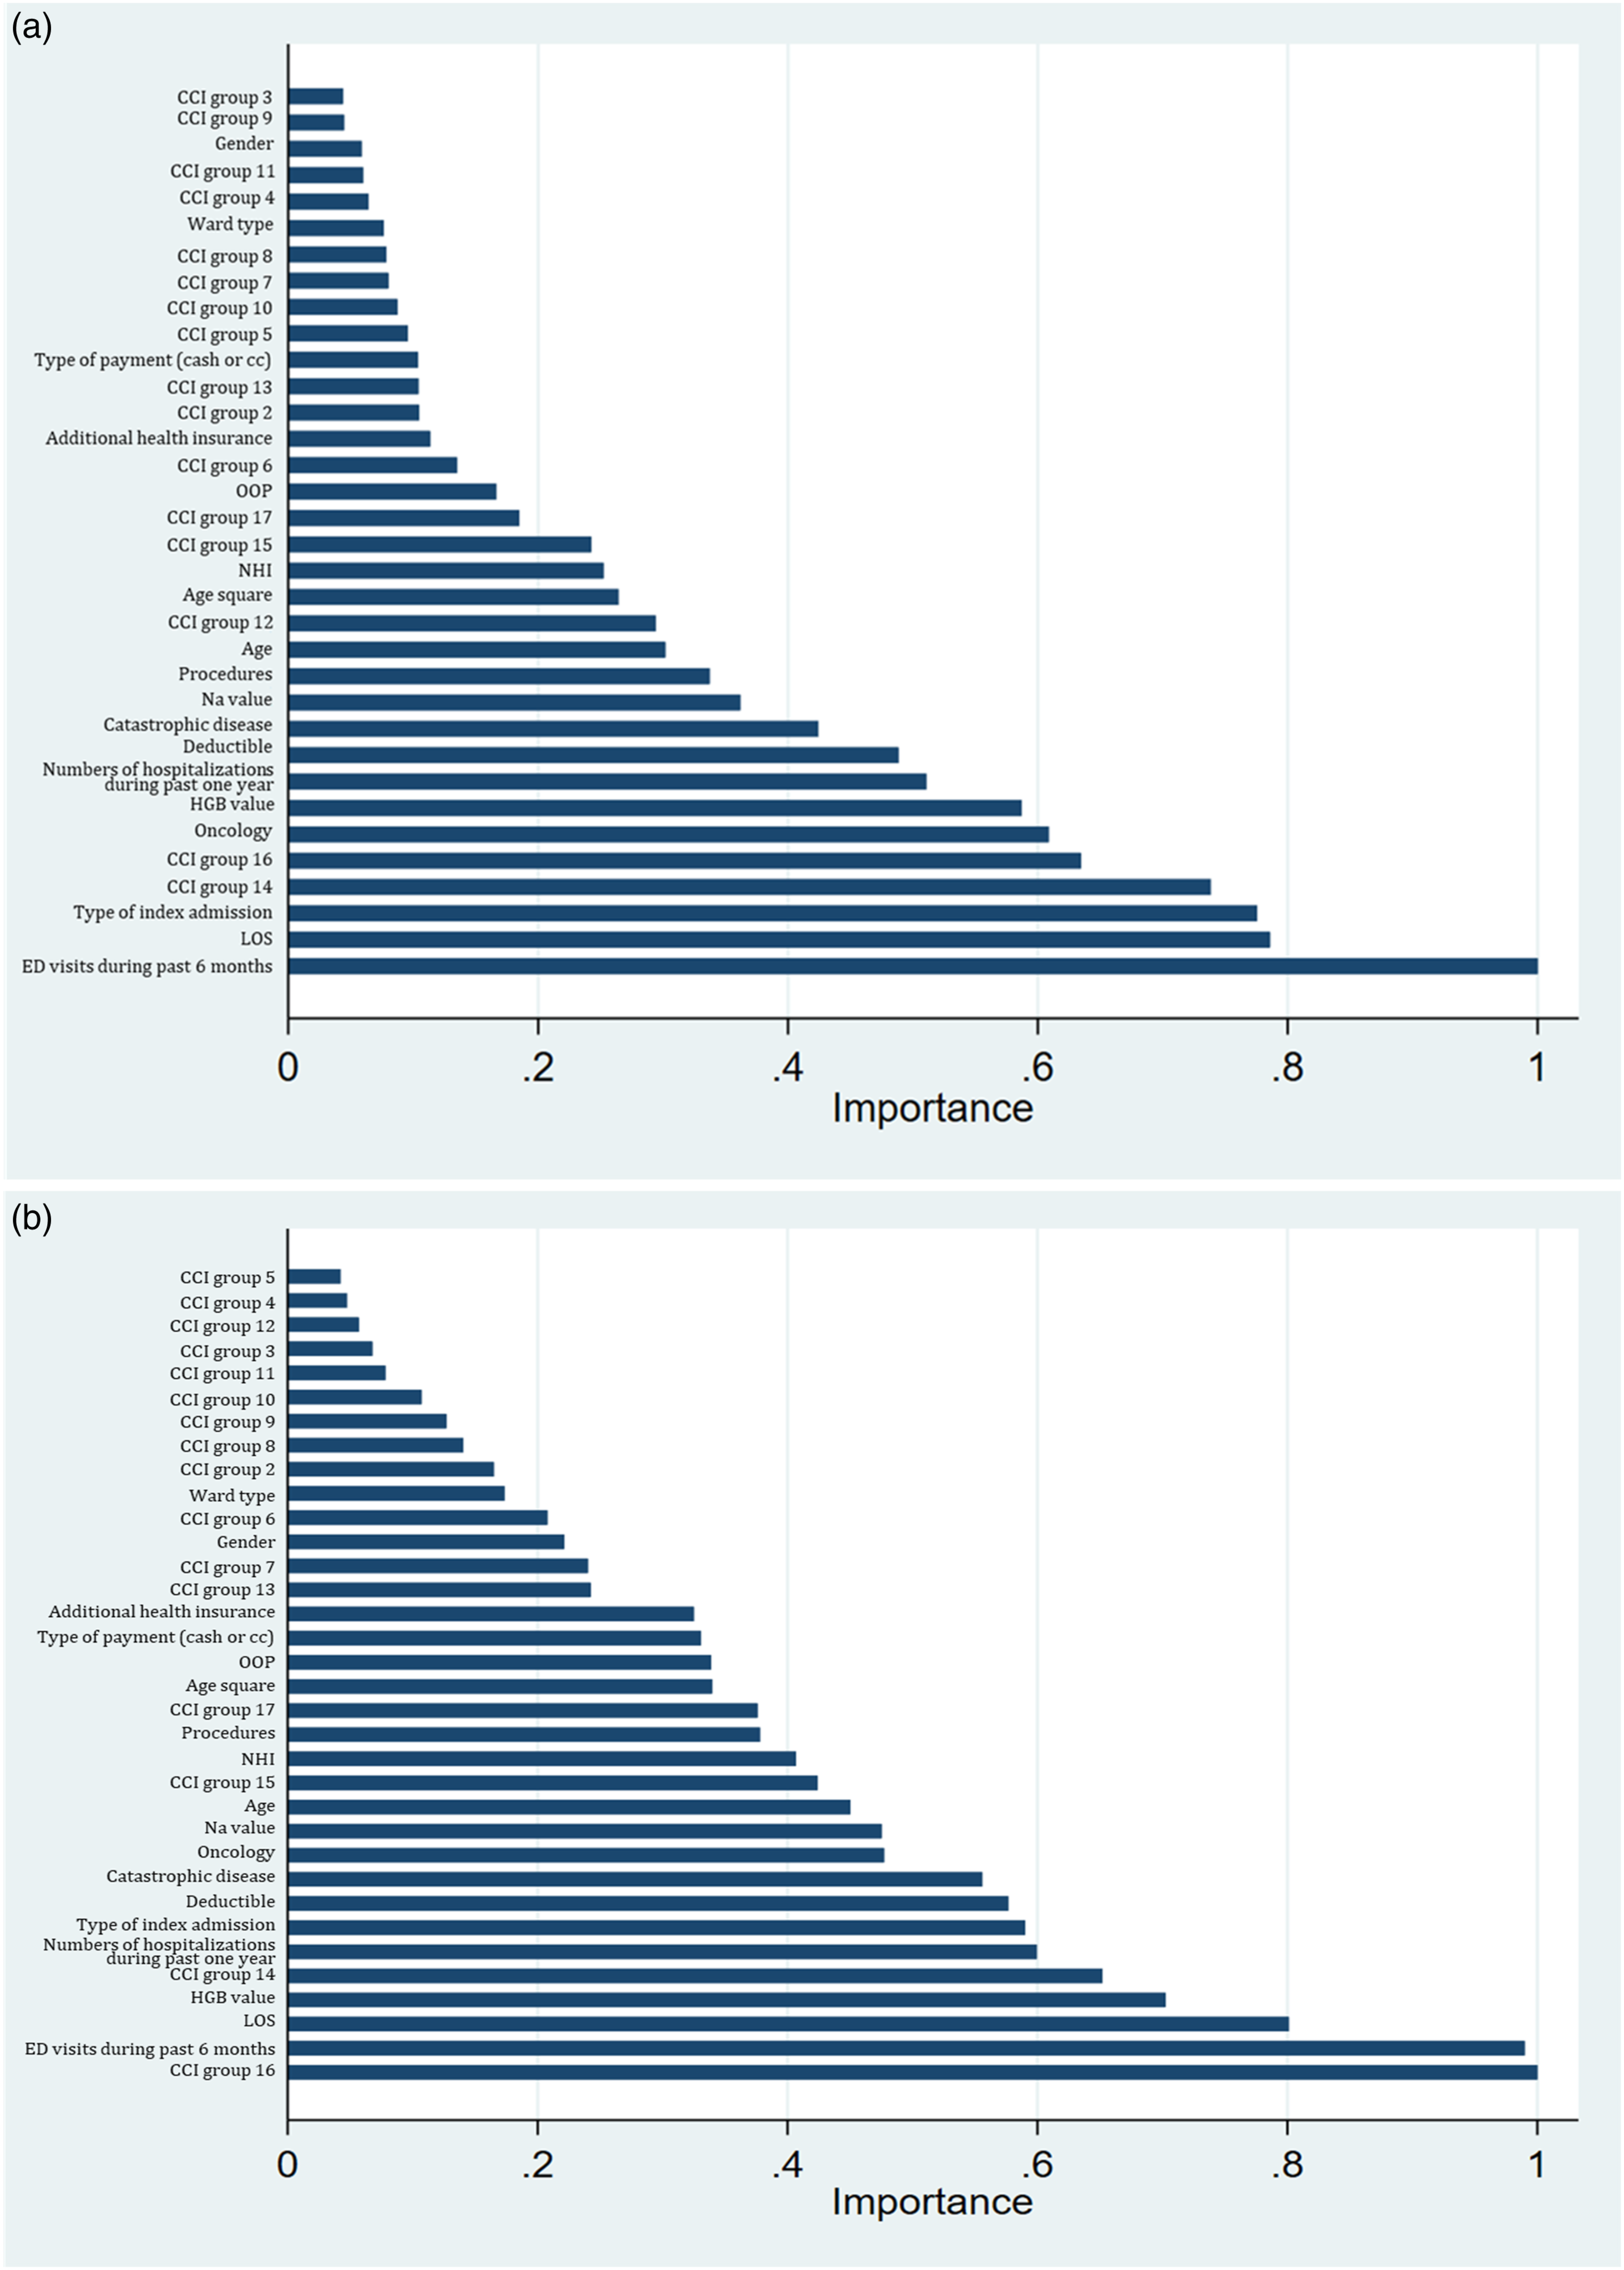
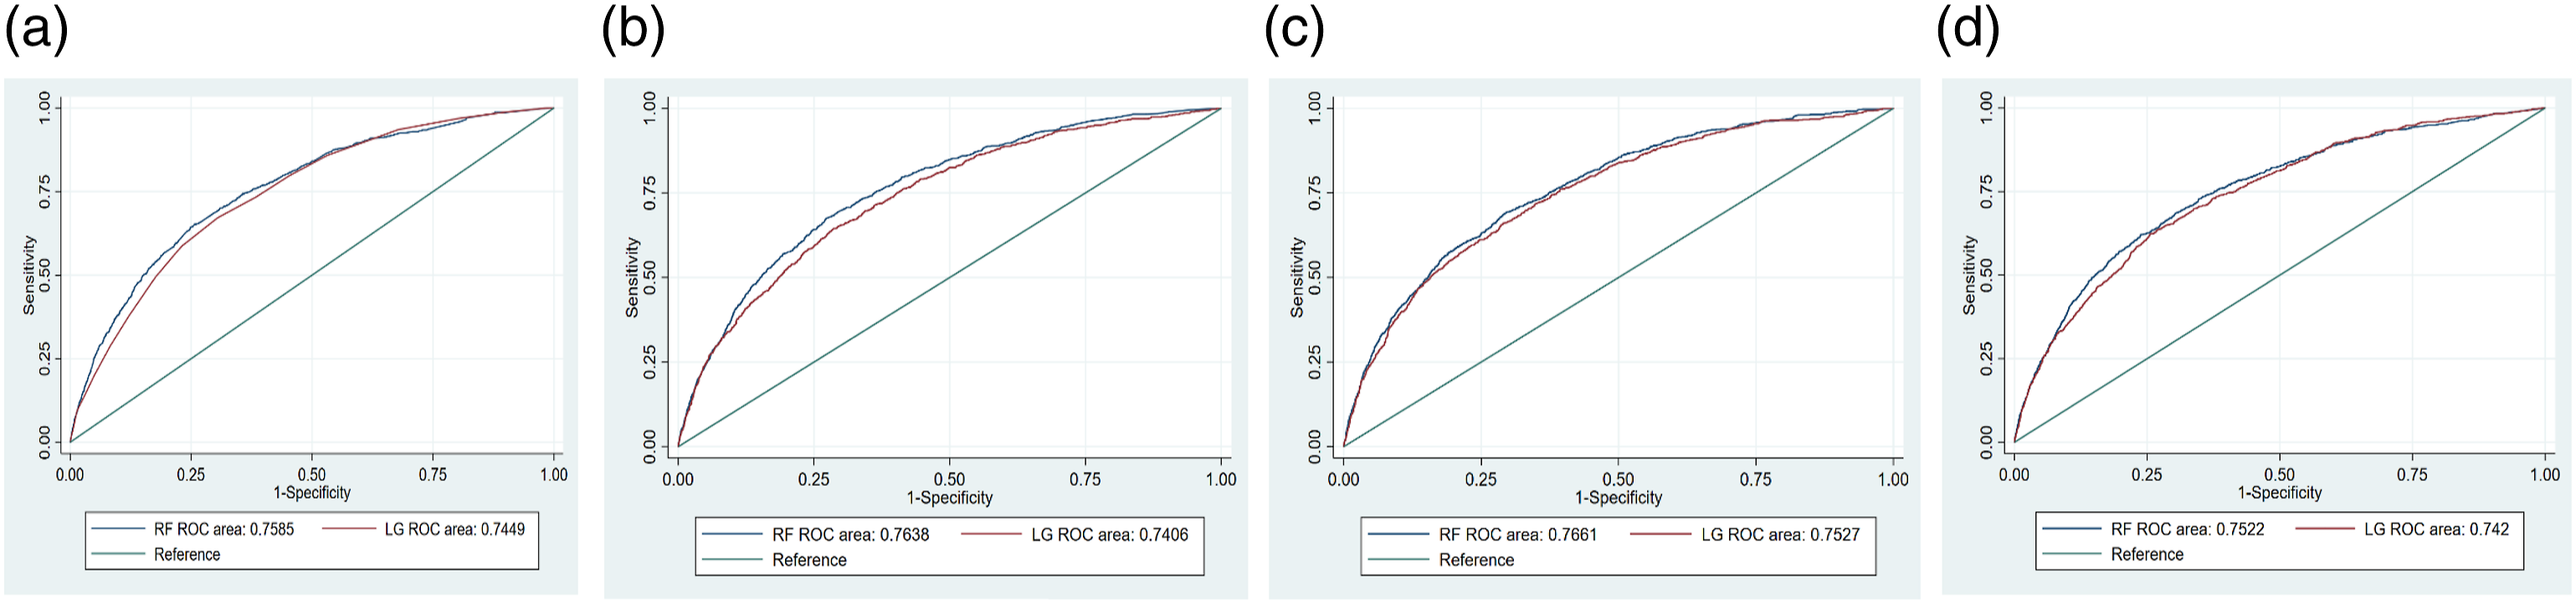
Performance of RF for predictions of 30- and 14-days readmissions
We found that RF algorithm to be capable of capturing nonlinearities and higher order interactions among variables, handling multicollinearity, and thus making better predictions for readmission when applied to large and high-dimensional datasets from EHRs in this study. Figures 5(a)–(d) and Figures 6(a)–(d) show the ROC curves of the RF and logistic regression (LG) in the eight models for the 30- and 14-day readmission predictions, respectively. Model 1 employed four variables in the LACE index, i.e., LOS, type of index admission, the Charlson comorbidity index and ER visits in the past 6 months. Model 2 added gender and age to Model 1. The full model consisted of all variables retrieved from patients’ EHRs while the final model included only predictors that were readily available at the initial stage of admission. Model comparisons for 30-day readmissions. (a). Model 1 for 30-day readmission. (b). Model 2 for 30-day readmission. (c). Full model for 30-day readmission. (d). Final model for 30-day readmission. Model comparisons for 14-day readmissions. (a). Model 1 for 14-day readmission. (b). Model 2 for 14-day readmission. (c). Full model for 14-day readmission. (d). Final model for 14-day readmission.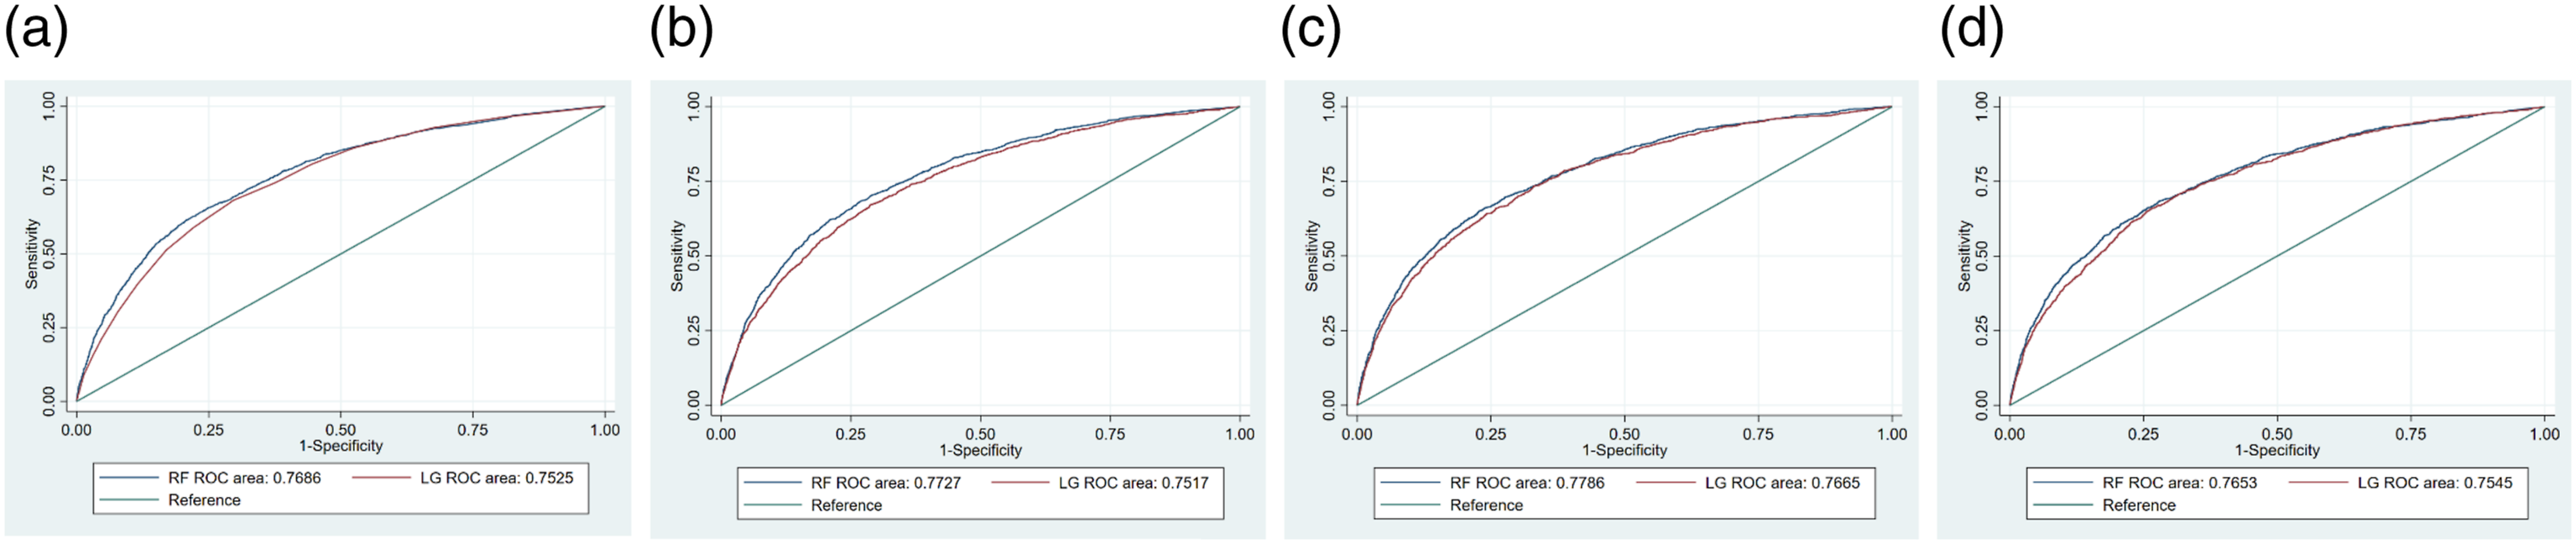
Comparisons of AUROC and relevant metrics at optimal cutoff point for 30-day readmission prediction.
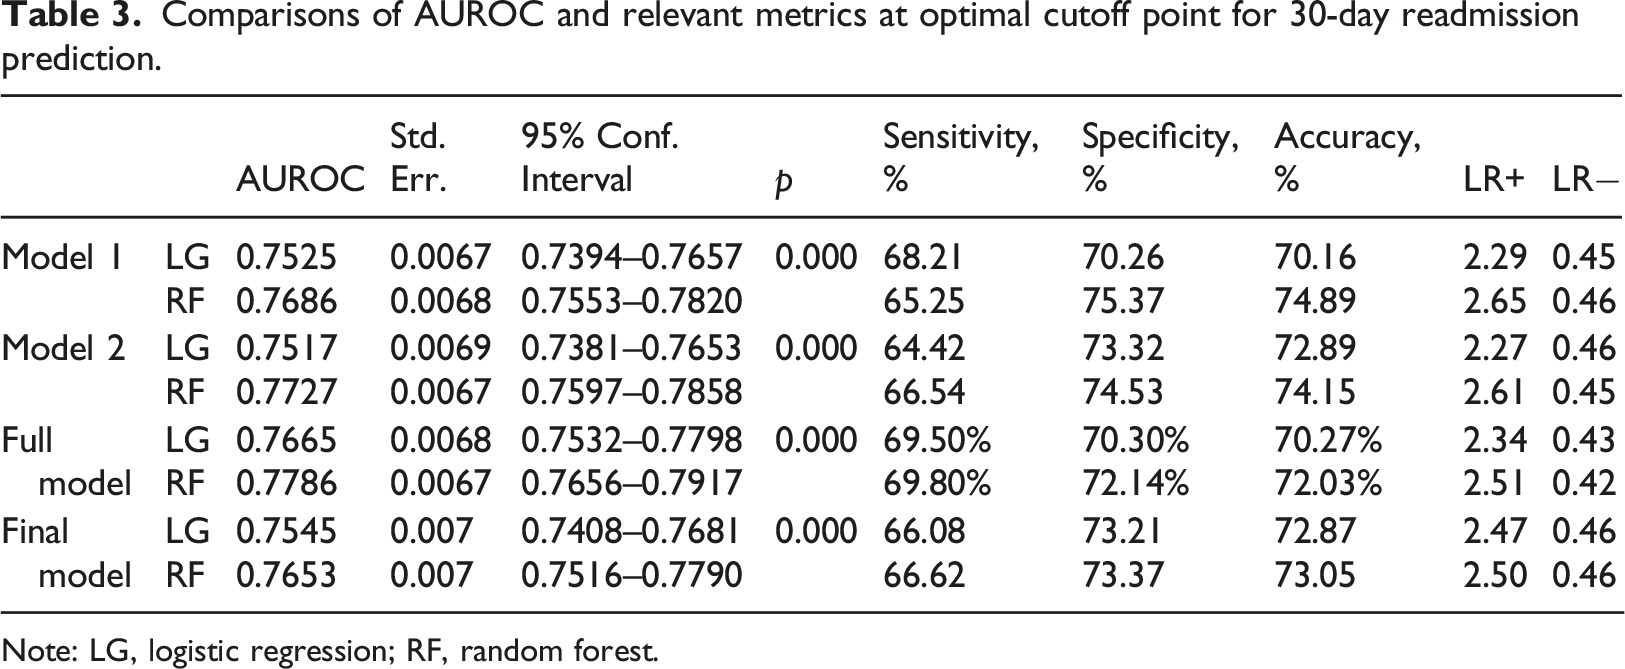
Note: LG, logistic regression; RF, random forest.
Comparisons of AUROC and relevant metrics at optimal cutoff point for 14-day readmission prediction.
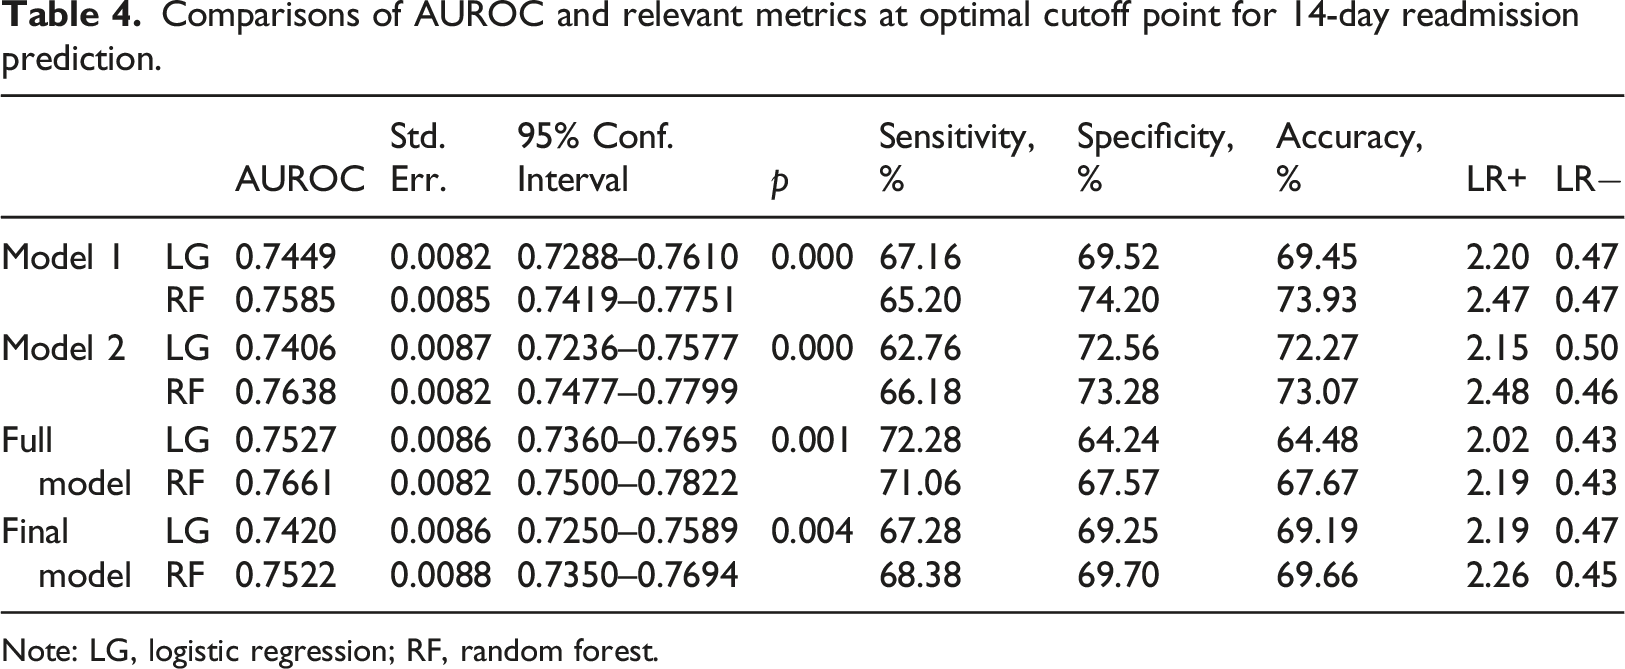
Note: LG, logistic regression; RF, random forest.
Discussion
The novelty of this study is that it develops and prospectively validates predictive models using the RF for the identification of 30- and 14-day readmissions and the associated dominant risk factors at the time of admission. We focused on a subset of predictors that are readily available at the time of admission to construct models without sacrificing predictive performance. These predictors are easily accessible in most patients’ EHRs, which means that the results of this study may provide valuable insights to other medical institutions for generalization and serve as a decision support tool.
There are several key observations to be made from the results. First, the 30- and 14-day readmission rates in the current study were respectively 4.86% and 2.90% in 2018, and 4.75% and 2.95% in 2019. Nearly two-thirds of the 30-day readmissions occurred within 14 days, which is consistent with literature reporting that the likelihood of unplanned readmissions is higher in the early period of post-discharge. 27 In addition, the prediction performance was better for 30-day readmissions (AUC = 0.77 for RF) than for 14-day readmissions (AUC = 0.75 for RF). These findings are in agreement with previous studies which found that readmissions within a shorter period post-discharge were harder to predict because the class distribution is much more skewed with an imbalanced number of non-readmissions and unplanned readmissions. 9
Second, ER visits in the past 6 months was an important predictor for all scenarios, i.e., for predictions using all predictors and those that are available at admission regardless of 30- or 14-day readmissions. However, the importance of other risk factors for readmissions differed between the 30- and 14-day time frames. Recently, several studies have indicated that readmissions within a shorter period of time may be more preventable than those in the later 30-day period.10,20,21,28,29 We found the most important predictor for 30-day readmissions to be directly related to the factors representing the index for hospitalization, i.e., the ER admissions. However, the most important predictor of 14-day readmissions was associated with a higher chronic illness burden of refractory malignancies and lower socioeconomic status such as ward type or gender, variables beyond a hospital’s control. This could be explained by the retrospective nature of the pre-existing data employed in the current study and by the fact that our results are based on data obtained from a medical center in Taiwan, where NHI reimbursement is reduced if patients are readmitted due to the same or related diagnosis within 14 days after discharge. Such financial pressure may create an incentive for hospitals to reduce preventable readmissions within 14 days. Thus, risk factors of 14-day readmission that can be attributed to quality of hospital’s care were rare in the current dataset. For example, every patient in Taiwan has a follow-up visit in an ambulatory care department within 2 weeks after discharge. The 14-day readmissions adopted by Taiwan’s MHW appears to have an effect in terms of reducing preventable readmissions related to index admissions or acute illness burden. Our findings confirm the arguments from the literature that shorter-term readmissions motivate clinicians, who generally feel more responsible for events that are related to illness acuity. 30
Third, in contrast to most risk prediction models derived using data available at discharge,3,6 we have selected variables based on the purpose for which the patients with high risk of readmission can be identified earlier during their hospitalization, especially using the index diagnosis codes to classify patients’ disease status based on Charlson comorbidities index. Our RF prediction model successfully identified several useful predictors that were easily accessible at the time of admission using the patients’ EHRs. Using predictors that are readily available at admission allows more time for interventions to be started, thereby helping clinicians provide timely and appropriate treatment for their patients. Such interventions should improve the quality of healthcare within the hospital’s control. It is suggested that the main factors influencing the variability in 30-day readmission rates are hard to change by hospitals since they are considered to be an intrinsic part of a hospital’s patient population. The accessibility to healthcare system as well as patients’ socio-economics determinants of health also play a crucial role. 31 If we are to hold hospitals responsible for readmissions and yet not to penalize those that care for more vulnerable patients, then a shorter time window may be considered to be a more equitable metric of accountability for hospitals.30,31
The findings of the current study can potentially contribute to the development of mobile health (mHealth) clinical decision support tools for reducing readmission. The dominant risk factors identified in the current study upon admission can be directly integrated into the EHRs or be made available to the frontline clinical staff via an mHealth App to initiate just-in-time pre-discharge interventions such as patient education and medication reconciliation to achieve a better quality of care. The penetration rate for Internet and mobile phone use in Taiwan is high, so the use of mHealth Apps hold great potential for healthcare providers. These Apps can be used to enhance the control of risk factors for targeted patients, to improve patients’ medication adherence, and to encourage a better communication between patients and clinical professionals. Recently, throughout the covid-19 pandemic, people in Taiwan have become much more familiar with the mHealth technologies. Further investigation could be conducted to assess the cost and benefit of integrating our findings into mHealth App in reducing the unplanned readmissions.
There are limitations to this study that should be noted. For clinical operational purposes, our focus is on developing and implementing a real-time readmission prediction model. As a result, some popular readmission predictors, such as length-of-stay and laboratory tests, are not included in the Final model, since these variables are not available upon admission. The RF constructed in the current study using data that is readily available at admission has a marginally yet significantly better ability to identify high-risk readmissions within 30 and 14 days without penalizing the sensitivity and specificity. However, caution should be taken when interpreting the prediction performance of ML technique since its benefit may depend on factors like sample size, data dimension and disease investigated. 32 It is well recognized that healthcare data are often not linear and are difficult to capture using simple algorithms, especially in view of the complexity in the patterns of readmission. 33 Thus, the improvement in prediction performance between RF and logistic regression methods in the present study, though modest, could be due to the potential greater nonlinearity and higher-order interaction between predictors and outcome variable of readmission as well as missing values. However, a few studies have reported that ML algorithms may not outperform traditional regression approaches in a low-dimensional setting for outcome prediction because it has been suggested that ML techniques perform better when a large number of predictors are being considered. 32 The relatively low-dimensional setting in the current study may potentially limit the performance of RF over logistic regression. The reason that we only considered a relatively small number of predictors available upon admission was mainly to obtain a real-time assessment of high-risk readmission for clinical practice. Another reason for not including more predictors was related to the validation purpose because clinical variables often have different definitions, notations, or units, which complicate the validation procedure with a large number of predictors. 34 Thus, we believe that the low-dimensional setting in our study might be more clinically meaningful. Further investigation may be focused on the thresholds to decide whether an improvement in the AUC is considered as clinically important in model performance through cost–benefit analysis when applying the predictive model.
Moreover, as mentioned earlier, Taiwan’s MHW has adopted the 14-day readmission rate as a quality indicator and has tied it to the NHI reimbursements. In response to such financial penalties, hospitals might take active measures to reduce readmissions within 14 days, which may potentially lead to a selection bias in identifying the importance of risk factors for readmissions. Most retrospective studies have the same problem. Although we have explicitly validated the RF method using data from different time period, the generalizability of our findings could be limited. Further investigations are needed to see whether and how differences among hospital regulation and care practices impact external generalizability of readmission prediction models. Notwithstanding the limitations of this study, our results suggest that this real-time prediction model holds great potential without sacrificing the discriminatory capabilities and should offer some insights regarding the clinical utility of different readmission time intervals as a decision support tool.
Conclusion
It is crucial for healthcare planners to identify dominant risk factors based on index admission and different readmission time intervals because the causal pathways between earlier and later readmissions may be distinctly different. They may, therefore, require different evaluation criteria and subsequent interventions.
Footnotes
Declaration of conflicting interests
The author(s) declared no potential conflicts of interest with respect to the research, authorship, and/or publication of this article.
Funding
The author(s) disclosed receipt of the following financial support for the research, authorship, and/or publication of this article: This work was supported by the Ministry of Science and Technology (grant numbers MOST109-2410-H-992-005, MOST 110-2410-H-992-015); and the Kaohsiung Veterans General Hospital (grant numbers KSVGH110-D07-1).
Ethical approval
This study was approved by the Institutional Review Board of Kaohsiung Veterans General Hospital (IRB No.: KSVGH20-CT4-11; KSVGH22-CT7-06).