
Abstract
Cancer diagnosis using machine learning algorithms is one of the main topics of research in computer-based medical science. Prostate cancer is considered one of the reasons that are leading to deaths worldwide. Data analysis of gene expression from microarray using machine learning and soft computing algorithms is a useful tool for detecting prostate cancer in medical diagnosis. Even though traditional machine learning methods have been successfully applied for detecting prostate cancer, the large number of attributes with a small sample size of microarray data is still a challenge that limits their ability for effective medical diagnosis. Selecting a subset of relevant features from all features and choosing an appropriate machine learning method can exploit the information of microarray data to improve the accuracy rate of detection. In this paper, we propose to use a correlation feature selection (CFS) method with random committee (RC) ensemble learning to detect prostate cancer from microarray data of gene expression. A set of experiments are conducted on a public benchmark dataset using 10-fold cross-validation technique to evaluate the proposed approach. The experimental results revealed that the proposed approach attains 95.098% accuracy, which is higher than related work methods on the same dataset.
Keywords
Introduction
Prostate cancer disease is the second leading source of mortality in men. It comes after lung cancer in terms of exceeding and threatening in the world. The etiology of this cancer type is still not fully recognized yet. However, some factors such as heredity, diet, and environmental influences that affect male hormones have been mentioned in epidemiological studies.1 –6
Microarray technology is a leading-edge technology in molecular biology when it comes to the contribution of information in quantitating hundreds or thousands of genes that are used in the diagnosis of different diseases and to predict the possible outcomes of an ailment. The genes which are regulated due to disease condition can be analyzed through the expression extracted from the microarray data samples. These measurements also assist in the investigation of cancer for clinical medicine at the biology and molecular level. 7
Cancer can alter the gene expression profile of the body cells. This fatal genetic disease transpired from the mutations or epigenetic changes. Therefore, the microarray data is utilized in clinical diagnosis to recognize down or up the regulated gene expression, which is the reason for activating some oncogenic pathways, generating new biomarkers, and leading to cancer disease. 8 Nevertheless, this approach comes with a considerable cost and time. Moreover, it is not clinically applicable to all patients. The algorithms used in the data analysis are not helping the researchers either due to their restrictions, which is a massive setback for microarray technology. Microarray array data analysis has been used as a source for profiling gene expression for many decades. 9 However, it suffers from noise and the difficulty of range detection as it involves transcriptome and genome references. 10 Mainly, it utilizes the sequence-specific probe hybridization accompanied by fluorescence detection to estimate gene expression levels. 11
Progression of cancer could be closely monitored through building a set of genes markers with data analysis techniques. Quantity of genes utilized in the analysis is highly crucial for microarray data. A large number of genes might lead to redundancy and correlation among features affecting the accuracy results of a cancer diagnosis. Besides, a small number of genes could result in unreliable accuracy results. 12 Therefore, an optimal number of genes is needed to predict the class labels of prostate cancer efficiently with high accuracy results. A significant drawback of microarray data is the massive number of genes captured from microarray data with a small number of samples. This drawback will not only significantly cause to overfitting problem and decrease the accuracy of microarray data classification, but also increase the computational cost. 13 A small sample size of microarray data with large attributes is still ongoing research direction to date. Many studies seek to solve this problem through many techniques; for example, Li et al. 14 proposed a novel method called the semi-supervised maximum discriminative local margin (semiMM). The authors used mutual information theories and spectral graph for selecting gene from expression data that has a small sample size with high dimensionality. In the other recent works proposed in Nirmalakumari et al., 15 Raj and Mohanasundaram, 16 Bentkowska, 17 and Santhakumar and Logeswari, 18 the authors have been presented some solutions for this research issue in gene expression of microarray data.
In this case, selecting the significant and most essential genes is needed for reducing the high dimensionality of genes feature space. The relevance of genes is grouped into three groups: Strongly related, weakly related, and unrelated genes. 19 The group of strongly related is for those genes that are shown in the cancer cell formation and required in the optimum set. The weakly related and unrelated groups are ignored from the optimum set. 19
Genes are selected for the investigation of disease for the following reasons: (a) by rendering only the significant genes make the classification process easy, (b) accuracy of classification is improved, and (c) the dimensionality of the data set is reduced. 20 There are several methods like neighborhood-based analysis, 21 Bayesian variable-based selection, 22 principle component analysis (PCA)-based reduction, 23 and genetic-based evolution of sequence expressions 24 are used for choosing the optimal subset of genes for classification.
The effectiveness of genes selection is assessed by the accuracy of classification methods, which is highly crucial. There is also a variety of machine learning-based classification methods that can be used with genes feature selection for improving classification accuracy results. In recent years, machine learning algorithms are used in several applications and tasks, including brain tumor classification, 25 fall detection in connected home healthcare, 26 lymphoma prediction, 27 diabetes disease classification, 28 breast segmentation using k-means algorithm, 29 human activity recognition, 30 and medical decision support. 31
In the same context, some other machine learning algorithms such as k-nearest neighbor (kNN),21,32 support vector machine (SVM),33,34 artificial neural network (ANN), 23 deep learning model, 35 random forest (RF), 36 convolutional neural network, 37 and maximum margin linear programming (MMLP) 38 are applied for analyzing the microarray data.
There are some other works that have been employed the microarray data for cancer detection and diagnosis. The recent work introduced a method that aims to increase accuracy by using microarray data for cancer detection. 39 The earliest works proposed to use microarray datasets with different machine learning methods for diagnosing prostate cancer have been introduced in Penney et al., 40 Cuzick et al., 41 Erho et al., 42 Mo et al., 43 Tyekucheva et al., 44 and Sharifi-Noghabi et al. 45 The studies of these works are designed to predict if the tumor is metastasized or not. Even though the experimental results obtained from the microarray data of these studies are relatively acceptable, the gene expression features gained from the microarray data should be reduced to improve classification accuracy.
In Takeuchi et al., 46 the authors proposed a machine learning approach to diagnose cancer from clinical prostate data using an ANN model. They trained the ANN on clinical data containing 22 features. Although they reported that the model performed well, some improvements are needed on that model before being applicable for clinical diagnosis. However, there is still a need for more robust, accurate, and easily interpretable classification methods.
In the literature studies, some rule-based evolutionary machine learning models, such as BioHEL and GAssist are used for prostate tumor classification in Glaab et al. 47 through evaluating them on a large-scale public microarray prostate cancer dataset, which consists of expression measurements for 12,600 genes, acquired from 50 healthy normal tissues and 52 prostate cancer tissues. Other works such as Huerta et al., 48 Chen et al., 49 Dashtban and Balafar, 50 Dashtban et al., 51 and Shen and Tan 52 focused on improving the accuracy of cancer classification and prediction through gene feature selection or gene feature reduction. In Wessels et al., 53 the authors introduced a protocol to build and evaluate machine learning predictors of a disease state that applied to microarray data.
Recently, in Bouazza et al., 54 a comparative study has conducted for prostate cancer diagnosis using a set of feature selection methods and machine learning algorithms on microarray gene expression data. The authors in this study reported that feature selection using signal to noise ratio (SNR), correlation coefficient (CC), and SVM-recursive feature elimination (SVM-RFE) with classification using linear discriminant analysis (LDA) achieved a high accuracy result up to 95%.
However, there is still room for improving the accuracy of prostate cancer classification from microarray data. In other words, the previous works need an effective feature selection method to reduce the high dimension of gene features to a limited subset of relevant features and then use an appropriate machine learning algorithm for cancer classification.
In this study, we propose a practical approach for classifying prostate cancer from gene expression of microarray data by using a correlation feature selection (CFS) method with a random committee (RC) ensemble learning algorithm. The reason behind using a CFS method is its ability to take the correlation between features for selection, and the reason behind using the RC algorithm is its capability to solve the overfitting problems. Moreover, we evaluate the proposed approach using a 10-fold cross-validation technique.
The rest of the paper is structured as follows: Section 2 presents the proposed approach in more detail. Section 3 introduces the experiment and results. Finally, Section 4 summarizes the conclusion of the proposed work.
Proposed approach
The proposed approach takes the gene expression of microarray data samples as input. Then, it selects the relevant features using a correlation feature selection (CFS) method. Finally, the input samples with selected features are classified using a random committee (RC) model to output the classification results as normal or tumor cases. Figure 1 shows the flowchart of the proposed approach steps.
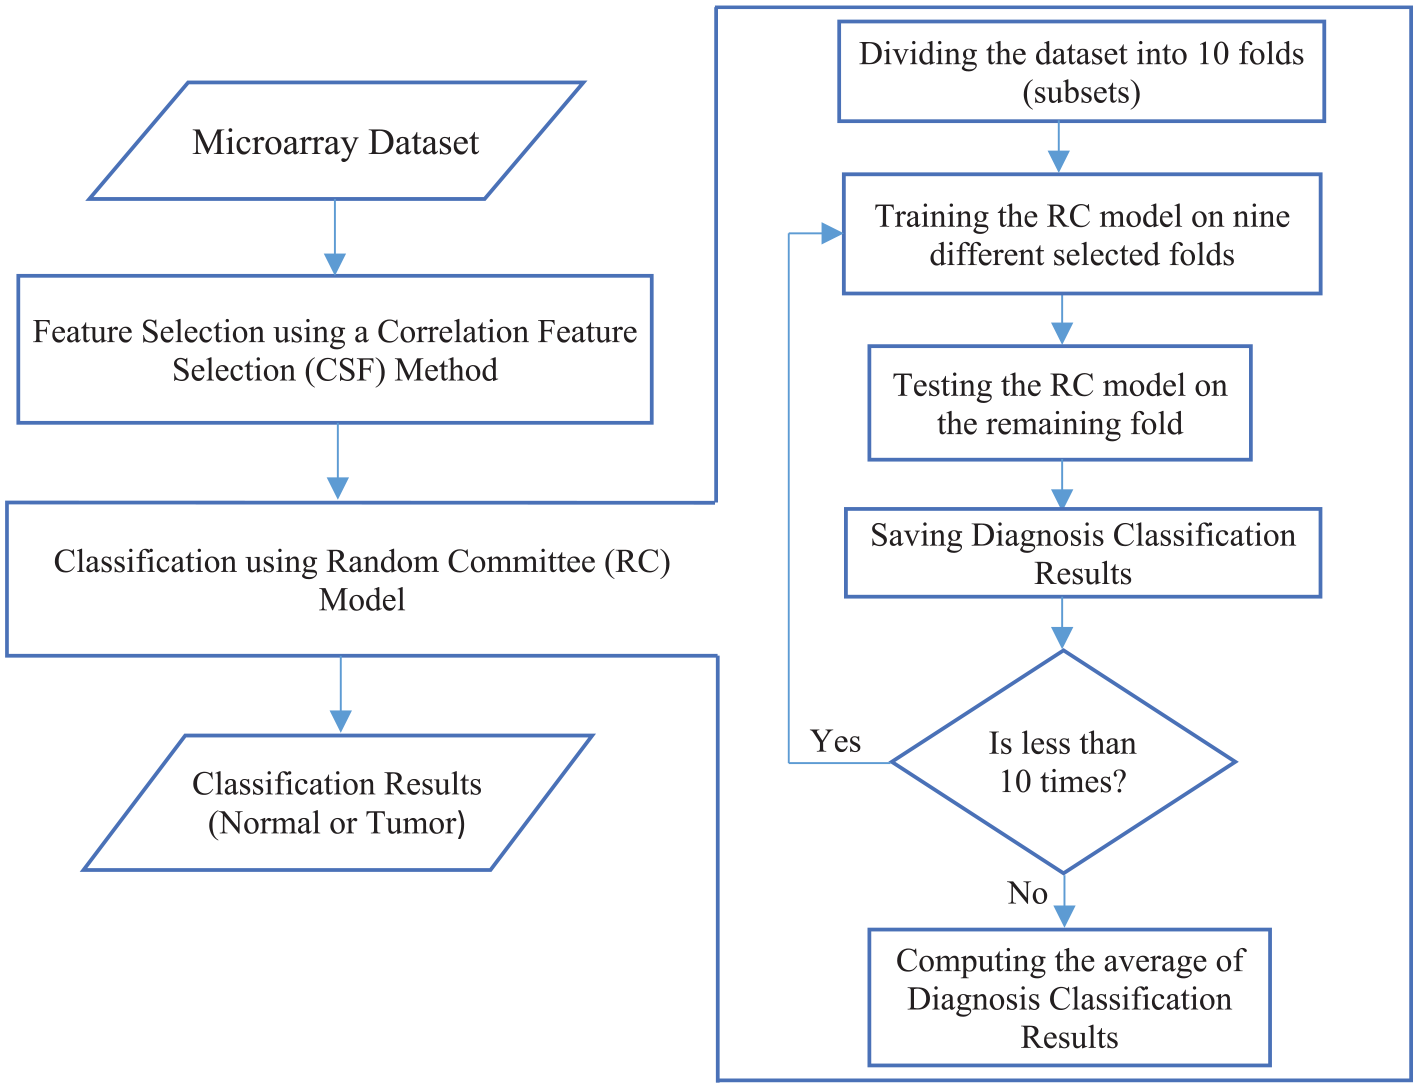
Flowchart of the proposed approach steps.
In the feature selection process, the less significant features are removed using the CFS method. The CFS calculates the feature-to-class and feature-to-feature correlations and then searches the correlations space of the feature subsets for selecting the best feature subset. Correlation is a statistical similarity measure used to evaluate the relationship between two variables. If the two variables are uncorrelated, the value of their correlation coefficient is 0. On the other hand, if the features are correlated, their correlation coefficient will always be between −1 and +1. Two coefficients can be commonly used to measure the correlation between two arbitrary variables or features. One is using a linear correlation coefficient, and the other is using an information theory coefficient. The linear correlation coefficient is the most familiar measure that can be computed between a pair of variables (x, y) in the training dataset of
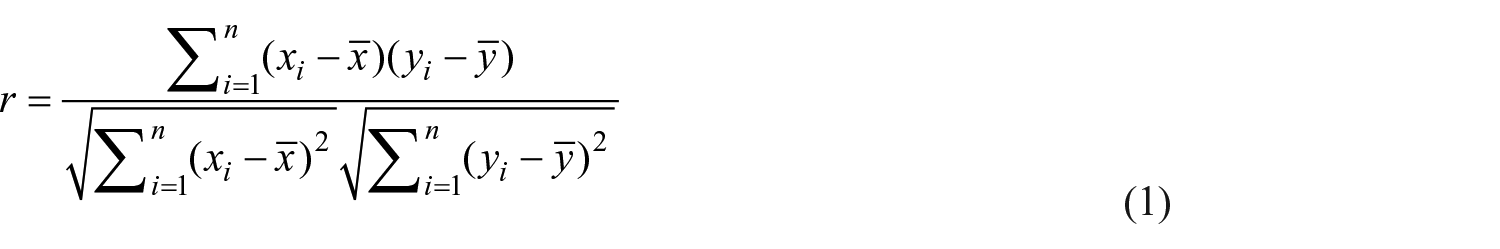
where
The CFS method removes all redundant and irrelevant features to improve classification accuracy results and speed up the execution time.
In the classification phase, the RC model is a supervised machine learning classifier, used to classify the microarray data samples with the selected features. It is an ensemble of random trees (RTs) base learners. Each base learner is built using a training dataset at a different random number of seeds. 55 The RTs are a collection of individual decision trees (DTs) in which each tree is produced from different subsets and samples of the training dataset. The main idea behind building these DTs is that for each instance to be classified, a number of decisions are generated in rank order according to their importance. When the features of an instance are built, it looks like a branch, and when the features of the entire dataset are constructed, the branches will form a tree. These trees are called RTs because they are actually trained on the dataset a number of times using a random subset of training instances, hence resulting in many DTs. Through this process, the overfitting problem will be mitigated. The final classification model is an average of the classifications generated by the individual RTs base classifiers. At the beginning of this phase, a number of RTs base learners of the RC classifier is initialized. The RC classifier is then trained and tested using a 10-fold cross-validation technique. The 10-fold cross-validation technique divides the dataset into 10 subsets through 10 iterations. For each iteration, a different subset is applied for testing, and the remaining nine subsets are used for training. The final testing result of the RC model is the average of all testing results obtained by those individual base learners in the 10 iterations.
Experiment and discussion
The experiment of this study is conducted on a public dataset of microarray prostate cancer gene expression, consisting of 102 tissue samples (52 prostate tumor and 50 normal tissues) with 2135 genes. 56 For more explanation about microarray data, a microarray is a laboratory tool that can be utilized to record thousands of genes expressed at the same time (see Figure 2). Similarly, DNA microarrays are microscope slides printed with thousands of tiny spots in defined positions, and each spot has a known gene or DNA sequence. Figure 3 presents the distribution of samples in the dataset.
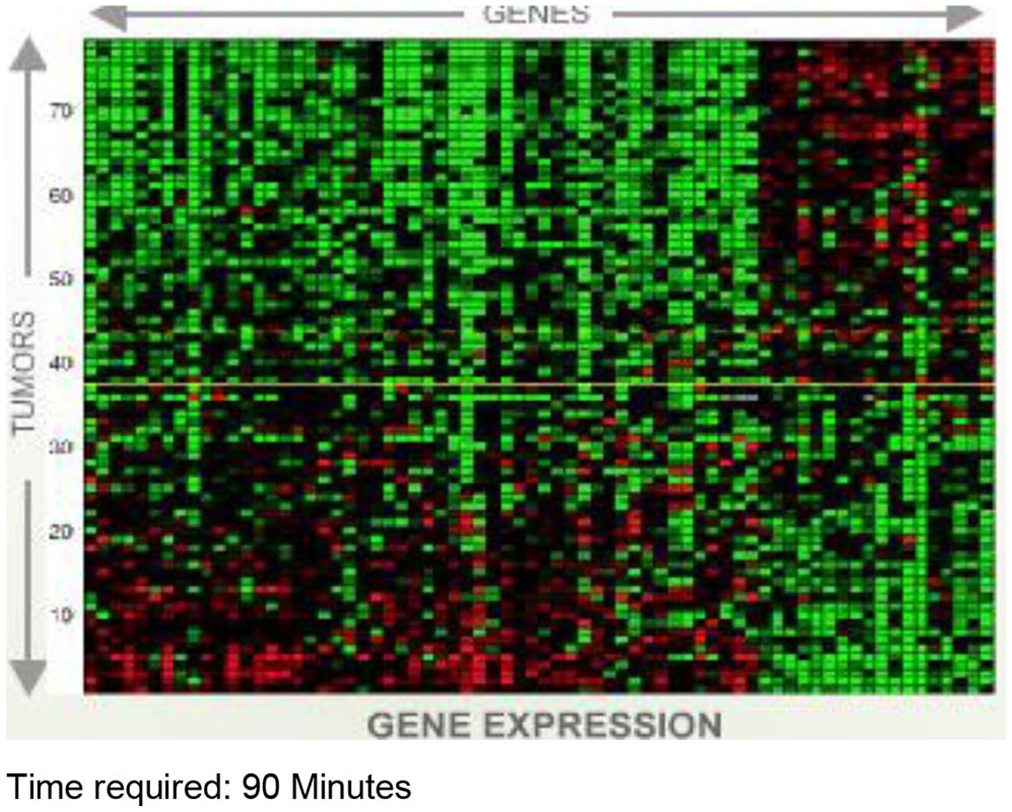
An example of a microarray of gene expression. 57
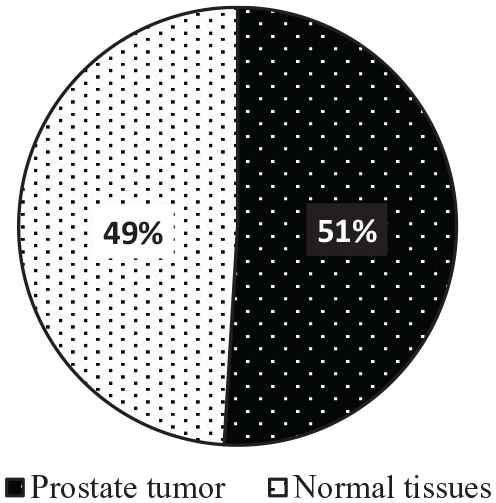
The distribution of samples in the dataset of prostate cancer.
The experimental evaluation metrics and results with comparisons are given in the following subsections.
Evaluation metrics
To assess the experimental results, we use a set of evaluation metrics. These evaluation metrics can be explained as follows:
It can be defined as a table that visualizes and describes the performance of the classification task on a test dataset in which the true positive and true negative samples are correctly classified. Figure 4 shows the confusion matrix of binary classification.
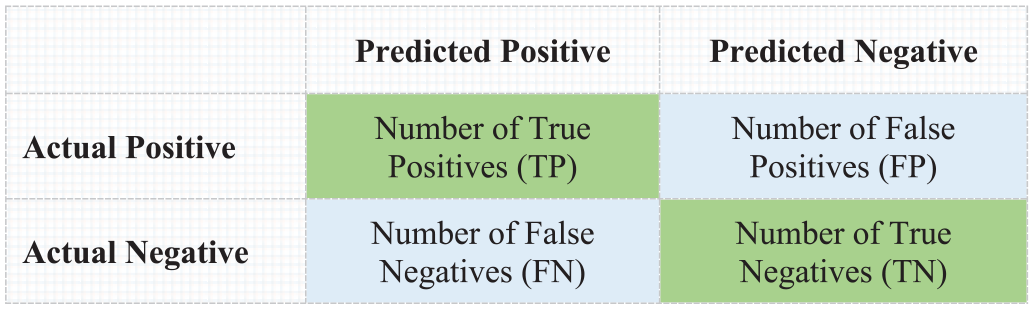
Confusion matrix of binary classification.
It is the number of samples that are correctly recognized as positive out of total true positives samples, computed as:

It is the number of samples that are correctly recognized as negatives out of total negatives samples, computed as:

It is the number of samples that are correctly recognized as positives out of total samples identified as positives samples, computed as:

It can be defined as a harmonic-mean of recall and precision, given by:

It is the ratio of total samples that are classified correctly, computed as:

Results and comparisons
After reading the microarray dataset of prostate cancer, the feature selection process selects only 38 genes out of 2135 genes as a significant set of features. These selected features are the most correlated features of the class labels. Then, the RC model is initialized with 30 base learners, trained, and tested on the dataset with these selected features a 10-fold cross-validation technique. Figure 5 shows the confusion matrix of 10-fold cross-validation results based on the selected features to classify normal tissue and prostate tumor.
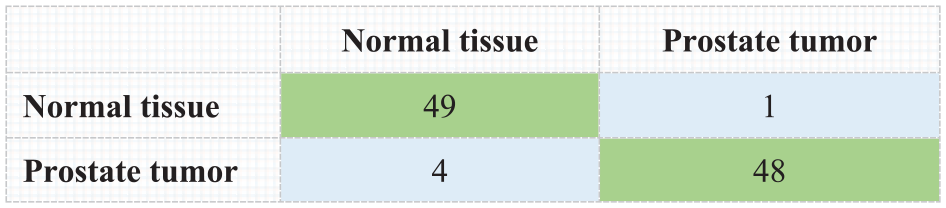
Confusion matrix of 10-fold cross-validation results based on the selected features.
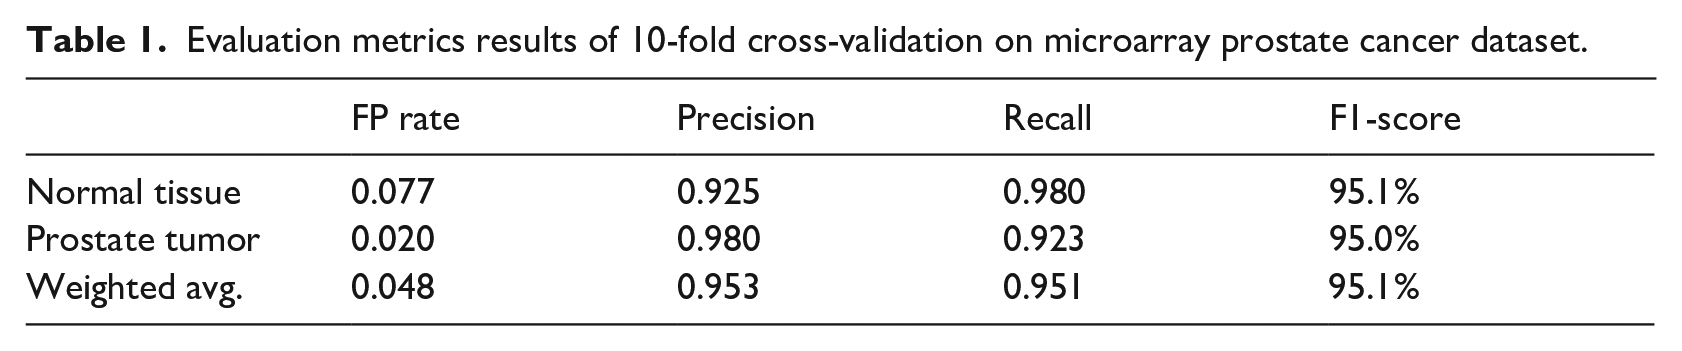
From the confusion matrix, we can see that 49 samples out of 50 for normal tissues are correctly classified as normal tissues, and 48 samples out of 52 for the prostate tumors are correctly classified as prostate tumors. Therefore, the results of accuracy and weighted average F1-Score for the approach are 95.098% and 95.1%, respectively. Moreover, in Table 1 and Figure 6, we present and visualize the results of other evaluation metrics.
Evaluation metrics results of 10-fold cross-validation on microarray prostate cancer dataset.
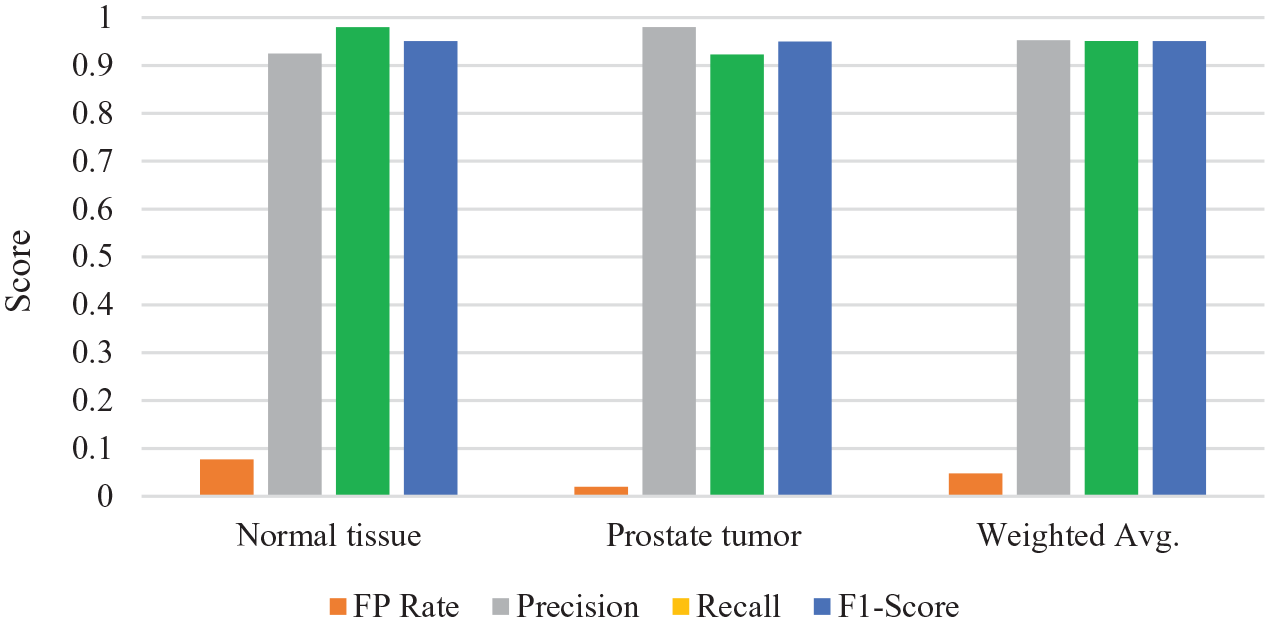
Results of evaluation metrics obtained from the 10-fold cross-validation technique.
As shown in Table 1 and Figure 6, we can notice that the proposed approach achieves high results of recall metric up to 0.98 for normal tissue and 0.923 for prostate tumors. In total, the weighted average result of the recall (TP rate) metric is 0.951 for the two classes. Furthermore, the approach attains a low output of the FP rate up to 0.077 for normal tissue, 0.020 for prostate tumor, and 0.048 for the weighted average result of the two classes.
To verify the effectiveness of the proposed approach, we conducted another experiment using all features and compared the accuracy result against the accuracy result of selected features. Figure 7 shows the accuracy results of 10-fold cross-validation to classify normal tissue and prostate tumor for the RC model on the dataset with all features and with selected features.
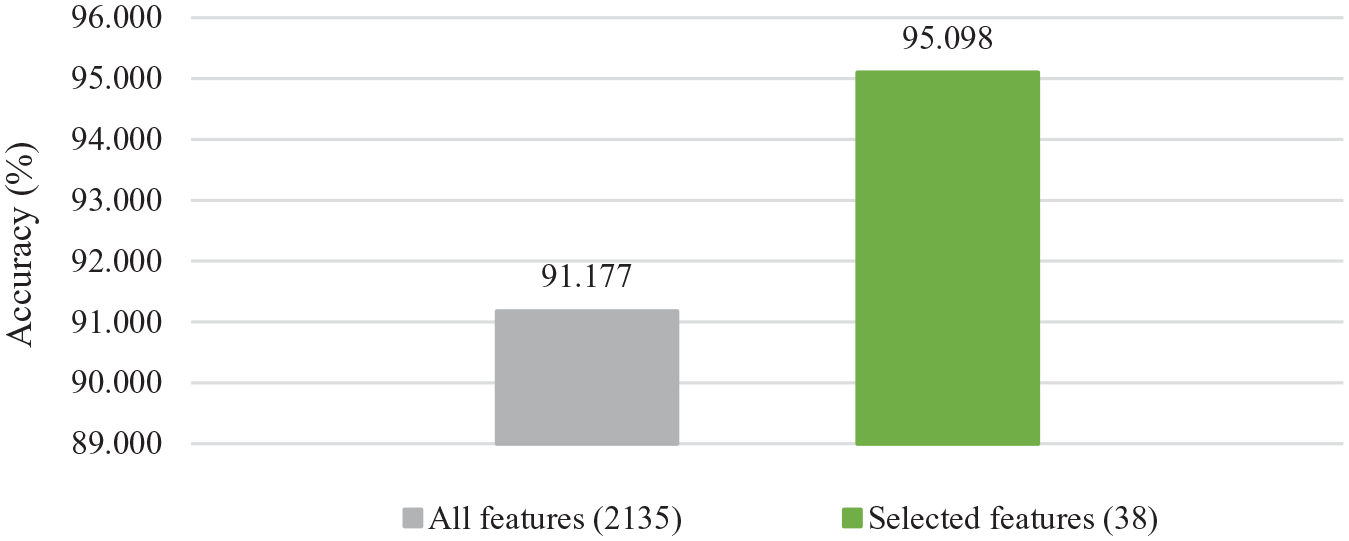
Accuracy results of 10-fold cross-validation for the RC model on the dataset with all features and selected features.
As shown in Figure 7, we can see a higher accuracy result of using the selected features compared to using all the features. It achieves a remarkable improvement.
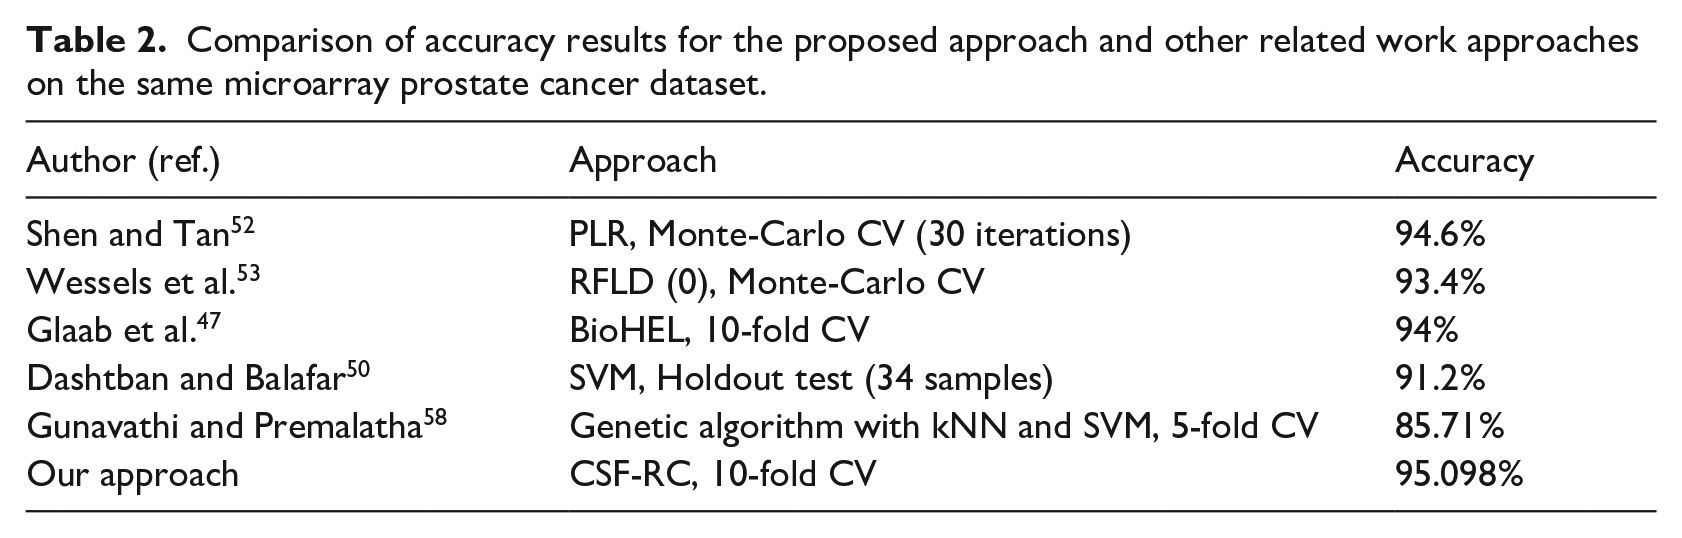
In Table 2 and Figure 8, we compare the accuracy result of the proposed approach with the accuracy results of related works based on cross-validation (CV) and holdout testing techniques. We notice that the proposed approach outperforms the related work methods and techniques. The highest accuracy result is highlighted with a boldface font in Table 2.
Comparison of accuracy results for the proposed approach and other related work approaches on the same microarray prostate cancer dataset.
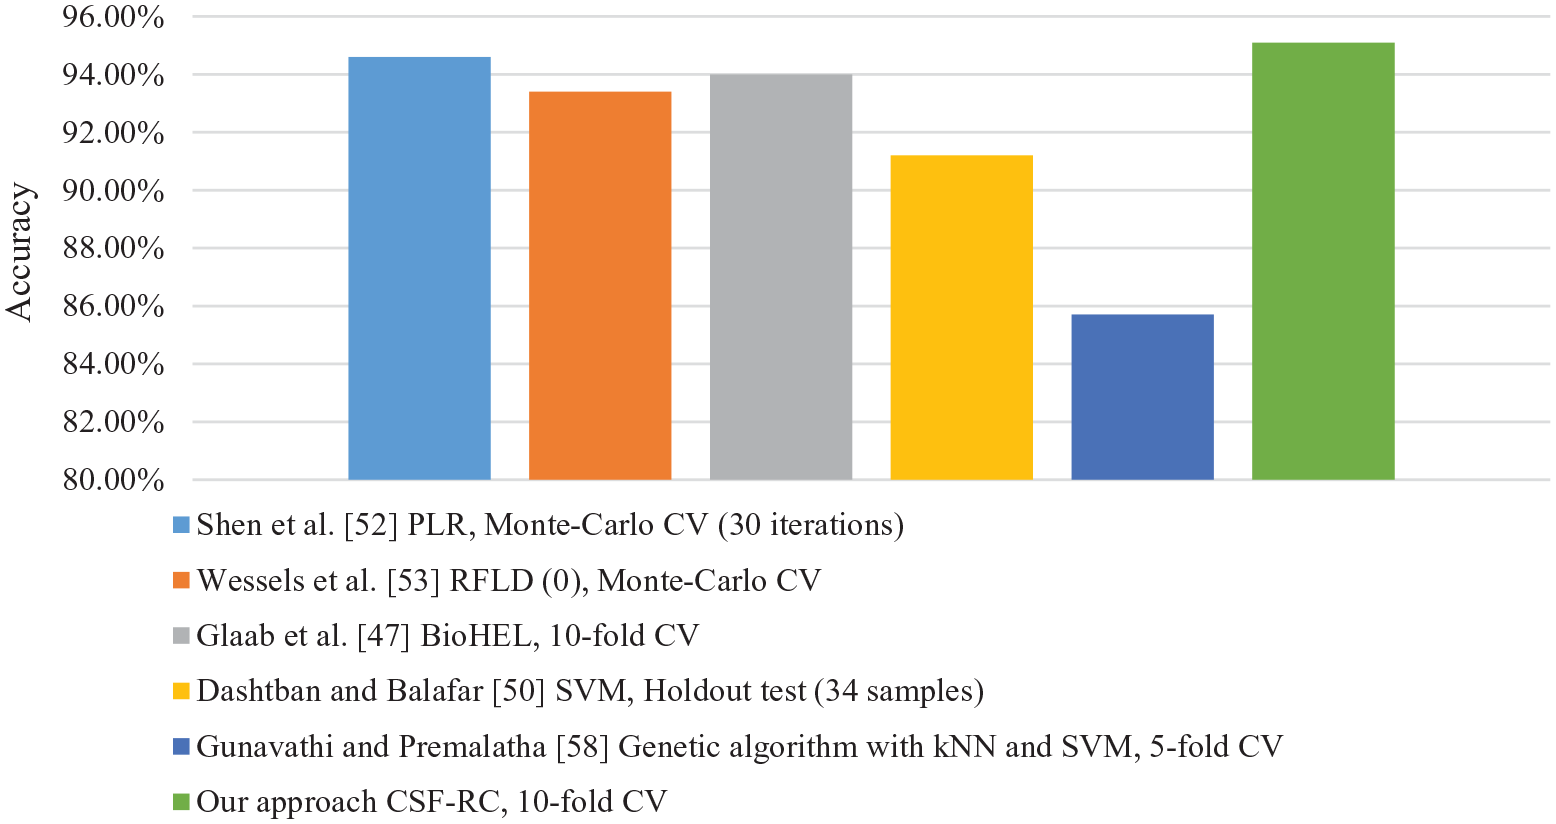
Visualization of accuracy results for the proposed approach compared with the related work approaches.
From Table 2 and Figure 8, we can see that the proposed approach outperforms the state-of-the-art works in terms of accuracy on the same dataset and using a cross-validation technique.
Conclusion and future work
In this paper, we have proposed an effective approach for prostate cancer classification using microarray gene expression data. It consists of two phases: the feature selection phase and the classification phase. In the process, we used the CFS method for gene selection and the RC model for classification. The experiments are conducted on a public microarray dataset using a 10-fold cross-validation technique.
Experimental results are reported using a set of evaluation metrics, showing the effectiveness of efficiency proposed approach for prostate cancer classification and diagnosis. In addition, the comparison results confirmed the importance of selected features for improving the accuracy result against using all features and demonstrated the superiority of the proposed approach against the related works. In future work, we will collect more datasets on microarray gene expression for further improvement of machine learning-based prostate cancer diagnosis. Furthermore, we will conduct a comprehensive comparative study of using the machine and deep learning methods for prostate cancer detection.
Footnotes
Acknowledgements
The authors are grateful to the Deanship of Scientific Research, King Saud University for funding through Vice Deanship of Scientific Research Chairs.
Author contributions
AG provided the idea and conducted the experiment, AG, RS, and MA-R wrote the manuscript. All authors analyzed the results and reviewed the final manuscript.
Declaration of conflicting interests
The author(s) declared no potential conflicts of interest with respect to the research, authorship, and/or publication of this article.
Funding
The author(s) disclosed receipt of the following financial support for the research, authorship, and/or publication of this article: The authors are grateful to the Deanship of Scientific Research, King Saud University for funding through Vice Deanship of Scientific Research Chairs.