
Abstract
Autism Spectrum Disorder (Autism) is a developmental disorder that impedes the social and communication capabilities of a person through out his life. Early detection of autism is critical in contributing to better prognosis. In this study, the use of home videos to provide accessible diagnosis is investigated. A machine learning approach is adopted to detect autism from home videos. Feature selection and state-of-the-art classification methods are applied to provide a sound diagnosis based on home video ratings obtained from non-clinicians feedback. Our models results indicate that home videos can effectively detect autistic group with True Positive Rate reaching 94.05% using Support Vector Machines and backwards feature selection. In this study, human-interpretable models are presented to elucidate the reasoning behind the classification process and its subsequent decision. In addition, the prime features that need to be monitored for early autism detection are revealed.
Introduction
Neuropsychiatric disorders account for 14% of the global burden of noncommunicable diseases. 1 They are considered the greatest cause of disability due to noncommunicable disease worldwide. A significant contributor to this metric is Autism Spectrum Disorder (ASD, or autism), which is a developmental disorder characterized by challenges in social and communication abilities, in addition to restricted repetitive behavior. 2 In almost 12 years from 1996 3 to 2018, 4 the incidence of autism has increased dramatically by nearly 700%. However, autism remains typically undiagnosed before the age of four in the United States, with approximately 27% of cases left undiagnosed at the age of eight. 5
Early diagnosis of ASD can significantly improve developmental and behavioral outcomes, especially for infants and toddlers. 6 Subsequently, early intervention of autism has a positive long term effect on the life of autistic children and their care givers.7,8 The standard of care for autism diagnosis uses behavioral clinical diagnostic instruments such as Autism Diagnostic Observation Schedule (ADOS) 9 and Autism Diagnostic Interview-Revised (ADI-R). 10 Both instruments require direct clinician-to-child observation and take hours to administer, creating burden on clinical care providers and resources. 11 Such burden may hinder the timely diagnosis and worsen the prognosis of ASD. Also, in some cases, care givers of prospective autistic children are unaware of the signs they need to monitor. This lack of knowledge on early signs of autism can further delay the diagnosis. Several studies have attempted to analyse the effectiveness of providing alternative tools for diagnosis of autism. One of these methods is home video analysis. In particular, home video analysis via feature tagging have lately received attention. Feature tagging can be accompanied with already existing diagnostic methods such as ADOS and ADI-R or by employing machine learning methods,12 –14 which would make diagnosis more accessible. In this study, we apply machine learning (ML) methods on ratings of different indicative features of autism from home videos. These ratings were done by minimally trained individuals blind to the final diagnosis. The ratings are made by non-clinicians, to diagnose autism. Our approach aims to help make accurate autism diagnosis widely reachable and to provide adequate insight into the decision making process. In addition, the applied ML methods highlight the key features that aid diagnosis and offer human understandable models.
Background
Recently, various studies aimed at accelerating autism diagnosis. The increased incidence of autism together with the anticipated benefits of early diagnosis make the provision of alternative reliable, transparent and easily accessible diagnostic tools a priority. These tools are needed to alleviate bottlenecks, reduce waiting times for diagnosis and intervention, and reach under-served populations in need.
More accessible screening methods is based on questionnaires, that produce results by comparing summed weighted answer scores to predetermined thresholds. Notable examples are the Q-CHAT (Quantitative Checklist for Autism in Toddlers), 15 and Autism Spectrum Quotient which includes different versions for children, 16 adolescents 17 and adults. 18
All the previous are parent-completed screening tools except for the adult version of the Autism Spectrum Quotient which is filled by the adult taking the questionnaire. In some underdeveloped countries,the lack of awareness of the child guardians 19 and their inability to commit to the time needed to complete the assessment 20 lead to reducing the effectiveness of these instruments. In addition, in some cases it is preferable to acquire independent raters impressions rather than the evaluation of caregivers. 12 Hence, autism diagnosis based on blind ratings of home videos by non-clinicians has lately received attention.
In work of Fusaro et al. 13 the feasibility of applying standard of care (SOC) methods, specifically ADOS module 1, on home videos was studied. The home videos where then rated based on ADOS module 1 using non-clinical raters. Their results showed promising accuracy and inter-rater reliability. Also, it demonstrated the effectiveness of ADOS module 1 questions, when used by non-clinicians on unstructured videos, to distinguish behavioral differences among children with and without ASD. Thus, their results supported the potential role of short home videos in rapid screening for autism.
In Abbas et al., 14 machine learning models were either based on a parental questionnaire and/or based on short home videos recorded by parents. The home videos were scored by a minimally trained analyst. The machine learning models were trained on recorded ADOS and ADI-R data. Then, combining the prediction from these two models was studied, to achieve higher accuracy. However, the key features that could be used to improve the screening process were not identified. Also, combining parent questionnaire with home video analysis did not significantly improve the performance, while making detection slower compared to home video models.
Tariq et al. 12 further investigated the prospect of short home videos in autism screening. The videos were uploaded via a mobile application for remote screening. They applied eight previously published machine learning models on historical data collected from medical records. A minimal set of features needed for diagnosis was identified. These features were either obtained from different ADOS modules or using ADI-R. Model evaluation was based on feature data from untrained raters, where raters were asked to rate features from several videos while being blind to the final diagnosis. The models performance varied widely with the highest model achieving an accuracy of 88.9%. In addition, the application of machine learning models on newly collected feature data was studied. They were able to achieve 87.7% accuracy and 93.3% AUC-ROC on an independent test set from applying a logistic regression model with elastic net penalty.
The presented previous work emphasize that home videos can aid in autism screening and early detection. Therefore, further investigation is needed to enhance the performance of the models based on home videos. Also, determining the key features that are used in diagnosis would be beneficial. Revealing key features would direct guardians of prospective autistic children to monitor and focus on signs of autism early.
Methods
In this study, high accuracy models are to be provided for effective autism detection. Also, the most predictive features, used in models construction shall be determined. Our targeted objectives mandate the application of various methods to enhance the reliability of the data, promote the usability of the models and improve their performance. Several methods of preprocessing, feature selection and classifiers hyperparameters optimization are to be applied to promote the transparency and accuracy of the models. An overview of the applied machine learning stages and methods within the suggested diagnostic system is given in Figure 1. The filtered data is input to the feature selection algorithms. Each feature subset is fed into the classifiers until the best model with highest accuracy is reached.
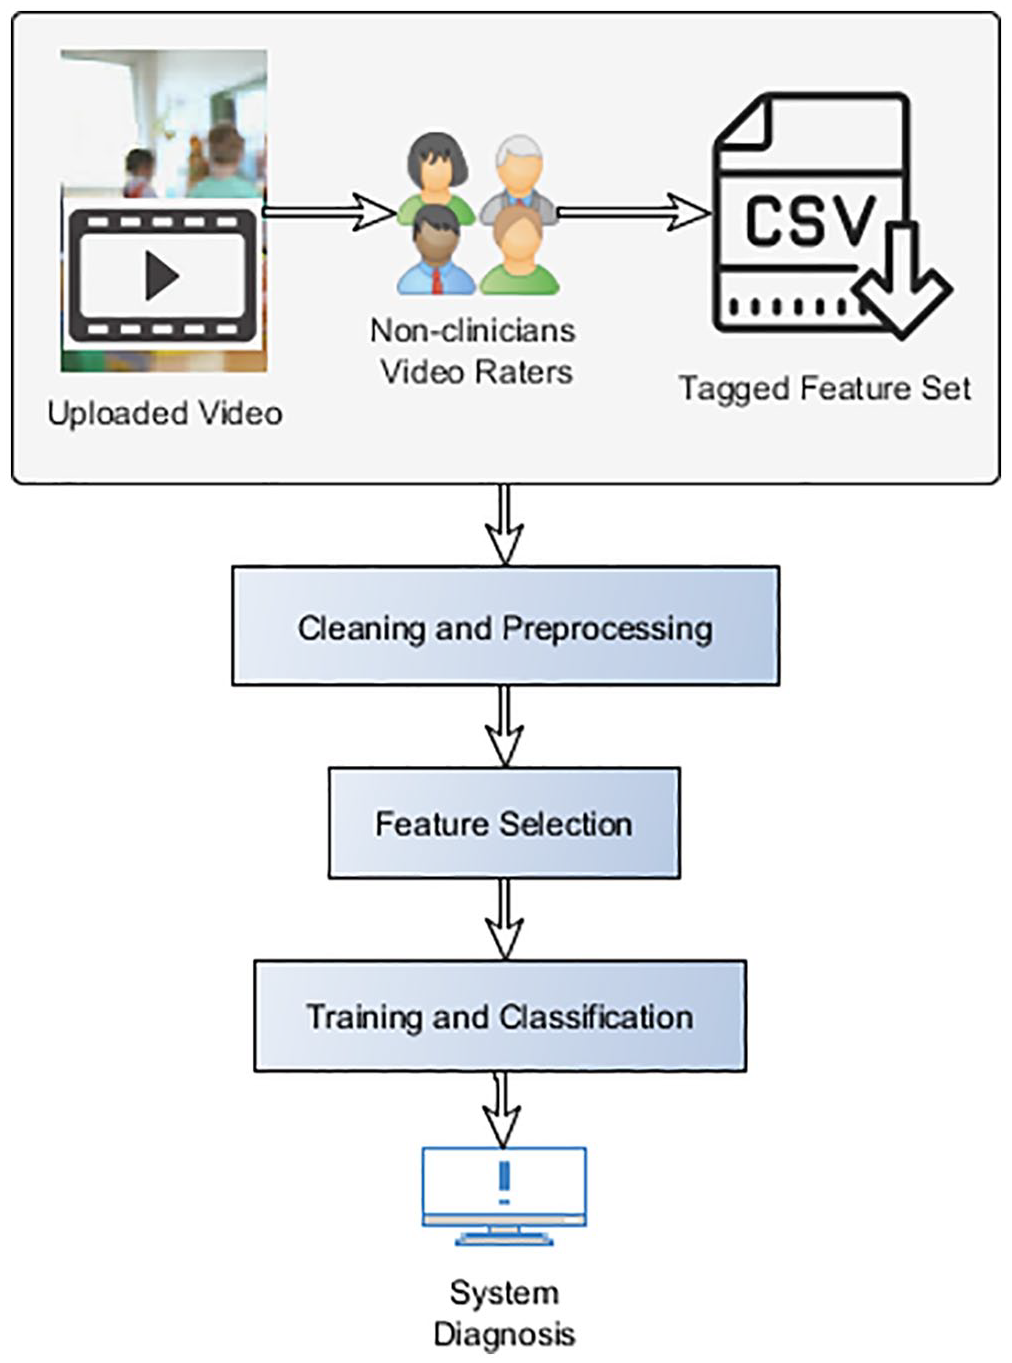
Overview of the methods used.
Data acquisition and preprocessing
The possibility of advancing remote autism detection is investigated on the dataset collected by Tariq et al. 12 In the work of Tariq et al., 12 three experiments were conducted. In the first experiment, ML models were trained and tested on ADOS or ADI-R historical medical data, while in the second experiment ML models were trained using professional ADOS or ADI-R historical data and tested on features tagged by blind raters. For the third experiment, the features tagged by the blind raters were used for both training and testing. In this experiment, the prospect of using solely non-professional data in detecting autism from home videos was investigated, where Tariq et al. 12 achieved an accuracy of 87.7% and AUC-ROC of 93.3% using LR-EN-VF. In this study, we further analyze the prospect of this data aiming to increase the achieved accuracy by Tariq et al and identify the critical features to monitor.
The dataset available from Tariq et al. 12 comprises 536 data examples with 30 features each. The features were obtained through feature tagging of home videos by nine non-professional raters, who remained blind to the diagnosis throughout the study. The raters were either students (high school, undergraduate, or graduate-level) or working professionals. None of the raters had expert training or certification for detection or diagnosis of autism. However, they received an induction on the features they will be rating. The raters watched videos and answered 30 questions for each video. In each question they were asked to indicate the severity of a certain feature in the child’s behavior in the video or whether this feature cannot be detected from the video.
The features which the raters were tasked to evaluate, included expressive language, eye contact, emotion expression, communicative engagement, join attention or pointing, calling attention to objects, stereotyped speech, indication of pleasure to others, echolalia, speech patterns, aggression, sharing of excitement, social overtures, understanding language, developmental delay, social participation, pretend play, responsive social smile, appropriate play, creativity, complex mannerisms, spontaneous gestures, responsiveness, comforting others, sensory aversion, imitation of actions, sensory seeking, head shaking, and self entertainment. These features were selected from both the ADOS and ADI-R tools according to the criteria discussed in Tariq et al. 12
The label for each one of the training examples was whether the patient in the video was in fact suffering from autism or not.
Other metadata such as the age and gender of the child were recorded, but not used for model construction. Data examples with missing fields were eliminated, reducing the records to 528 examples.
Classification methods and hyperpatameters optimization
Different methods can be applied to the presented problem. Each classifier is based on a different rationale and offers a relative advantage.
The employed methods are Logistic Regression with varying regularization penalties, SVM Classifiers, attempting a wide range of kernels and hyper parameters and decision trees.
Each method used in this research has a different motivation.
Regression is used due to its use in the original research, thus providing some sort of baseline as well as some insight into how feature selection can improve our process.
SVM is used due to its ability to produce high accuracy models and to analyse the applicability of such type of model on our use case.
Decision trees are used due to their simplicity and ability to provide a visualization of the final predictive model that can help provide a more easily interpretable reasoning for the prediction.
Regression Analysis constructs a mathematical model relating a set of features called independent variables to a dependent variable (outcome). 21 The dependent variable can be categorical or continuous. In linear regression, a straight line relation between a single independent variable and the dependent variable is assumed. Later, this concept was extended to model the relation between multiple variables and the outcome, which is known as multiple linear regression. In logistic regression (LR), a logistic function is applied to predict a categorical outcome (binary regression).
Although the mechanism of constructing of regression models is explainable, it doesn’t provide easily visualizable insight into how features were used to reach a decision. However, regression presents high performance and handles inconsistencies in data relatively well.And due to its usage in Tariq et al., 12 it is seen as a good starting point for subsequent extensive hyperparameter optimization and feature selection.
Support Vector Machines (SVM) rely on constructing hyperplanes to separate high dimensional data. 22 The produced hyperplane can be used for classification and regression. The separation of non-linear data is made possible through the incorporation of kernels. SVMs have shown their ability to produce models that are capable of producing high accuracies and generalizing well to unseen data thus we have evaluated their performance in this study.
Decision Trees (DT) depend on a “divide and conquer” approach for prediction model construction, they offer structural descriptions of what is learned.23,24 They provide a visual representation of the attributes that are considered relevant to the model and the decision making process. Decision trees comprise decision and leaf nodes.
At a decision node, the aim is to split the input data into subgroups of relatively pure class labels. A branch is created for each possible value splitting up the dataset into subsets, one for every value of the attribute. The process is then repeated recursively for each branch, using only those instances that correspond to the branch. The construction of the tree stops when a group of instances have the same classification label. After tree construction, an instance attributes’ values determine the path it follows between the decision nodes until it reaches the leaf node and acquires its class label.
Decision Trees provide knowledge representation that is easily interpretable by humans 25 and as a result provide good support to expert decisions. Also, they usually present high performance.
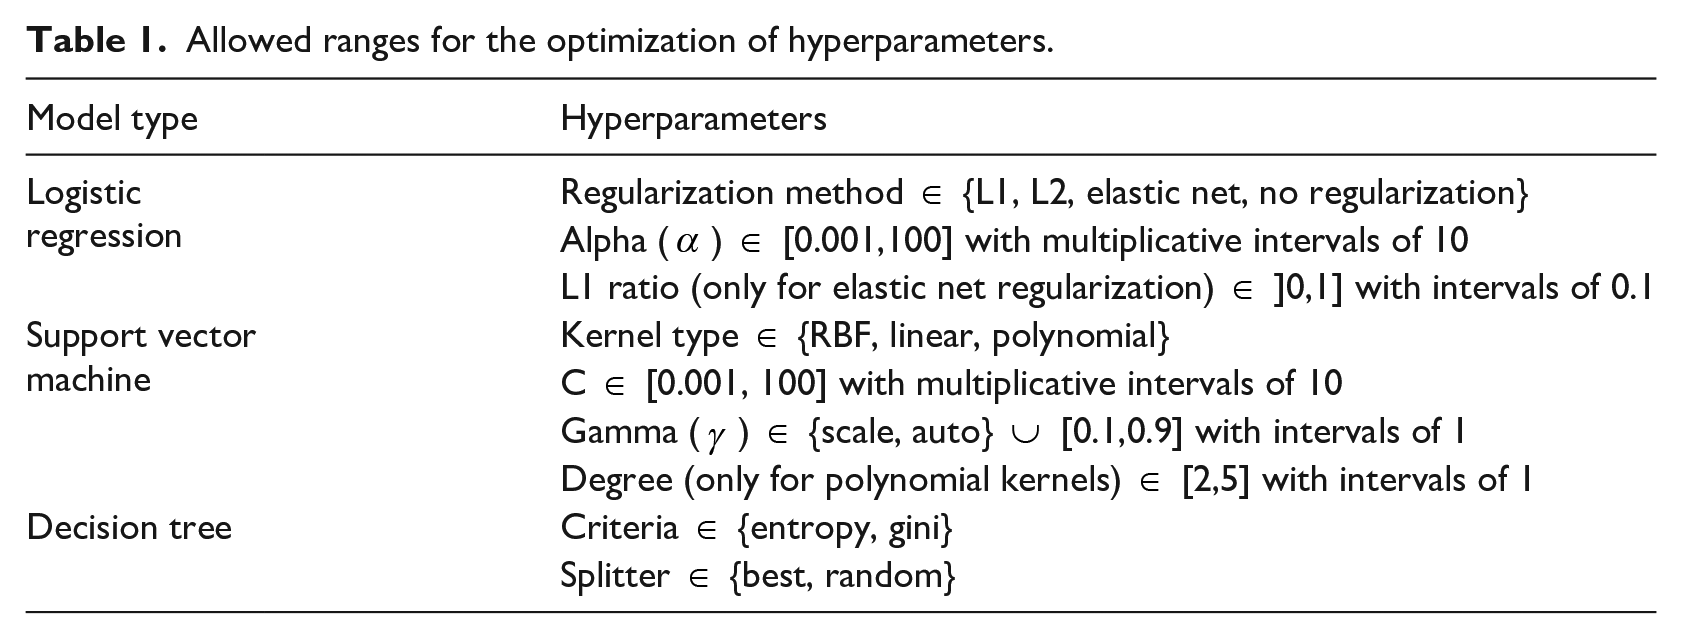
The performance of all of the described classification approaches is controlled by a set of hyperparameters. The optimization of these parameters would considerably enhance the performance of the models and advance its medical decision value. Grid search is utilized for tuning the hyper parameters. A summary of the adjustable hyper parameters for each classifier and the allowable ranges is depicted in Table 1.
Allowed ranges for the optimization of hyperparameters.
Feature selection
The use of feature selection here is not to overcome high data dimensionality, but rather it is required to achieve a set of benefits. Examples of these benefits is to increase the classification accuracy, simplify the model increasing the ability to understand the decision making process and to reduce overfitting, which leads to promoting the generalization of the model.
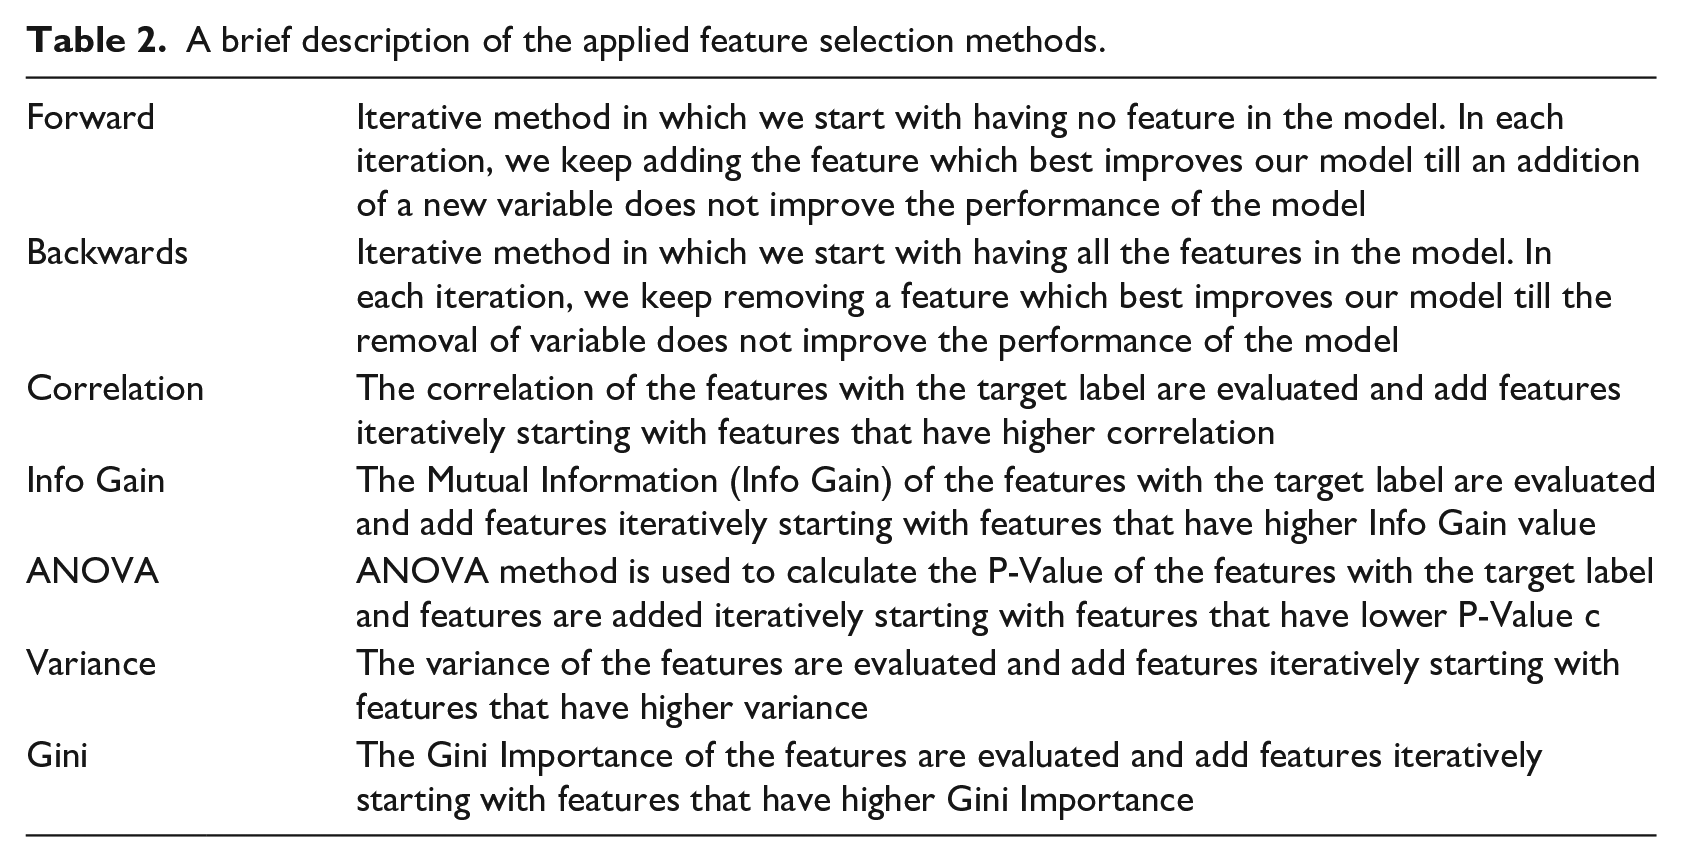
A wide range of feature selection algorithms was utilized including Forward Selection, Backwards Selection, selection based on correlation to the label, variance of features values, information gain, gini and ANOVA. After feature selection, linear search is adopted to choose the subset with the highest accuracy.
A brief description of the used feature selection methods is given in Table 2. Each method is combined with the presented classifiers.
A brief description of the applied feature selection methods.
Results and discussion
Our experiments are organized such that the effectiveness of our classification system is elucidated and emphasized. First, baseline performance of the classifiers is portrayed with no feature selection. Then, the performance of the classification models combined with feature selection is depicted. In addition, the performance of our models is compared to that Tariq et al. 12 to illustrate the relative performance of our models.
The models are produced using scikit-learn. To speed up many of our computations, we have opted to use the Cython library. Finally, in regards to performance metrics calculations, repeated K-Fold (five fold) cross validation is used to estimate the prediction error and identify the best preforming model.
Performance measures
In order to evaluate the performance of our different models, a set of performance measures are calculated to assess the quality of our predictive model. The main measure is the accuracy of the predictive models. The accuracy convey the percentage of samples that the model is able to predict correctly across both classes. Another important metric is the Area Under Receiver Operating Curve (AUC), which is particularly useful to estimate the model’s performance using different thresholds. In case of SVM models which normally produce a class prediction directly without a class probability, we have used platt scaling to estimate the AUC. 26 Lastly, we have opted to choose the sensitivity (TPR) produced by our models for the autistic group. Such metric is chosen due to the importance of correctly identifying autistic children through early indicators. Thus, TPR of autistic group is reported separately.
Classifiers baseline performance
Logistic regression, support vector machine and decision trees are applied on the full feature set to generate the baseline models. Sample results of these classifiers are shown in Table 3. The results are shown with different parameters settings. By examining the results shown, we can find improvements against previous work results. The accuracy is written as shown in equation (1)

Classification models baseline results (without feature selection) with different parameters settings.
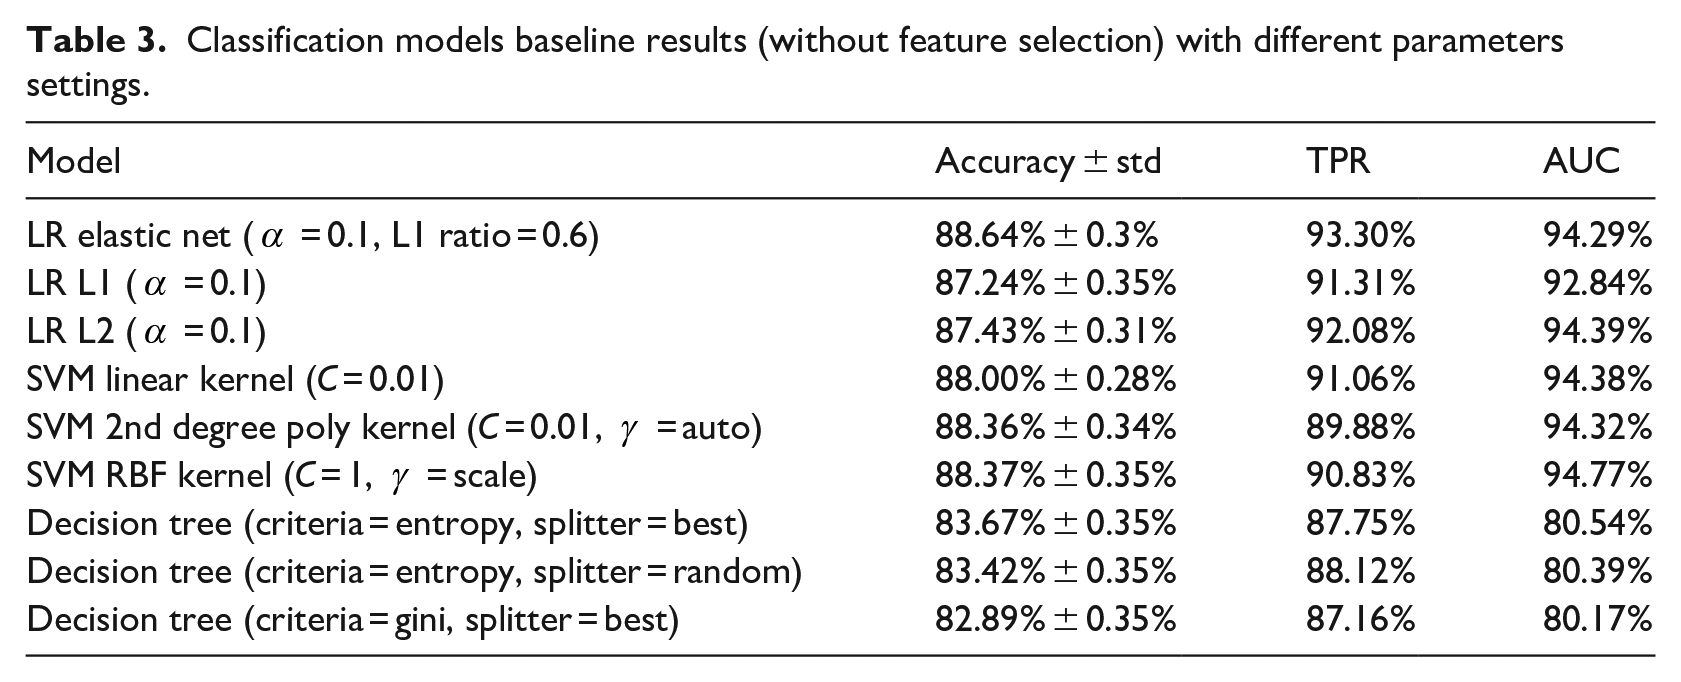
Logistic Regression was used by Tariq et al. 12 to make the diagnosis, thus it is seen as a good starting point for subsequent extensive hyper parameter optimization and feature selection. We have re-evaluated the best model specified in Tariq et al. 12 using K-Fold cross validation as opposed to the 20% holdout test set used by Tariq et al. 12 It achieved 85.8% mean accuracy with a standard deviation of 0.4% as opposed to the 87.7% reported.
By optimizing hyper parameters alone, one of our LR models was able to achieve marginally better results than Tariq et al., 12 both in terms of the originally reported value of 87.7% and the reevaluated value of 85.8% mean accuracy with a standard deviation of 0.4%. It is shown in Table 3 that the best performing LR model without any feature selection with elastic net showed 88.8% accuracy and 94.7% AUC. Using K-Fold cross validation, in this study, helped in giving a better estimate of prediction error, in contrast to Tariq et al. 12 who employed a fixed holdout test set of 20%. Thus, we were able to better optimize the LR model and surpass the performance of Tariq et al. 12
In Table 3, all SVM models with different settings and kernels, attained accuracies higher than 88%. The SVM models present superior performance compared to the other classification models and to Tariq et al. 12
Decision Trees had the lowest performance. However, due to its inherent advantages, we further investigate its performance when combined with feature selection.
Classifiers performance with feature selection
Feature selection proved to boost our results even further. Table 4 summarizes some of the best performing classification models with various feature selection methods. Also, the number of features, which attained the highest accuracy with linear search, is shown in Table 4. Feature subset size is recorded to determine the degree of model simplification as a result of feature selection. Accuracy is depicted similarly to Table 3 as specified by equation (1).
Classification models results with festure selection.
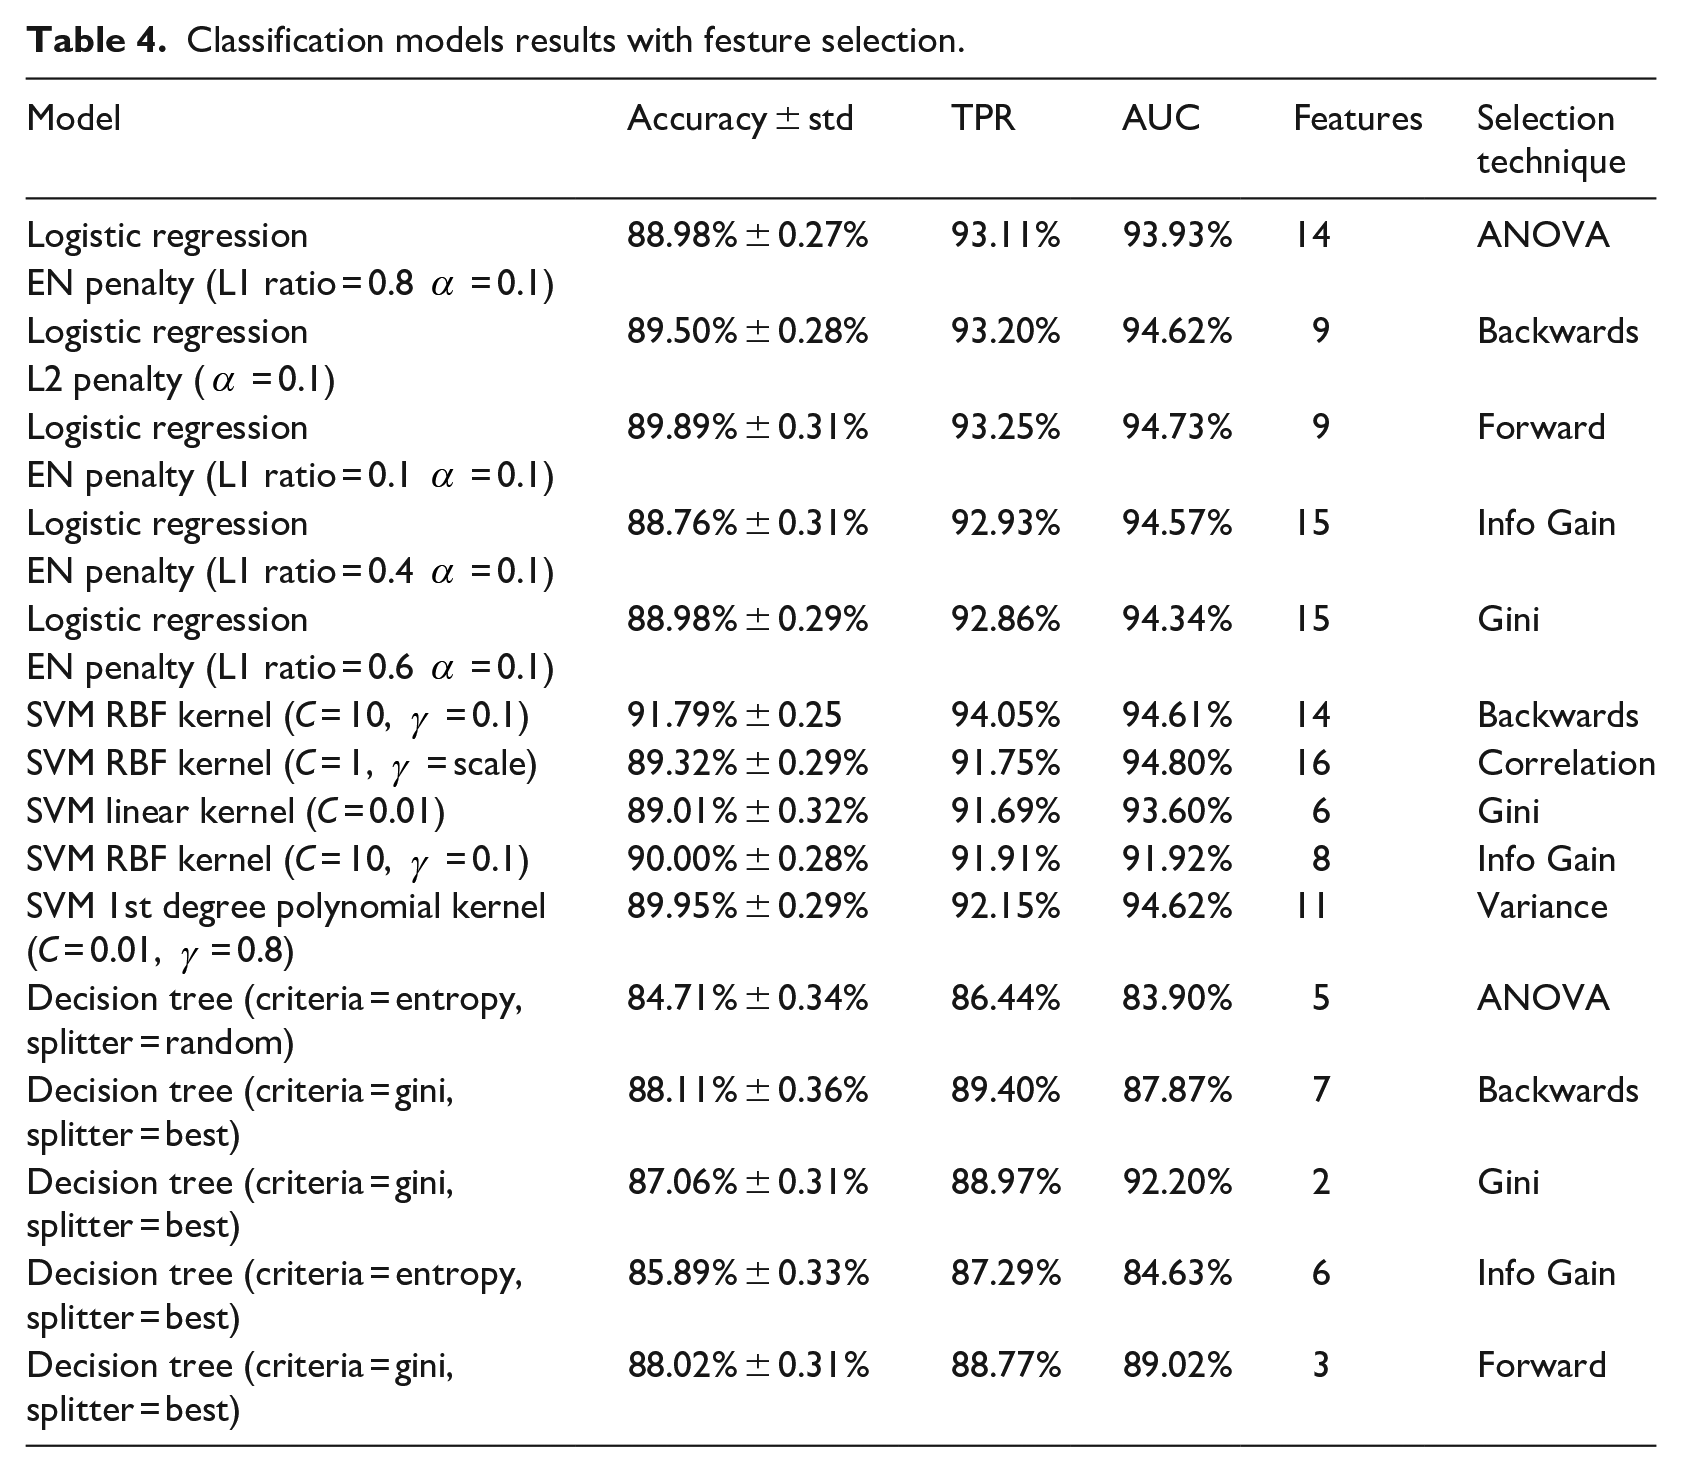
For each classifier, the best performing model is highlighted in Table 4. Generally, feature selection has improved the performance of the classifiers measured by our performance metrics as shown in Figure 2.
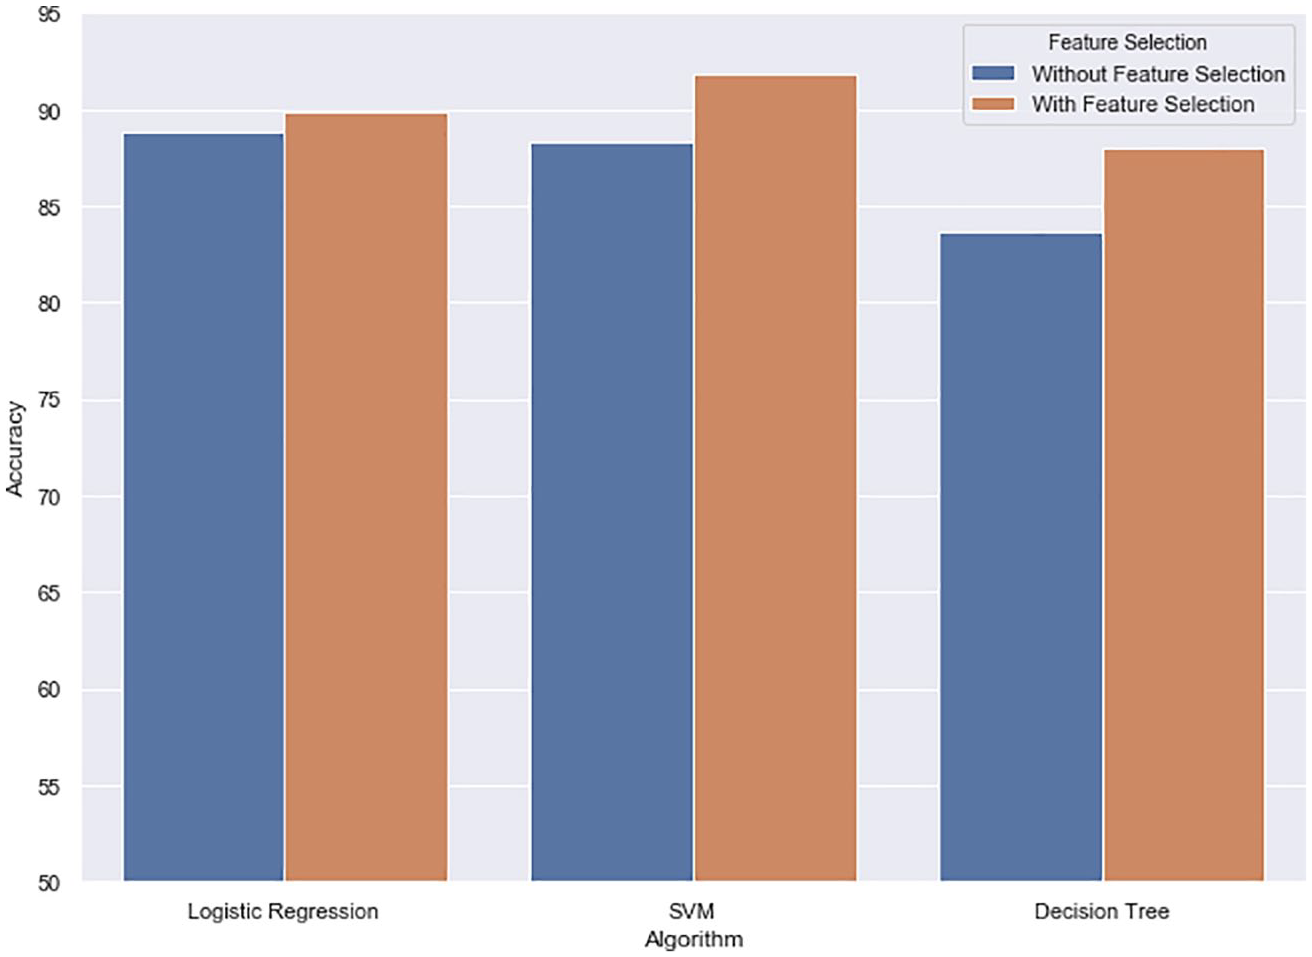
The difference in accuracies between baseline and feature selection models of different classifiers.
Overall, SVM produced the highest accuracy of 91.79% with 14 features, which is 4% higher than Tariq et al.
12
with 53.33% reduction in feature set size. In addition, it gave a 94.03% TPR for the critical autism class. Other SVM models produced competitive performance such as SVM with RBF Kernel (C = 10,
Logistic Regression with Elastic Net (L1 Ratio = 0.1,
Decision trees came last with the highest accuracy reaching 88.11% using only 7 features. It present a competitive performance to Tariq et al. 12 with 76.6% reduction in feature set size. Despite that DT did not score the highest accuracy, it provides the most transparent model as it provides an easily interpretable tree, which provides a reasoning for its classifications that is easy to understand based on the rules it learned. This is opposed to SVM and LR which can only provide a classification based on a mathematical rule.
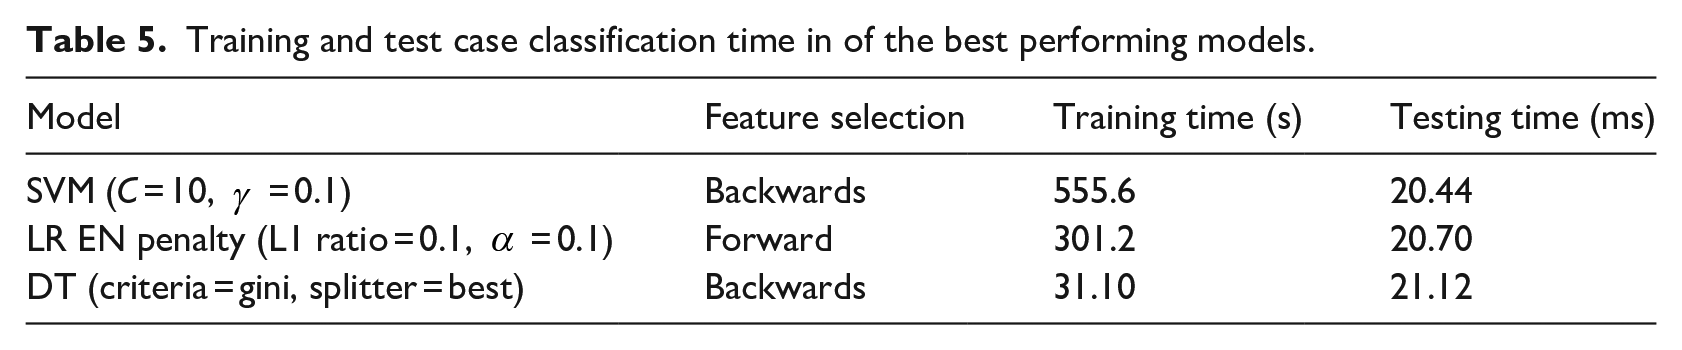
An important aspect of classification is the time the model takes to produce a decision on a single test case, in an attempt to estimate the response time when tagged features become available. The response time is an important aspect as it influences the usability of the presented approach as part of a remote diagnosis system. Therefore, it was required that these models, as part of such system through mobile or web-based applications, do not impose high delays on the diagnosis application. The average test case classification times of the top performing models are shown in Table 5. The table depicts comparable times with a range from 20.44 ms with SVM to 21.12 ms with DT, which are acceptable delay values. Another aspect is the building time of the models, in case new data becomes available and model reconstruction is required. Therefore, the total time for classifier training after feature selection is reported in Table 5. DT is the fastest in training, which gives it a relative advantage. However, all models building times are tractable. These run times were achieved on an Intel Core i7-10750H machine with 16GB of RAM. The decision to use simple hardware was to show the typical basic performance of the approach.
Training and test case classification time in of the best performing models.
Key features determination
The main benefit of feature selection is boosting the performance of our models significantly compared to baseline. ture 2 shows the positive impact of feature selection on the top accuracies of our chosen classifiers. The improvement gained by feature selection over the best performing baseline model ranges from 1.2% with LR to 4.64% with DT. Another benefit of feature selection is that it can speed up autism screening from a home video, since blind raters would need to fill in less features and the models construction time will be reduced. The screening of autism via feature tagging of home videos was meant to decrease wait time for an initial ASD diagnosis. Therefore, reducing time even further while obtaining higher performance is a great benefit.
However, the main benefit of feature selection in autism diagnosis, is highlighting the key dominant features that influence the classification decision. In order to determine these features, we examine the chosen features at our models and plot the corresponding matrix in Figure. 3. For each model (y-axis), we indicate whether the feature (x-axis) was selected for model construction. Blue indicates that the feature is not selected and not used in model construction. The gradient from orange to yellow shows the total number of times a feature is selected
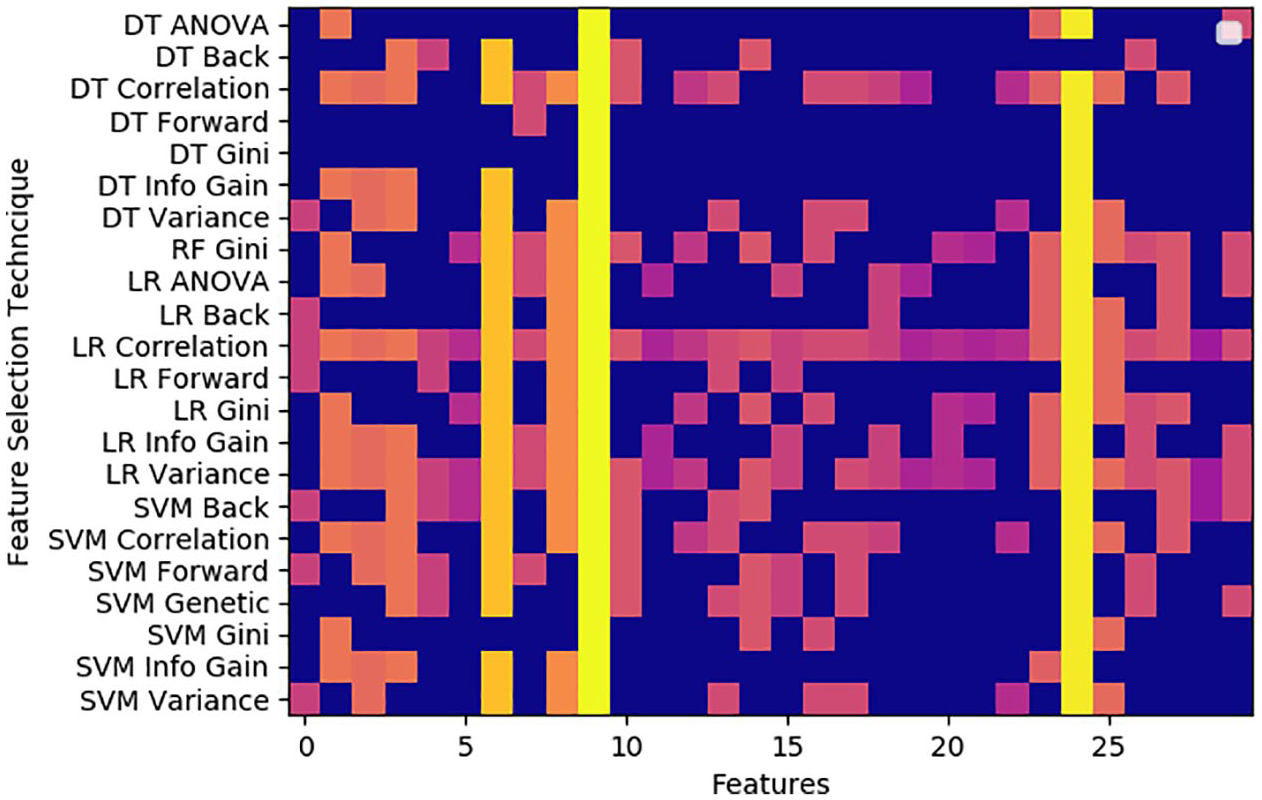
A feature matrix showing the features selected for each of the constructed models with various feature selection techniques.
From Figure 3, it is obvious that the 9th and 24th feature are the most important indicators. These features are the responsiveness of the child and echolalia. However the 11th, 19th, 20th and 21st features are not used by any of the top performing models. These features are aggression, appropriate play, creativity and complex mannerism. This is explainable since features 9 and 24 will be the easiest for blind raters to draw from the videos, however, features 11, 19, 20 and 21 would be infeasible to detect from a video as they require close observation of the child over a period of time in a controlled setting.
Clinical opportunities and challenges
The discussed approach for remote ASD diagnosis through mobile video rating presents a promising area of study, where it provides an accessible diagnostic tool. However, the success of this approach partially relies on the raters performance. Therefore, adequate training needs to be provided to the raters to ensure the success of the approach.
Although the training provided in Tariq et al. 12 included person to person engagement, we expect training via an online tool would be adequate. This is supported by the simplicity of our identified features. The tool should include an illustration of each feature through text, images, or a video explanation on an appropriate platform to be adequate.
The diagnostic features identified as informative features by the feature selection algorithms conforms with the standardized criteria provided by the Diagnostic and Statistical Manual of Mental Disorder, fifth edition. 2 Such conformity underpins the ability of the proposed models to provide a sound diagnosis.
The identification of important features in the process of video diagnosis paves the way to a fully autonomous video diagnosis, as it may shift focus on creating machine learning models that are capable of detecting the identified features directly from the videos and using them to produce a diagnosis. In addition, the identification of important features and the elimination of redundant ones would improve the generalization of the model, which would lead to the model performing relatively well on other datasets constructed by raters from different backgrounds.
Conclusion
We presented effective video-based autism detection models of superior classification performance compared to previous work. A range of feature selection techniques were applied to provide reduced representative feature sets. Based on our reduced feature sets analysis, responsiveness and echolalia are proposed as features to base autism detection upon. Our methods manifest a set of relative advantages for autistic groups detection. SVM with backwards feature selection attained a high true positive rate for autism group, reaching 94.05%. In addition, our proposed decision tree model, using only six features, although weaker than the SVM model, provide an understandable model. Also, it can visually illustrate the usage of different features to reach a diagnosis in a hope to help provide more clear insight into the decision making process. Therefore, the use of video-based models as reachable screening tools for autism detection is envisaged in health and social care venues in the future.
Footnotes
Acknowledgements
We would like to thank Prof. Dr. Soha Ghobashy, professor of child psychiatry, Alexandria University, Egypt, for her useful discussions that helped us realize the clinical opportunities and challenges of the study.
Declaration of conflicting interests
The author(s) declared no potential conflicts of interest with respect to the research, authorship, and/or publication of this article.
Funding
The author(s) received no financial support for the research, authorship, and/or publication of this article.
References
Supplementary Material
Please find the following supplemental material available below.
For Open Access articles published under a Creative Commons License, all supplemental material carries the same license as the article it is associated with.
For non-Open Access articles published, all supplemental material carries a non-exclusive license, and permission requests for re-use of supplemental material or any part of supplemental material shall be sent directly to the copyright owner as specified in the copyright notice associated with the article.