
Abstract
Palliative care is referred to a set of programs for patients that suffer life-limiting illnesses. These programs aim to maximize the quality of life (QoL) for the last stage of life. They are currently based on clinical evaluation of the risk of 1-year mortality. The main aim of this work is to develop and validate machine-learning-based models to predict the exitus of a patient within the next year using data gathered at hospital admission. Five machine-learning techniques were applied using a retrospective dataset. The evaluation was performed with five metrics computed by a resampling strategy: Accuracy, the area under the ROC curve, Specificity, Sensitivity, and the Balanced Error Rate. All models reported an AUC ROC from 0.857 to 0.91. Specifically, Gradient Boosting Classifier was the best model, producing an AUC ROC of 0.91, a sensitivity of 0.858, a specificity of 0.808, and a BER of 0.1687. Information from standard procedures at hospital admission combined with machine learning techniques produced models with competitive discriminative power. Our models reach the best results reported in the state of the art. These results demonstrate that they can be used as an accurate data-driven palliative care criteria inclusion.
Background and significance
An increasing number of people have multiple morbidities and conditions in the final moments of their lives, current medicine tries to maintain a quality of life of these people, including their needs in the final moments. In this situation, palliative care tries to facilitate the life of people in these conditions from a patient perspective.
Palliative care is a multidisciplinary care that aims to grant comfort to the patient, avoid painful and/or aggressive treatments, alleviate pain, other symptoms, psychological and spiritual distress. 1 In addition, there are some studies which prove that patients receiving early palliative care present a better quality of life, mood, satisfaction with the treatment2–4 and even a longer survival when compared to patients whose palliative care was delayed. 5
A criterion for the palliative care inclusion is desirable as early as possible. An adverse event such as a hospital admission could be considered a convenient episode to check this criterion. Nowadays, the main indicator to include a patient in palliative care is the clinical criterion of a potential exitus within the next 12 months. An example of that is the surprise question described in Moss et al. 6
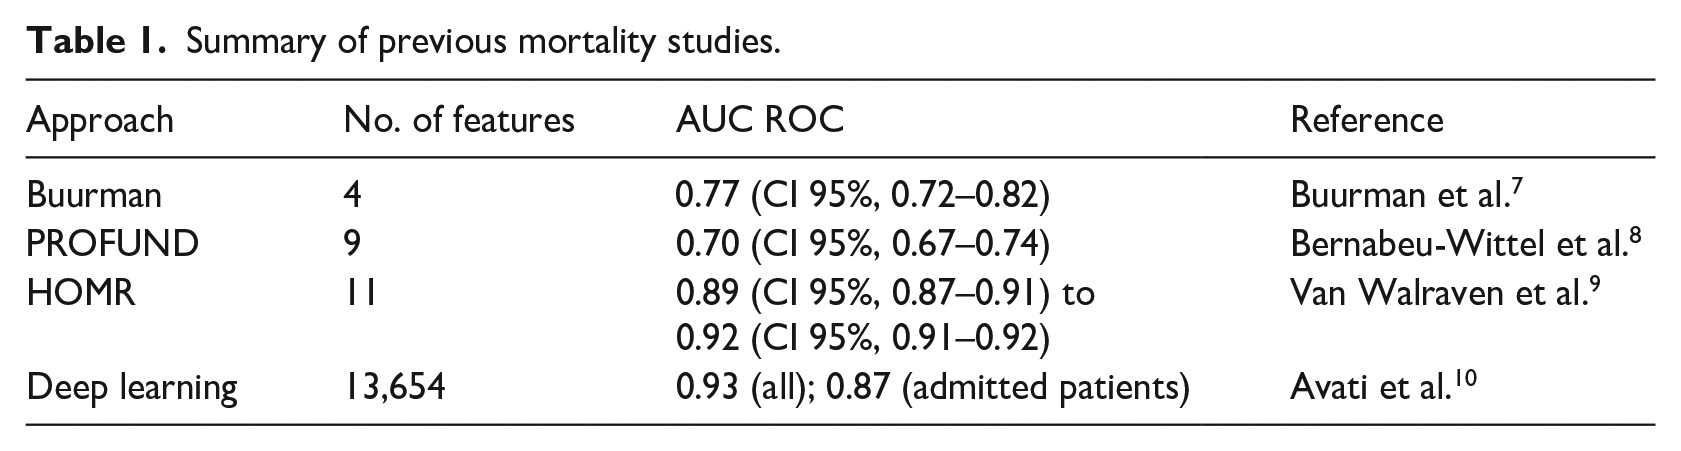
Mortality forecast has been previously studied by other groups. Buurman et al. 7 proposed a method for predicting 90-day mortality risk using few clinical features: Barthel test index, Charlson score, and Malignancy and Urea nitrogen (mmol/L). The authors of this study calculated how modifications on the features affect the outcome. The study reported AUC ROC = 0.77 (CI 95%, 0.72–0.82). Bernabeu-Wittel et al. 8 proposed a method for detecting 1-year mortality for polypathological patients. That model computed the PROFUND score, based on some features to assign a mortality risk to the patient: Age, Hemoglobin, and Barthel index, No caregiver or caregiver other than the spouse, hospital admissions ⩾4 in last 12 months and positive for few diseases. The PROFUND score is mapped into mortality (in less than a year) probability. The reported validation result was AUC ROC = 0.7 (CI 95%, 0.67–0.74). Van Walraven et al. 9 reported a 1-year mortality forecast model based on patient demographics, health burden, and severity of acute illness. The model uses a binomial logistic regression. The AUC ROC ranged from 0.89 (CI 95%, 0.87–0.91) to 0.92 (CI 95%, 0.91–0.92). Recently, Avati et al. 10 presented a deep neural network for 1-year mortality prediction by using 13,654 features, corresponding to the different ICD9 codes in different time windows through the year. They reported and 0.93 of AUC ROC for all validation patients but only 0.87 for admitted patients. A summary of previous studies is provided in Table 1.
Summary of previous mortality studies.
Based on the promising results in the literature we have addressed the design of a high-performance predictive model of 1-year mortality exclusively based on observations at hospital admission. The overall aim of our study was to provide quantitative methods to healthcare caregivers to decide the inclusion of patients in the palliative care program during the hospital admission. To this aim, we have designed and evaluated five predictive models from the state-of-the-art machine learning discipline.
These models are meant to be more complex, in terms of algorithm, parameters and amount of data needed than the first studies we presented but with less requirements that Avati’s deep learning approximation, being the most adequate option for our dataset size.
The models presented in this work are continued in the InAdvance project (http://www.inadvanceproject.eu/) along with other kinds of models such as frailty and resource consumption models to create a complete Computerized Decision Support System (CDSS) 11 for the palliative care inclusion decision. This CDSS is meant to join other information systems created to improve the palliative care process, such as O’Connor et al. 12 and Dy et al. 13
Materials
The data of the study was extracted from the Electronic Health Records from Hospital La Fe. We gathered all the hospitalization episodes of adult patients (⩾18 years old), excluding those related to mental health, gynecology and obstetrics, from January 2014 to December 2017 (a total number of 114,393 cases) that have been discharged from the hospital. All the patients received standard care, so no effects like a prolonged survival from palliative care 5 affect the data. To guarantee independent observations, we selected a random single episode for each patient, reaching a total of 65,279 episodes.
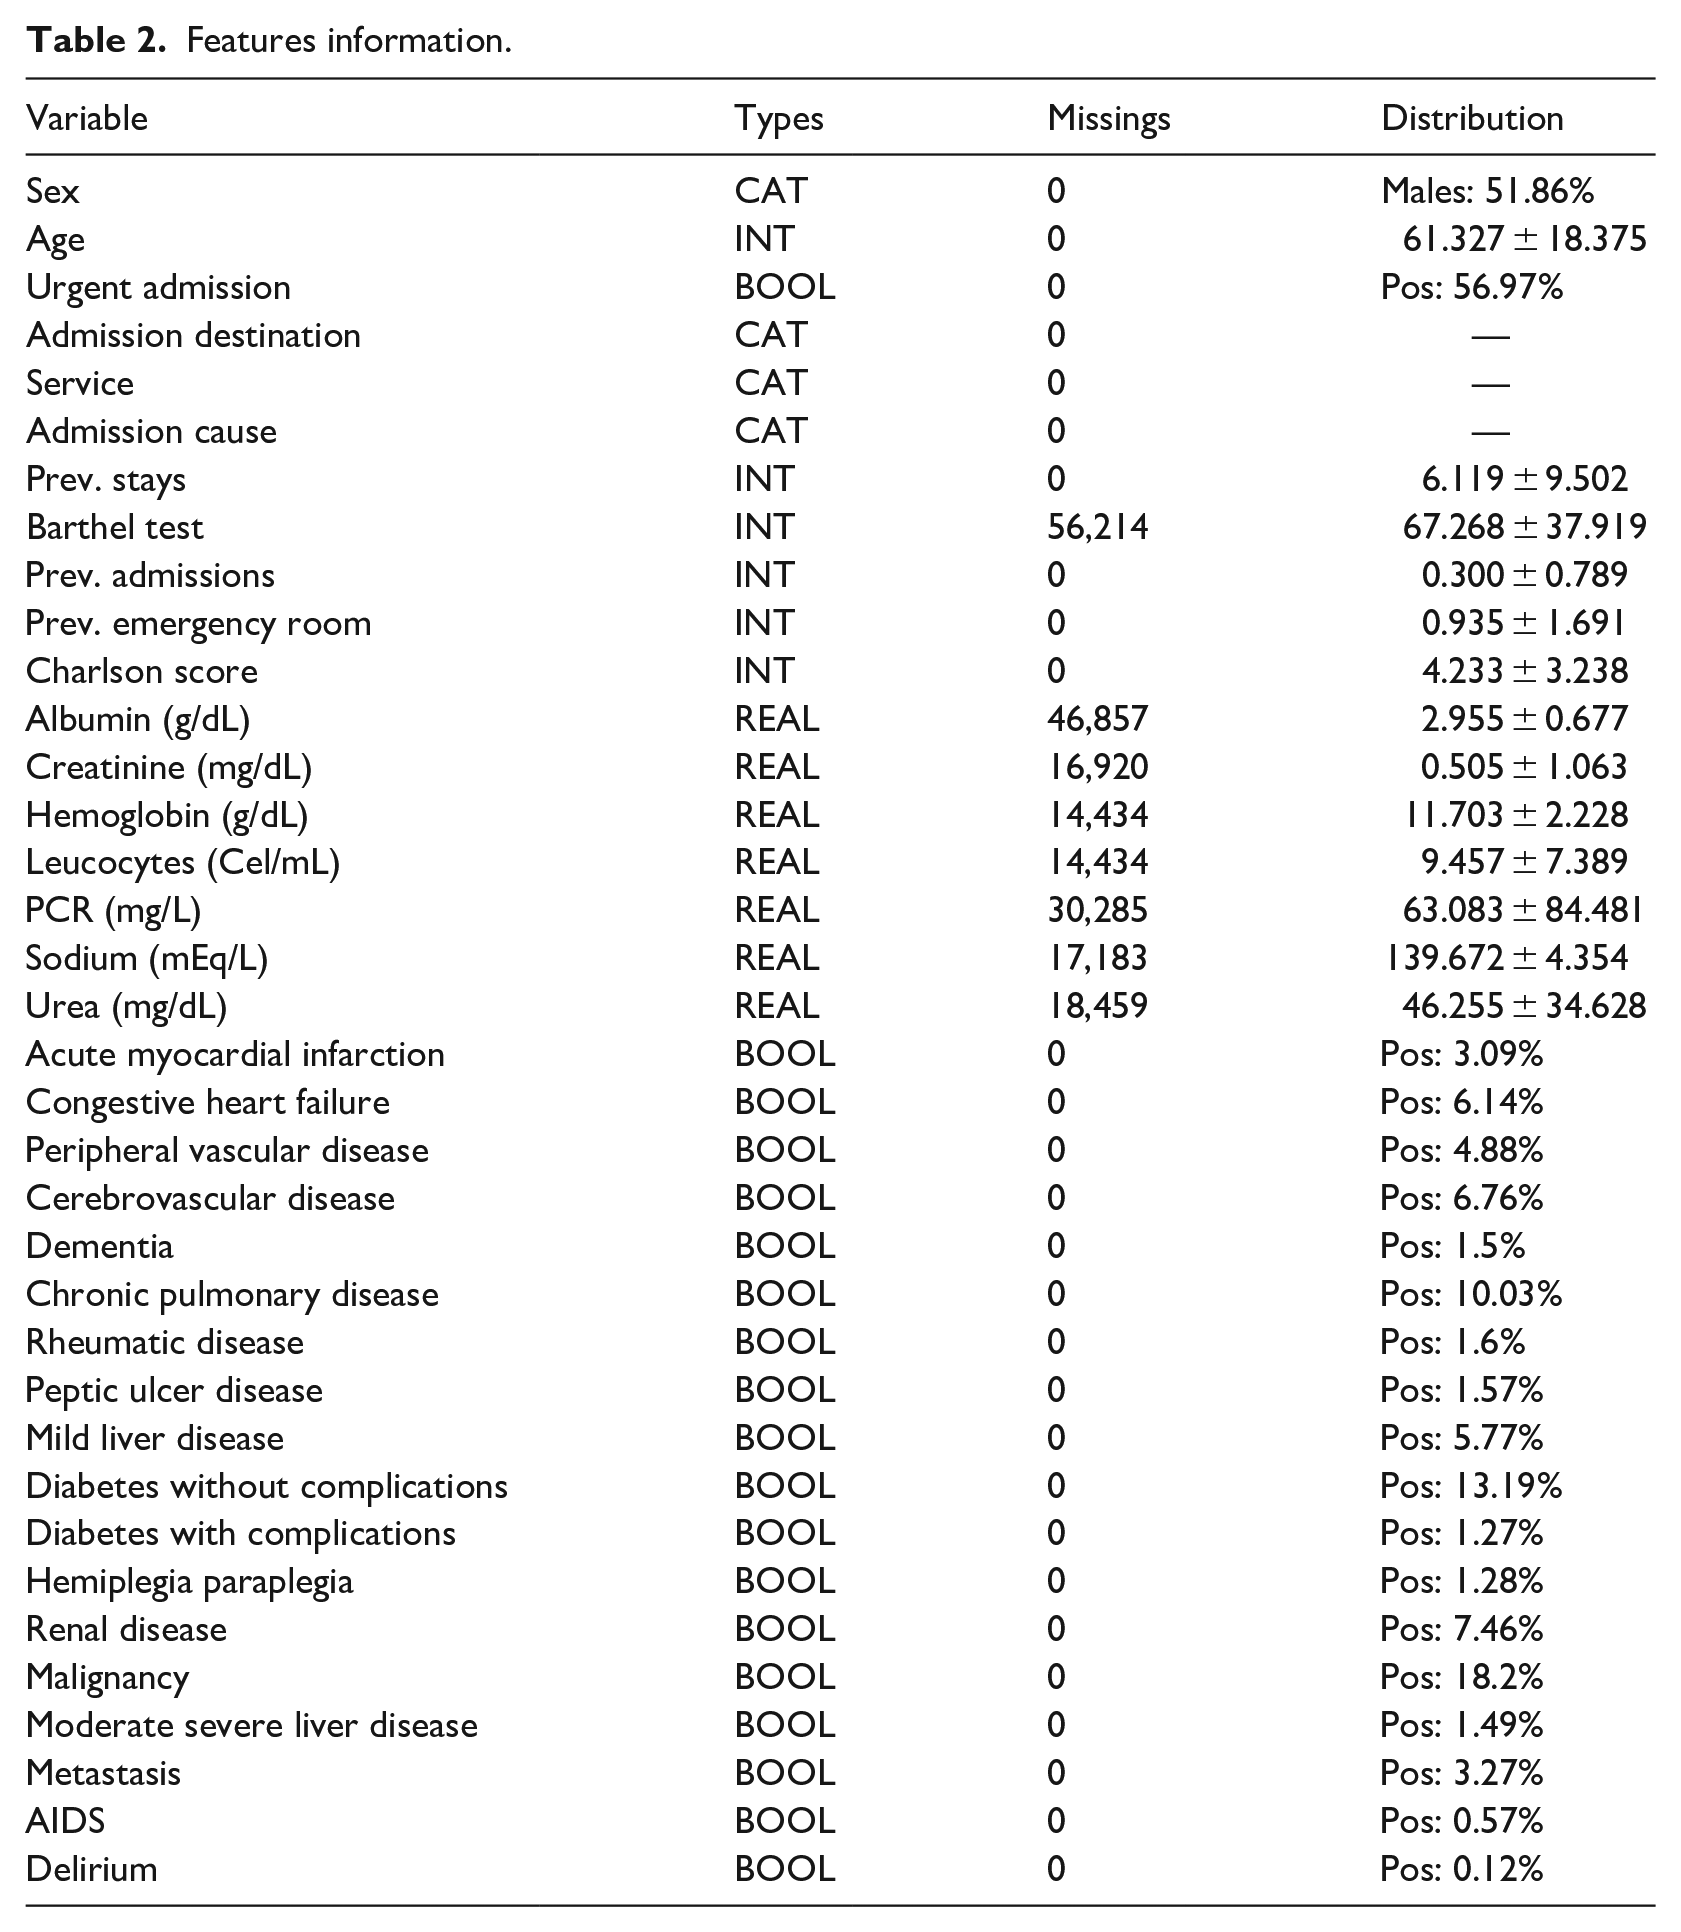
The dataset contains information about the previous and current admission (seven features), laboratory test results (seven features) and a list of 28 selected diseases for which the patient is positive or negative. Sex, age, Charlson index, and Barthel tests result are also available. This adds up a total of 36 features which can be obtained straightforwardly in the first hours of admission. Some of these features were used, with positive results, in previous studies.
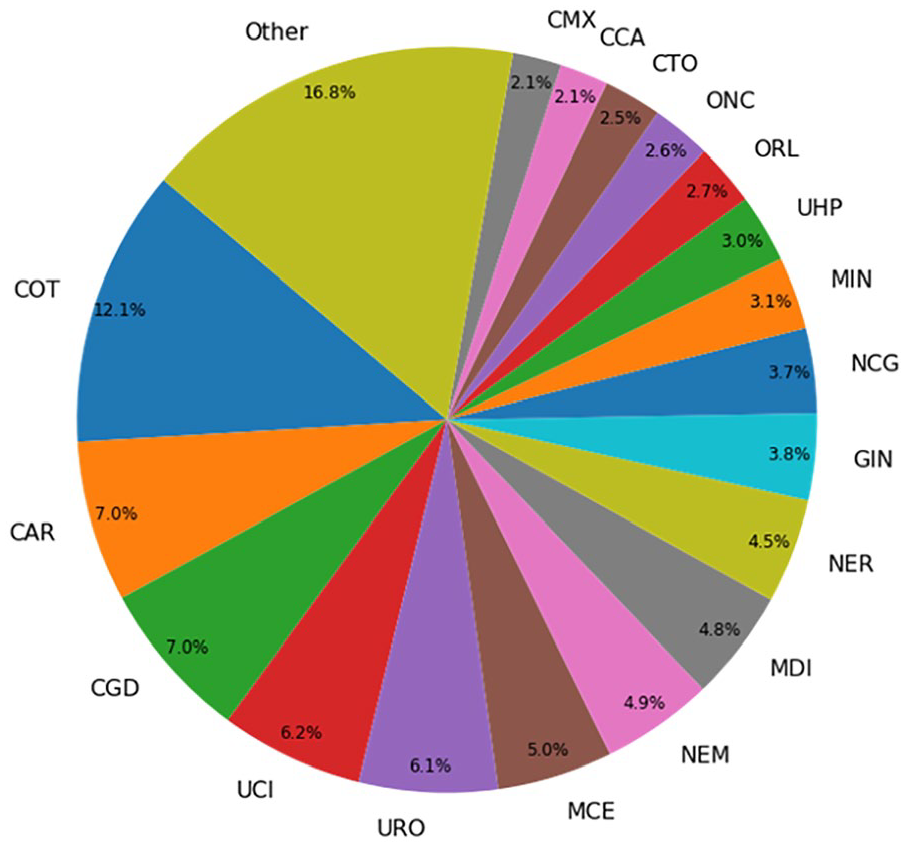
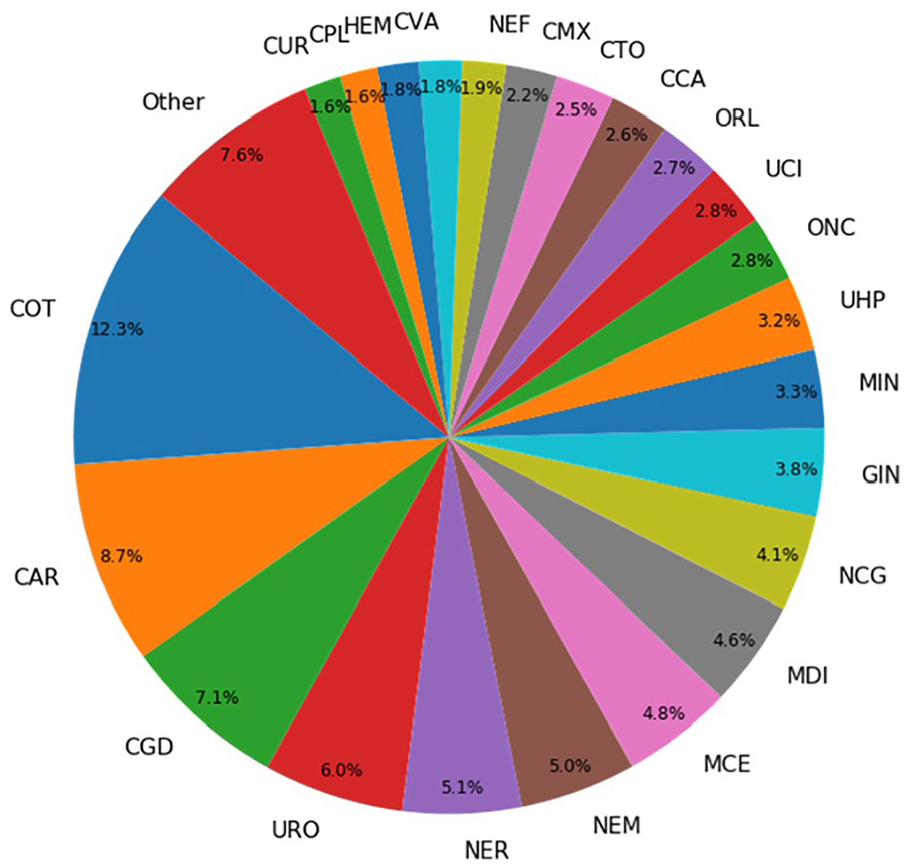
Target variable was exitus after 1 year from the admission date. The number of patients that have died in less than a year (positive cases) was 8113 (~12.43%), the number of negative cases is 57,166 (~87.57%). The whole variable description can be seen in Table 2. The distributions for Admission Destination, Service, and Admission Cause are represented in Figures 1–3 respectively.
Features information.
Distribution for admission destination.
Distribution for service.
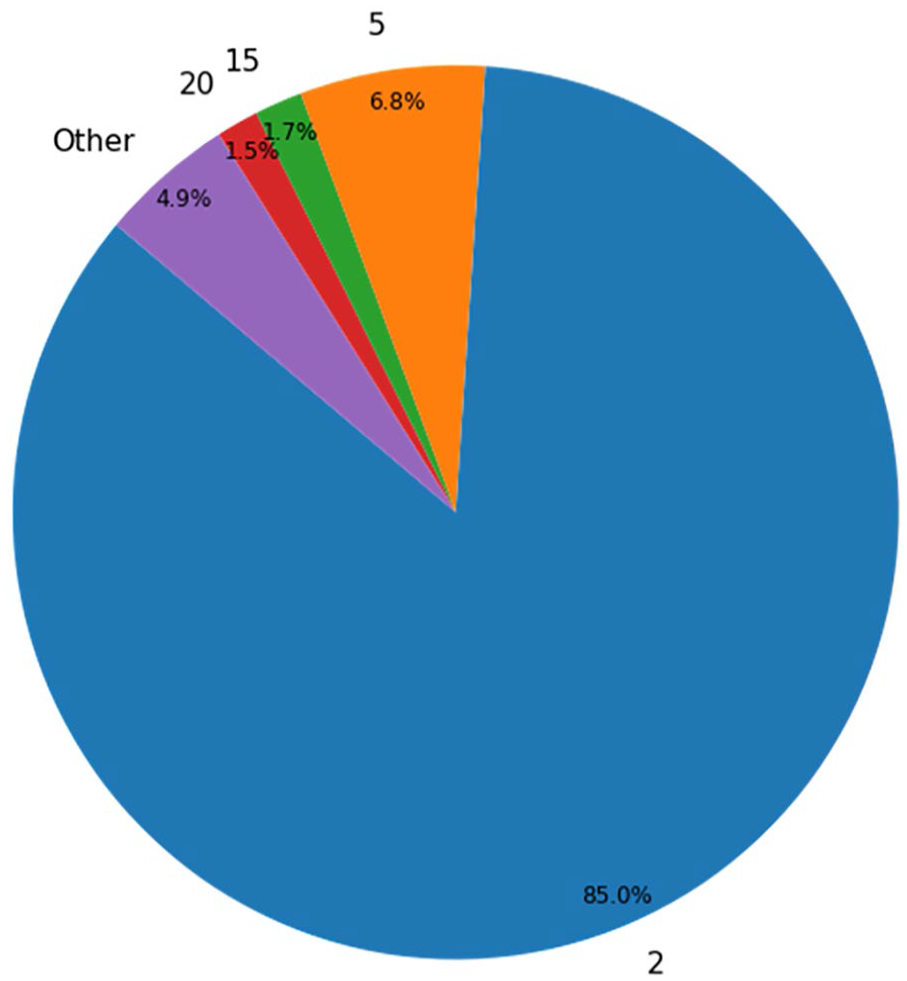
Distribution for admission cause.
Methods
Development of the models
Five machine learning techniques were employed for developing our predictive models: Gradient Boosting Classifier, 14 Random Forest, 15 K-Nearest Neighbors, 16 Multilayer Perceptron (MLP), 17 and Support Vector Machine. 18 The implementation of the scikit-learn toolkit 19 was employed in all of them except in the MLP which uses Keras and TensorFlow. 20 Moreover, the optimization tool TPOT 21 was used in order to find a good model to fit the data.
Feature importance
We studied the relevance of each feature for the final prediction by calculating the GINI importance provided by the Gradient Boosting Classifier. The GINI importance measures the average gain of purity by splits of a given variable. If the variable is discriminant for the problem, it tends to split mixed labeled nodes into pure single class nodes. 22
Validation of the state-of-the-art models
As a first step, we have compared our model with the PROFUND and Buurman’s model using the same evaluation method. For the Buurman’s model, a clinical committee led by Vicente Ruiz-García at Hospital La Fe adapted the Buurman’s proposal as 1-year mortality index, using a linear regression with the 1-year mortality target variable. Besides, we evaluated the original PROFUND model proposed in Bernabeu-Wittel et al. 8 The validation of the other models in state of the art was not possible due to the lack of part of their features in our data system.
Evaluation of the models
First, we have computed the ROC Curve 23 for each model and calculated the optimum probability threshold (minimum probability to assign the positive class to a sample) running our models using a random split of the data from separating train and test. We iterated over all the different values that could change the specificity and the sensitivity of the model and kept the threshold that minimizes the balanced error rate (BER). 23
Once the threshold is established for each model, we internally validated them using a 100-repetition stratified hold-out (80% of the data in order to train the model and 20% for test it). The missing values have been imputed using an iterative approach that models each feature with missing values as a function of other features, available in scikit-learn as IterativeImputer. 24 Five metrics have been stored for each experiment (accuracy, AUC ROC, specificity, sensitivity, and balanced error rate).22,23 For each metric, the mean and the 95% confidence interval have been computed.
In addition to this process, we performed a second round of experimentations, where we trained the models using a balanced set of data by oversampling the positive class using the SMOTE 25 technique. This will help us to determine which are the effect of class imbalance in the ML algorithms for this problem.
Results
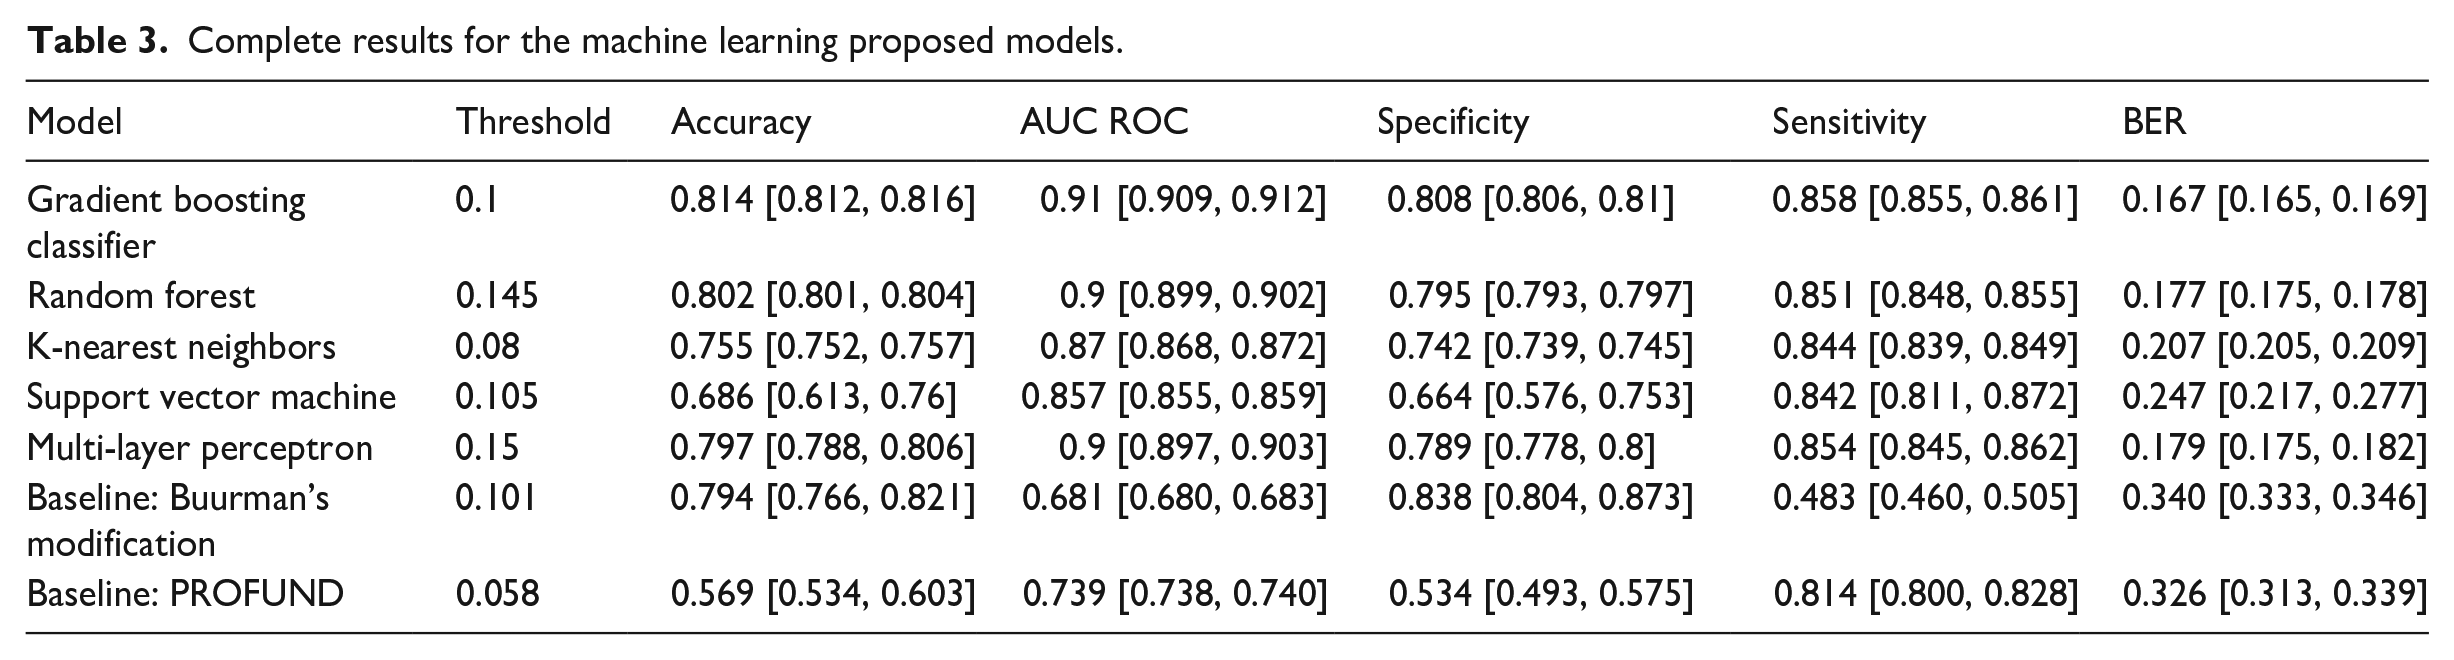
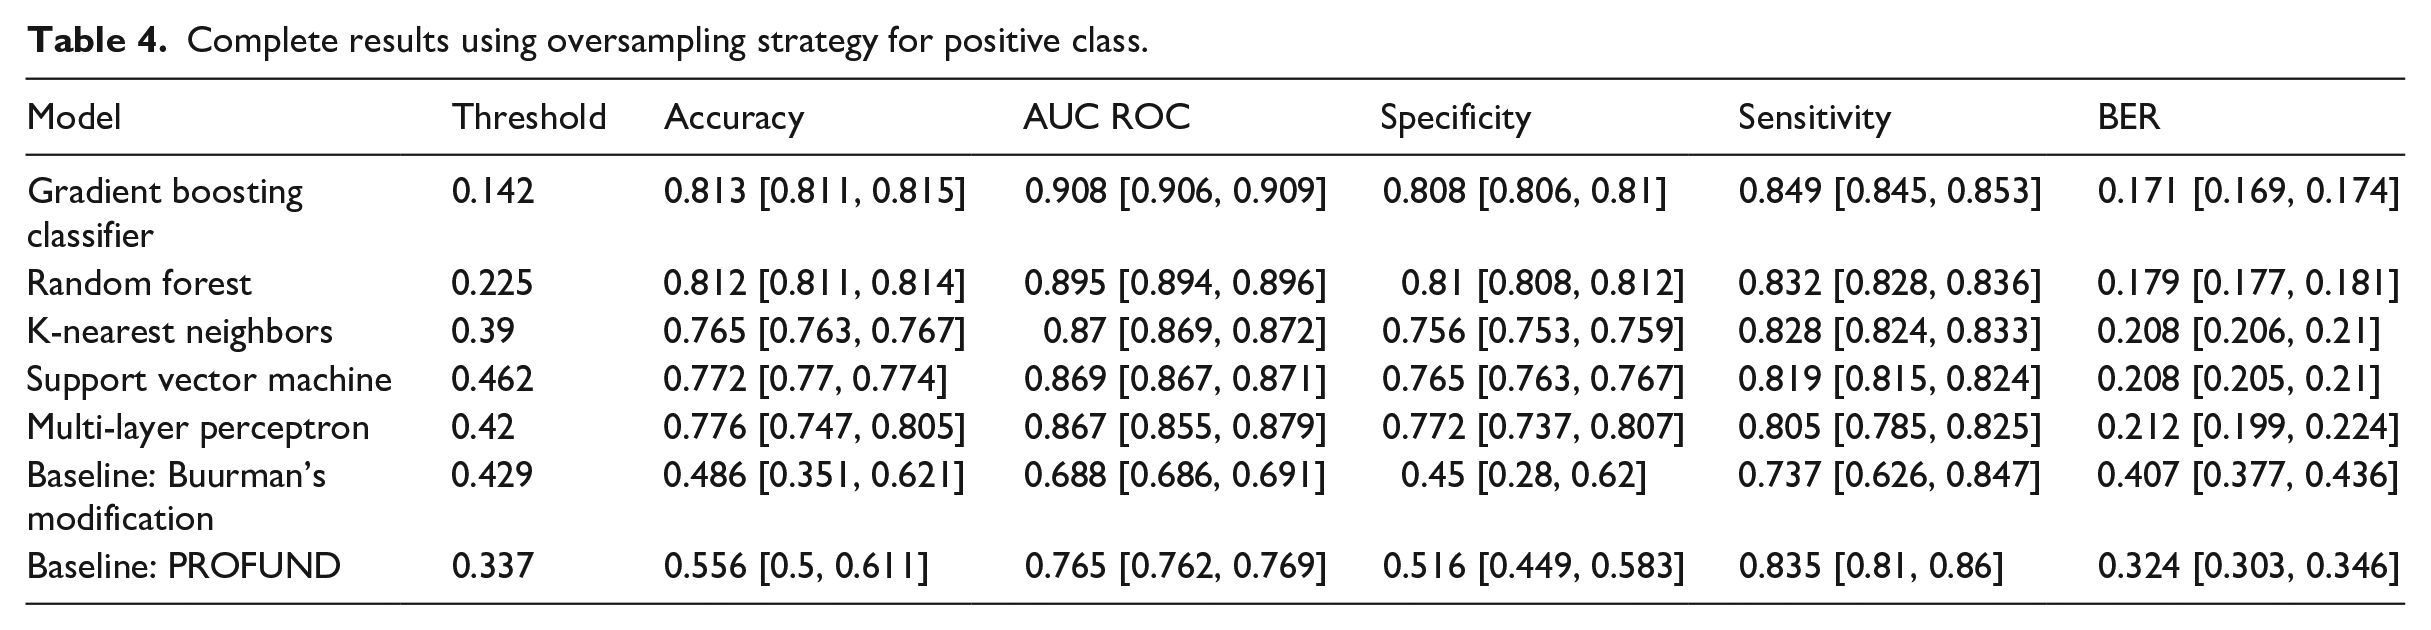
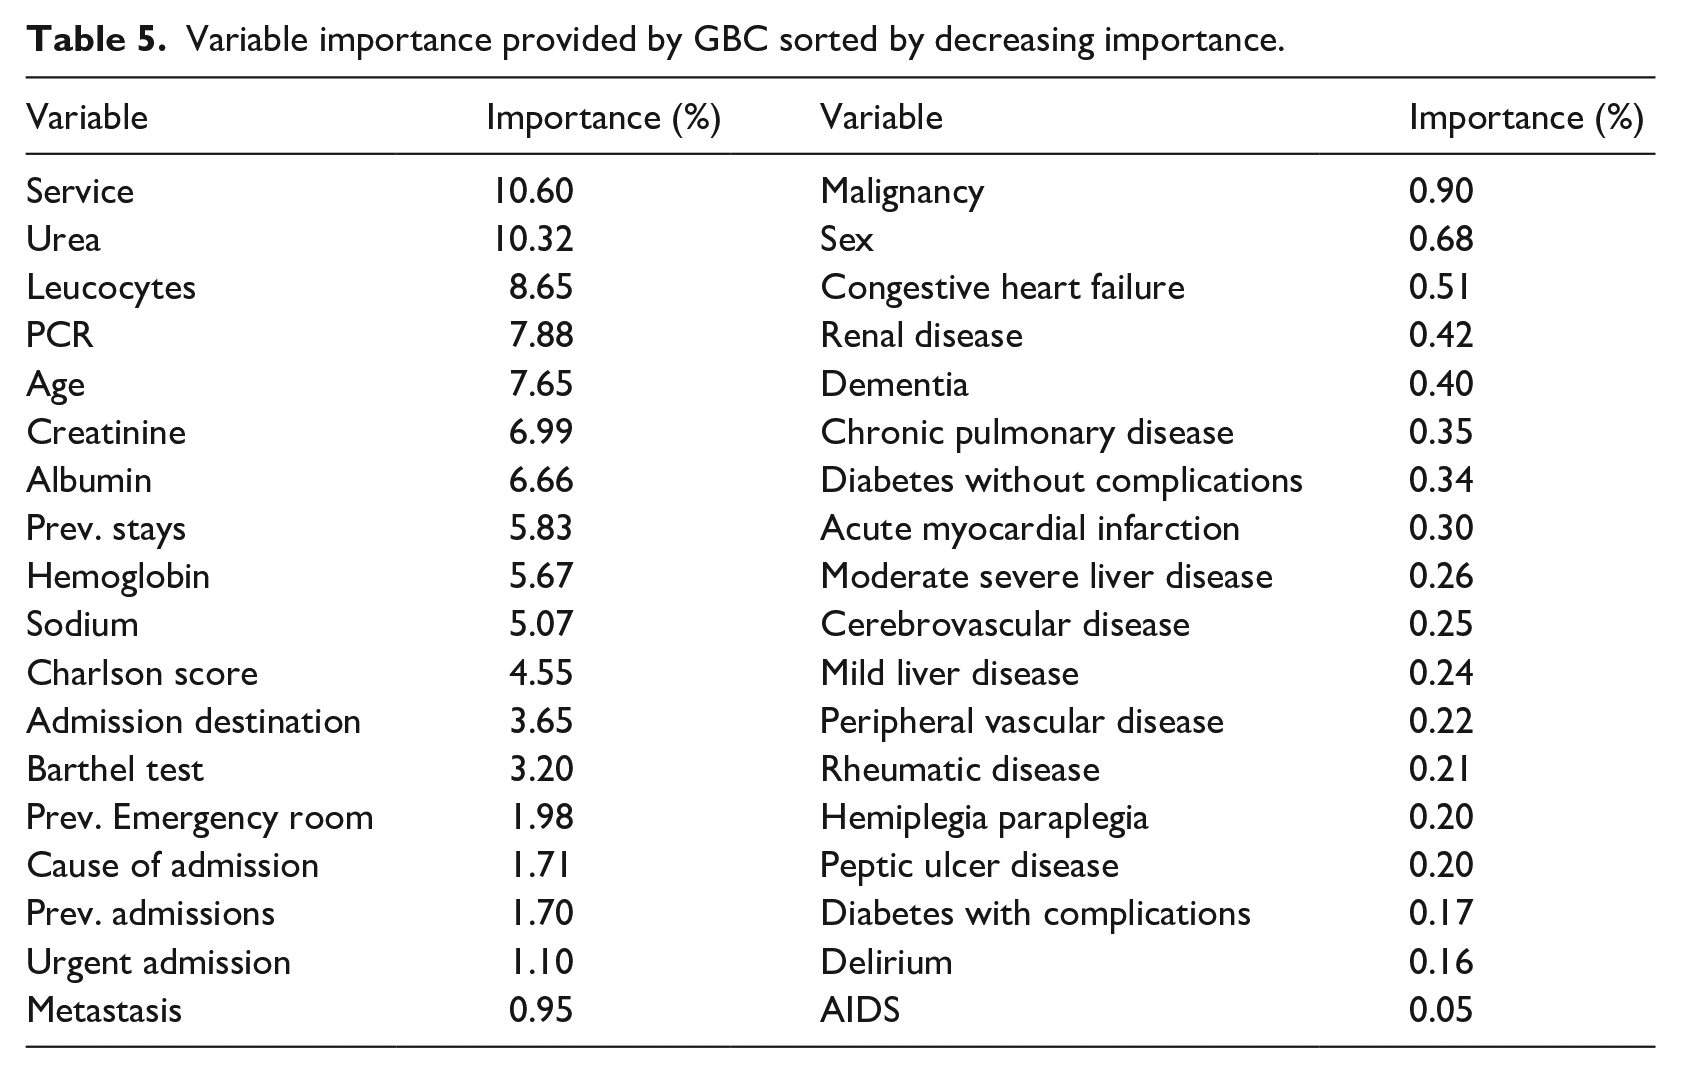
Following the above methodology, this section analyses the results of the proposed machine learning models, including a validation from Buurman’s modified model and PROFUND from the literature. In terms of AUC ROC, the model based on Gradient Boosting Classifier achieves the higher score with 0.91, being followed by the Random Forest and the Multi-Layer Perceptron. Table 3 contains means and confidence interval at 95% for all proposed models and selected metrics. Table 4 provides the same experiments as staged before but using SMOTE as an oversampling technique for the positive class. Once again, the Gradient Boosting Classifier is the model with higher AUC ROC (0.908), followed by the Random Forest. Results using SMOTE are slightly worse on the selected metrics. As for the variable importance, Service, Urea and Leucocytes obtained the higher scores (10.6%, 10.32%, 8.65%), followed by PCR (7.65%) and Age (6.99%). Table 5 lists every variable and its Gini Importance.
Complete results for the machine learning proposed models.
Complete results using oversampling strategy for positive class.
Variable importance provided by GBC sorted by decreasing importance.
Discussion
The prediction of death before 1 year could be a relevant criterion to admit the patients into palliative care programs. 6 Also, the prediction of the death at admission of the patient would help the hospital management to better manage its resources in a more accurate way.
We used the area under the ROC curve as the comparison metric because is the common metric to all other works in the SoA. We also chose the threshold for considering a sample into the positive class taking the value that minimizes the balanced error rate.
The Buurman’s modified model and the PROFUND index have been validated, the models described in our work outperform them in terms of AUC ROC, sensitivity and specificity. Whereas our models presented a bigger number of features (36) than the mentioned articles (four for Buurman’s modified model and nine for PROFUND index).
Comparing with the most recent work, Avati et al. 10 that presented a neural network with 18 hidden layers of 512 neurons each was trained with 177,011 patients. The models in our approach are trained with 52,223 patients. The network used 13,654 features as input, our model uses only 36. Finally, they achieved an AUC ROC of 0.93 for all their patients but it only achieved 0.87 when only admitted patients are considered. We achieved better results using a significative smaller amount features, this led to a more compact model that also is more interpretable since the best performing model is based on decision trees.
The results obtained using the oversampling technique in the training set are very similar to the ones obtained in the original experiment. The main differences are in the optimal thresholds, which increased in all cases due to the change in proportion in the classes.
The best results in our models achieved the interval reported by van Walraven et al. 9 : 0.89–0.92 AUC ROC. Despite the number of final features is smaller in HOMR (10) two of their features are composed: “charlson comorbidity index score” (15 items) and “diagnostic risk score” (70 items), so at the end, HOMR requires more information about the patients than our models. The performance comparison with Avati et al. 10 and HOMR have been made using their reported results which implies the use of different evaluations and datasets.
We obtained consistent results compared to other studies. In HOMR the features that are capable to add more points to the index are the admitting service (up to 28) and the “age × comorbidity” (other 28 points). We agree with the most important variable (real service code) and the fifth one in importance order (age). Our second most important variable, nitrogen in urea, is included among the Buurman’s model. Moreover, creatinine in blood is related to BUN and is a variable also associated with mortality is our results.
It is known from the scientific literature cited above that morbidities, together with age and functionality (in our case measured by the Charlson’s index) are the main predictors of mortality. However, our study on the importance of the variables shows that morbidities such as COPD score low, which is consistent with the van Walraven et al. 9 rule, which gives it only 2 points out of 35. Something similar happens with dementia, which scores only 3 points.
The value of Urea and Creatinine indicate renal failure measured in two different ways, and we also know that these are predictors in other mortality prediction rules such as Buurman’s et al. 7 rule, where they appear as predictive with once again the functional situation.
Our models confirm that the disease variables weight the decision process, but they are less important when no other disease is present. The models also guide us to consider that administrative variables such as previous urgent admissions, previous stays and destination of admission may have an additional weight not considered until now that contribute more to mortality than the fact of suffering a specific disease. Having this information updated permanently will allow for the adjustment of additional risks for patients who are acutely admitted to hospital through the Emergency Services.
We compared the method we have used to assigning importance to the different variables in the dataset, the GINI importance provided by the Gradient Boosting Classifier, to other methods based on features ablation. We used a technique called “Feature ranking with recursive feature elimination” (RFE) from scikit-learn. 19 The RFE starts training a model and obtains the variable importance. The least important variables are removed from the dataset, and the process continues recursively until a minimal set of variables is obtained. The results obtained were almost identical to the ones presented in this work, so we conclude that, in addition to its reputation in other areas such as machine learning interpretability, GINI importance is a robust indicator to feature’s significance in the model.
The clinical features included in our work have clinical relevance and appear in other clinical prediction rules. They appears in the records of our hospital databases in Spain and allow the creation of alerts for the clinicians to address patients, to palliative care programs not only for advanced oncology patients but for other chronic pathologies as dementia (a critical literature review exploring the challenges of delivering effective palliative care to older people with dementia, cardiac failure, or chronic obstructive pulmonary disease (COPD) or end-stage renal disease (Comparing the Palliative Care Needs of Those With Cancer to Those With Common Non-Cancer Serious Illness)).26–28
This study has caused a direct impact on Hospital La Fe since the model based on the Gradient Boosting Classifier has been implemented in the pre-production information systems and it is on a test stage. Once in the day, a program gathers all the admitted patients’ data and extracts the features, this information is passed to the model who gives a posteriori probability and a label prediction, this information is stored on a separated table of the same database including the timestamp.
The main limitation of the study was the use of data from only one hospital, we can’t ensure that the models learned with the study population are effective with patients of another country/region, or another type of hospital, Hospital La Fe is a tertiary Hospital a referral in the Valencia region, with different patients and severity.
In addition, the models had only an internal derivation, so we need to refine and validate this model to reproduce the findings with different settings (smaller hospital and with less severity illness) perhaps outside the same city or Valencian community, where we can have a population with different habits such diet or lifestyle. It is necessary to work on additional criteria for palliative care admission besides mortality, for example, introducing the available resources in the decision-making process. Also, an inclusion criterion for chronic patients is needed since their illness trajectories are different from other patients. 29
The work presented in this article is being continued in the InAdvance project, a European project about palliative care which aims to research and standardize some palliative care procedures as well as other aspects such as admission criteria. Our work in this project is to develop predictive models for mortality, frailty and resource consumption which integrated into Clinical Decision Support System (CDSS) could be proven as reliable and objective inclusion criteria for palliative care. This palliative care criterion is intended to be unbiased and independent from the place the care takes place, so other institutions such as hospices or nursing homes can take advantage of them with the only restriction of having access to the variables the model needs to run.
Conclusion
This work proposes machine-learning forecast of 1-year exitus using data from hospital admission. Our forecast achieved an area under ROC curve of 0.9 and a BER of 0.17, being the Gradient Boosting Classifier the best model. The features used in the models correspond to basic demographic and administrative information, some laboratory results and a list of positives or negatives for certain diseases. The presented models could have an instant impact on every hospital, only the feature extraction module and the table for results need to be adapted to the particular information system of every hospital, the rest of the components are ready to set in production. Our results have reached the best results in the state-of-the-art, corresponding to the HOMR index which validation in few Canadian hospitals produces AUC ROC from 0.89 to 0.92.
Footnotes
Acknowledgements
Special thanks to the BDSLab researchers for their support.
Clinical relevance statement
The research showed that is possible to predict which patient will have a high risk of death before 1 year after hospital admission. These predictions were for a wide range of population, not only for the suspected patients with a short-life expectancy patients, palliative care must ensure the best quality of life at the end of life’s patients.
Declaration of conflicting interests
The author(s) declared no potential conflicts of interest with respect to the research, authorship, and/or publication of this article.
Funding
The author(s) disclosed receipt of the following financial support for the research, authorship, and/or publication of this article: This work was supported by the InAdvance project (H2020-SC1-BHC-2018-2020 No. 825750).
Human subjects’ protections
This work did not imply any risk nor alteration in the habitual health care provided for the subjects. Only the authorized personnel could access the electronic records that were properly anonymized using dissociative and untraceable codes. This investigation followed the International Guideline for Ethical Review of Epidemiological Studies 30 and the ethic committee from IIS LA FE that approved the study’s protocol.
Summary table
What was already known on the topic – Different models for 1-year mortality prediction, mostly based on scores – Patients enrolled in early palliative care improve their quality of life compared with the ones receiving late palliative care or standard care.
What this study added to our knowledge – One-year forecast at hospital admission using Gradient Boosting Classifier and Random Forest reported the best results in state of the art, achieving performance feasible for clinical use. – Only features gathered at the first hours of hospital admission may be enough as criteria for palliative care inclusion. – Hospital service, laboratory analysis, and age are the essential features for 1-year forecast, confirming previous studies and allowing us to create compact predictive models