
Abstract
Palliative care (PC) has demonstrated benefits for life-limiting illnesses. Bad survival prognosis and patients' decline are working criteria to guide PC decision-making for older patients. Still, there is not a clear consensus on when to initiate early PC. This work aims to propose machine learning approaches to predict frailty and mortality in older patients in supporting PC decision-making. Predictive models based on Gradient Boosting Machines (GBM) and Deep Neural Networks (DNN) were implemented for binary 1-year mortality classification, survival estimation and 1-year frailty classification. Besides, we tested the similarity between mortality and frailty distributions. The 1-year mortality classifier achieved an Area Under the Curve Receiver Operating Characteristic (AUC ROC) of 0.87 [0.86, 0.87], whereas the mortality regression model achieved an mean absolute error (MAE) of 333.13 [323.10, 342.49] days. Moreover, the 1-year frailty classifier obtained an AUC ROC of 0.89 [0.88, 0.90]. Mortality and frailty criteria were weakly correlated and had different distributions, which can be interpreted as these assessment measurements are complementary for PC decision-making. This study provides new models that can be part of decision-making systems for PC services in older patients after their external validation.
Introduction
Palliative Care (PC) is a holistic approach that improves patients' quality of life with life-limiting diseases. It is recommended to incorporate early in the disease trajectory, even in conjunction with potentially curative treatments. 1 PC can improve quality of life, 2 mood, 3 symptom control, 4 reduce emergency department visits and hospitalisation, 5 and even increase 1-year survival. 6
PC services have traditionally been mainly accessed by cancer patients, but there is growing consensus about the importance of promoting access for patients with non-malignant disease at earlier stages.7,8,9 Patients' prognoses and functional decline are two crucial elements in decision-making to be considered by healthcare professionals in the introduction of PC need assessment and PC conversations with older people.
On the one hand, it is estimated that at least 75% of patients would benefit from access to PC during their terminal illness. 10 Nevertheless, uncertainty about prognostication is cited as a common barrier to PC referral, particularly for patients with non-malignant diseases. 11 On the other hand, frailty in older patients is defined as a state characterised by reduced physiological reserve and loss of resistance to stressors caused by accumulated age-related deficits. 12 Two of the most popular frailty dimensions are the frail phenotype by Fried et al., 13 which describes frailty as a biological syndrome; and the Frailty Index (FI) by Mitnitski et al., 14 which is based on health deficits accumulations, also, frailty has been defined since a more comprehensive approach taking into consideration a holistic understating of the person. In this sense, frailty can be experienced by a decrease in human functioning at the physical level and psychological and social domains. 15 Raudonis et al. 16 suggest in their study that frail older adults could benefit from involvement in PC programmes as frailty is associated with poor health outcomes and death. 17
Different strategies have been used to try to aid prognostication. Clinical intuition was harnessed with the Surprise Question (‘Would I be surprised if this patient died in the next year?’) which, has been promoted as a tool to prompt clinicians to recognise patients with a limited prognosis. 18 However, in 2017 Downar et al. 19 published a systematic review of the surprise question, concluding that more accurate tools are required given its poor to modest performance as a mortality predictor. Also, it has been demonstrated that the risk of death increases with lower performance levels and with falling performance levels, but survival data varied across different healthcare systems. 20 In this line, the Supportive and Palliative Care Indicators Tool (SPICT) proposes a set of clinical indicators of poor prognosis developed through a consensus of expert opinion, 21 which has shown to have a predictive accuracy of up to 78%. 22 Other studies have used data analysis to propose alternative tools to predict short-term mortality. Bernabeu-Wittel in 2010 developed the PROFUND index, 23 a predictive model for patients with multimorbidity. Van Walraven et al. in 2015 proposed HOMR, 24 a tool for predicting 1-year mortality in adults (⩾18 years and ⩾ 20 years for the different cohorts). In 2018, Avati et al. 25 proposed a deep learning approach to identify patients with a survival between 3 and 12 months, in 2019 Wegier et al. 26 proposed a version of HOMR but using only variables available at the admission. In 2021, our team also presented a 1-year mortality model for adults. 27
Additionally, and as stated before, quantifying frailty is important since as patients become frail, advance care planning conversations should be prioritised to establish patient goals and wishes in advancing serious illness, 28 which may include the involvement in PC programmes. A wide array of FI has been proposed to assess the health status of older adults. The FI has been used to predict mortality and poor health outcomes. 29 Some studies have tried to predict frailty status: Babič et al. in 2019 30 use a clustering approach to identify clusters considering the prefrail, non-frail and frail status using 10 numerical variables for adults over 60 years old. Sternberg et al. 31 in 2012 tried to identify frail patients with their methods against the VES frailty score 32 for patients over 65 years old. Bertini et al. 33 in 2018 created two predictive models for patients over 65 years old: one to assess frailty risk using the probability of hospitalisation or death within the year and a second one to assess worsening risk to each subject in the lower risk class.
Based on these previous results, our aim in this work is to propose a set of Machine Learning (ML) tools capable of making predictions about mortality and frailty for older patients, oncological and non-oncological, so healthcare professionals can benefit from quantitative approaches on data-driven evidence when deciding advance care planning. In this sense, we propose the creation of three different but complementary models: (a) a 1-year mortality classifier that will work as a binary predictor; (b) a survival regression model aimed to obtain a prediction in days from admission to death; and (c) a 1-year frailty classifier to predict the health status, assessed by the FI, of a patient 1 year after admission. The authors consider that the combination of both mortality and frailty criteria, working as complementary information sources, can positively impact detecting needs to start PC conversations.
Materials
Basic description
Data was extracted from the system on 1 November 2019. The dataset contained hospital admissions records for older patients (age ⩾ 65) from 1 January 2011 to 31 December 2018. Patients admitted to psychiatry and obstetrics services were excluded from the study.
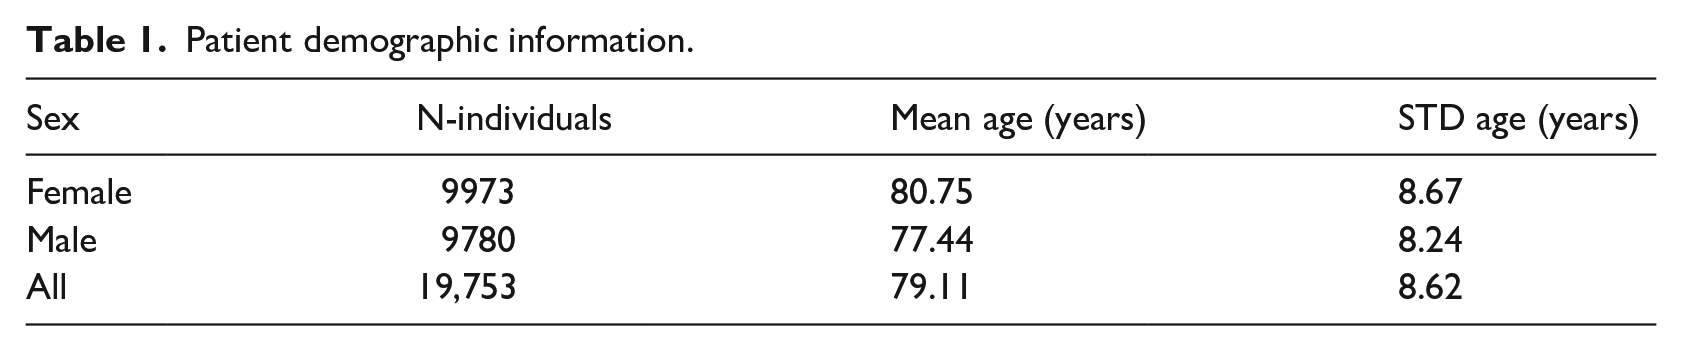
Data contains a total of 39,310 hospitalisation episodes corresponding to 19,753 unique patients. The cohort was composed of 9780 males and 9973 females with a mean age of 80.75 years (see Table 1).
Patient demographic information.
Mortality target variables
Mortality target variables were extracted from administrative admission data and the recorded death date of regional civil registration. Patients alive during data extraction were censored for the regression problem due to our inability to know their survival time from admission. However, patients alive with an admission date prior to 1 November 2018 (1 year prior to the extraction) could be included since we could determine their mortality status within the year.
Frailty target variable
As for the frailty target, following the work of Searle et al., 34 we calculated the FI of every episode (admission frailty) and sorted them chronologically. The target FI of a given episode was the admission frailty of the following episode if this next episode happened within the year. We used the most recent episode as the target if a patient had multiple admissions during the following year. Otherwise, target frailty was set to the same value as the current admission frailty. Most recent episodes and patients with only one episode were removed because no posterior data was available, so we considered them as censored data. Figure 1 presents an example of target FI calculation for each possible situation.
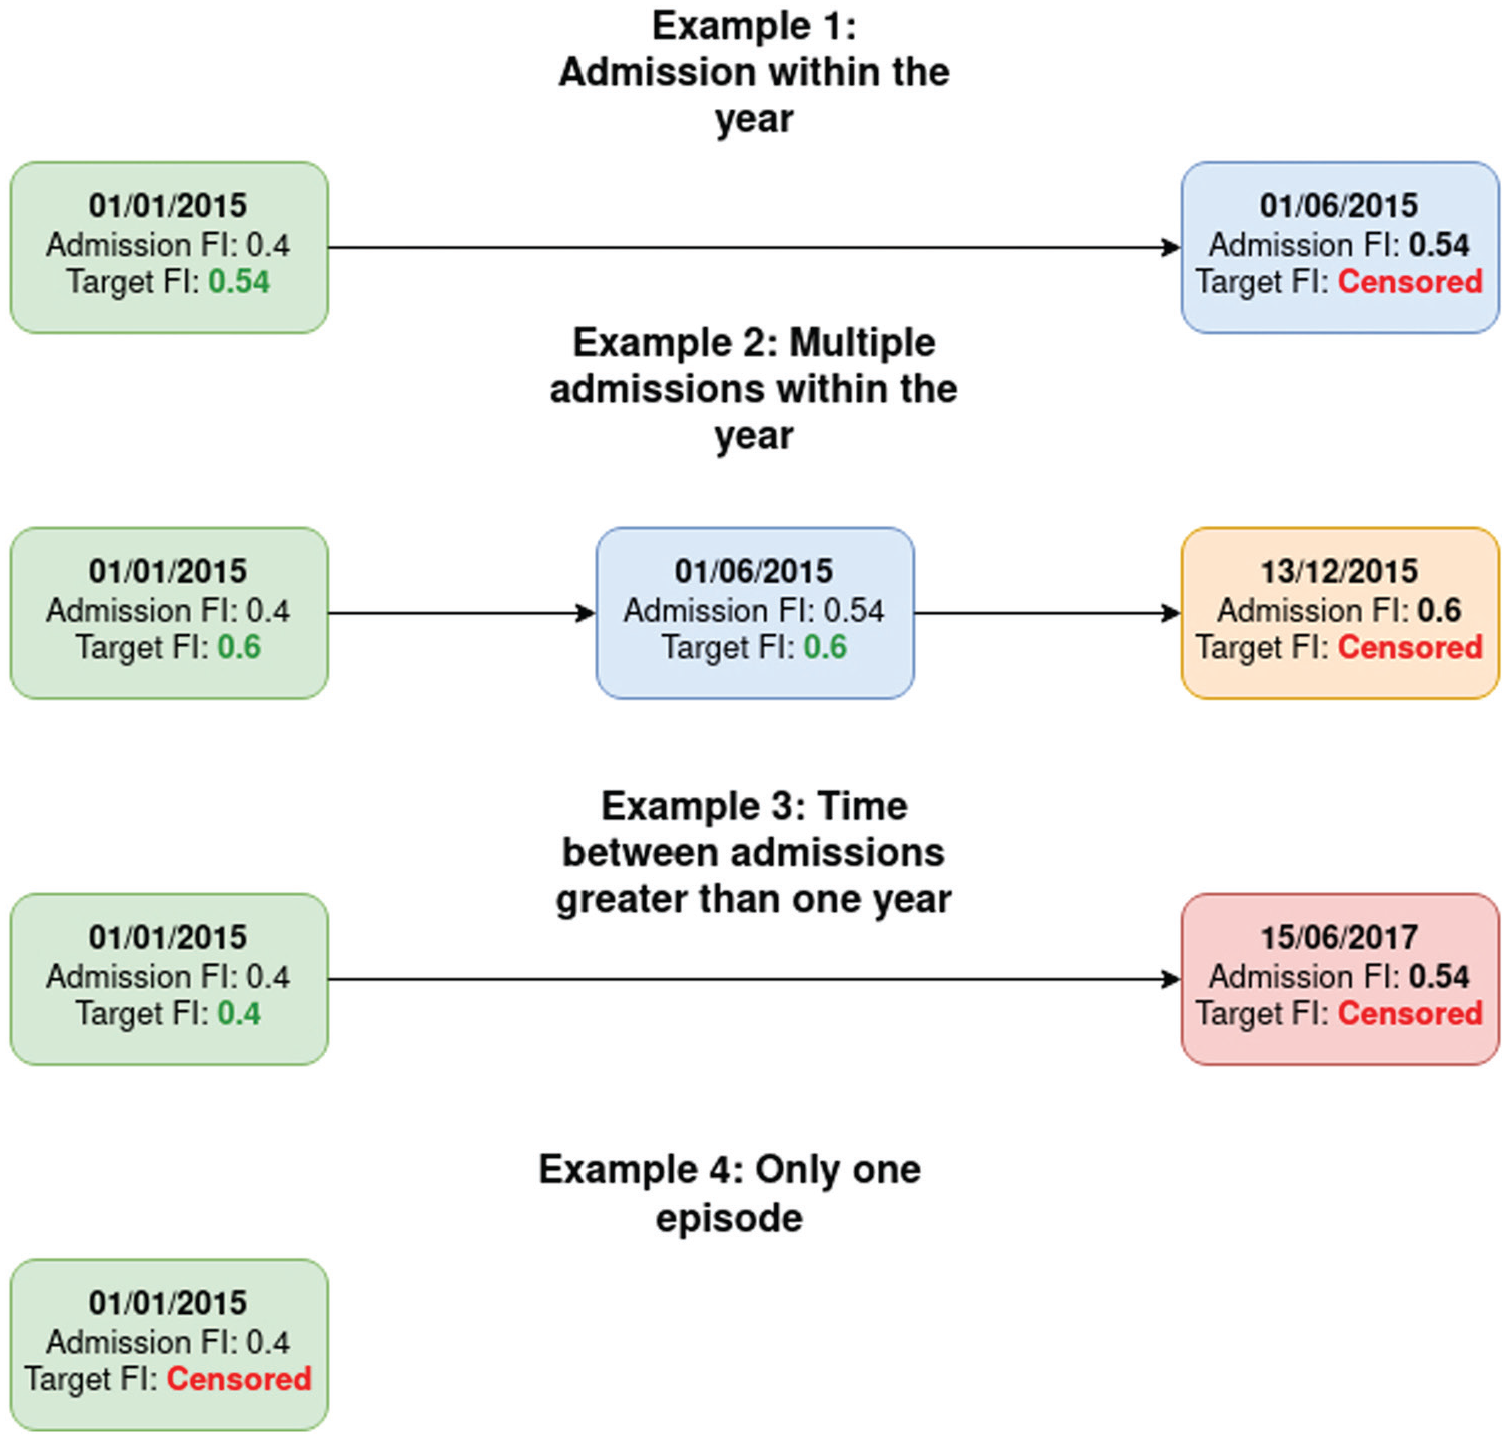
Visual representation of the algorithm to calculate the target FI in all four possible situations.
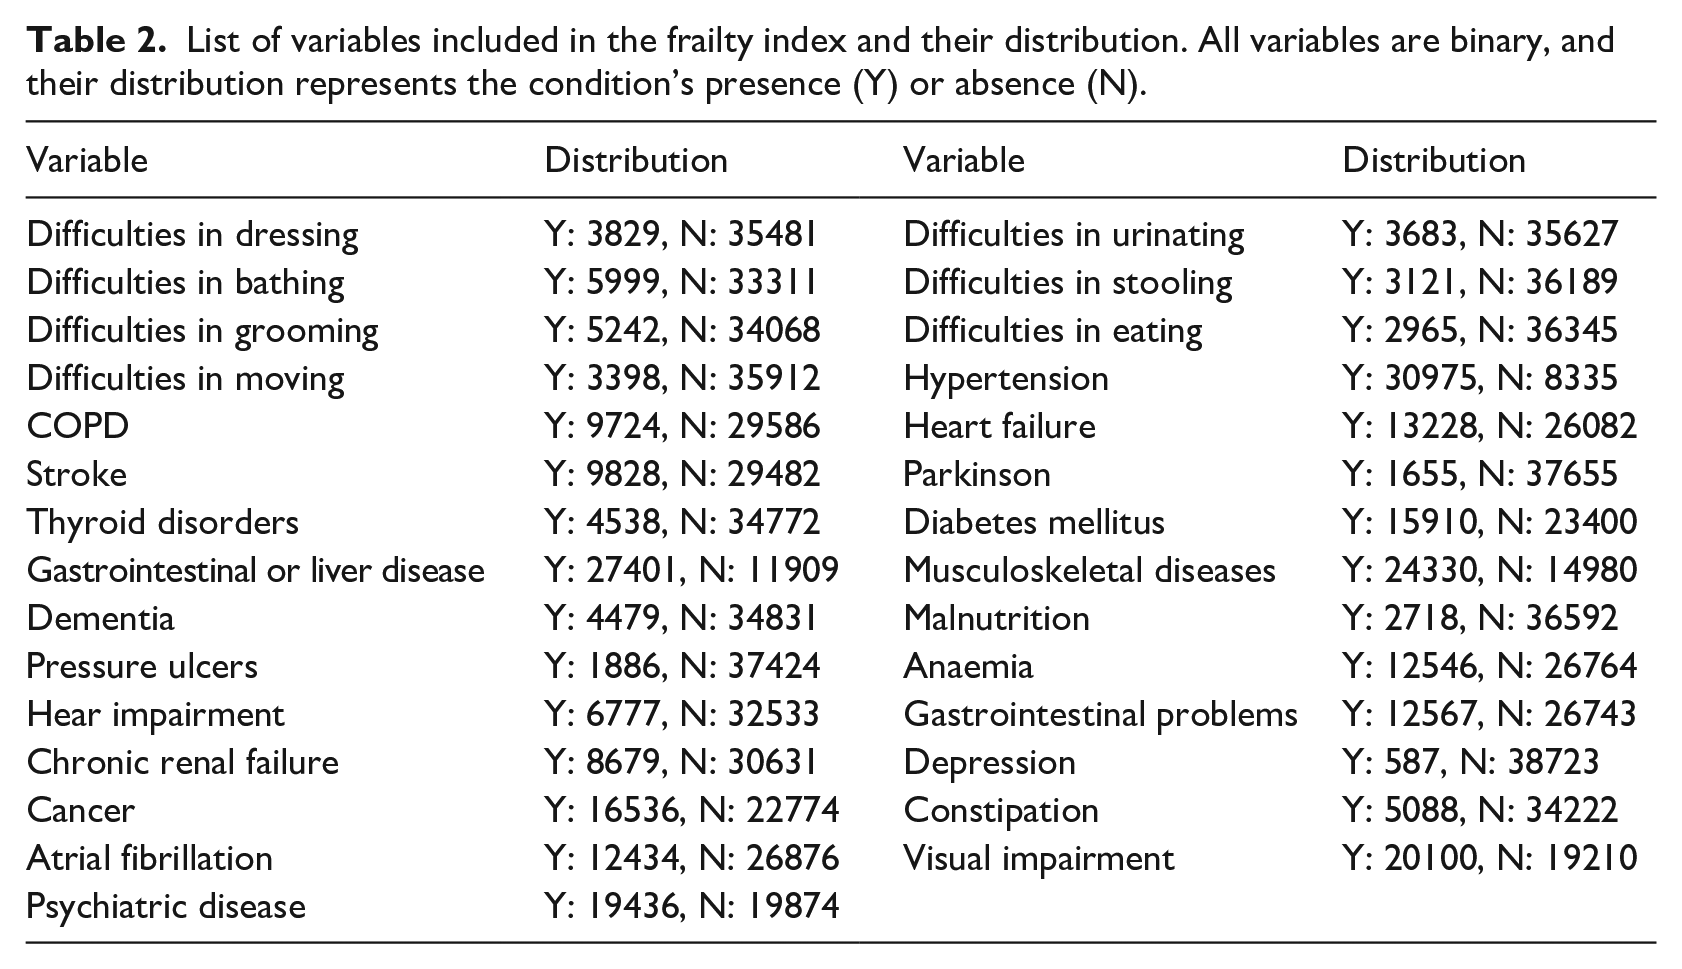
Finally, we stratified the FI into four categories according to the work of Hoover et al. 35 and aggregated the two less severe frailty conditions (Non-Frail + Vulnerable) and the two more frail statuses (Frail + Most Frail). Variables used in the FI are listed in Table 2 and were extracted as part of the original 147 variables.
List of variables included in the frailty index and their distribution. All variables are binary, and their distribution represents the condition’s presence (Y) or absence (N).
Data censoring and distributions
After data censoring, the 1-year mortality target variable distribution was: 24,985 (65.83%) episodes were negative cases (time to exitus > 365 days) and 13,431 (34.17%) episodes were positive (time to exitus ⩽ 365 days) as shown in Figure 2(a). The survival regression target variable (20,959 episodes; mean 368.59; range [0 to 3033]) presents a right-skewed shape, as can be observed in its density plot in Figure 2(b).
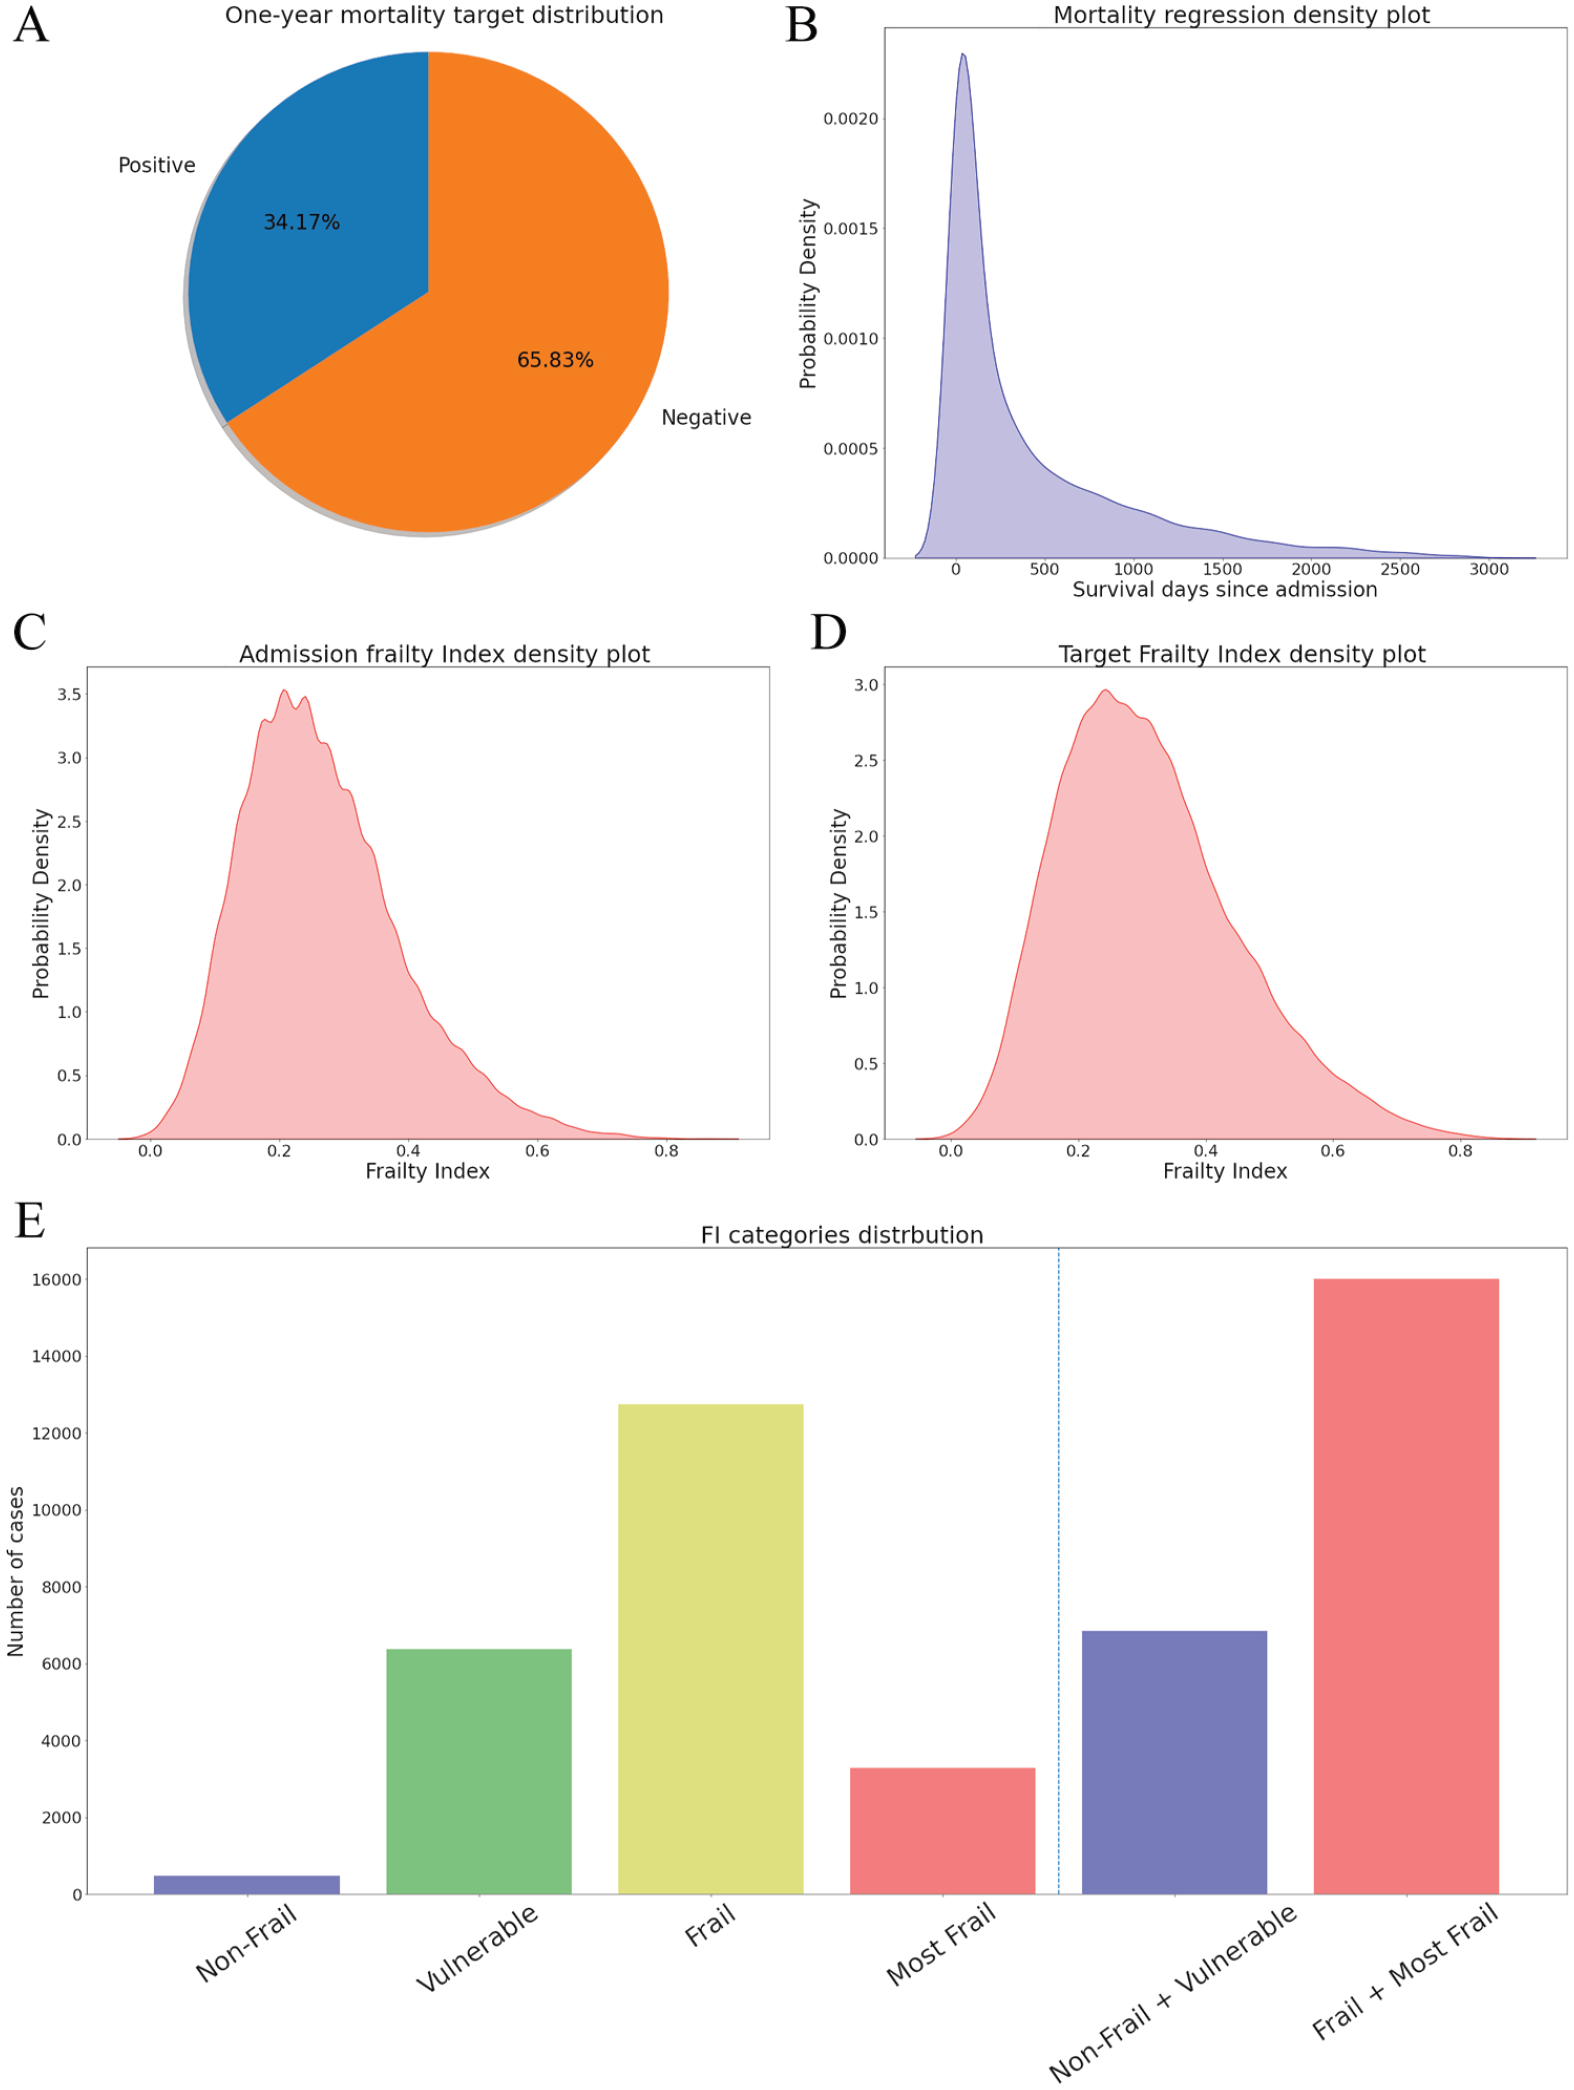
(A) One-year mortality target distribution; (B) Density plot from survival regression target variable; (C) Density plot from the FI target variable; (D) Density plot from the admission FI; (E) FI categories distribution.
The admission FI (mean 0.27; std 0.12) and the FI target variable (22,859 episodes; mean 0.32; std 0.14), resembled a slightly skewed normal distribution (plot in Figure 2(c) and Figure 2(d)), while the distributions of the different categories are: Non-Frail 986 (2.2%), Vulnerable 10,911 (24.34%), Frail 25,638 (57.19%), and Most Frail 7294 (16.27%). As aggrupation of two categories: Non-Frail + Vulnerable 11,897 (26.54%), Frail + Most Frail 32,932 (73.46%), data represented in Figure 2(e).
Methods
Predictive models
As the first approach for predictive models, we have selected the Gradient Boosting Machines (GBM), 36 which can be used for classification and regression. Gradient Boosting Machines are ensemble models composed of decision trees. This model follows an iterative training algorithm. In each step, the tree that minimises the selected loss function is added to the ensemble until the hyperparameter setting the number of trees is reached. The GBM models are known for their notable performance on different problems.37,38,39
Our second approximation to the predictive models is through the Deep Neural Network (DNN). 40 Due to the tabular nature of the data, we are using a multilayer perceptron topology, which is composed of interconnected neurons. Weights connect the neurons, and their output is a function of the sum of the inputs to the neuron, applying a non-linear activation function afterwards 41 . Our models are using Batch Normalisation 42 and Dropout 43 as regularisation methods and the Leaky ReLU 44 function as activation function. Deep learning has been a trendy technology when dealing with the increasing amount of data, and its application to medicine is growing. 45
Hyperparameters and variable selection
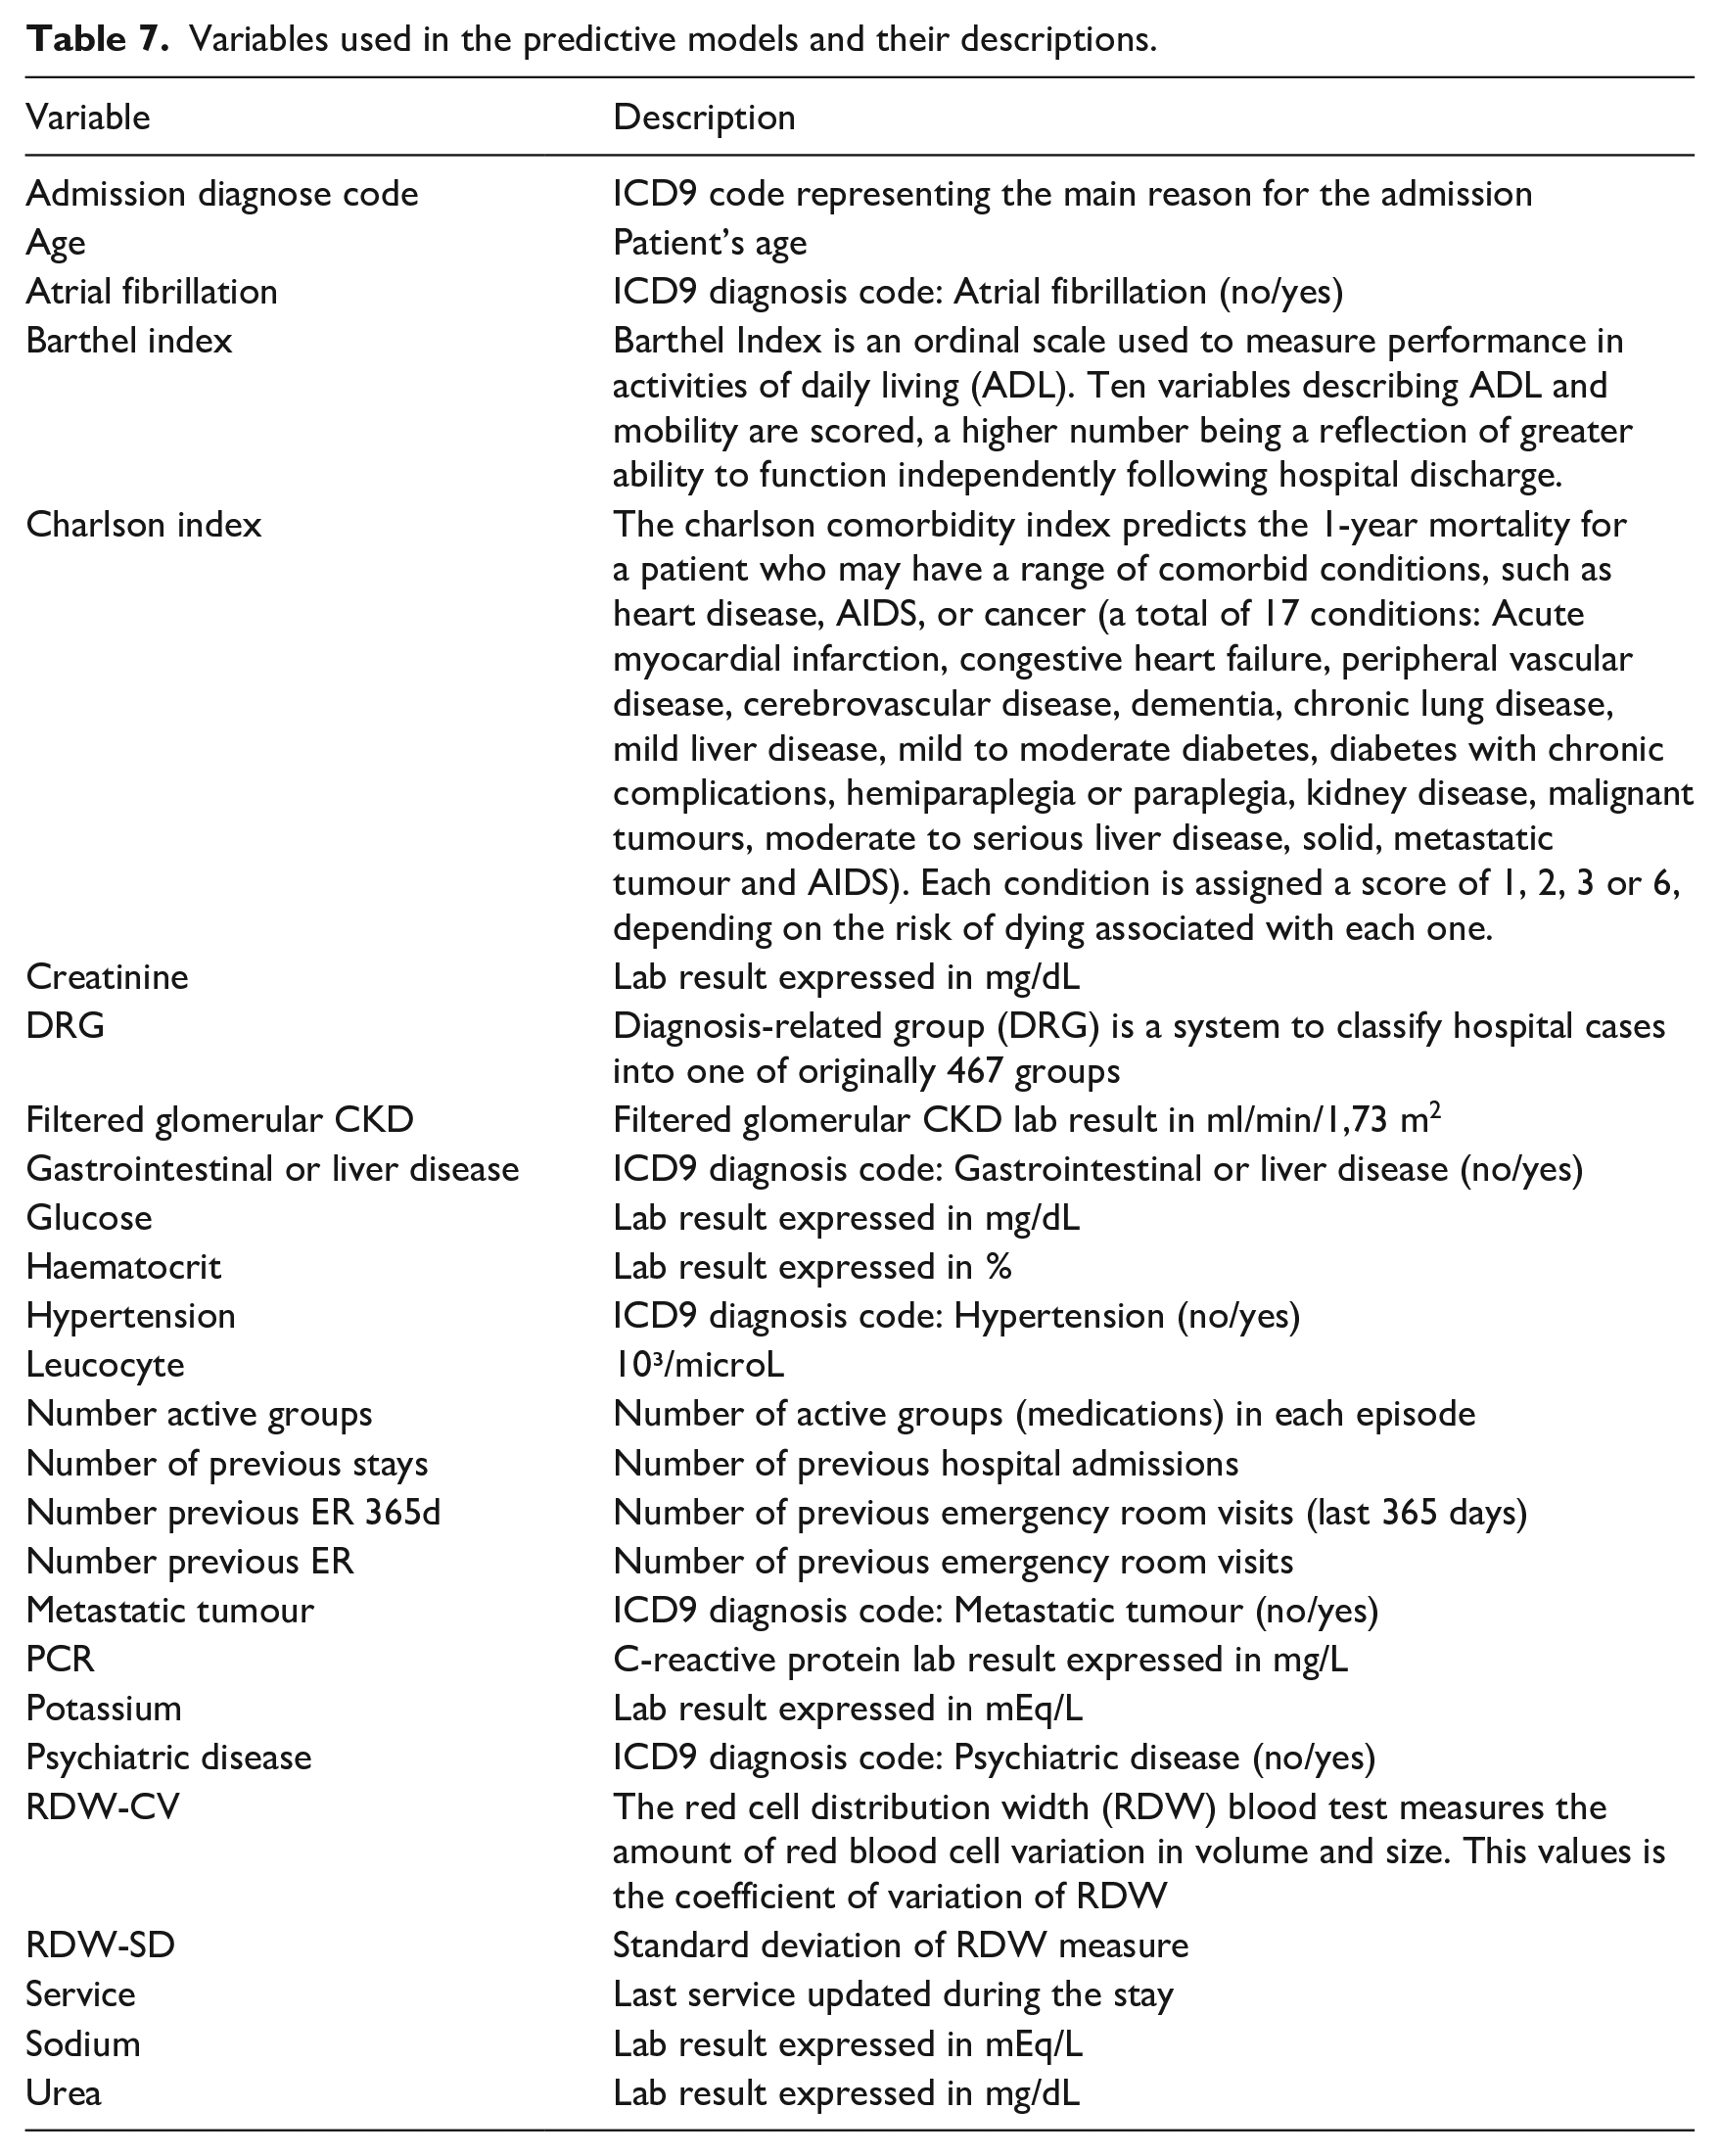
To select the hyperparameters and make the selection of variables, we split the datasets (80%/20%) into a design set and an evaluation set. Then, we used a recursive feature elimination process as a filter method on the design set. This process starts with the whole set of features, trains a tree-based model and calculates each variable’s relevance using the Gini importance, 46 which measures the average gain of purity in the tree splits. Finally, less relevant variables are eliminated. The process is repeated until the desired number of features is obtained. The number of variables was set to 20 in each task, a number of variables able to be handled by a human operator, with two variables eliminated each iteration. Table 7.
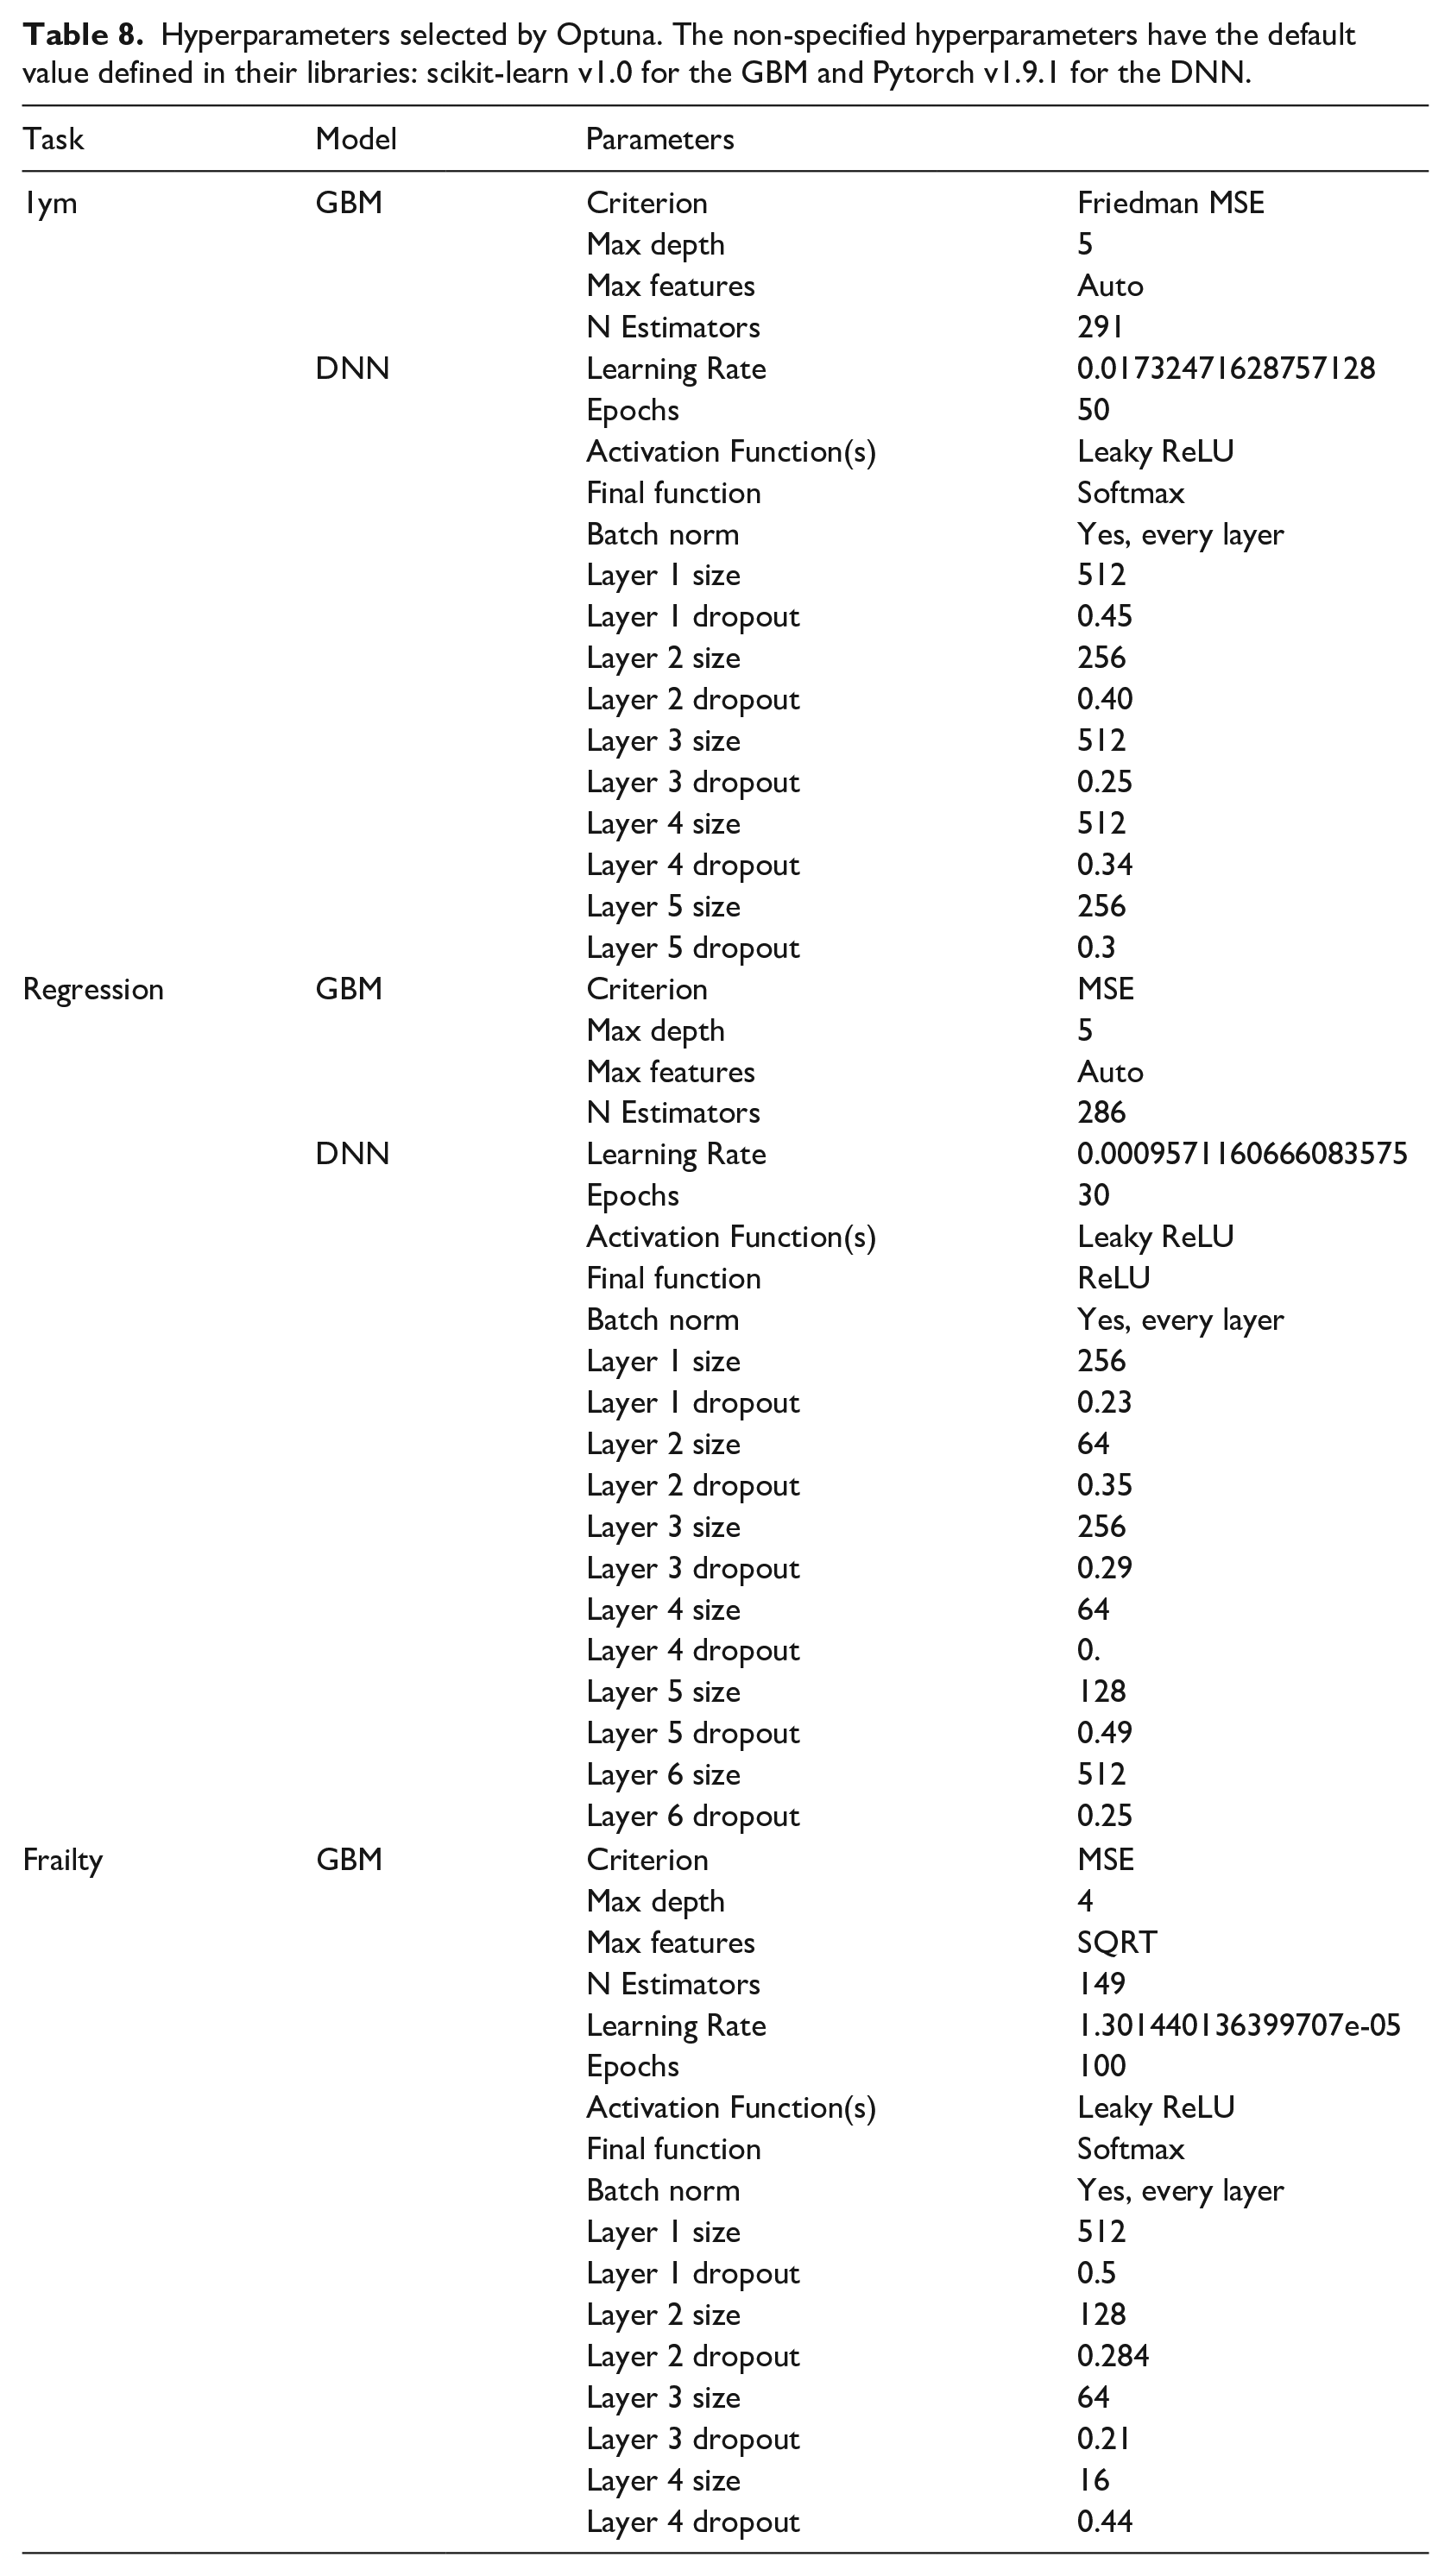
The selection of hyperparameters for each model was performed using the Optuna optimisation library. 47 Using this approach, we selected the most relevant hyperparameters for the GBM and the DNN and provided feasible ranges. During the process, the method selects a value for each hyperparameter, trains the model with 80% of the design set, and evaluates it with the remaining 20% and the appropriate metric. As more iterations occur, Optuna makes a smarter selection of the hyperparameters until the algorithm reaches a selected number of iterations. The hyperparameters used in each model can be consulted in Table 8.
Evaluation
We used the bootstrap technique 48 to evaluate the models with 1000 resamples on the unseen evaluation set. To evaluate the performance of the 1-year mortality and the frailty binary classifier, we selected the following metrics: area under Receiver Operating Characteristic curve (AUC ROC), accuracy, sensitivity (or True Positive Rate) and specificity (or True Negative Rate). We selected the mean absolute error (MAE) for the survival regression model. In addition, we repeated the regression experiments using only those cases where the prediction is < 500 days. In addition, since the GBM is an explicable model, we reported the contribution of each variable in percentage.
Comparison with baseline models
To compare our mortality regression model with state of the art, we have performed survival analysis over the data processed with the same pipelines described above. We chose the Cox regression model, 49 from which we obtained survival estimations for patients by calculating the survival expected time. We trained a binary Logistic Regression to compare the classification models for both mortality and frailty.
Software
The whole experimentation described in this work has been carried using the python 3 programming language, 50 and the following scientific libraries and packages: numpy as the main mathematical library, 51 pandas’ data frames to handle the data representation, 52 scikit-learn’s implementation of GBM, 53 Pytorch’s DNN implementation, 54 Optuna as hyperparameters selection 47 and lifelines’ implementation of the Cox model. 55
Results
Associations between distributions
The Spearman’s correlation coefficient between the survival target in days and the admission FI was −0.10 while the correlation between survival and the target FI was −0.16; both correlations were statistically significant (p < .001). The similarity between the binary 1-year mortality target and the binary FI target was studied using the Chi-Squared test. However, we had to reject the null independence hypothesis (p < .001), and therefore it exists a similarity between both binary variables.
One-year mortality classifier
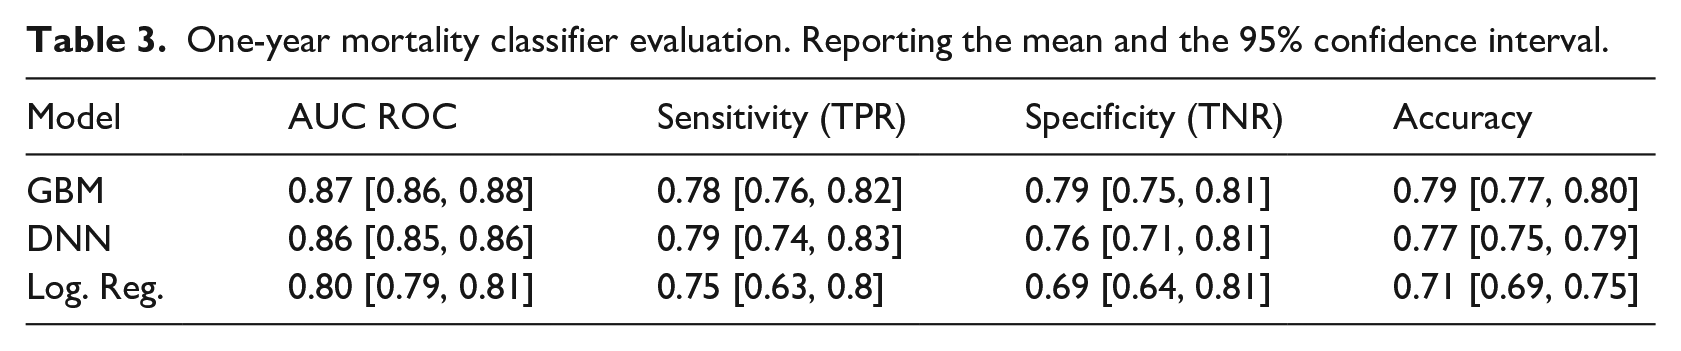
Gradient Boosting Machine and DNN performed very closely (0.87 CI 95% [0.86, 0.87] and 0.86 CI 95% [0.85, 0.86] AUC ROC), both outperforming the logistic regression baseline, complete results and metrics on Table 3.
One-year mortality classifier evaluation. Reporting the mean and the 95% confidence interval.
Survival regression
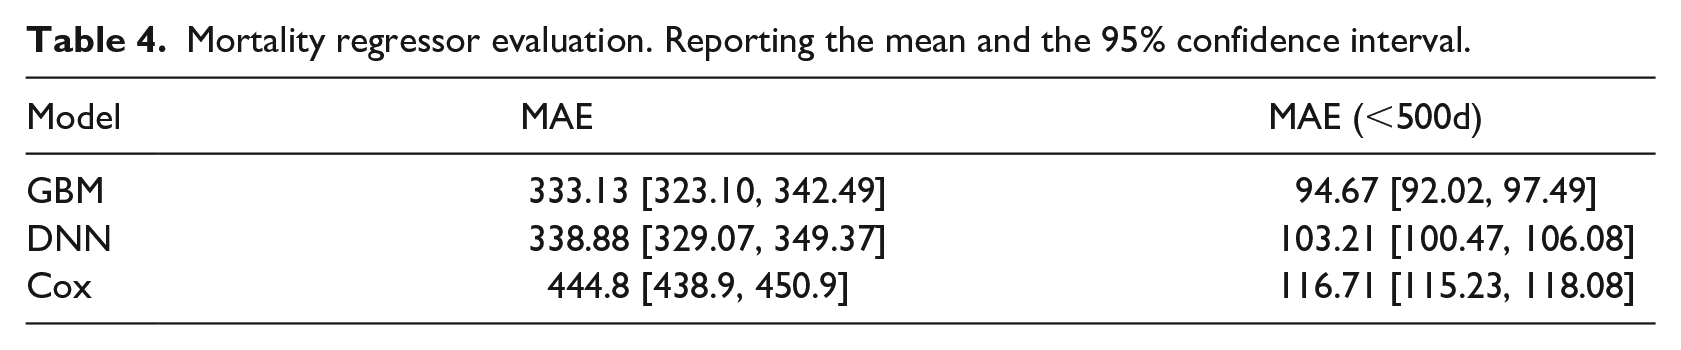
The cox regression produced a MAE of 444.8 days while the GBM and the DNN model achieved an MAE of 333.13 and 338.88 days, respectively. The GBM outperformed the other models when using only samples with survival < 500, complete performance for survival regression models on Table 4.
Mortality regressor evaluation. Reporting the mean and the 95% confidence interval.
One-year frailty classifier
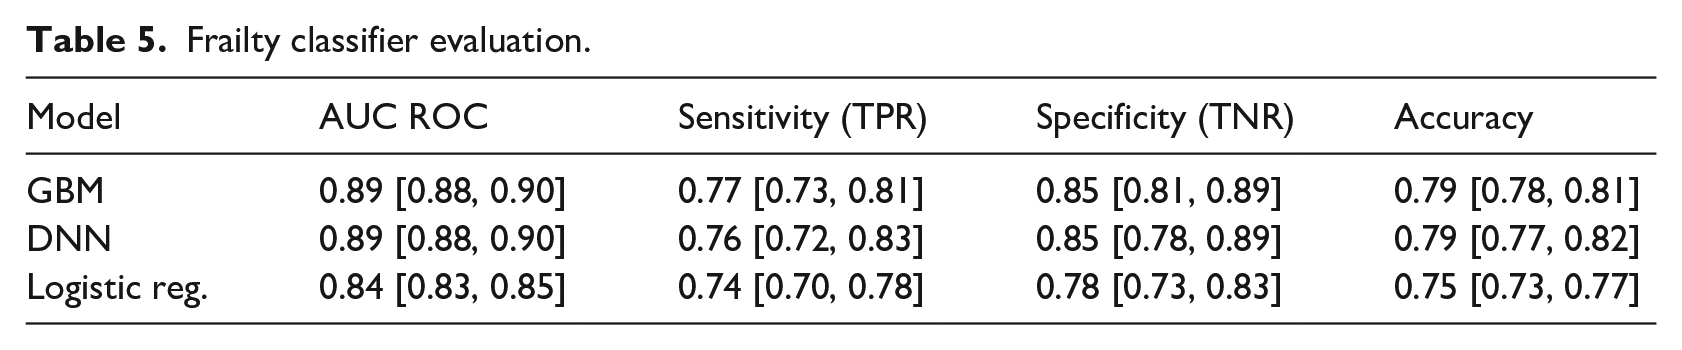
The classification model based on the logistic regression achieved an AUC ROC of 0.84, while the GBM and DNN outperformed it with an AUC ROC of 0.89. Complete metrics for the frailty classification are available in Table 5.
Frailty classifier evaluation.
Gini Importances
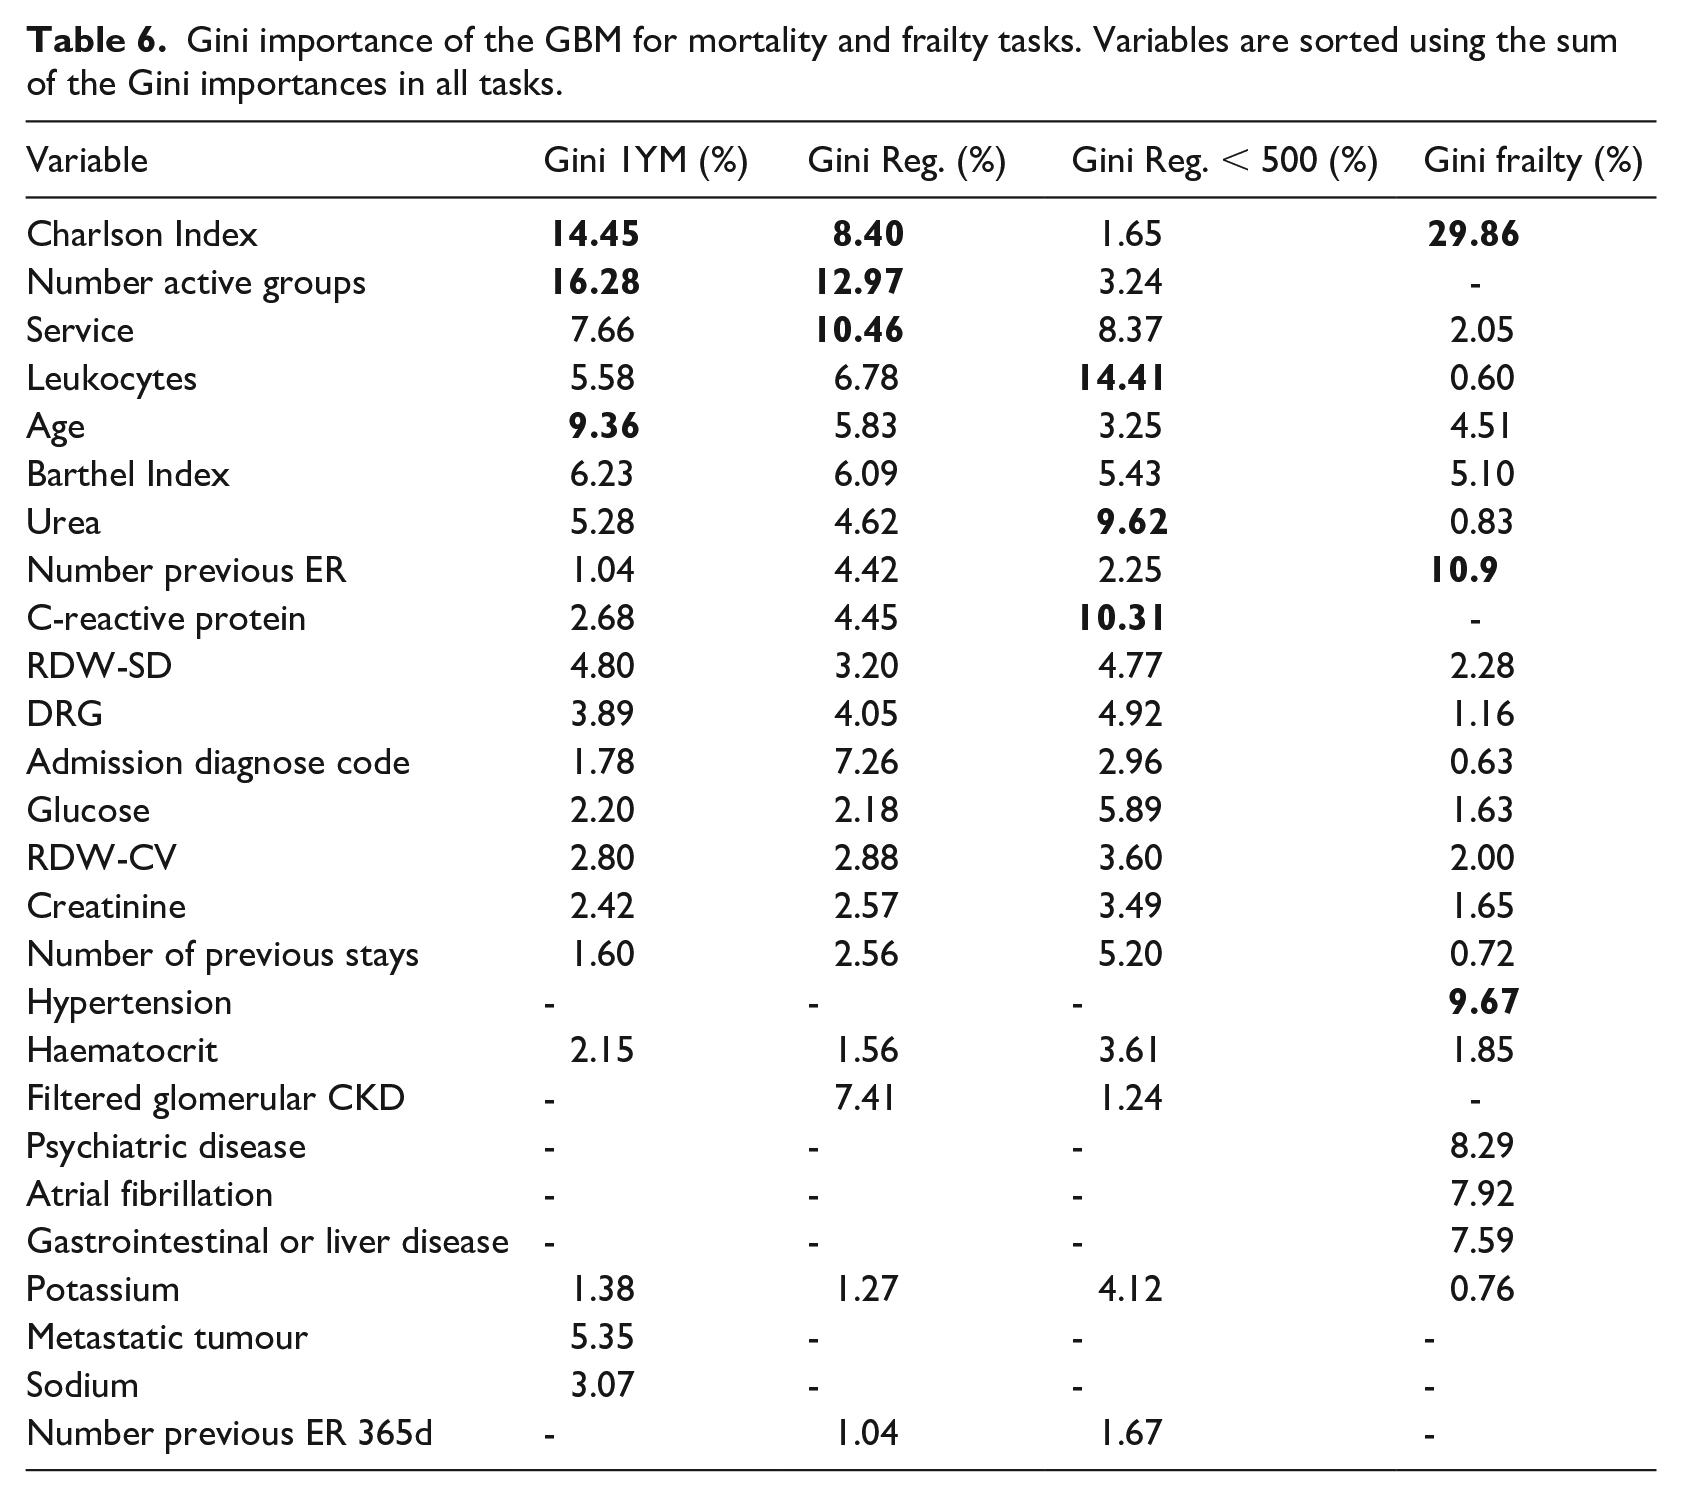
Following the previous methodology, we have calculated the Gini importance for each of the GBM predictive models. For the 1-year mortality model, the most important variables were: Number of Active Groups, Charlson Index and Age. In the regression task: Number of Active Groups, Charlson Index and Service whereas in the model version including only cases with survival < 500 days were: Leukocytes, C-reactive protein and Urea. Finally, the most relevant features in the frailty model were the Charlson Index, Number of previous Emergency Room visits and Hypertension. Complete details are in Table 6.
Gini importance of the GBM for mortality and frailty tasks. Variables are sorted using the sum of the Gini importances in all tasks.
Variables used in the predictive models and their descriptions.
Hyperparameters selected by Optuna. The non-specified hyperparameters have the default value defined in their libraries: scikit-learn v1.0 for the GBM and Pytorch v1.9.1 for the DNN.
Discussion
The overall aim of this study was to develop machine learning models capable of making predictions about mortality and frailty focussed on older adults so that health professionals can benefit from quantitative approaches based on data-driven evidence. We have developed an ML model to predict frailty status within the year without using other problems as proxies. Regarding the mortality criterion, and despite different approximations to this task in the literature, we decided to focus on older patients to be more specific within this age group.
Our 1-year mortality model ranked among the best general admission models in terms of AUC ROC (0.87 CI 95% [0.86, 0.88]). Outperforming PROFUND (0.77), 23 scoring slightly below HOMR (0.89–0.92), 24 mHOMR (0.89) 26 and our previous work. 27 However, the results are in the same range as Avati’s deep learning approach (0.93, 0.87 for admitted only patients). 25 However, our model is not fully comparable since it targeted older adults (⩾ 65 years old); meanwhile, all the mentioned studies use inclusion criteria of ⩾ 18, except Avati, which includes paediatric records. Yourman et al. 56 reviewed prognosis indices for older patients, where the better AUC ROC for the 1-year index was 0.83, which is below our lower 95% CI bound. The authors believe that excluding younger and possibly healthier patients from the sample made the problem more difficult and negatively affected the metrics. This is the case of our previous work27 which used data from the same hospital but reported better results using the whole adult population. As expected, the GBM model performed significantly better than the Logistic Regression counterpart and slightly better than the DNN model.
Our survival regression model scored a MAE of 329.97 days, outperforming the 444.8 days scored by the cox model. Despite obtaining better predictions than one of the most used models when dealing with survival time, a mean error of almost a year does not adequately meet this model’s original purpose. When removing cases where survival time is longer than 500 days, the GBM performs better than the other models achieving a mean error of 94.67 days; this improves the prediction error and will be likely better accepted by the healthcare professionals. This improvement in the predictive power is likely due to removing the long tail in the distribution that includes infrequent values and outliers. It would also be possible to train a model using cases where survival was less than 365 days. In this case, the model would be used only when the 1-year mortality produces a positive result; a preliminary result using the GBM configuration produced an MAE of 69.89 CI 95% [67.83, 72.08]. A further study concerning healthcare experts' preferences is needed to know if this alternative is preferred over the standard approximation.
The 1-year frailty model scored a 0.89 AUC ROC on GBM and DNN, outperforming the logistic regression version (0.84 AUC ROC). These results demonstrate a significant predictive power for assessing a patient’s FI category 1 year from admission. As far as the authors know, this is the first study where a model is used to predict a future frailty status without using proxies such as mortality or disability. These models use variables containing information about the current frailty status combined with other factors such as the previous stays in the emergency room or the age to determine the future frailty status. Since most of the variables are shared with the other two mortality models, the addition of a few extra variables means that we can obtain a prediction regarding the patient’s health decay with a low extra effort.
Each model was set with the 20 most relevant variables from a total of 147, a number that was arguably too high to be used by a human operator. This selection was performed using the Random Forest’s Gini importance criteria with recursive feature elimination as a data-driven method. This method is known to have a favourable bias towards categorical variables with many categories and continuous variables. However, it is widely used because it is fast and straightforward to compute. 46 In the end, all three models share a great number of variables (Table 6), being only 26 different variables. The selected variables by the recursive feature elimination algorithm are coherent with the different mortality works in the literature.23,24 In addition, this final set of variables can be obtained easily a few hours after admission, where the first diagnosis and laboratory tests are performed.
These results provide a complementary perspective based on an objective measure of frailty to initiate early PC. The mean admission FI was 0.27 ± 0.12, and its shape resembles a normal distribution. This is a coherent behaviour with the findings in the Mitnitski et al. study, 14 where the most impaired groups have a bigger FI mean, and the distribution is shaped like a normal distribution, as opposed to the less impaired groups, which had a smaller mean FI and can be approximated using a gamma distribution. The correlation between our admission FI and MR target in days is −0.10, lower than the one reported in ref. 14, which was −0.234. This means that the FI used in this work for this sample is less associated with mortality. However, the Chi-Squared test performed on both binary targets discarded the hypothesis of independence, so in our sample, we can confirm a weak association between both criteria.
The relationship between frailty and mortality have been studied previously, 29 pointing to the association between both. Despite the similarity in the input variables, the target variable distributions are poorly correlated and have different shapes. Both criteria have been highlighted as important for accessing PC in previous studies and are related. However, they reflect two different distributions, and the authors think of them as two complementary criteria. Therefore, we conclude that the best approximation for taking advantage of both mortality and frailty criteria is to have different predictive models working simultaneously, increasing the information to support the decision-making process. The incorporation of the frailty criterion may represent an added value for those health professionals deciding about inclusion in PC services. This is in line with Almagro et al. (2017), 57 showing that poor vital prognosis as the sole criterion for initiating PC among COPD patients should be critically appraised.
This study’s clinical impact resides in the potential to predict adverse outcomes for hospital admitted patients within the following year. First, we choose 1 year as a horizon to make the mortality prediction; as stated elsewhere, 25 longer than 12 months is not desirable due to the difficulty in the predictions and the limited resources of the programmes, which are better to focus on immediate needs. Thus, referral to PC may be focused on immediate needs. Also, despite being more difficult to predict, the information provided by the survival regression model may help contextualise the 1-year mortality model results. Therefore, healthcare professionals would be supported with additional information such as the magnitude of the remaining time until death in days, weeks or months. Including these models into clinical practice could help anticipate the decline in admitted patients, allowing healthcare professionals to allocate scarce resources to patients who will need them the most.
The main contribution of this work is the development of the frailty predictive model, which is a novel approach to try to identify patients in need of ACP. This frailty approach complements the more traditional mortality approach, which we also tried to enrich by adding 1-year mortality classification and regression to provide more information to healthcare experts during the decision-making process without providing excessive extra information burden. The three models were implemented as an online Clinical Decision Support System 58 available to any healthcare expert for academic use until further validations at. 59 Besides, we have demonstrated the complementariness of the mortality and frailty models testing the low correlation between both factors in our dataset, so we should treat them as complementary criteria.
The main limitation of this study is the use of data from only one hospital. Therefore, internal validation only assures the performance of the models with similar data. We cannot ensure the reported efficiency in other hospitals and other patient populations. 60 Also, data from the same centres can change over time for various reasons, such as a change in protocols or external agents such as a pandemic.61,62 Additional external validations are needed for future work. Broader populations can be approached by implementing predictive models using Electronic Health Records (EHR), supporting an effective identification of patients needing further specialised care. 63 Thus, besides external validation of the models, future authors' work will require significant software development and implementation project to connect these systems with hospital EHR and avoid manual input by professionals. Also, the maturity of the models and the software wrapping them needs to be field-tested before their inclusion as a standard tool to the hospital information system.
Conclusion
This work proposes using three different machine learning models based on hospital admission data to assess the PC needs of older adults and help healthcare professionals in the decision-making process. The authors constructed three different but complementary predictive systems: a 1-year mortality model, a regression mortality model to provide more information about the first prediction and a 1-year frailty model. Previous modern mortality models are using machine learning methods available elsewhere, but they are not specifically focused on older populations. Also, to our knowledge, this is the first study predicting 1-year frailty status based on an FI. As previous studies have shown, mortality and frailty could be relevant criteria to admit patients to PC programmes. Therefore, health professionals could benefit from using data-driven accurate predictions of these two dimensions on patients over 65. In addition to the benefits experienced by patients and their families, the early identification of these patients' needs can help better manage the available health and social care resources and reduce costs overall. Consequently, the authors propose using predictions in both mortality and frailty as complementary predictions to help assess PC needs due to its relevance but weak correlation, reliability and great predictive power. The described models have been implemented and publicly available for the academic purpose at. 59
Footnotes
Acknowledgements
The authors thank their contributions to María Soledad Giménez-Campos, María Eugenia Gas-López, María José Caballero Mateos and Bernardo Valdivieso. Special thanks to Ángel Sánchez-García for his contributions to the website.
Declaration of conflicting interests
The author(s) declared no potential conflicts of interest with respect to the research, authorship, and/or publication of this article.
Funding
The author(s) disclosed receipt of the following financial support for the research, authorship, and/or publication of this article: This work was supported by the InAdvance project (H2020-SC1-BHC-2018-2020 No. 825750).
Ethics
The data used in this study comes from the University and Polytechnic La Fe Hospital of Valencia and was retrospectively collected from the Electronic Health Records (EHR) of the hospital. This procedure was assessed and approved by the Ethical Committee of the University and Polytechnic La Fe Hospital of Valencia (registration number: 2019-88-1). Required patient patient-informed consent was waived. All methods were performed in accordance with the relevant guidelines and regulations.