
Abstract
Objective:
Although clinical decision support systems (CDSS) have many benefits for clinical practice, they also have several barriers to their acceptance by professionals. Our objective in this study was to design and validate The Aleph palliative care (PC) CDSS through a user-centred method, considering the predictions of the artificial intelligence (AI) core, usability and user experience (UX).
Methods:
We performed two rounds of individual evaluation sessions with potential users. Each session included a model evaluation, a task test and a usability and UX assessment.
Results:
The machine learning (ML) predictive models outperformed the participants in the three predictive tasks. System Usability Scale (SUS) reported 62.7 ± 14.1 and 65 ± 26.2 on a 100-point rating scale for both rounds, respectively, while User Experience Questionnaire – Short Version (UEQ-S) scores were 1.42 and 1.5 on the −3 to 3 scale.
Conclusions:
The think-aloud method and including the UX dimension helped us to identify most of the workflow implementation issues. The system has good UX hedonic qualities; participants were interested in the tool and responded positively to it. Performance regarding usability was modest but acceptable.
Introduction
Clinical decision support systems (CDSS) are computer systems designed to assist clinicians in their decisions on individual patients when these decisions are actually being made. 1 Interest and research in CDSS are motivated by their potential benefits, which have been documented in the scientific literature: increased patient safety by reducing medical errors or avoiding advice against protocols; improved service quality due to better adherence to guidelines, and increased service time dedicated directly to the patients; cost reduction by faster processing of the demands and avoiding duplicated tests; improved administrative functions by incorporating elements such as automatic documentation; and diagnosis support and workflow improvement.2,3
However, despite CDSS’ multiple virtues, these systems have not been widely adopted in clinical practice.4,5,6,7,8 Several studies have pointed out the main barriers to their adoption, divided into two broad categories: sociocultural factors and usability. The former refers to the beliefs of healthcare professionals (HCPs) or their organization regarding the CDSS, such as the idea of a loss of autonomy, the feeling of being replaced by the system, low computer literacy, lack of trust in the system, failure to fulfil a perceived clinical need, legal uncertainties and a misalignment between human needs and the technical system.9,10,11,12 Liberati et al. 10 proposed several strategies to deal with these barriers according to the physicians’ beliefs about these systems, which are mostly based on communication, training, and highlighting the system's benefits.
Usability barriers refer to the users’ difficulties with the associated software. The most common problems in this category are the difficulty of operating the software, disruption of the workflow, loss of face-to-face time with patients 2 and the alert fatigue due to excessive notifications by the system.12,13 These challenges have previously been addressed by other authors through usability pilots with the potential software end users, mostly HCPs, to identify and correct the different CDSS usability problems.13,14,15,16
Usability studies often follow a general scheme. The participants are exposed to the software in a controlled environment and the session is taped and/or with the researchers taking field notes. The participants must try to accomplish tasks in actual scenarios, which in some studies receive the name of ‘near-live’ simulations. 17 The think-aloud method 18 is commonly used during the whole study. This method consists of asking the participants to express their doubts, opinions and in general any of their thoughts on their experience with the tool. The software usability is finally quantified through a scale or an index, one of the most popular evaluation tools being the System Usability Scale (SUS).19,20
It is generally accepted that a positive user experience (UX) is essential to any software acceptance. 21 Despite the close relationship between usability and UX concepts, there are some differences worth studying, primarily related to the hedonic category, 22 that is, how ‘pleasurable’ the users find it to use the software. UX also studies emotions, beliefs, preferences and perceptions. These concepts directly impact the adoption of a CDSS because they are closely related to the previously mentioned sociocultural barriers. A UX study is thus essential to assess and improve the adoption of the technology.
Another crucial aspect of maximizing the probability of a successful CDSS implementation in clinical practice is the initial design. An interdisciplinary team is highly recommended, including data scientists, programmers, usability and UX experts, HCPs as potential users of the software and other stakeholders such as representatives of hospital management to obtain a clear vision of the requirements.11,23 Planning a pleasant interface is also important since some studies have reported users being more tolerant of minor usability issues if they found the interface visually appealing. This is known as the aesthetic-usability effect. 24
CDSSs are in a very early stage of development in palliative medicine. The study by Tan et al. 25 presents an example of a CDSS specifically developed for PC, designing and implementing a CDS tool aimed at identifying patients in emergency departments that could benefit from primary PC, which demonstrated a very positive usability value. In the context of PC, several tools are designed to support HCPs in detecting patients in need of PC (Maas et al.), 26 but this is still one of the challenges dealt with by HCPs in their clinical routines, especially when they treat patients with non-malignant conditions.27,28 In this line of research, we developed a set of predictive models to assist palliative care (PC) referrals with hospital admission data on older patients using mortality and frailty predictions as the main criteria. 29 The result of that study was a demonstrator for a complete CDSS known as The Aleph PC. Our study reported that these models accurately identified patients with a short survival time who were likely to become frail. Our goal in the present work is to validate The Aleph PC through user-centred techniques 30 to determine how different HCPs with PC experience envision using a PC CDSS in their clinical practice. First, we evaluated The Aleph PC's mortality and frailty models against HCPs’ predictions to obtain a baseline and then we assessed the usability and UX of the system alongside the different insights of the HCPs on how to build a useful PC CDSS.
Materials and methods
The Aleph CDSS platform
The Aleph PC is an open-access machine learning (ML)-based CDSS implemented as a web platform. The application is divided into three main screens: the user introduces the different data required for the PC predictions in the first, including administrative information, Barthel 31 and Charlson 32 indexes, laboratory results and a few diagnostic variables (Figure 1(a)). After completing the form, the results are calculated and displayed on another screen (Figure 1(b)). These results include a numerical result for each model and an ML explainability figure. We used the Shapley value (SHAP) 33 to display a graph with the relation between the input and the prediction obtained. The files section (Figure 1(c)) allows the user to save the current case, load a different case or test the application with predefined test cases. The version tested in this study can be accessed here: https://demoiapc.upv.es/ (last accessed 29 June 2022).

(a) (left-top) Screen in which the user inputs the data, (b) (right) screen showing the results and (c) (left-bottom) screen for managing files with predetermined examples.
Recruitment process
HCPs involved in different aspects of treating patients with bad prognoses and possible end CDSS users were recruited for the study. We focused especially on nurses, primary care physicians, hospitalist physicians, PC consultants and specialists like oncologists, neurologists or pulmonologists. This decision ensured including the different approaches to working with complex patients in need of PC. By means of the Snowball sampling technique, 34 the authors drafted a list of possible participants with not directly connected with the development of The Aleph PC, including clinical partners from the InAdvance Project and other relevant institutions that actively participated in research in the PC field from six different countries: Italy, Brazil, Spain, Greece, Scotland and Portugal. The first volunteers were asked to suggest other colleagues willing to participate until we completed our target sample size. The invitations to participate in the study were sent by email.
Study structure
Participation
The study was defined as an iterative user-centred validation. The participants were invited to individual evaluation sessions in which a team member acted as the session guide. Due to the reactions of the first participants, who asked whether the sessions would be recorded when they were first contacted, it was decided not to record the sessions. We understood this hesitance to be recorded as a possible barrier to recruitment, especially with volunteers that do not belong to our organizations who gave us their valuable time for free, and there is normally no need to review a user test on video since one is mostly interested in finding the major ‘usability catastrophes’. 35 The team was instructed to record the users’ general attitude as well as their reactions, including verbatim quotes that could help to document the ideas discussed in the session. A second member of the team was occasionally present at the evaluation session to take field notes.
The evaluation sessions were by videoconference, in which the participants shared their screens while interacting with Aleph PC Using the think-aloud method. 17 Each session lasted around 1 hour. Their overall structure is shown in Figure 2.

Overview of the structure of the sessions, including three sections and the approximate time spent on each: (1) Brief introduction, (2) Model evaluation and (3) Usability and user experience (UX) test.
We defined two rounds of sessions, separated by a period of 15 days, in which we evaluated the participants’ comments during the sessions, followed by a consensus on how to address each issue and how to adapt the software according to the feedback received. Sixteen participants were invited to the first round and eight different participants to the second. We aimed to carry out more sessions in the first round to detect as many usability problems as possible so we could compare the number and the nature of the identified issues.
Model validation
The model was first evaluated in an unlinked section of The Aleph PC. After introducing some basic information, the participants saw six vignettes consisting of already filled-in, non-editable input forms of actual cases. They were then asked to fill in their own 1-year mortality (1ym) predictions (yes/no), mortality regression (months of interval) and 1-year frailty. All 21 participants were questioned about the same vignettes in the same order in both rounds. There was no time limit and the participants were asked to use any information resource (internet search, books, etc.) they needed to make their own predictions.
The accuracy, sensitivity and specificity 36 of the 1ym and the 1-year frailty (Frailty) models were calculated. Since we asked the participants for their predictions in months to facilitate their responses, we had to transform the output of the regression model from days to months, and so we divided the number of days by 30. As the results of our previous study had found an interval of 4 months, we used the prediction in months ± 2 months as the interval bounds. We then calculated the accuracy of the participants and the model by checking whether the real value of the cases in months belonged to the interval (lower bound < = real value < = higher value).
Usability and UX validation
In the usability and UX section, the participants answered a Google Forms questionnaire (last accessed 21September 2022; shorturl.at/apV23) while they were testing The Aleph PC in a ‘task test’ consisting of four simple tasks and answering a series of questions after each one. The tasks covered all the implemented functionality of the CDSS: (1) input a feasible case, (2) check the results and interpret the graphics, (3) save the current case and (4) load a previously stored case. The questions after each task covered any difficulties experienced, the perception of time spent, the number of errors found by the participant (including unexpected behaviours and any elements they did not understand) and the level of satisfaction obtained by performing the task. All the questions were mandatory.
After the task test, the usability and experience were tested by the SUS questionnaire19,20 and the User Experience Questionnaire – Short Version (UEQ-S) 37 both implemented on the same Google Forms page. The participants were asked to stop sharing their screens upon the completion of both tests.
Results
Participation
Fifteen of the 16 initial participants agreed to participate (93.75%) and 6 of the 8 initially invited to the second round responded positively (75%). We settled on six respondents for the second round, due to the difficulty of finding participants and the fact that, according to Nielsen, 38 we already had enough participants to detect most of the usability problems.
The distribution of the participants in both rounds was the following: 15 were physicians with the following roles: 7 general practitioners, 5 hospitalists, 1 PC consultant, 1 oncologist and 1 neurologist. The other 6 were nurses. The distribution between sex was 13 males (61.9%) and 8 females (38.1%), of which 5 were Italian, 4 Brazilian, 4 Spanish, 4 Greek, 2 Scottish and 2 Portuguese.
Model evaluation
The ML models outperformed the HCPs’ predictions in both mortality and frailty (Table 1). The mean width of the intervals provided by the participants in the regression prediction was: a 16.2-month 95% confidence interval (CI) (13.5 to 18.9) against the models’ fixed 4 months.
Summary of the metrics for the participants and the machine learning (ML) models in the three tasks for the six cases evaluated. Mean and 95% confidence intervals (CIs) are reported per participant. ML is deterministic so no variability in the prediction was found.

PC: palliative care; 1ym: 1-year mortality.
Qualitative results
A list of improvements was compiled after each round regarding the qualitative results based on the think-aloud method and the authors’ notes on the participants’ behaviour. The changes were focused on interface details: removal of the diagnosis-related group variable because it could be inferred from the International Classification of Diseases 9th revision (ICD9) code, replacement of the ICD9 codes by their name, improved tooltip descriptions and added reference values for the laboratory variables. Supplementary Table 2 contains the complete log of changes introduced in both rounds. Most of the participants provided feedback on the subset of variables, suggesting other variables they were more familiar with or discarding the existing variables as unimportant or unavailable in their workflow (e.g. ‘Nurses in Portugal don't use lab results, they understand them but they don't work with them’, nurse first round). The feeling towards the CDSS was primarily positive, and the idea of PC identification by ML technology was well received (e.g. ‘I think that having a tool like this in my day-to-day work could help to manage the patients’, nurse second round). Few of the participants felt confused on their first interaction with the software but many said they had learned to use it after the tasks test (e.g. ‘I found the platform easy to use but some inconsistencies need to be improved’, Physician, first round). Participants from hospital settings suggested automatically collecting the diagnosis and laboratory results from the electronic health records (EHR) (e.g. ‘Different labs may have different measurement units, so it will be important to specify them. Also, it would be better if the application could read this information from the EHR’, physician first round), while other participants did not care about complete integration due to the lack of system integration in their respective environments. We found a participant in each round who was sceptical about the use of computers for decision-making and did not believe in the benefits of the technology, rating every aspect of the system very low in the different questionnaires and providing poor opinions of the system through the think-aloud method (e.g. ‘I won’t use a tool like this in my practice. These predictions are useless for me’, physician second round).
Performance of task
Figure 3 shows the distribution of the answers in both rounds. Almost every measured feature increased the percentage of positive feedback during the second round. The most significant improvement was in task four (load a case), in which the perceived difficulty, time spent and satisfaction improved despite the greater number of errors.

Results of the different tasks during the task test. Bars represent the distribution of the responses. A positive response means that the participant found the task: easy, short, with few errors or satisfactory.
Usability
Responses to the 10 SUS item scores were recorded, all items were mandatory so no missing values were present. The first round of the evaluation sessions obtained a mean of 62.7 ± 14.1 while the second round increased its score to 65 ± 26.2. The distribution of the answers for the different items is shown in Figure 4. The adjusted scores were used instead of the raw scores for all items to help with visualization. Round 2 had more positive responses in 6 of the 10 items: ‘I found this unnecessarily complex’, ‘I thought this was easy to use’, ‘I think that I would need the support of a technician to be able to use this’, ‘I would imagine that most people would learn to use this very quickly’, ‘I found this very cumbersome to use’ and ‘I felt very confident using this’. However, the first round obtained a lower score and SD.
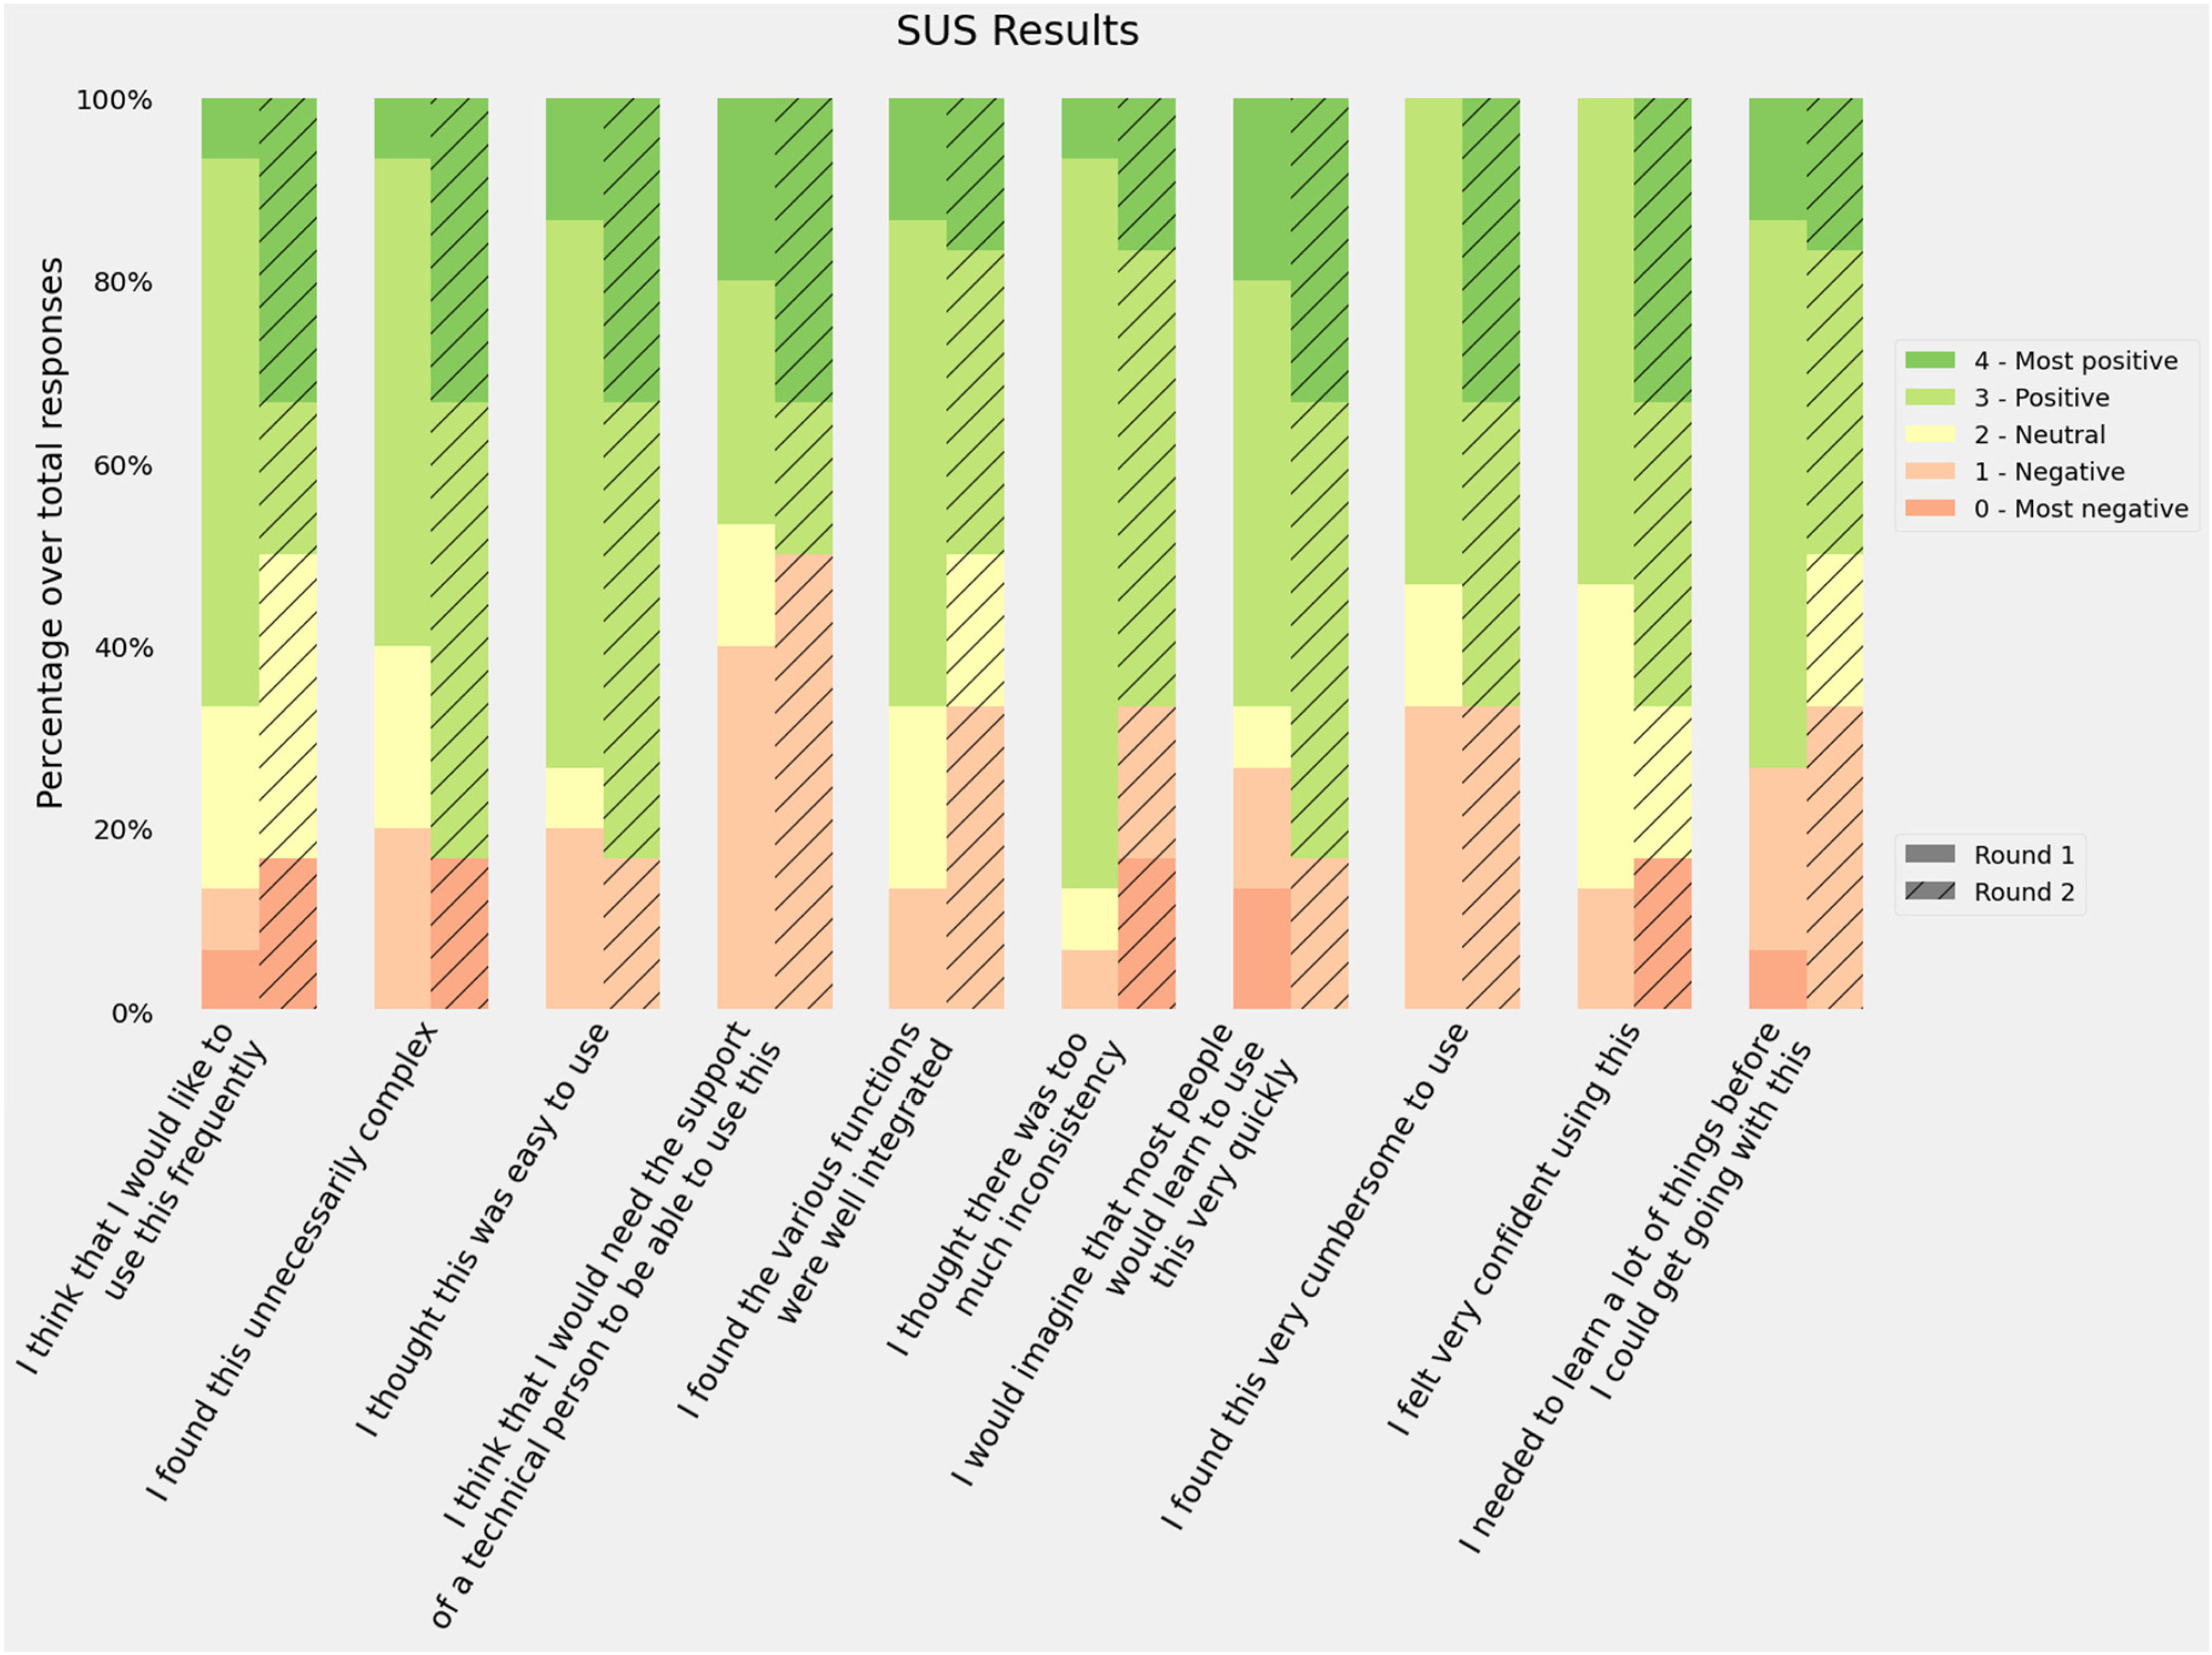
Responses to the System Usability Scale (SUS) questionnaire. Bars represent the distribution of the responses using the adjusted scores: raw scores −1 for items in the odd position and raw scores −5 for items in an even position.
Previous studies have tried to map the intervals of the score into categories such as ‘Poor’, ‘OK’ or ‘Good’ or school grading scales 39 in order to provide a better usability reference. According to these frameworks, our results for both rounds would be classified as D (lowest passing score), the first round as ‘OK - low marginal acceptance’ and the second as ‘OK - high marginal acceptance’. However, if we recalculate the SUS average score excluding the sceptical participants, the average rating would be 63.9 ± 13.8 and 74.5 ± 16.8, which are D ‘OK - High marginal acceptance’ and C ‘Good - Acceptable’.
UX
Answers to the UEQ-S questionnaire were recorded, with all items being mandatory. Figure 5 shows the distribution of the responses for each item in the questionnaire. The median for the second round was always greater than the first round, and the average scores were 1.4 in the first round and 1.5 in the second. The Pragmatic score was slightly higher in the first round (1.3 vs. 1.2) and the hedonic score improved during the second round (1.5 vs. 1.8).

Results of the User Experience Questionnaire (UEQ). Bars represent the distribution of the response. Positive responses mean that the participants agreed with the positive quality of the software (supportive, easy, etc.).
The authors of the UEQ-S provide a benchmark to compare the study results. Although this benchmark is intended for the full-size UEQ, the results may be acceptable for estimating UX. Figure 6 shows the results of both rounds in the three categories and their benchmark score.

User Experience Questionnaire (UEQ) results by categories against the official benchmark. The grade assigned to each category depends on the results of the different studies used to create the benchmark.
Discussion
This study took the form of an iterative user-centred validation of a CDSS aimed to support HCPs in identifying patients in need of PC. The two-round validation process involved decision, usability and UX tests. The predictions provided by the models were found to be more accurate in both sensitivity and specificity metrics for both classification models than those provided by the participants. The regression model accuracy result depended on the width of the interval; we selected 4 months as an acceptable error based on the original reported mean absolute error. 29 Other studies have described clinicians’ poor accuracy when predicting 1ym through mechanisms like the Surprise Question (‘Would I be surprised if this patient died in the next 12 months?’). 40 However, our intention with this comparison was to set a reasonable baseline for the predictive models. There are several factors that work against clinicians’ performance in this evaluation: (1) clinicians are not good at taking decisions based only on EHR data, 41 (2) not having physical access to the patient affects HCPs’ intuition 42 and (3) few cases were evaluated. However, these results indicate that The Aleph PC could help improve the clinical predictions with data.
The results of the task test indicate that the four tasks were not perceived as difficult. Task 4 (load a file in the platform) presented the highest number of negative responses for its difficulty in the first round, but this improved in the second round after we relocated the load button from the input variables section to the files section, as suggested by the participants. The tasks were also perceived as easy to carry out, despite the need to input all the variables manually in the first task. Levels of satisfaction were high, increasing in the last two tasks in the second round after the interface improvement. It is worth mentioning that all the participants in the second round rated the option to store the data in a spreadsheet file positively as they would be able to revisit the case later.
The different SUS dimensions were considered positive (scores 3 and 4) by at least half of the participants in both rounds. The best scores were related to the perceived difficulty: ‘I found the system unnecessarily complex’, ‘I thought the system was easy to use’ and ‘I would imagine that most people would learn to use this system very quickly’. Consistency was also rated among the best (‘I thought there was too much inconsistency in this system’). The worst scores were related to the participants’ confidence (‘I found the system very cumbersome to use’, ‘I felt very confident using the system’ and ‘I think that I would need the support of a technician to be able to use this system’). These results suggest that participants found The Aleph PC easy to use but thought it contained some elements they were not familiar with and/or needed further explanation. The average score was ‘passing’ though there is room for improvement according to participants’ feedback.
The UEQ-S results reported in Figure 5 provide two main interpretations, first, the median UX scores were higher in the second round after the introduction of improvements. Second, most of the dimensions kept their neutral (0) and positive (1, 2, 3) values. Some outlying responses were found, especially in the second round, from the sceptical participants, which mean that their experience with PC CDSS was positive. A further in-depth look into the supportive category is needed to address possible undetected issues.
After analysing the results from the SUS, the UEQ-S and the comments obtained from the think-aloud method, we obtained a wide variety of perceptions of the application. It seems that most of the participants were ready to use a tool like The Aleph PC to obtain prognostic predictions that could influence PC. Even the two participants who expressed their dislike for the CDSS and were sceptical about the tests had their own ideas of how the application should be: while the first-round participants did not feel that the tool was useful, the second-round participants specified ‘The tool is boring. The end-of-life idea should be obtained in 10-15 seconds’. Only a few participants had experience of using CDSS, but all of them understood these kinds of applications as supporting tools instead of as a threat to their autonomy10,43,44 and all of them understood the difficulty of identifying early PC patients, so that they were ready to accept a tool that could help them.
Although the usability results were not as positive as the hedonic quality. Some hypotheses could be extracted from the sessions. Mainly, The Aleph PC did not fit perfectly in its current status to the different participants’ backgrounds. Those from non-hospital environments commented on how some of the variables required by the models did not match with the information managed by their centres. Being unfamiliar with the required inputs could have a detrimental effect on its perceived ease of use. Four of the participants commented on the nature of the data introduced, they considered that introducing historical data in the application instead of a ‘snapshot’ of a given moment could be better predicting. Also, a couple of hospital physicians made suggestions about automating the input and the output and integrating them with the EHR, following the schema of integrative CDSS. 11 These findings are in line with the concept of unremarkable computing,41,45 in which AI systems are meant to be integrated into the current workflow and not to disturb or overwork HCPs.
As stated in other works on validation, usability is a key factor in the success of CDSS implementation. Usability tests based on task performance are sometimes described as ‘near-live’ simulations, and the subsequent usability assessment is the standard used to discover usability issues and improve the final product.13,46 Nonetheless, developing a perfectly usable application does not guarantee its practical success, since there is a list of sociocultural barriers to adopting these technologies 10 which are directly related to physicians’ vision and opinions and their organizations regarding these products.
Including the UX test in the evaluation sessions allowed us to detect the participants’ acceptance of Aleph and the general idea of using a CDSS in daily clinical routines. Despite the participants’ diversity of backgrounds, they agreed on the tool's usefulness. Also, with two exceptions, the whole set of participants believed in the technology and the evidence behind the predictive models. This is especially relevant since trust has been detected as one of the main issues in CDSS acceptance. 10 Based on our sample, we could argue that a CDSS able to deal with PC decisions will probably overcome the social barrier of HCPs’ interest in the technology, although there are still crucial factors to be solved, such as the interest in the CDSS by the organization and the HPs’ trust in the systems’ predictions.
Including two rounds meant we could test whether the changes implemented after the first set of sessions influenced usability and UX in the second round. The difference between the overall SUS and UEQ-S scores were not found to be significant by the t-test (p > 0.05). However, we did find an improvement in certain dimensions of the metrics. We could not extract valid comparisons per role due to the sample size restrictions, since most of the nurses took part in the second round, and most of the physicians in the first round. However, these were not homogeneous groups and contained HCPs working in hospitals, primary care centres, external services and rural environments. We could have set more iteration to ensure that the minimum number of issues was kept in the software. However, the changes identified during the second round were either details such as the use of abbreviations and acronyms or barriers derived from the data source from which the models were created. We, therefore, considered that most of the fixable issues were identified and that we did not need to perform any extra iteration.
The participation of professionals with different roles and backgrounds showed us the diverse needs in highly heterogeneous PC implementation and workflows. There are significant differences between inpatient and outpatient settings, 47 medical specialities48,49,50 and urban or rural environments. 51 In these different contexts, physicians and nurses play different roles in identifying PC needs. For example, in the work by Zemplènyi et al., 52 the authors describe how nurses are the first to detect the needs and then the cases are discussed with the physicians. This may be different in other settings, such as rural areas, where physicians visit older patients. In our study, we found that participants working in non-hospital environments were more concerned about the availability of the variables, especially the laboratory results. Despite the possible barriers to using the tool in its current version, physicians and nurses thought they could benefit from a PC CDSS such as Aleph to identify patients in need of PC.
Including ML explainability in the system was another relevant detail in our implementation (Figure 1(b)). This could be defined as the human quality of understanding the relationship between the system input and the predictions 53 and has been proposed many times as a solution to one of the most common CDSS adoption barriers, as stated by Shortliffe and Sepúlveda ‘black boxes are unacceptable’. 54 CDSSs should be transparent to the user to allow them to accept or dismiss the prediction or recommendation. However, recent studies have highlighted possible problems when trying to create explainability mechanisms for single predictions. In their view, Ghassemi et al. 55 discourage their implementation as patient-level systems. Since we received a positive feedback from the participants on this feature, we decided not to remove the explainability graphs after the second round. However, we do recognize the need for further study of these types of features and their impact on the clinical workflow.
Throughout this project, our team has followed the design recommendations of previous studies,10,12,13,14,15,16 focusing on two main aspects: team composition and interface design. The team includes multiple roles: physicians, designers, usability and UX experts, ML researchers and programmers. This is especially relevant since a multidisciplinary team can achieve a more complete understanding of the real requisites of the project and mitigate workflow disruptions.11,23 The interface was carefully designed, the layout was implemented focusing on usability and the colours used were extracted from a PC logo previously created by an artist As described in, 24 the aesthetic part of the application has a direct effect on its perceived usability, so that an effort must be made to create a visually attractive application. The scores obtained in the UEQ-S hedonic category reflect the acceptability of the aesthetics, although none of the participants commented explicitly on the visual aspect.
The main strength of our work was that our method helped us to be aware of the different pitfalls that had been pointed out in previous works2,9,10,11,12,13 using the HCPs’ insights. The usability test showed that the system is good enough for the participants. However, specific changes are needed to fit the different contexts in which CDSS is deployed to maximize its usability. The system was thoroughly validated by means of the predictive models evaluated in a previous publication 29 and the estimate of usability and UX in the present study. We created anecdotal evidence to support the UX dimension within the standard usability tests. We also managed to get a diverse sample of participants in terms of roles and countries, providing us with a richer version of health providers’ PC needs in different parts of the world.
However, our work also had some limitations: first, the model was evaluated by a small number of participants, and since ML models are deterministic once trained, the machine side was only assessed in six different cases, although this was not a problem with respect to the accuracy of the predictions since the models had already been evaluated. The second limitation is the requirement of the manual input of hospital admission data because it is disconnected from the EHR. This could be an advantage for primary care physicians working in rural areas but breaks the premise of automating the data collection as much as possible and increases the possibility of human errors. The heterogeneity of the participants’ roles made evaluating the platform's fit to specific conditions more difficult even though it helped us to find errors, it limited us to evaluating its use in specific phases of the clinical workflow. In addition, in this demo, we did not address some problems regarding the temporal variability related to different medical centres data distributions. 56
In future work, we would like to adapt the tool to the different roles and clinical workflows we have identified. A further study focused on the different PC roles and their needs regarding Aleph PC would be needed to provide a perfect fit and improve usability. Further adaptations and validations of the ML models would be needed to ensure the models preserve their predictive power in other populations. We would also need to create a pilot for potential users to incorporate the tools into their daily routines and gather long-term feedback. Further research on ML explainability and reportability is needed to create a transparent and auditable system to improve the acceptance of the technology by helping to avoid legal problems.11,53 A study focused on mortality and frailty prediction accuracy by HCPs may be needed to estimate a fair baseline to improve the predictive models.
Conclusions
Our main findings indicate that the predictive models performed better than the baseline composed of HCPs’ predictions. The system has good UX hedonic qualities, that is, the participants were interested in using the tool and they positively rated the fact of having helped to identify patients with bad prognoses and they did not feel their independence threatened by The Aleph PC. Performance regarding usability was modest but acceptable. Based on the notes obtained from the think-aloud method, the authors hypothesize that the usability scores for the current version are maximized and would only improve if the tool was adapted to the different roles and contexts represented in the participant's sample. We created anecdotal evidence that an iterative user-centred validation, including UX, provides a broader vision to address CDSS acceptance issues. Our objective is thus to advance further in including objective PC criteria.
Supplemental Material
sj-xlsx-1-dhj-10.1177_20552076221150735 - Supplemental material for User-centred design of a clinical decision support system for palliative care: Insights from healthcare professionals
Supplemental material, sj-xlsx-1-dhj-10.1177_20552076221150735 for User-centred design of a clinical decision support system for palliative care: Insights from healthcare professionals by Vicent Blanes-Selva, Sabina Asensio-Cuesta, Ascensión Doñate-Martínez, Felipe Pereira Mesquita and Juan M. García-Gómez in Digital Health
Footnotes
Acknowledgements
The authors would like to thank Dr Michael Doumas and Henrique Silva during the recruitment. Special thanks to Dr Gordon Linklater for his contributions.
Contributorship
V.B.S, S.A.C and ADM designed the evaluation sessions. V.B.S, S.A.C and F. P. M performed the evaluation interviews. V.B.S, ADM and J.M.G.G drafted the manuscript. S.A.C, ADM, F.P.M and J.M.G.G. performed a critical review of the manuscript.
Data availability statement
The data that support the findings of this study are available from the corresponding author, V.B.S, upon reasonable request.
Declaration of conflicting interests
The authors declared no potential conflicts of interest with respect to the research, authorship, and/or publication of this article.
Ethical approval and consent to participate
This study was assessed and approved by the Ethical Committee of the University and Polytechnic La Fe Hospital of Valencia (registration number: 2019-88-1).
Funding
The authors disclosed receipt of the following financial support for the research, authorship, and/or publication of this article: This work was supported by the InAdvance project (H2020-SC1-BHC-2018–2020 grant number 825750) and the CANCERLESS project (H2020-SC1-2020-Single-Stage-RTD grant number 965351), both funded by the European Union's Horizon 2020 research and innovation programme. Also, it was partially supported by the ALBATROSS project (National Plan for Scientific and Technical Research and Innovation 2017–2020, grant number PID2019-104978RB-I00)
Guarantor
V.B.S.
Supplemental material
Supplemental material for this article is available online.
References
Supplementary Material
Please find the following supplemental material available below.
For Open Access articles published under a Creative Commons License, all supplemental material carries the same license as the article it is associated with.
For non-Open Access articles published, all supplemental material carries a non-exclusive license, and permission requests for re-use of supplemental material or any part of supplemental material shall be sent directly to the copyright owner as specified in the copyright notice associated with the article.