
Abstract
Cancer is one of the most important and common public health problems on Earth that can occur in many different types. Treatments and precautions are aimed at minimizing the deaths caused by cancer; however, incidence rates continue to rise. Thus, it is important to analyze and estimate incidence rates to support the determination of more effective precautions. In this research, 2018 Cancer Datasheet of World Health Organization (WHO), is used and all countries on the European Continent are considered to analyze and predict the incidence rates until 2020, for Lung cancer, Breast cancer, Colorectal cancer, Prostate cancer and All types of cancer, which have highest incidence and mortality rates. Each cancer type is trained by six machine learning models namely, Linear Regression, Support Vector Regression, Decision Tree, Long-Short Term Memory neural network, Backpropagation neural network, and Radial Basis Function neural network according to gender types separately. Linear regression and support vector regression outperformed the other models with the
Introduction
The leading cause of abnormal death worldwide is cancer; thus, it is a highly prevalent and significant health problem. 1 Researches have been performed for the early detection and treatment of cancer, mortality rates remain extremely high when compared to other fatal diseases. These rates are obtained by the local registration systems of nations and the World Health Organization for different countries and periods. 2
Even though registration systems for different types of cancer diseases are implemented in different developed countries, the same cannot be assumed for undeveloped countries. Thus, registered rates do not provide exact statistical information, but provide data to form a general opinion about the incidence and mortality rates of different types of cancer all over the world. In 2018, the WHO published a report that provided statistical data on cancer diseases up to 2012. 3 They identified that the total global population was 7,632,819,272 and that 18,078,957 new cancer cases and 9,555,027 deaths had occurred all over the world from 35 different types of cancer.
The highest incidence rates were recorded for Lung, Breast, Colorectal, Prostate, Stomach and Other Cancer types when both genders were considered for all age groups. In the same report, it was identified that the cancer types with the highest mortality rates were Lung Cancer, Colorectal Cancer, Stomach Cancer, Liver Cancer, Breast Cancer, Esophageal Cancer, Pancreatic Cancer, Prostate Cancer and Other cancers. The same report noted that Europe, as a continent, consisted of 22 countries with registration records and a total population of 743,837,100. It was also identified that the number of new cancer cases was 4,229,662 and the number of resultant deaths was 1,943,478 in 2012 across Europe.
The report showed that the incidence rates of Prostate, Lung, Colorectal, Bladder and Kidney Cancers were higher than other cancer types for men and the incidence rates of Breast, Colorectal, Lung, Corpus Uteri and Melanoma were higher than other types for women within all age groups.
To analyze the mortality rates, the initial step involve the analysis of incidence rates of different cancer types. Researchers have performed different studies to predict the incidence and/or mortality rates to overcome the inconsistency of some data and resolve the problem of missing and inadequate registration records. However, making such predictions is a challenging task. Therefore, researchers tend to use Machine Learning (ML) models for the robust prediction of both incidence and mortality rates.
Different cancer types have different incidence rates in various countries and this makes public awareness and precautions research inefficient. The prediction of incidence rates within different countries could provide valuable information in terms of prevalence and public awareness. This would lead to cost savings for financial and human resources that require significant funding. Additionally, prediction results provide information to researchers about the course of events and the effectiveness of precautions taken for particular cancer types. However, it is not easy for such predictions to be performed by human beings than machine learning models because of their execution times, capacity to make connections between data, and uninterrupted operational ability. 4 Therefore, ML models were implemented almost in every field of our lives to help human experts solve problems or make decisions.5–7 In addition, ML and has been used and explored in different fields of health science such as bioinformatics8–11 and particularly in cancer predictions to support cancer researchers and the general public for further precautions and awareness.
Senturk and Senturk 12 conducted research on a database obtained from the UCI Machine Learning Repository using Backpropagation Neural Networks (BPNN) and achieved 77% of accuracy rate in breast cancer classification.
Kourou et al. 13 investigated several models to determine the efficiency of machine learning techniques in cancer prognosis and prediction. They concluded that research has mainly focused on supervised models for the development of predictive algorithms. These investigations suggested that analysis could be faster and more efficient estimations could be made with larger data. They also aimed to obtain the best results by using machine learning techniques by excluding human factors.
Mohammadzadeh et al. 14 used decision trees to predict the mortality rate of gastric cancer patients. They used data from 216 patients and achieved a prediction accuracy of 74%. O’Lorcain et al. 15 implemented Log and log-linear Poisson regression models for the prediction of colorectal cancer. They fit the model using data from the World Health Organization for the period from 1950 to 2002 to predict the mortality rates in Ireland.
Malvezzi et al. 16 used a Linear Regression model to predict cancer mortality rates accross the European Union and six other European countries. Ribes et al. 17 used Bayesian models to predict both incidence and mortality rates in Catalonia up to 2020. They obtained the data from cancer registries in Spain and Catalonia. Alhaj and Maghari 18 considered Random Forest and Rule Induction Algorithms to predict the cancer survivability rates in the Gaza Strip. They concluded that Random Forest achieved more accurate results of 74.6% compared with rule induction algorithms.
Recently, Jung et al. 19 implemented a Jointpoint regression model to predict cancer incidence and mortality rates in Korea for 2019. They used the Korea National Cancer Incidence Database in their research. Malvezzi et al. 20 undertook comprehensive research on prediction studies. Jointpoint regression was implemented to predict lung cancer rates in Europe.
Although these studies have obtained high prediction or classification results, they only considered several cancer types for specific regions and a limited number of ML models. In this research, six ML models are considered to obtain prediction results for the incidence rates of Lung Cancer, Breast Cancer, Prostate Cancer, Colorectal Cancer and All Other Types of Cancers for 22 European countries using the latest dataset published by the WHO. ML models with different training and testing ratios were utilized. Superior models determined by initial experiments were trained to predict the incidence rates of these five types of cancer for 8 years until 2020 to enable researchers to make forward steps and to create a resource for planning cancer-control and social awareness programs for the future. Therefore, the main objective of this research is to examine ML prediction results for European cancer incidence rates and draw links to how society can benefit from more ML insights to form data in creating effective precautions and to distribute funding resources efficiently.
The rest of the paper is organized as follows. Section 2 introduces the materials and methods used in this research and Section 3 presents the obtained results. Discussions will be presented in Section 4 and finally Section 5 concludes the work done in this research.
Materials and methods
This section briefly introduces the basic characteristics of dataset, the considered machine learning models and presents the details of the design of experiments.
Dataset
The data of the European continent were obtained from the World Health Organization 2018 Data sheet 3 (http://ci5.iarc.fr) It includes incidence rates of 29 cancer types for 22 European countries including Austria (with 3 regions), Bulgaria, Belarus, Croatia, Cyprus, Denmark, Estonia, France (with 9 regions), Germany (with 2 regions), Iceland, Ireland, Italy (with 8 regions), Lithuania, Malta, Netherlands, Norway, Poland, Slovakia, Slovenia, Spain (with 9 regions), Switzerland (with 6 regions) and the UK (with 11 regions). Male and female groups are considered separately.
The start dates of the records vary from 1953 to 1998 and most of the records are ended in 2012. The records of only two countries, Italy and Slovakia, were ended in 2010. However, since the majority of the countries started to register cancer incidence records from the beginning of the 1990s, 1993 was selected as the start date of incidence records to minimize the impact of a significant amount of missing values that could affect the accuracy of the prediction results. Therefore, data for 19 years for 22 countries were used, with a total of 418 input data for each cancer type in each experiment.
The number of missing values was reduced by replacing them with the nearest neighbor data imputation technique. Missing years for Italy and Slovakia (2011 and 2012) were replaced by values from 2010. Data normalization was performed by a Minimum-Maximum scaler to normalize data between 0 and 1 for each attribute.
Four cancer types with the highest incidence rates for male and female groups were considered in this research, namely Lung Cancer, Breast Cancer, Prostate Cancer and Colorectal Cancer. In addition to these, the total incidence rates of the remaining 22 cancer types were considered for All Cancer Types.
For countries that had different record regions, to reduce the complexity of the machine learning models, the region that had the maximum incidence rate was selected to represent the whole country.
Evaluation of the obtained results was performed according to two criteria to determine the optimum ML model for future prediction. These criteria are Mean Squared Error (MSE) and
Machine learning models
Several prediction models are possible through machine learning. Some of them are directly related to basic or advanced statistics, while others are associated with the field of neural networks, which tries to simulate human perception, or tree based algorithms etc. Each model has unique principles with several advantages and disadvantages. If there is a non-linear relationship between the data attributes, the performance of statistical methods may be reduced, and this might cause ineffective predictions. However, for linear data types, they can provide optimal results. Neural network models defined as black-boxes because of their internal structures and hidden layers. However, most researchers have concluded that if the number of instances of observed data is huge and non-linear relationships exist between attributes, neural network models can produce superior results compared to other ML models. On the other hand, when there is not a significant number of instances, they fail to produce efficient or accurate results.
For this reason, several comparative studies have been performed to determine superior ML models for prediction problems.22–24 However, researchers have concluded that there is no single model that is superior for all kinds of prediction or classification problems and also different researchers have determined different ML models to be superior in different experiments.
Hashem et al. 22 conducted a research to predict liver fibrosis in chronic hepatitis C patients. They considered particle swarm optimization, decision tree, multi-linear regression and genetic algorithm models in their research. They concluded that the alternating decision tree model was the superior model for the considered task. Mao et al. 23 performed experiments to predict human comfort. They employed support vector regression with a radial basis function kernel, and compared the obtained results with linear regression, forms of ridge regression, support vector regression with linear kernel and multi-layer perceptron. They concluded that SVR with Radial Basis Function kernel achieved the highest prediction results. Kirsal Ever et al. 24 performed large-scale comparative study on four ML models, namely back-propagation neural network, radial-basis function neural network, support vector regression (SVR) with radial basis function kernel and decision tree, for nine different prediction problems. They concluded that the neural network algorithms, achieved higher rates and consistent results than other considered models.
When all these researches are considered, it is evident that researchers tend to implement more than one model for their research needs and generally each research can involve a comparative study between different models.
In this research, we used the six frequently applied models to achieve optimal results, namely, linear regression, decision tree, support vector regression, and three neural network models, long-short term memory, backpropagation and radial-basis function neural networks.
Linear Regression is a basic statistical method that draws a best-fitting regression line through real and predicted points. 25 It is frequently used in prediction problems,16,26–28 especially on datasets that have linear correlation between attributes.
Decision Trees are another supervised and effective kind of algorithm used for both classification and prediction. 29 They form a hierarchical relationship between instances and attributes starting from a root node to decision nodes. A sequence of questions is presented in the form of a tree structure. Leaf nodes indicates the classification or prediction results. 29
Support Vector Regression is a special kind of Support Vector Machines.21,30,31 They are designed to accept real-valued numbers and to perform prediction instead of classification. It is widely and effectively used for prediction problems.32,33
LSTM is a type of recurrent neural network in which the internal structure allows it to remember previous knowledge that is considered for future predictions. It is used extensively for prediction problems.34–36
Backpropagation neural networks are some of the most basic and widely used neural networks for both prediction and classification problems.12,37–39 They form the basis for more advanced researches such as deep learning.
Radial-basis Function neural networks are similar to Backpropagation but use a radial-basis function in a constant single hidden layer to provide effective and efficient results for both classification and prediction researches.4,40,41
Design of experiments
Different training ratios can produce various prediction performances; therefore, the six machine learning models described above were trained by using 60%, 70%, and 80% training ratios to determine the most efficient ratio for future prediction.
During the training of the models, experiments were divided into two groups: Male and Female. Then, all the obtained data were analyzed according to the evaluation criteria, namely the Mean Squared Error (MSE) and
Each machine learning model has its own unique hyper-parameter to increase learning ability and prediction performance. For decision tree, attribute selection criterion was used as the mean squared error which is used for prediction problems. In support vector regression, the most frequently used kernel function, radial basis function was used. After several experiments, parameter values
In the backpropagation neural network, two hidden layers were used with the Sigmoid Activation Function for each of the following experiments. Optimum results were obtained by 500 hidden units in each hidden layer. Maximum iterations were limited to
In the radial basis function neural network, the learning rate was determined as
In LSTM, three hidden layers were added to the architecture to increase the prediction ability of the model. In the output layer, Sigmoid Activation Function was used and maximum iterations was limited to
After determining the optimum models for each cancer type, future prediction was performed by re-training the dataset with the most effective training ratio with estimation performed for the (untrained) next year. The estimated year was added to the dataset and this process was repeated until 2020. Figure 1 demonstrates the block diagram of the future estimation process.
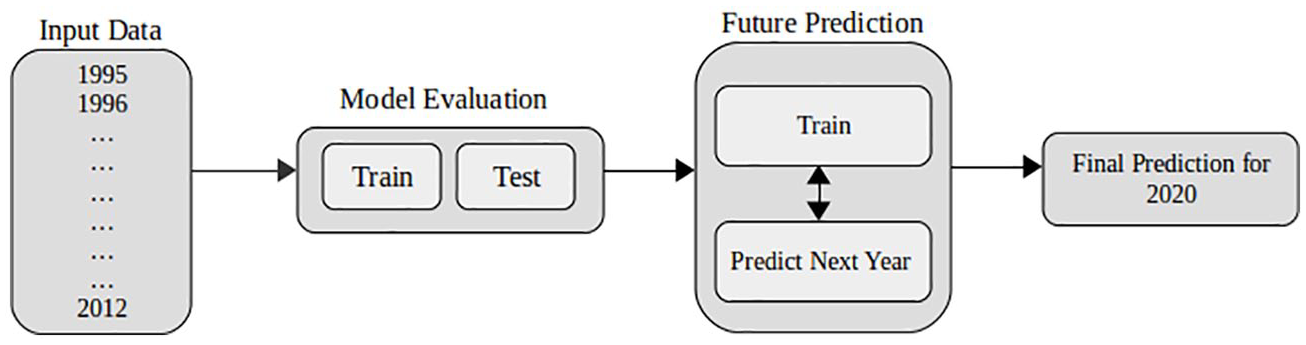
Overview of steps in the prediction approach.
Experimental results
Experimental results are divided into two categories: model evaluation experiments and future estimation results. Model evaluation experiments were performed to analyze the prediction performances of models and then, optimum models were used for future prediction of cancer incidence rates.
The incidence rates that were recorded by registration systems, indirectly include the annual information for population, factors that affect rates, the success of the precautions taken etc. In time-series prediction, all these factors are assumed to have similar distributions in terms of years and this makes it possible to create a relation to future years by machine learning models except for unexpected extreme factors. Therefore, the incidence rate of each corresponding year provides a linear or non-linear relation between the previous and following years. The success of the prediction results was tested on the untrained data (test set), which were the last 5 years for 80% of the training ratio, the last 7 years for 70% of the training ratio and the last 9 years for 60% of the training ratio. The predicted results were compared with actual incidence rates in these test sets and the results were evaluated by two performance evaluation criteria mentioned in the text. While the predicted results of the test years demonstrated the efficiency of optimum models for the prediction of untrained data, estimated years were added to the dataset to fill out the missing years until 2020.
Model evaluation experiments
As indicated above, six models were trained for the prediction of cancer incidences for five different types of cancer with different gender groups for the European countries. In the following subsections, the results will be presented.
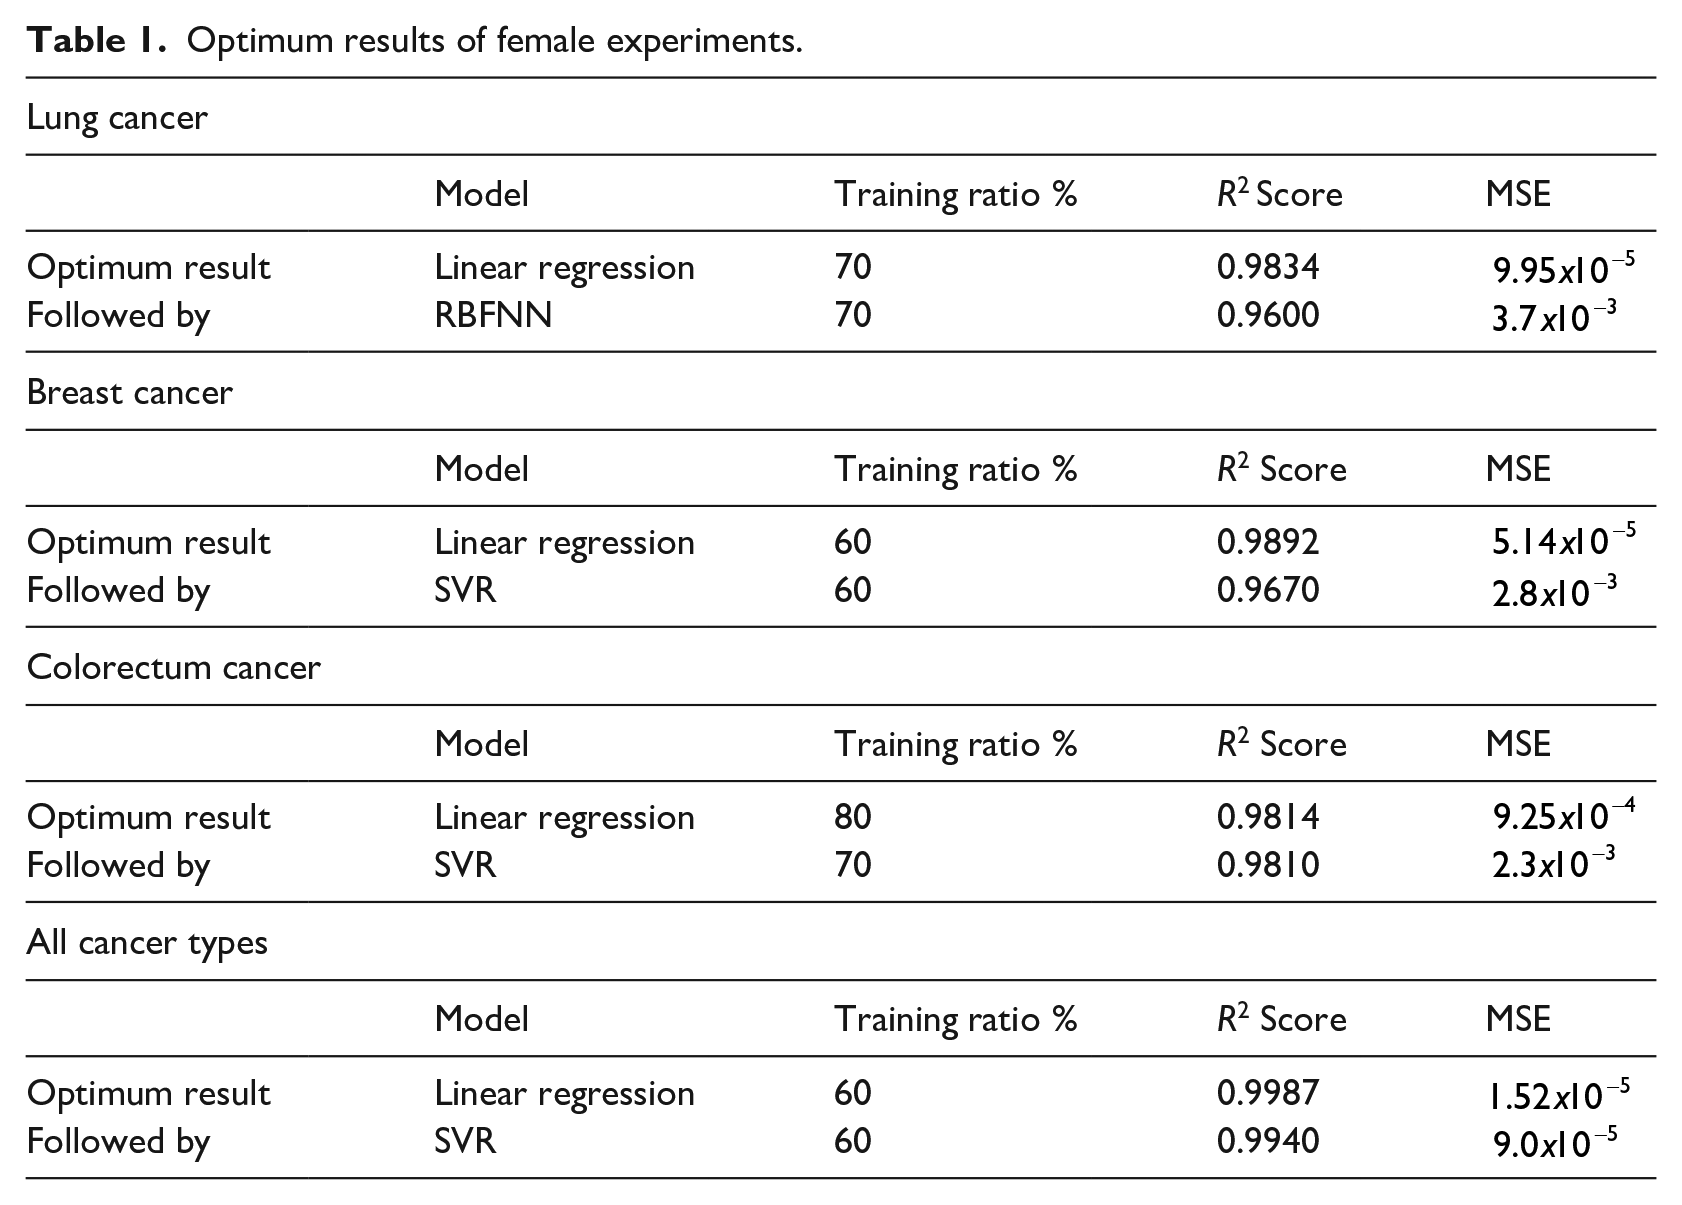
The cancer types considered for the Female group were Lung, Breast, Colorectal and All Cancer Types. In this case, Linear Regression Model outperformed other models in all experiments when
Optimum results of female experiments.
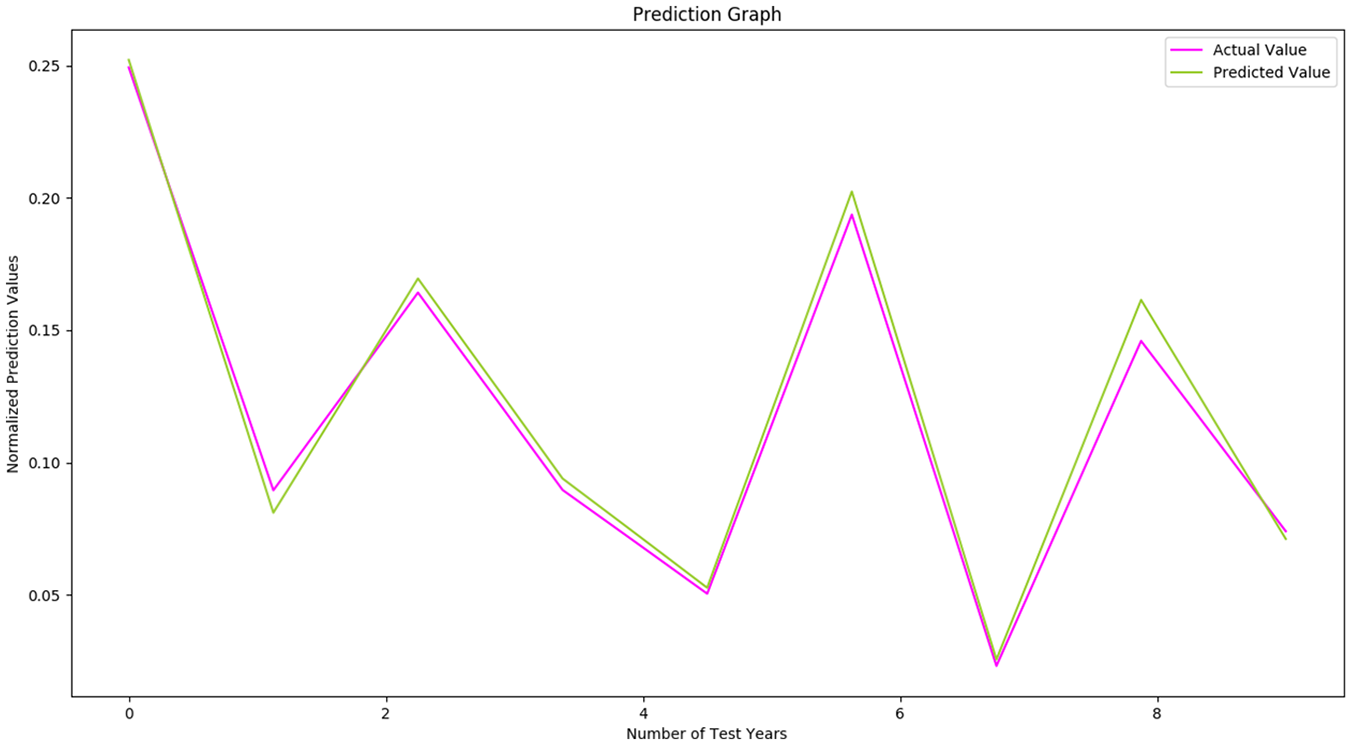
Prediction graph of linear regression model for breast cancer with 60% of training ratio.
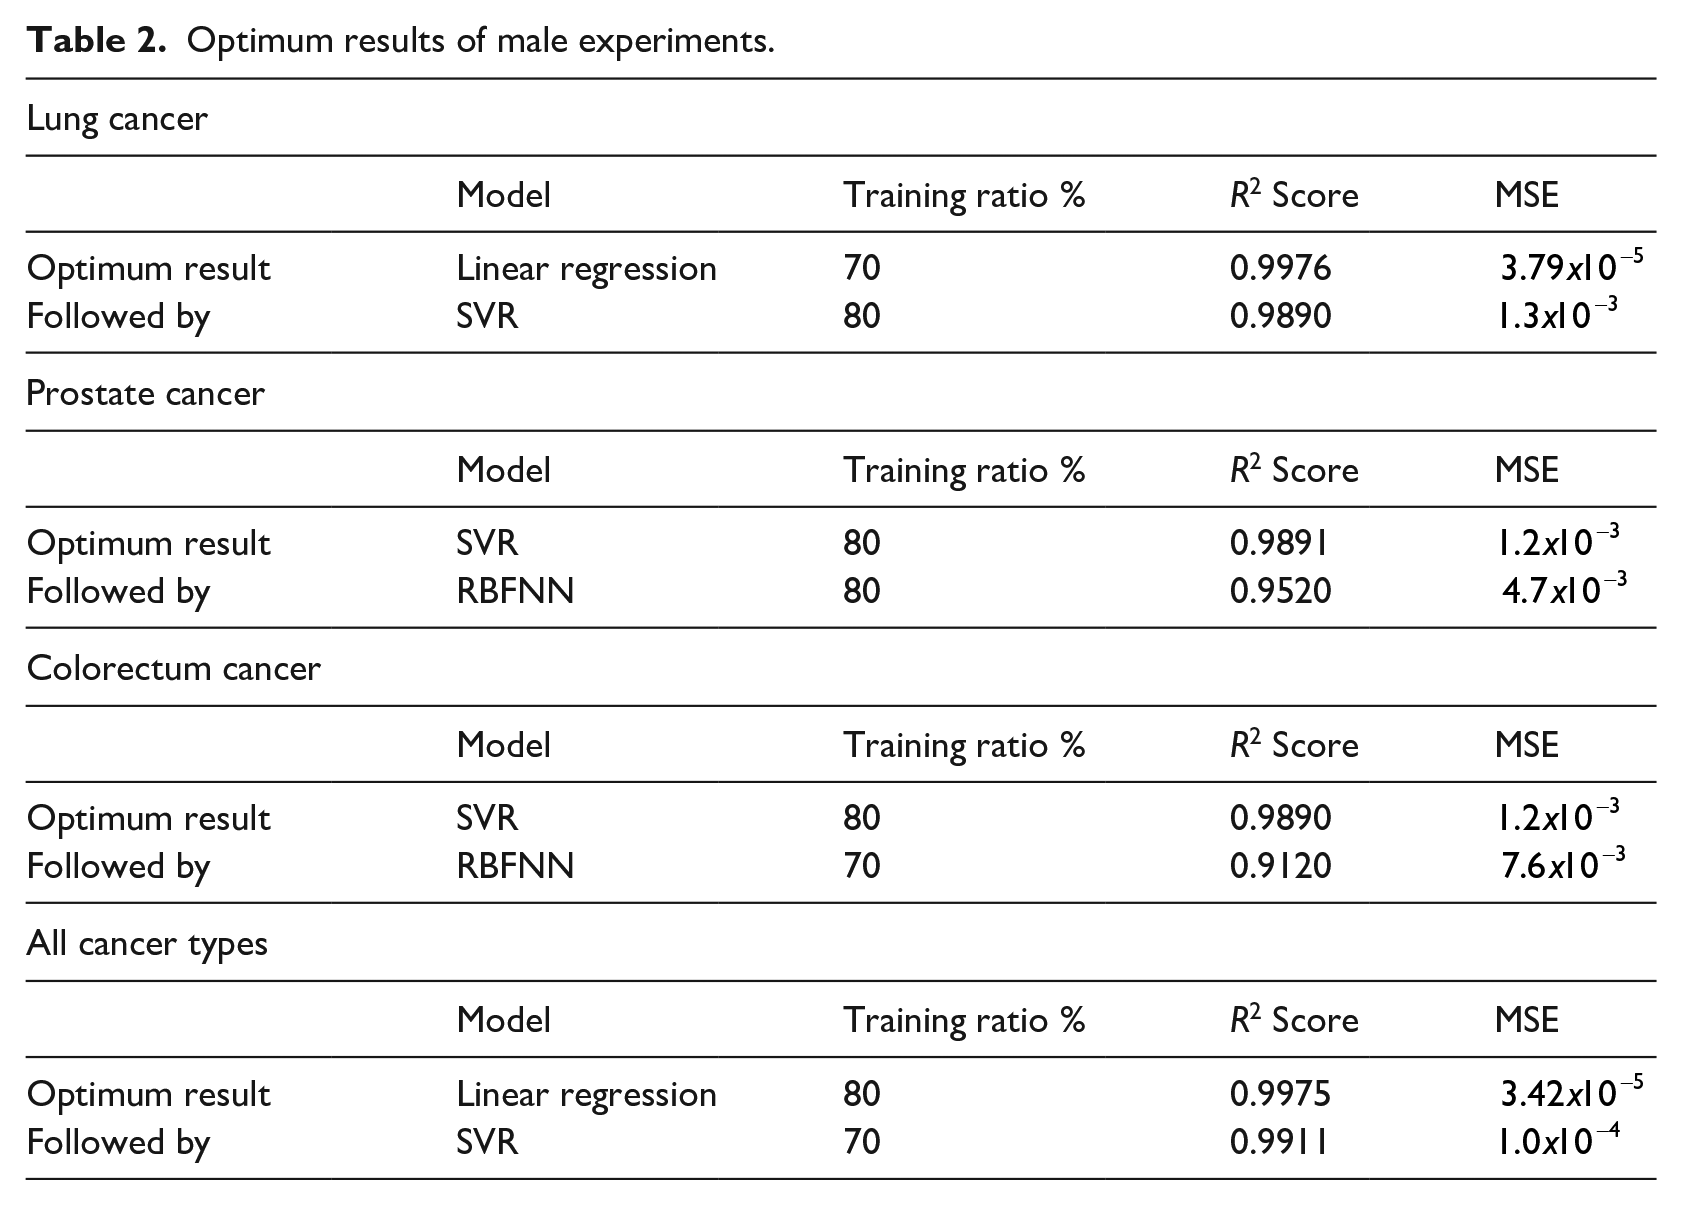
In the Male Group experiments, different results were obtained from the Female Group results. Linear Regression and Support Vector Regression produced superior results in different cancer types. Linear Regression outperformed other models in Lung Cancer and All Cancer Types experiments, however in the rest of the experiments, Support Vector Regression produced more accurate results. Table 2 shows the optimum and closest results of the Male Group experiments and indicates the training ratios that obtained optimum results.
Optimum results of male experiments.
Figures 3 and 4 shows the Prediction Graphs of the Linear Regression and Support Vector Regression for different experiments of the Male Group on test (untrained) years respectively.
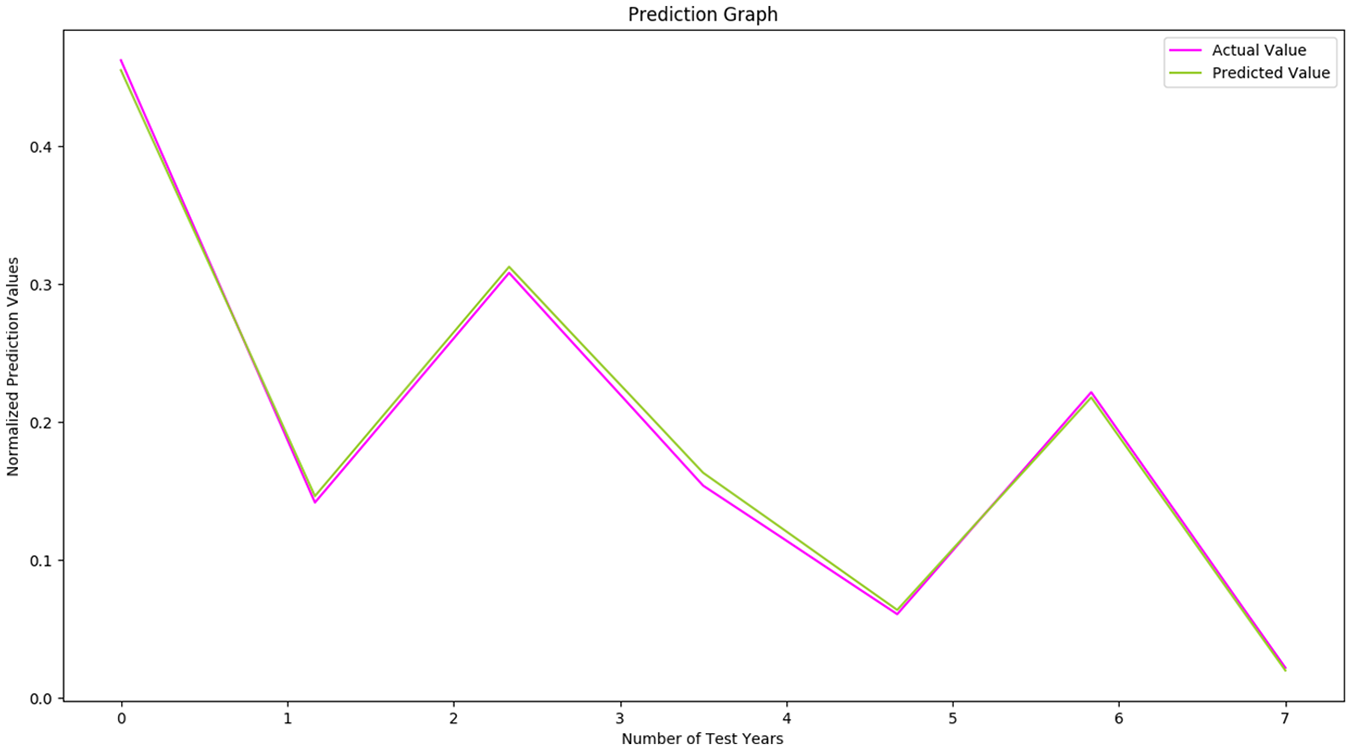
Prediction graph of linear regression model for lung cancer (male) with 70% of training ratio.
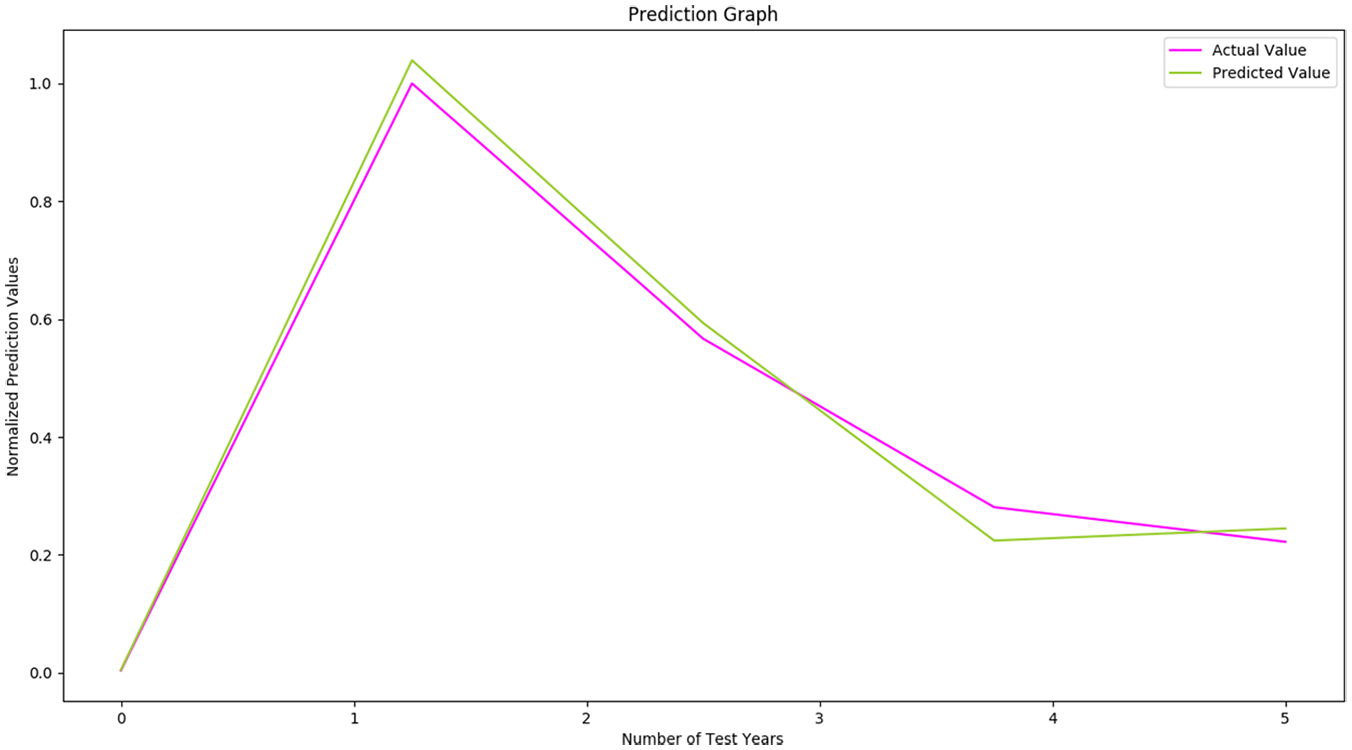
Prediction graph of support vector regression model for prostate cancer with 80% of training ratio.
Future prediction results for lung cancer
Estimation was performed with the Linear Regression Model for both genders. In the Female Group, only Cyprus had increasing incidence rates for Lung Cancer in 2020 with 5.0%. Although all other European countries had decreasing incidence rates, the rates significantly increased between 2015 and 2018, but then the rates decreased below 2012 limits.
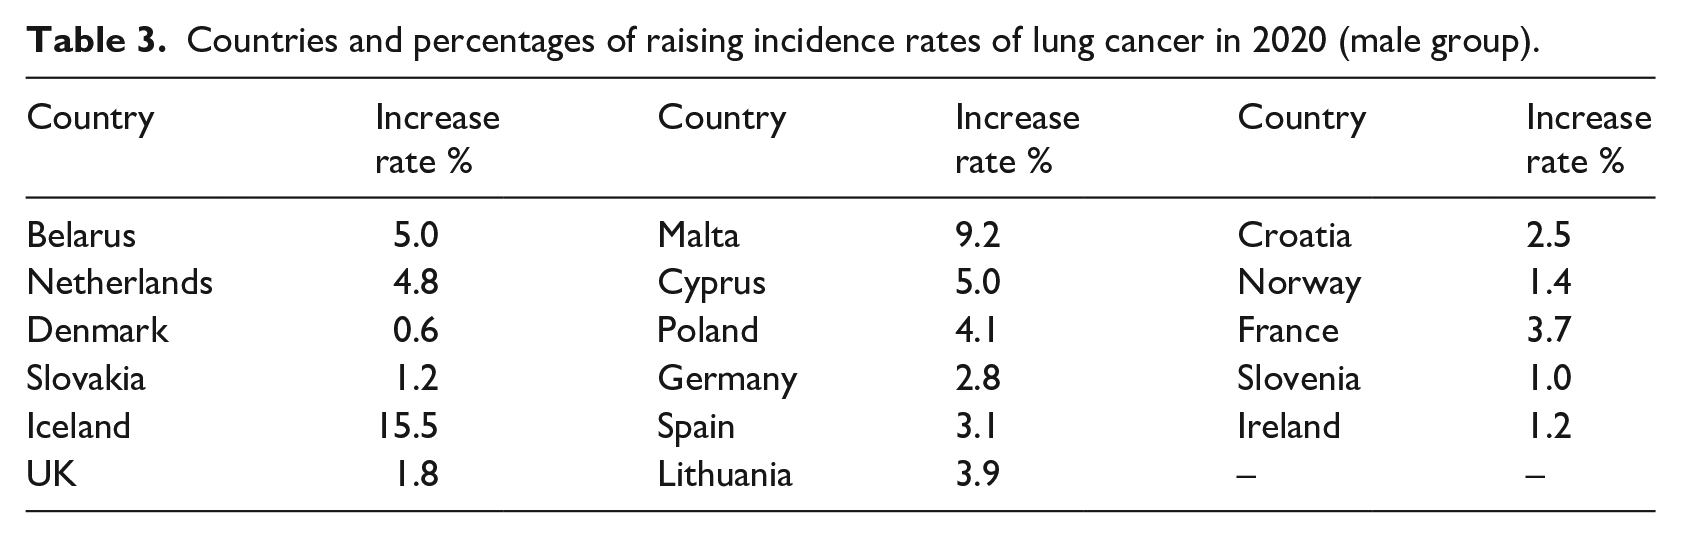
In the Male Group, most of the European countries had increasing incidence rates for Lung Cancer. Only Austria, Bulgaria, Estonia, Italy and Switzerland had decreased incidence rates. Table 3 shows the countries with increasing incidence rates and the corresponding percentages for the Male group.
Countries and percentages of raising incidence rates of lung cancer in 2020 (male group).
Future prediction results for breast cancer
This estimation was performed using the Linear Regression Model. When the incidence rates of 2012 were considered, only two countries, Switzerland and Italy had increasing incidence rates for Breast Cancer in 2020 of 1.0% and 1.8% respectively. However, fluctuations occurred for Austria during the period between 2014 and 2019. While it has a reduction in incidence rates in 2020, an increase starts after 2018. All other countries have stable reductions of incidence rates during this period.
Future prediction results for prostate cancer
This estimation was performed using the Support Vector Regression Model. A general reduction is predicted in all European countries for Prostate Cancer with two exceptions, namely Malta and Spain, which exhibit increases of 7.5% and 3.0% respectively. A decrement is also predicted for Austria with unstable incidence rates predicted between 2014-2018.
Future prediction results for colorectum cancer
This estimation was performed using the Linear Regression Model and the Support Vector Regression Model for Female and Male Groups respectively.
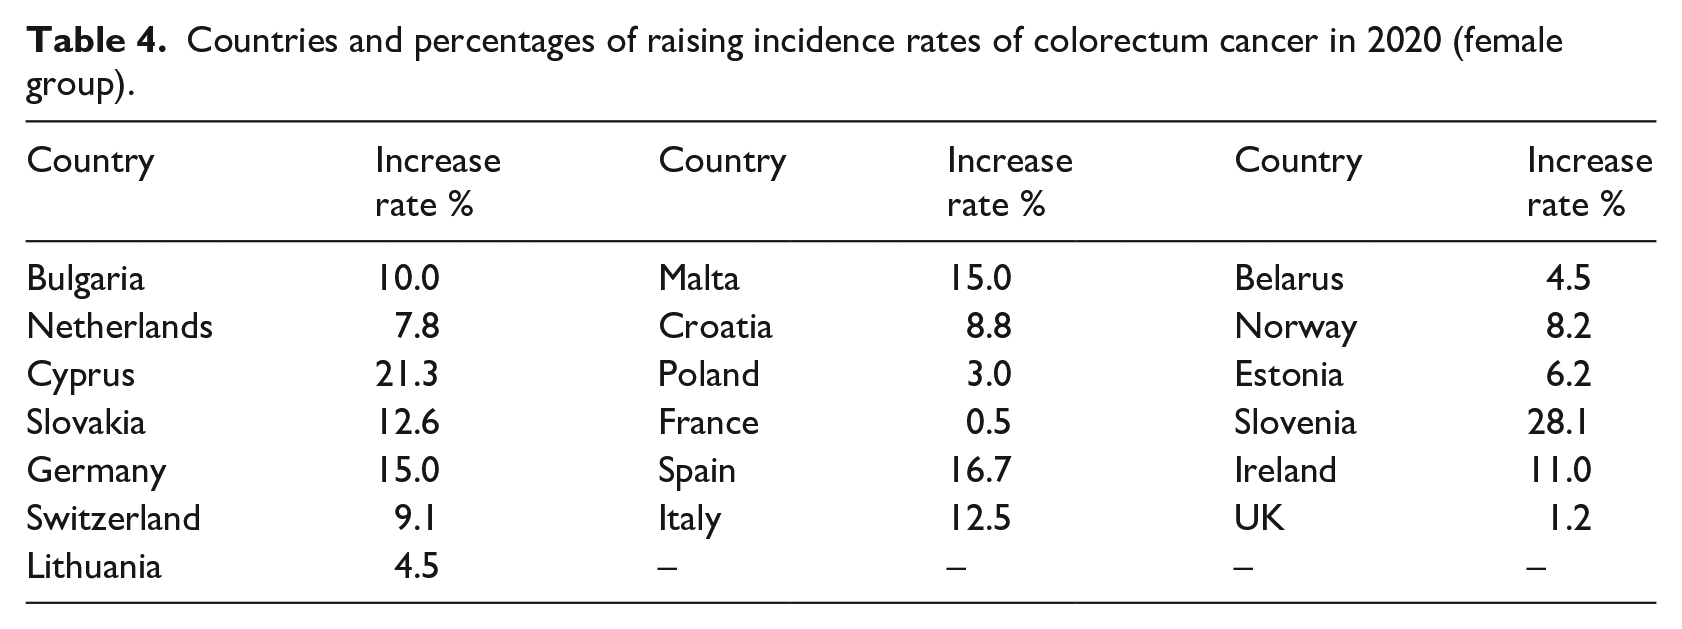
A significant increase was predicted in all European countries for the Colorectal cancer in Female Group. Almost all countries had increasing incidence rates, except for Austria, Denmark and Iceland. Table 4 shows the countries with increasing incidence rates and the corresponding percentages for the Female group for Colorectal Cancer.
Countries and percentages of raising incidence rates of colorectum cancer in 2020 (female group).
Contrary to the Female Group estimation results, decreased incidence rates were estimated for the Male Group for Colorectal Cancer. Only one country, Austria, had increasing incidence rates with a rate of increase of 1.5%.
Future prediction results for all cancer types
This estimation was performed using the Linear Regression Model for both genders. It was estimated that most of the European countries would have a decrease in incidence rates for all cancer types in 2020 for the Female Group. However, Austria, Bulgaria, Belarus, Denmark, Germany, Ireland, Slovenia and Spain will have minor increase rates in 2020. In the Male Group, it was estimated that Austria, Bulgaria, Estonia, France, Italy and Lithuania would have increasing incidence rates for all cancer types in 2020.
However, the change in incidence rates in terms of both increment and decrement, will not exceed 1.0% for either gender in all European countries.
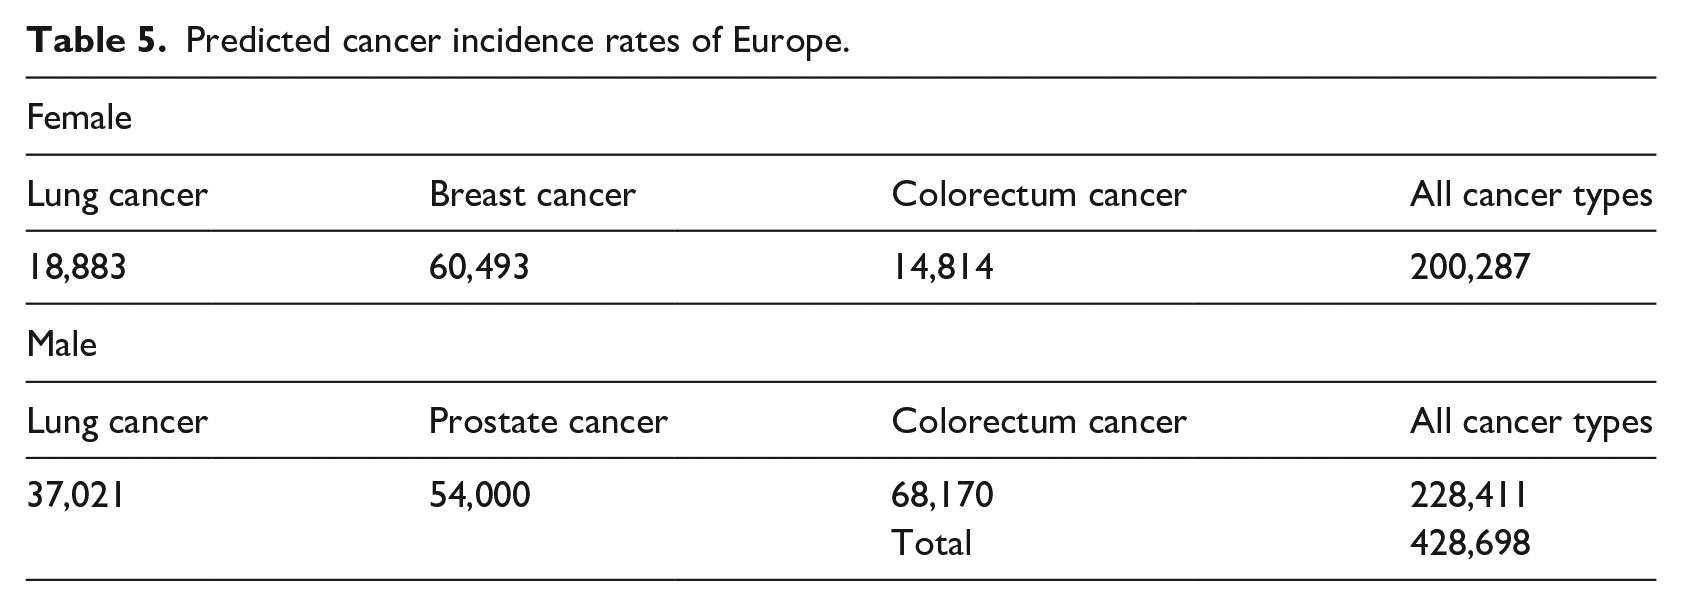
Figures 5 and 6 presents the prediction results for Cyprus (female) and the UK (men) for all considered cancer types respectively. The vertical line in the graphs represents the boundary for the year when the estimation starts. Table 5 presents the predicted total incidence rates (number of persons) for European countries for males and females separately.
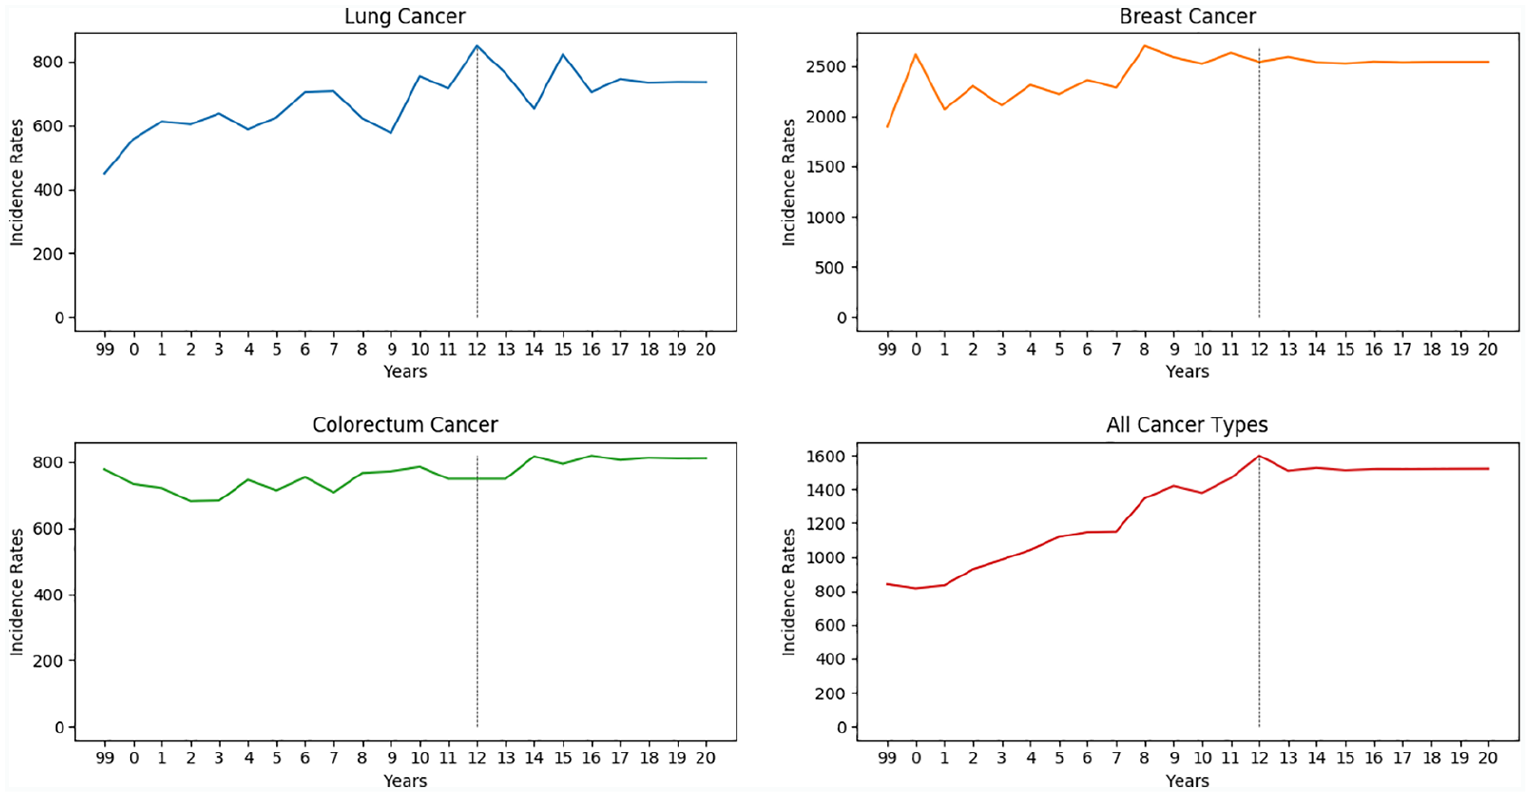
Future estimation graph of Cyprus (female) for all cancer types.
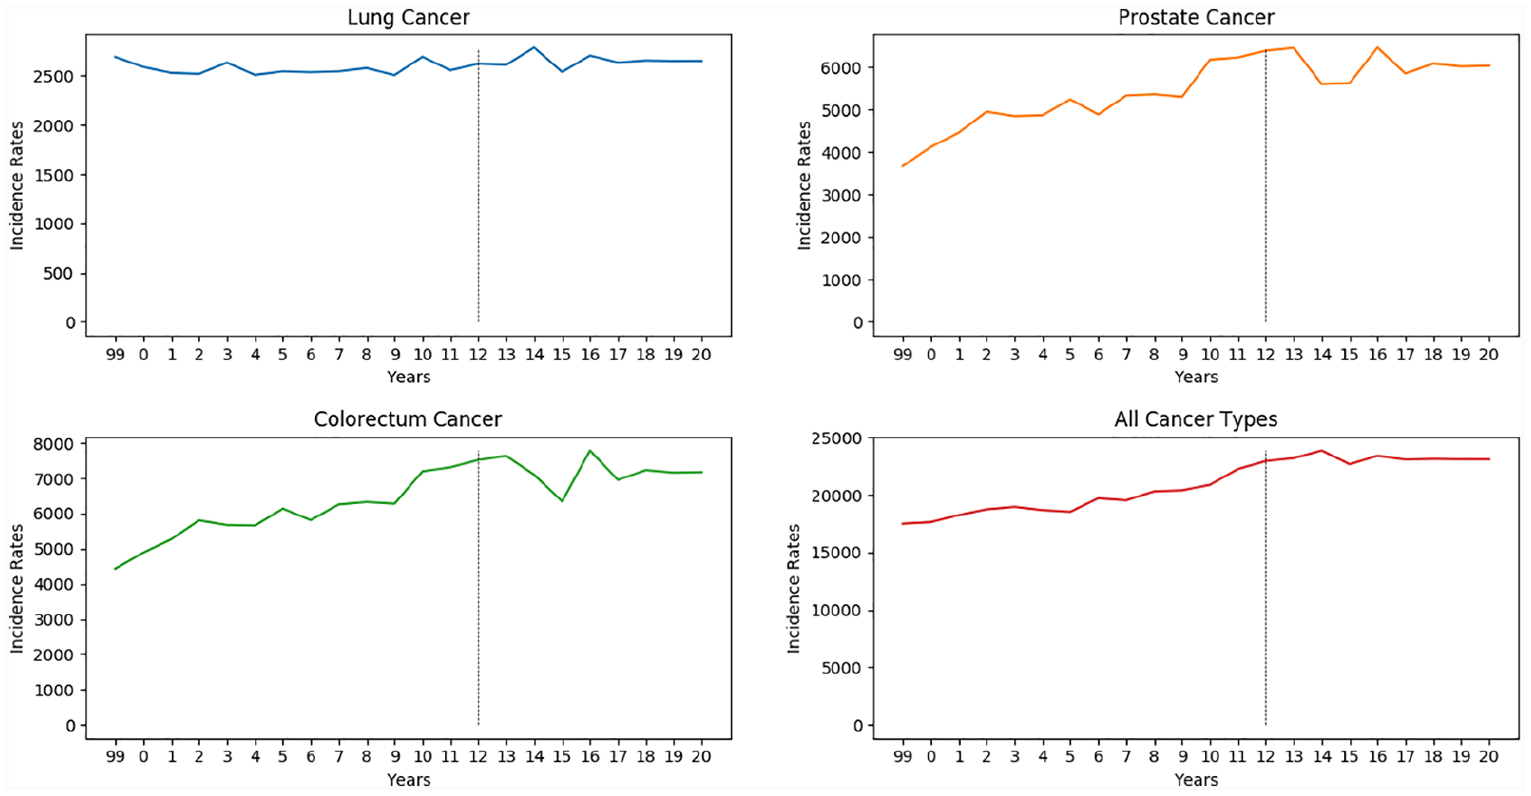
Future estimation graph of UK (male) for all cancer types.
Predicted cancer incidence rates of Europe.
Discussions
The obtained results should be analyzed in two ways: the analysis of machine learning models and the prediction of incidence rates for both genders respectively.
The results show that unstable results occurred in the Female Group experiments except for the Linear Regression Model. A more linear relationship was observed in the Female data between the years and the cancer incidence rates; therefore, the Linear Regression model produced optimum results for all experiments in this group. SVR produced more accurate results in terms of
In the male group experiments, non-linear increment and decrement of rates in some cancer types and countries across the years led to the failure of the Linear Regression model to produce optimum results in some experiments. In these experiments, SVR, LR, and neural-based model RBFNN were found to be superior; however, RBFNN could not produce optimal results in any of the experiments. Similar to the Female Group results, DT minimized the errors but could not provide effective predictions. Although LSTM is considered one of the superior models for prediction tasks, it was not able to make efficient predictions in either the Male and Female Experiments. Generally, it needs large volume of data to minimize errors and to remember previous experiences during the training phase, and to perform efficient predictions.
Another important observation is the training ratios for the produced optimum results for the superior models. In the Female Group, relatively less training ratios were required to produce optimum results. However in the Male group, it was observed that increments in training ratios produced higher prediction results.
After considering the minimum
In the Male group, an increase in incidence rates was only estimated for Lung cancer. For Prostate, Colorectal and All Cancer Types there was a general decrement in the Male Group. Considering the results of all European countries for the Male Group, it was identified that there would be a 1% increment in Lung Cancer and 5.48%, 4.53%, 0.26% decrements in Prostate Cancer, Colorectal Cancer and total cancer cases respectively.
Conclusion
The estimation of cancer incidence rates is vital while it directly associated with mortality rates. In this research, six machine learning algorithms were trained to determine the most effective models to estimate the incidence rates of lung, breast, prostate, colorectal, and total of all cancer types, which have the highest incidence and mortality rates of all 29 cancer types.
Model Evaluation Experiments showed that a single model was not sufficient to estimate all kind of cancer types and data. Therefore, superior models for each cancer type and gender were used for the estimation. Estimation was performed from 2013 to 2020 by performing estimation year by year and the training the superior models again.
Estimated incidence rates showed that, there will be a rise in incidence rates in most European countries in Colorectal cancer for Female while a reduction is estimated for other cancer types. For Males, the incidence rates of the majority of European countries in Lung cancer will rise in 2020 but there will be decrease in other types.
Because of the effects of the treatments and precautions, some decreased and increased rates balanced each other thus, when all cancer types were considered, similar incidence rates were estimated. However, it should be noted that more than 420,000 persons were predicted to have cancer in 2020 in the considered countries and regions of Europe.
These results could be used for increasing awareness of some cancer types and cancer prevention measures especially for Breast Cancer and Lung Cancer for Female and, Prostate Cancer and Colorectal Cancer for Male.
Footnotes
Declaration of conflicting interests
The author(s) declared no potential conflicts of interest with respect to the research, authorship, and/or publication of this article.
Funding
The author(s) received no financial support for the research, authorship, and/or publication of this article.