
Abstract
Patients with Type I Diabetes (T1D) must take insulin injections to prevent the serious long term effects of hyperglycemia. They must also be careful not to inject too much insulin because this could induce (potentially fatal) hypoglycemia. Patients therefore follow a “regimen” that determines how much insulin to inject at each time, based on various measurements. We can produce an effective regimen if we can accurately predict a patient’s future blood glucose (BG) values from his/her current features. This study explores the challenges of predicting future BG by applying a number of machine learning algorithms, as well as various data preprocessing variations (corresponding to 312 [learner, preprocessed-dataset] combinations), to a new T1D dataset that contains 29,601 entries from 47 different patients. Our most accurate predictor, a weighted ensemble of two Gaussian Process Regression models, achieved a (cross-validation)
Introduction
Individuals suffering from Type I diabetes (T1D) are unable to produce insulin, meaning their bodies cannot properly regulate their blood glucose (BG) 1 – that is, cannot maintain their BG between 4 and 8 mmol/L. 2 As a result, T1D is a serious long term condition that can lead to microvascular, macrovascular, neurolgical and metabolic complications.1,2
To manage their diabetes, patients give themselves periodic injections of insulin as directed by their health care team. Injecting too much insulin may induce hypoglycemia (BG < 4 mmol/L, in our study), which can be dangerous, possibly causing a coma. However, injecting too little insulin can result in hyperglycemia ( BG > 8 mmol/L, in our study), which may lead to chronic complications such as blindness, kidney failure, nerve damage and circulatory problems.1,2 In general, a patient’s BG will depend on many factors, including past carbohydrate intake, the amount of bolus/basal insulin injected, exercise, and stress. 2
Diabetes patients try to properly maintain their BG in a normal range. This is challenging because tight glycemic control using bolus insulin injections (whether intermittent with insulin pens or boluses using insulin pumps) is associated with an increased the risk of having hypoglycemic events. 1 This challenge has led to attempts to create closed-loop systems and the use of computational techniques that assist in controlling patient’s BG levels. 3 An extreme example of this is the effort to create an “artificial pancreas”, which explicitly integrates automatic monitoring with automatic administration of insulin. 4
Another perspective on fully automated diabetes management views the BG control problem as two sequential subproblems:
“Modeling”: Learning an accurate BG prediction model that, for example, predicts the BG level at lunch given a description of the subject up until breakfast (including perhaps her previous BG values, carbohydrate intake, etc., from earlier meals), as well as the amount of insulin injected at breakfast.
“Controlling”: Given the current information (at breakfast), consider the effects of injecting various possible amounts of insulin – that is, {1 unit, 1.5 units, 2 units, . . .}. For each, use the learned model to predict the BG value at lunch, then inject the amount that is predicted to lead to the best lunch-time BG-value. (Of course, this assumes that decisions made at breakfast only affect lunch, then lunch decisions will only affect dinner, etc. – which does not consider the longer-range effects of actions; see Bastani. 3 )
This paper focuses on the first subtask: developing a BG prediction system, where in general, a model

Note that this over-simplifies some issues; see Borle 5 for details.
An example of this subtask might be to predict an individual’s blood glucose at lunch on Tuesday at 12:15pm, given information collected up-until 8am breakfast on Tuesday. (Note this might only include the Tuesday breakfast information, or it could include other earlier information – for example, the ellipses in equation (1) might contain information about events from yesterday, or last week).
To be precise, the goal of this work is to to determine if it is possible to accurately predict a T1D patient’s future BG, from one meal to the next, based only on the information typically recorded by the patient. To do this, a model must be able to deal with the features provided in a patient’s diabetes diary, which have varied prediction horizons.
This work is an extensive effort to learn an accurate BG prediction model, which involved exploring 312 different combinations of learner and preprocessing variants. To train and evaluate each of these variants, we used a dataset of 29,601 entries collected from 47 unique patients, where each entry included only the information typically collected, including: the time of day, the patient’s current BG, the carbohydrate about to be consumed and the anticipated exercise. Our results show that, surprisingly, this information is not sufficient to produce models that can make accurate predictions.
Background literature and its limitations
This research deals with long-range (>2 h) predictions of Blood Glucose values, for many (>30) real (not simulated) Type I (not Type II) patients, sampled over a long time range (months to years). While there are many existing works related to modelling Blood Glucose dynamics in T1D patients, these either have limitations in their datasets or design, or do not satisfy our specific goal. A recent literature review identified 49 publications using modeling techniques for blood glucose prediction (primarily with T1D patients) of which 38 used predictions horizons that were 60 min or less. 6 One of these publications did involve prediction horizons of 180 min but only on simulated patients, and another had 1440-min prediction horizons but used a dataset of eight patients collected over only 3 days. 6 Several studies use data from only a single patient, often including records from fewer than 100 days,2,7–9 or include only data from simulated patients.10–12 Other studies include more patients10–15 but only have 3–22 days of data,13–20 or have a few years worth of data but only include three patients. 21 Further studies analyze continuous glucose monitoring (CGM) data from larger patient sets (89 T1D patients) but are again sampled over relatively short periods of time (1 week 22 ). (There are large type-2 diabetes (T2D) datasets (163 patients over 1 year 23 ), but studies modeling T2D24,25 address an easier problem because T2D patients have less variable BG values.)
While we focus on predicting BG values many hours later, some studies instead attempt to predict the occurrence of hypoglycemic events, and only within a short window (e.g. 30–120 min).26–30 One notable study included data collected from 40 patients over the course of 3 years. However, this was a CGM study that collected bursts of data at 3-month intervals and only considered prediction horizons of up to 30 min. 31 While this might help to protect patients from a very serious situation, it is lacking in several ways. First, such fine-grained measurements are often not practically obtainable outside of a study setting and without using a CGM device that provides measurements every 5 min. Second, these short-term predictions are not adequate for spanning the time between meals. Third, the goal of building a diabetes control system is better served with a more expressive model, as opposed to one that can only provide binary classifications – hypoglycemic or not. Note that these model provides no useful feedback for situations where patients are hyperglycemic.
In our work, we try to model blood glucose dynamics (including both hyperglycemia and hypoglycemia), using only the standard records collected at meal times. While this makes our task more challenging, we do this because it involves only the data that medical professionals most often encounter in practice.
Our study will use both many common machine learning algorithms and also some less well-known algorithms that are motivated by the existing literature. These include a model that is similar to the Gaussian Wavelet Neural Network used by Zainuddin et al., 9 and a weighted ensemble of Gaussian Process Regression (GPR) models that are constructed in a way that is similar to Duke, 17 who uses a GPR to learn models of individual patients that could be used to aid in cross-patient prediction.
We will evaluate the quality of our predictions in several ways. Del Favero et al. 32 describes various measures for comparing a patient’s specific glucose reading, with a predicted value, including both standard measures (like L1, relative L1 error, and L2 losses – there called MAD, MARD and RMSE) and some “glucose-specific metrics”, such as gMAD and gRMSE. 33 While our paper focuses on the L1 and relative L1 losses, we also include the others mentioned there.
Main contributions
This works has three main contributions:
To our knowledge, this study examines the largest multi-year dataset of diabetes diary records, collected from Type 1 diabetes patients, used for modeling future BG.
We provide a comprehensive study of this data, considering 312 combinations of learning algorithm, types of features, and categories of records, to determine if machine learning can create an accurate blood glucose prediction model.
Our results demonstrate that it is difficult for any model – whether human or machine-learned – to use this Diabetes Diary data (i.e. the information that patients typically record) to predict that patient’s BG better than a naïve baseline (in this case, predicting a patient’s average BG). This applies when considering both standard error measures, like L1 and L2 loss, and also for glucose-specific measures, such as gMAD.
This work is based on the publicly available MSc thesis, 5 which provides additional information, including a breakdown of the individual patients in the study, more detailed results, and a comparison to a diabetologist’s performance on this prediction task.
Materials and methods
This section first describes our (real world) dataset (pre-processing described in Borle et al.,
34
); it then considers two ways to modify this dataset. In general, the dataset is a set of records, each from a specific patient, where each is described by a set of features – for example, in Table 3, each column is a single record, whose values are described by a set of features (corresponding to the rows). One issue is determining the set of records to include: whether the dataset includes all of the records, from all patients
To each of these
Datasets considered
This study used 47 histories from Type I diabetes patients, which were collected using the “Intelligent Diabetes Management” (IDM) software (described in Ryan et al. 35 ). This data included patients who participated in Ryan et al.’s study, as well as additional patients who began using the IDM software after the completion of the study (up until December 2016). For further details regarding patient participation, see Ryan et al. 35 Some of the participants only used the system a few times. As we wanted to focus on patients that had sufficient information to find relevant patterns, we only included patients who made at least 100 diabetes diary entries with the system – that is, produced at least 100 “sufficient” records. This led to a dataset of 16 pump users and 31 non-pump patients. Table 1 provides summary statistics for our data. The dataset used for this work differs from the one described in Borle 5 in that we limit the number of patients included to those with complete data.
Summary of demographics.
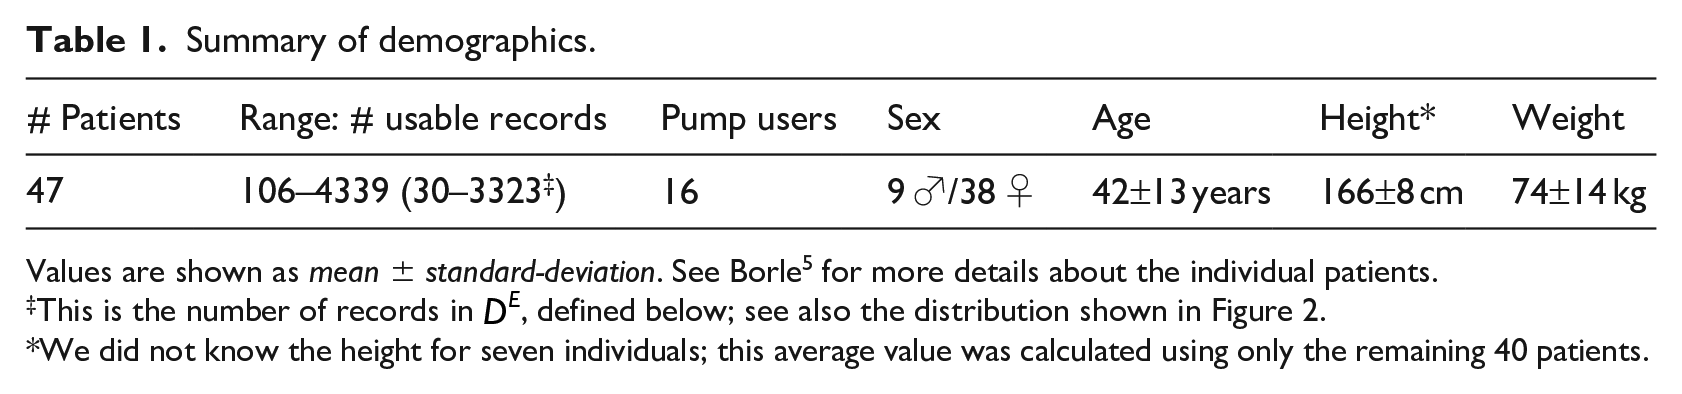
Values are shown as mean ± standard-deviation. See Borle 5 for more details about the individual patients.
This is the number of records in
We did not know the height for seven individuals; this average value was calculated using only the remaining 40 patients.
Patient #16 is noteworthy for having by far the most records of any patient in our dataset; it is unusual for a patient to consistently produce diabetes entries over the course of many years. Because of the large number of records, we use part of this patient’s dataset as our hyper-parameter tuning (validation) dataset, as well as for visualization. Note we then use only the remaining portion of this patient’s records in our experiments, so that there is no overlap with the portion used for tuning the parameters.
Each record
As mentioned above, 16 of the patients in this study used insulin pumps, which each directly infuse insulin from a reservoir, via a catheter, just under a patient’s skin at a basal rate. Moreover, they also self-inject larger amounts of bolus insulin when a patient ingests carbohydrates (as a patient would with an insulin pen [http://www.diabetes.org/living-with-diabetes/treatment-and-care/medication/insulin/how-do-insulin-pumps-work.html]). Each record of each insulin pump patient includes the basal infusion rate value
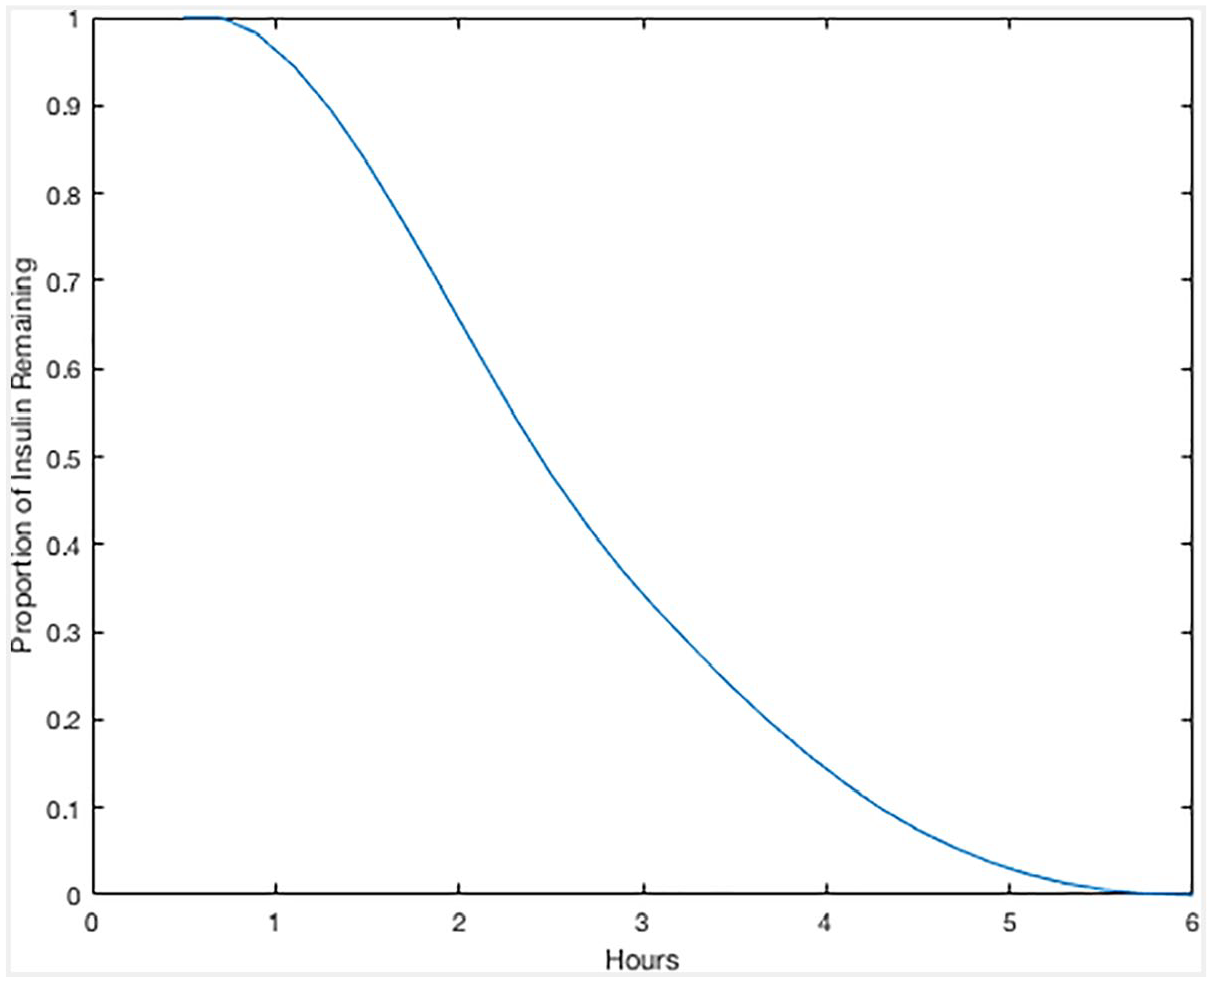
Spline of “insulin on board”, as a function of time.
Description of original features, and some computed features, used in this study.
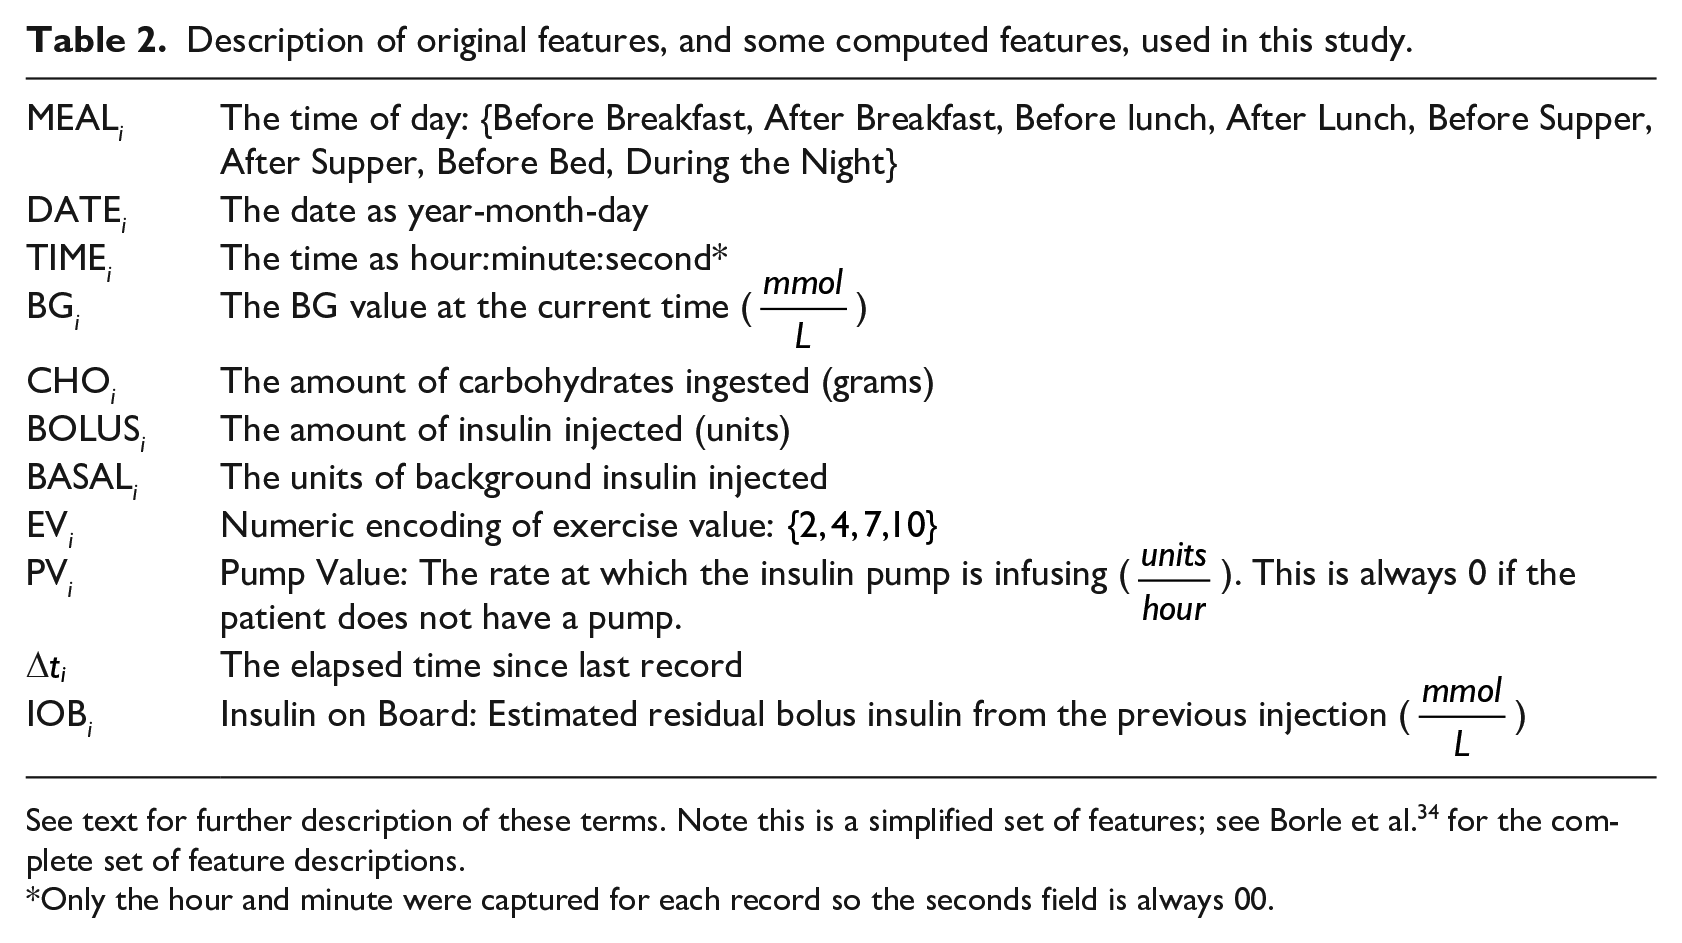
See text for further description of these terms. Note this is a simplified set of features; see Borle et al. 34 for the complete set of feature descriptions.
Only the hour and minute were captured for each record so the seconds field is always 00.
Example of data, over a single day, from patient 16.
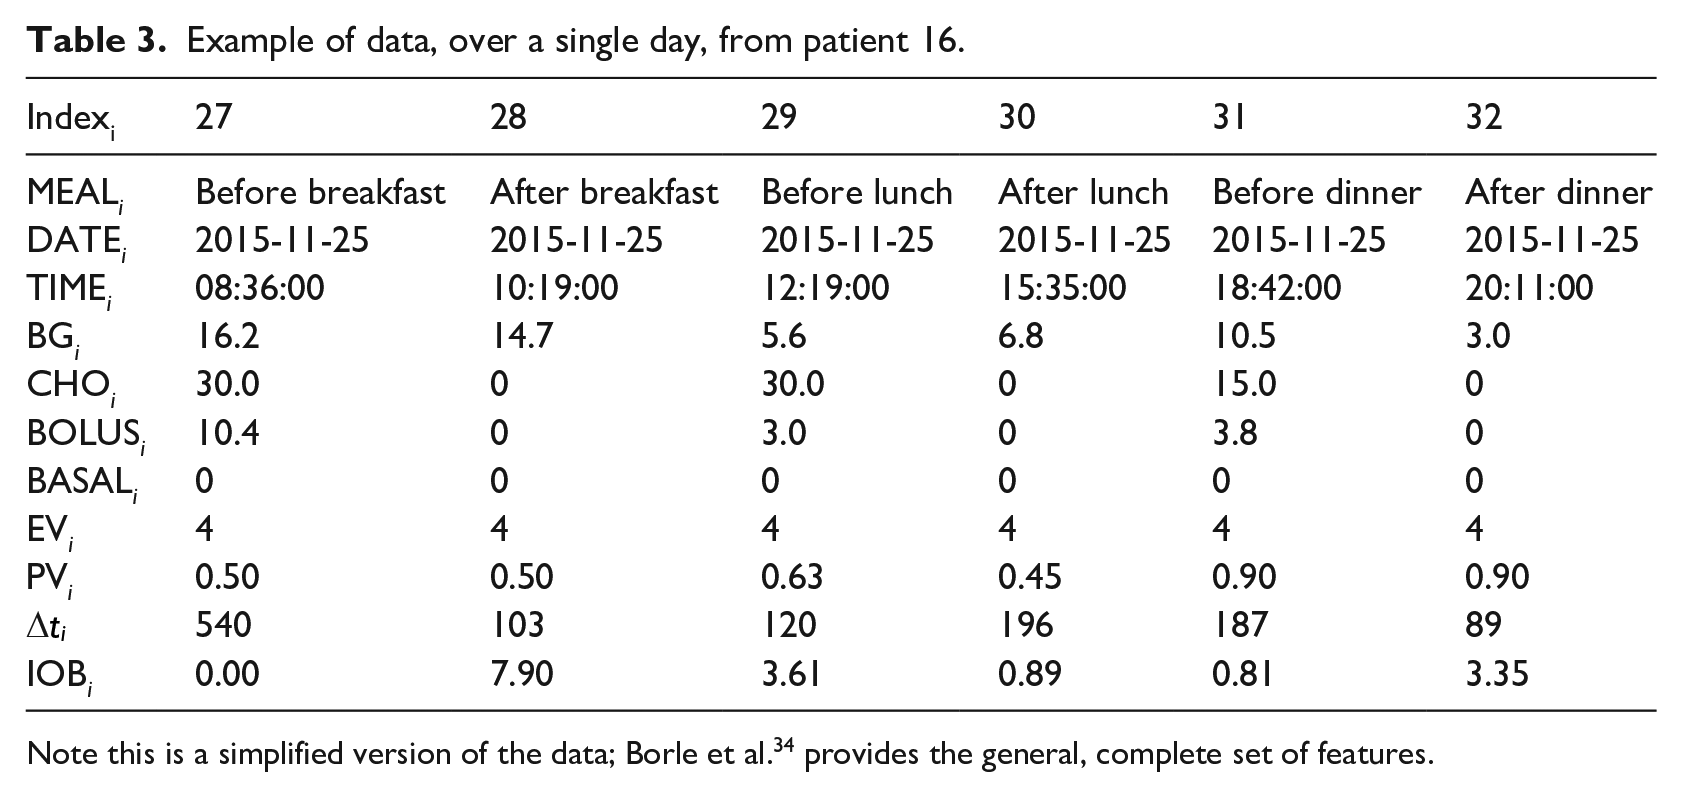
Note this is a simplified version of the data; Borle et al. 34 provides the general, complete set of features.
To prepare our data for the various learning algorithms, we used several different preprocessing approaches, which produced different versions of our dataset. These included several methods for handling missing values such as removing records or imputing average estimated values. For a more detailed description of this process, see Borle et al. 34
Subset of only “Expert Predictable” entries
As our data was collected voluntarily from patients at their own convenience, sampling intervals are not uniform, and the relevant data is not recorded for every meal. This is problematic for our predictive task as blood glucose values are more difficult to predict as more time elapses between readings. To address this issue, our clinician co-author established the following criteria of when it is reasonable to predict the next glucose value, claiming the BG is “expert predictable” (EP) at a given time if all of the following are true:
The preceding record is not a hypoglycemic event, as that subsequent BG reading is difficult to predict due to potential glucose counter-regulation effects 38 and the uncertainty in BG that follows from a physiological response to hypoglycemia.
The blood glucose reading is present for the preceding meal. For example, to make a prediction about a patient’s blood glucose value before lunch, a record detailing his/her previous breakfast must be available.
Six of the last 8 days prior to a prediction must have records for both the current meal time and the previous meal time. For example, to predict the blood glucose before lunch, 6 of the last 8 days must have both “before lunch” and “after breakfast” entries, to help capture this “after breakfast to before lunch” transition pattern.
Figure 2 shows the number of records from each patient that qualify as EP – that is, the number of records for which our expert would feel comfortable making predictions. We will let
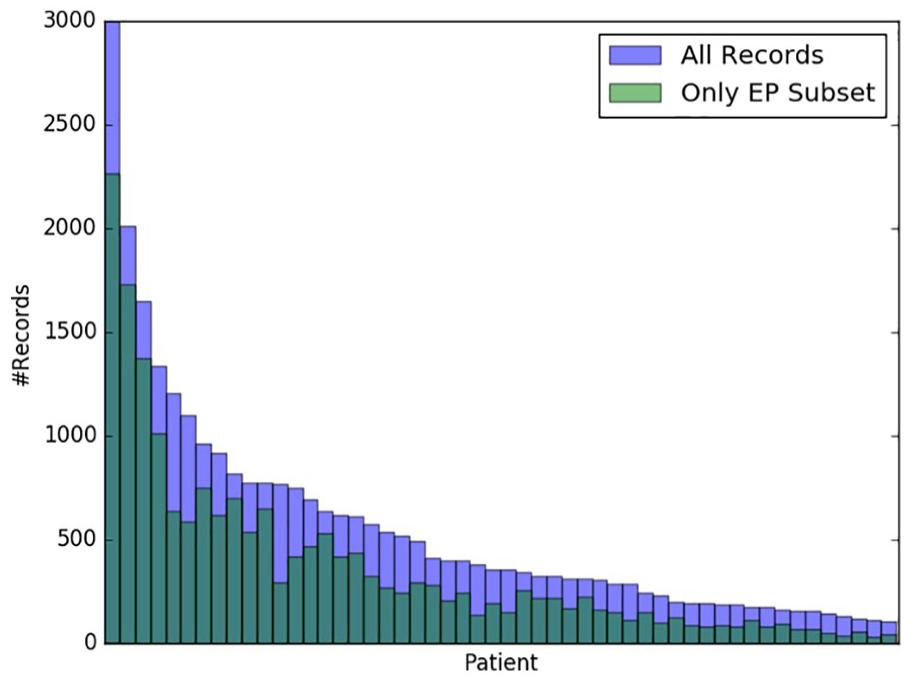
Records meeting the EP criteria. Patients are sorted by descending total numbers of records. See Borle 5 for further details.
Feature engineering
Table 2 shows the basic features used to describe each event. Additionally, we also considered many other feature sets to see if any could lead to better performance. Some of the variants completed records that were missing entries for carbohydrates or bolus insulin, which others removed those deficit records. Some added in the day of the week as an integer feature or as a one-hot encoded feature (http://scikit-learn.org/stable/modules/generated/sklearn.preprocessing.OneHotEncoder.html), while others removed the “basal insulin” feature. A few variants included non-temporal patient characteristics: age, gender, height and weight. Some replaced the set of features with just the first four principal components (obtained by principal component analysis, PCA).
Our “Kok Features” variant uses computed features similar to Kok, 2 and subsequently used by Baghdadi and Nasrabadi 8 and Zainuddin et al. 9 Unlike Kok’s data, however, we do not have stress level values in our data and were therefore unable to incorporate that feature.
For any given dataset variant, some ensembled learners have components that train on different subsets of the data. In addition, we also use models that include components that are trained on the data from all patients other than the current test patient, as well as learners that involve sub-models that are each trained only on data from one meal type (e.g. before breakfast).
Note we compute each of these 13 feature set variants for the original dataset
The complete set of preprocessing variants are described in Borle et al. 34
Machine learning algorithms
As the diabetes diary data for each patient is a temporal sequence of entries, we initially considered modeling the data as a time series, using something like an HMM (https://hmmlearn.readthedocs.io/en/latest/tutorial.html) or an ARIMA. 39 However, we realized this would be problematic due to the irregular sampling of the data, and so decided to view our task as a set of single step predictions; this allows us to use standard supervised machine learning systems to produce regression models. Note that these predictions can use, as input, data describing various earlier time points – for example, some of our models for predicting the BG at dinner time can use information about the patient at lunch time, and also at breakfast time, and perhaps also other previous dinner times, etc.
This work considers twelve different supervised machine learners, based on seven base learning algorithms: K-Nearest Neighbors (KNN), Support Vector Regression (SVR), Artificial Neural Networks (ANN), Wavelet Neural Networks (WNN), Ridge Regression (RR), Random Forest Regression (RFR) and Gaussian Process Regression (GPR). We created five other, more complex, learners, by considering weighted ensembles of GPRs and by using model stacking, where the base models are produced using different subsets of the training data. For selecting hyper-parameters, we used a portion of patients #16’s data. (Note we did not use that in the final evaluation.) For more details regarding these models, including hyper-parameter selections, please refer to Borle et al. 34
Model evaluation
To assess the performance of our models in general, we use various evaluation functions to measure the quality of model predictions for various instances, with respect to known true outcomes. In this paper we report our results in terms of “
For each of these three metrics, we also consider a “glucose-specific” variant, that uses a “Clark Error Grid inspired penalty function” to re-weight the relative costs of different mi-spredictions; see Del Favero et al.
32
for descriptions and definitions (which refers to
10-fold cross validation
Each of our learners will use the entire dataset to produce a model. The next challenge is evaluating the predictive quality of each learner. Here, we use 10-fold cross validation (CV), with respect to each patient. We first partition time series history of a patient, denoted
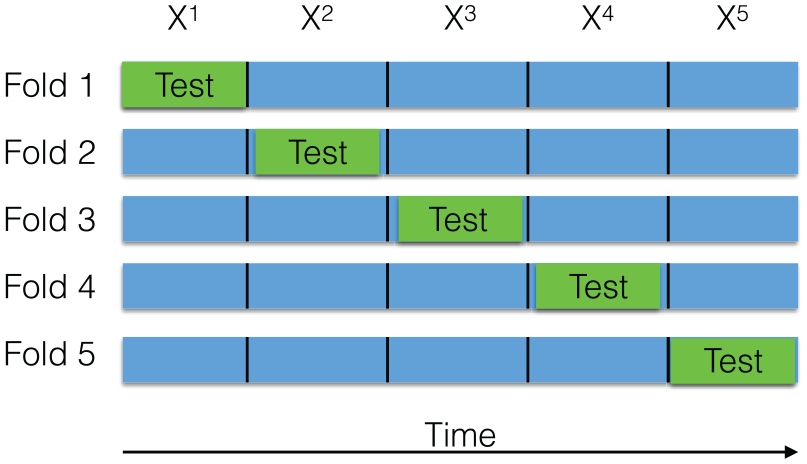
Illustration of 5-Fold CV with contiguous segments. In each CV iteration (corresponding to a row), training is done on the blue segments and testing on the green segment.
Results
Cross validation results
For each of the 47 patient histories (excluding the portion used for hyperparameter selection; see above), for each of the
For each [record_set, feature_set, learner] situation, we compute the average-
Even worse: note also that our “2.8 mmol/L error” claim is actually optimistic, as this was the high-water mark over many learners, which is technically not valid. If we ran a correct learner (that used internal cross-validation to identify the appropriate learner, and the best feature_set), we anticipate the result would worse. Our main point is: even when we were “cheating”, we were still not much better than baseline!
We next considered the “easier” subset of records, from
To help understand why our best result was not better, Figure 4 shows the predictions of
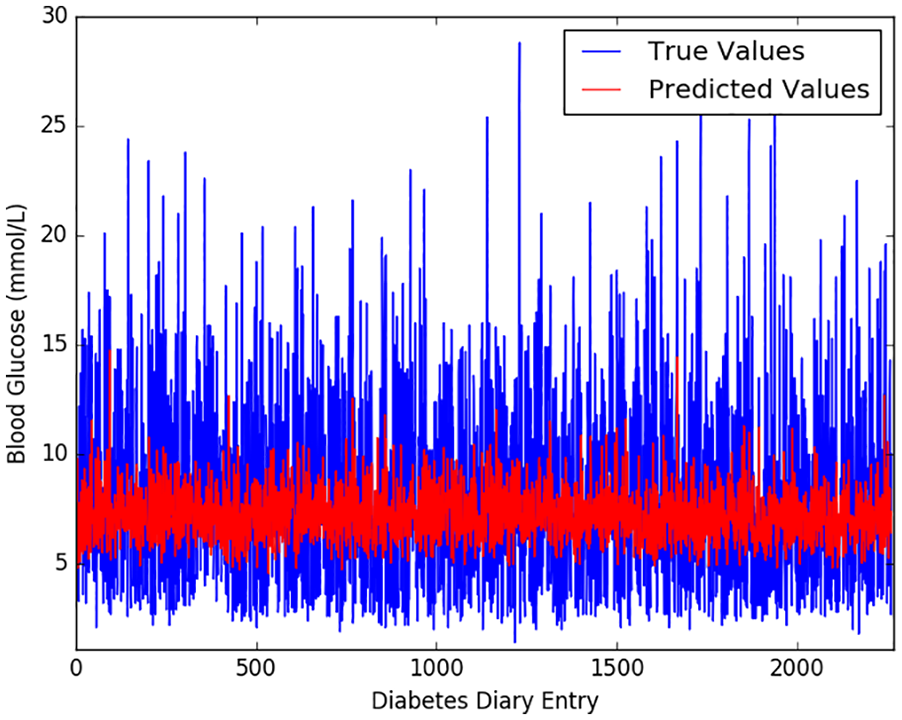
Model
Figure 5 plots the variance in each patient’s BG history and the corresponding patient’s
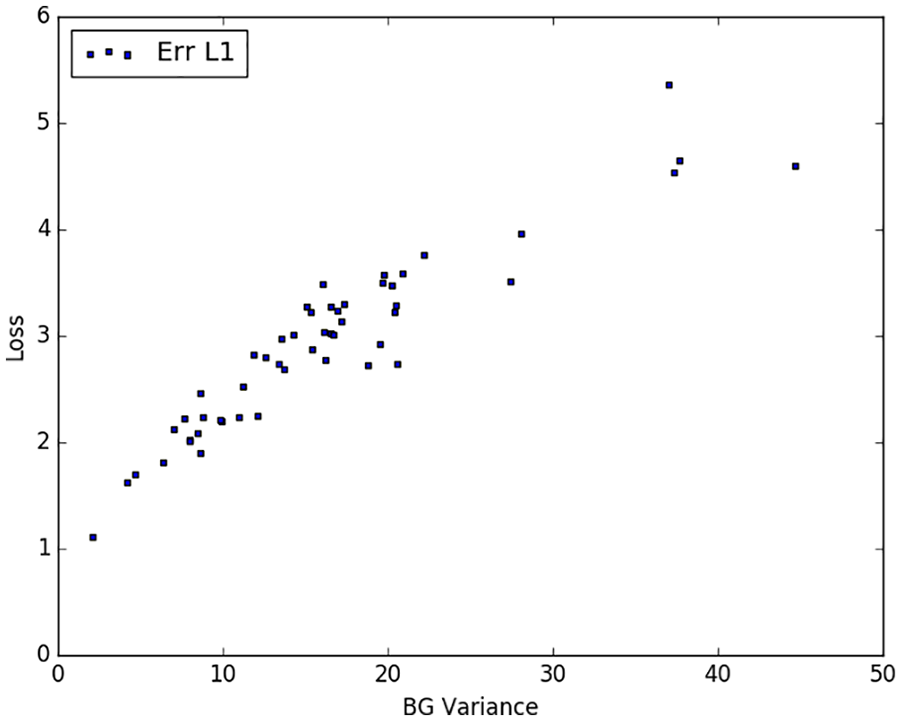
Model
One obvious question is whether these disappointing results were due to the sample size – perhaps we would get better results if we had more records for each patient? We therefore explored whether a patient’s
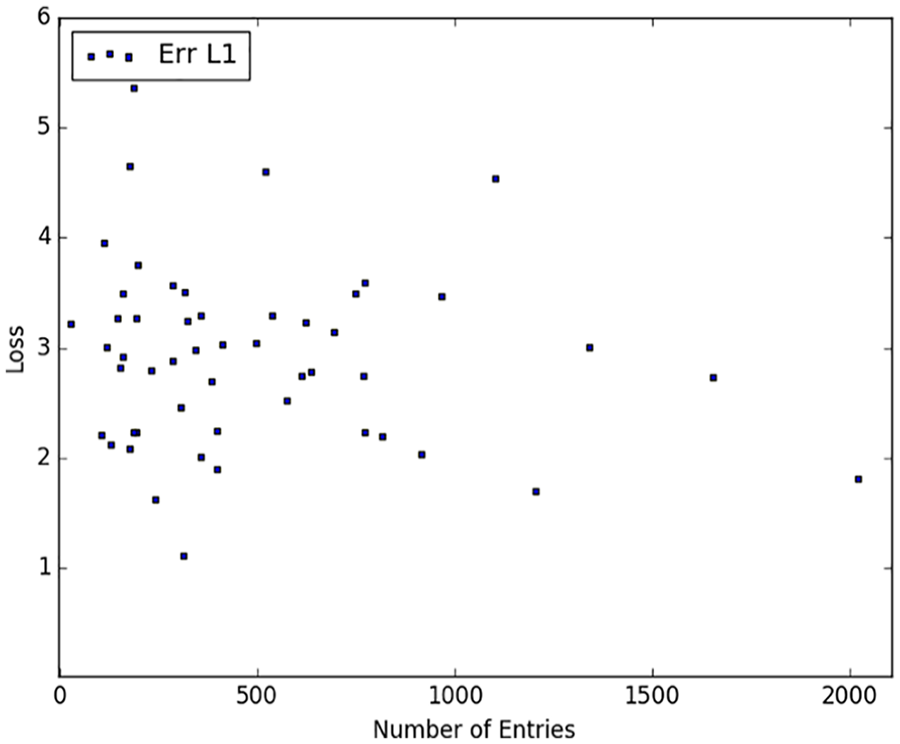
Model
Other evaluation measures
We then considered the relative
In addition to our
Performance of the best models across all metrics on
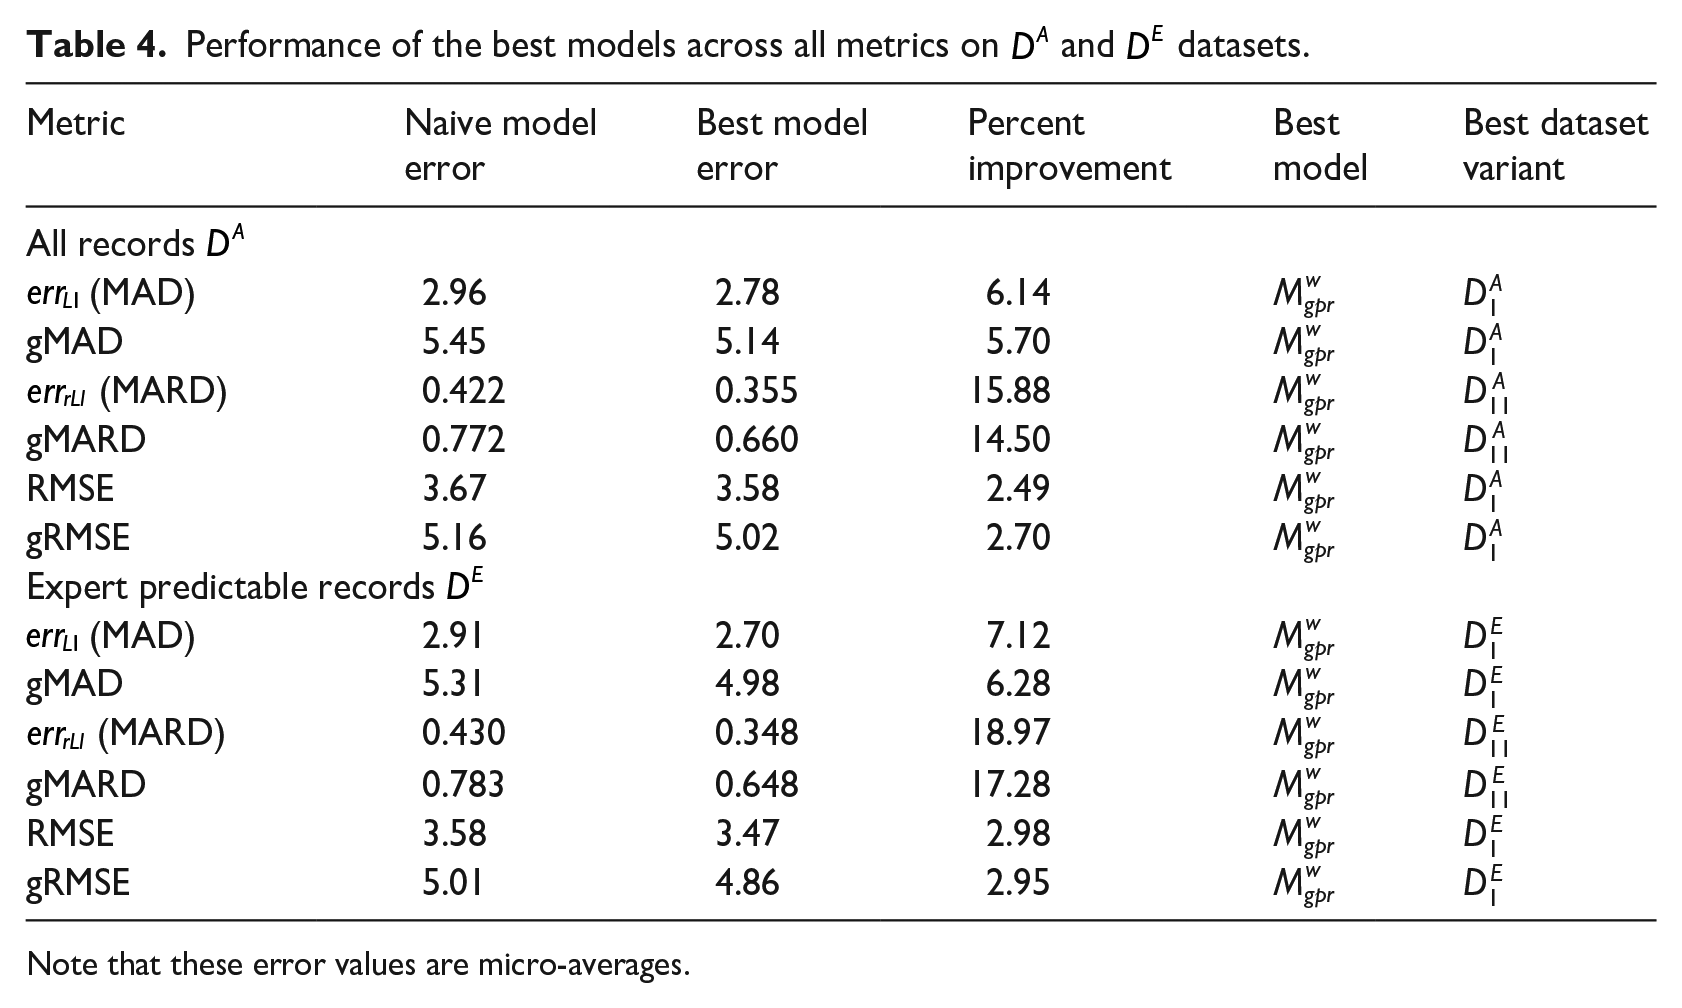
Note that these error values are micro-averages.
Discussion
Our results show that our best learning algorithm is more accurate than a naive baseline – but only slightly – but that, even in the best situation or relatively easy instances (on the Expert Predictable records
Having tried 312 different combinations of learners, record_set and feature_set variants, and observing minimal differences in their predictive performance, it seems unlikely that another [learner, record_set. feature_set] combination would be better. Note that these approaches include models that use data from multiple patients, which suggest that simply including more patients in the study is not likely to improve model performance. Moreover, since the model accuracy did not seem to improve as the number of records increased, we suspect that simply collecting more of these entries for each individual will not improve model performance.
There are many possible reasons why modeling T1D glucose levels based on this standard type of diabetes diary data is so challenging. It is possibly just an artifact of our study: perhaps many of the patients who volunteered, did so because their diabetes was difficult to manage. (Although, of course, this was not an inclusion criterion.) Another reason could be that inaccuracies and omissions of variables in data prevent the model from producing accurate predictions. These omissions could possibly include: not knowing the site where the bolus insulin was injected, how much scar tissue was present at the injection site, skin temperature, how accurately the carbohydrate value was recorded, the accuracy of the recorded insulin dose, the levels of different hormones, whether the patient was menstruating, accuracy of recording exertion and/or stress, insulin age or storage conditions, amount of blood flow at the injection site and likely yet other factors. Given our belief that training more accurate models will require additional relevant variables, future research might incorporate more confounding variables, such as injection location, 40 glucagon levels, 41 meal protein/fat content, 42 amount of fiber (complex carbohydrates), 43 influence of food order, 44 and relationships between hyperglycemia and gastric motility/emptying. 45 However, it is not clear which, if any, of such variables are sufficient to explain the response, nor whether they can be practically captured in a clinical setting. Another approach might be to avoid such a long prediction time – as mentioned above, many systems have much better prediction accuracy by making short term forecasts – on the order of tens of minutes, instead of hours. 6 Of course, these modifications change our task, as they involve data, or timing, that does not correspond to the typical diabetes diary. So while they would probably lead to a more accurate model, that does not change the message of this paper: that the information collected in standard diabetes diaries is not sufficient to accurately estimate the patient’s next-meal BG.
Conclusion
This work explored the challenge of accurately predicting future blood glucose values in Type I diabetes patients. Our extensive explorations – involving 12 different learning algorithms, over 13 different feature sets, and both the original set of records, as well as the subset of “easier to predict” records (312 combinations) – found that, on average, the model with the lowest expected
These results showed that our model could achieve an expected absolute error of 2.7 mmol/L (48.65 mg/dl), which is disconcertingly large given that this is based on the type of data that is frequently collected and used for clinical practice – that is, records collected at meal times by the patients themselves. These results strongly suggest that the standard data collected by T1D patients, while apparently sufficient for clinical treatment of T1D, is not sufficient for accurately predicting blood glucose levels. We conjecture that using patient data that is sampled more frequently (perhaps using a device like FreeStyle Libre 46 ) and that includes additional features would improve both the ability of professionals and machine learning practitioners to more accurately predict patient’s blood glucose levels, but there is a practical trade-off between patient convenience and highly detailed record keeping.
Footnotes
Acknowledgements
The authors gratefully acknowledge help from Haipeng (Paul) Li, as well as our visiting summer interns Abhinav Agrawalla, Prachi Agrawal and Pranjal Daga from the Indian Institute of Technology, Kharagpur.
Declaration of conflicting interests
The author(s) declared no potential conflicts of interest with respect to the research, authorship, and/or publication of this article.
Funding
The author(s) disclosed receipt of the following financial support for the research, authorship, and/or publication of this article: This study was funded in part by a pilot project grant from the Alberta Diabetes Institute (ADI). RG gratefully acknowledges funding from the Alberta Machine Intelligence Institute (Amii), and NSERC; E.A.R. from ADI; NB from NSERC.