
Abstract
Tight blood glucose control reduces the risk of microvascular and macrovascular complications in patients with type 1 diabetes. However, this is very difficult due to the large intra-individual variability and other factors that affect glycaemic control. The main limiting factor to achieve strict control of glucose levels in patients on intensive insulin therapy is the risk of severe hypoglycaemia. Therefore, hypoglycaemia is the main safety problem in the treatment of type 1 diabetes, negatively affecting the quality of life of patients suffering from this disease. Decision support tools based on machine learning methods have become a viable way to enhance patient safety by anticipating adverse glycaemic events. This study proposes the application of four machine learning algorithms to tackle the problem of safety in diabetes management: (1) grammatical evolution for the mid-term continuous prediction of blood glucose levels, (2) support vector machines to predict hypoglycaemic events during postprandial periods, (3) artificial neural networks to predict hypoglycaemic episodes overnight, and (4) data mining to profile diabetes management scenarios. The proposal consists of the combination of prediction and classification capabilities of the implemented approaches. The resulting system significantly reduces the number of episodes of hypoglycaemia, improving safety and providing patients with greater confidence in decision-making.
Keywords
Introduction
Type-1 diabetes (T1D) is a chronic disease that compromises the ability of an individual to produce insulin due to an autoimmune destruction of pancreatic beta cells. Subjects with T1D require exogenous insulin to regulate blood glucose (BG). Insulin must be correctly infused to maintain normoglycaemia, either through multiple daily injections (MDI) or through continuous subcutaneous insulin infusion (CSII). Otherwise, patients can experience hyperglycaemia or hypoglycaemia. T1D is related to long-term neurological, microvascular, and macrovascular complications. 1 Over time, hyperglycaemia leads to several complications such as neuropathy, nephropathy, retinopathy, and cardiovascular disease. 2 Reductions in microvascular and macrovascular complications have been demonstrated in intensively treated adults with T1D.1,3 Hypoglycaemia is a serious complication of T1D and constitutes a major concern in patient safety, being one of the most significant fears of T1D patients, 4 which may lead to seizures, coma, and even death. Three levels of hypoglycaemia are defined according a recent consensus 2 :
Level 1: BG < 70 mg/dL and BG ⩾ 54 mg/dL.
Level 2: BG < 54 mg/dL.
Level 3: Severe event characterised by altered mental and/or physical status requiring assistance.
Individuals with T1D face a lifelong challenge to maintain their BG levels within a safe range, by reducing hyperglycaemia without increasing the risk of hypoglycaemia. 5 However, tightening glycaemic control increases the risk of hypoglycaemia.6–8 Besides the large intra- and inter-day glycaemic variability, which presents a barrier to achieving optimum insulin therapy, patients’ habits play an important role in their glycaemic control. Meals, physical activity, menstruation, illness, and stress are the main challenges for patients and physicians to keep BG levels into normal levels.
Various approaches have been developed to improve patient safety in recent years. Continuous glucose monitoring (CGM) systems allow patients to track their BG levels in real time, allowing them to take specific actions when necessary. In addition, the combination of CSII with CGM therapy introduced the first automation features in commercial insulin pumps, known as sensor-augmented pump (SAP) therapy. The first generation of this technology suspended insulin infusion in the case that BG levels were at or below a specified threshold. 9 The next generation of this technology considered predictions of future BG levels to suspend insulin delivery in anticipation of hypoglycaemia. 10 Finally, the first commercial version of an artificial pancreas hit the market. This novel technology comprises a closed-loop system that adjusts insulin delivery in real time based on CGM readings. 11
Although the results achieved using the aforementioned techniques represented a great advance in diabetes care, there is still much room for improvement, especially regarding patient safety and the prevention of hypoglycaemia. In addition, some of these technologies may not be suitable for all people affected by T1D, and the high costs for acquiring such devices are also an impediment to their dissemination.
Related work
A recent report on artificial intelligence applications for diabetes management 12 points out an increasing interest in studies dealing with the anticipation of BG prediction and the personalization of decision support systems (DSSs) for the management of diabetes. Although most research efforts have been focused on the prediction of BG values, they have immediate application in avoiding adverse glycaemic events, such as hypoglycaemia. 13 These proposals include, among others, studies based on artificial neural networks (ANNs), 14 support vector machines (SVMs), 15 and evolutionary algorithms. 16
Next, we review some of the relevant studies focused on the use of machine learning techniques to detect future hypoglycaemic events. A study presented by Zhang 17 used data from 3116 patients in the intensive care unit to build a classification tree. The study used information of glucose measurement along with insulin infusion rate to predict future hypoglycaemic events in a 1-h window. Results showed a potential tool to provide early warnings of hypoglycaemia events. Similar methodological approach but using CGM data was used by Eljil et al. 18 They reported accurate results for prediction horizons of 30 min. Later, Georga et al. 19 presented a glucose model based on SVM for the prediction of hypoglycaemic events of 10 T1D patients under free-living conditions. The input features were the recent glucose profile, meals, insulin intake, and physical activities. This study provided hypoglycaemia predictions using 30- and 60-min prediction horizons. Dubosson et al. 20 studied postprandial hypoglycaemia prediction for T1D patients on MDI therapy. The study presented poor postprandial hypoglycaemia prediction results for two different datasets: (1) a cohort of 10 real patients (CGM data, insulin injections, carbohydrate and alcohol consumption, and physical activities) and (2) CGM data from 10 virtual patients from the UVa/Padova T1D simulator along with insulin and meal information. They concluded that the features glucose, insulin dose, and carbohydrate estimations are insufficient to offer reliable predictions.
A DSS for diabetes management has been evaluated in real patients recently. 21 The system is composed by different modules intended to reduce glycaemic variability in patients with T1D. The proposed strategy improves BG control by advising patients regarding some activities (meals and exercise), and also tunes individuals parameters related with insulin treatment based on hypo- and hyperglycaemic risks. Results obtained showed that the incorporation of the DSS in insulin therapy improved both glycaemic control and also patients’ safety, by reducing the time spent in the hypoglycaemic range.
The study presented here proposes a system based on various methods of artificial intelligence for the prediction and prevention of hypoglycaemic events in combination with data mining algorithms for the classification of glycecaemic control profiles for patients with T1D. Details of the techniques and datasets considered for the analysis are presented on the following sections, as well as the results obtained for each approach.
Methods: machine learning for hypoglycaemia prediction
Overall system description
The application of machine learning algorithms to predictive modelling encompasses countless methodologies that have arisen to deal with multiple applications and computational requirements. There is no general purpose, universal machine learning approach for every predictive modelling problem. The fittest approach for each problem depends on the specific requirements, data, and focus of the problem being addressed. This study proposes the application of a set of machine learning techniques to tackle patient safety in diabetes management.
Applying these machine learning methods to predictive modelling requires various preprocessing stages. As a first step, the targeted experimental datasets, consisting of the information from MDI or CSII-CGM therapy and the data from a fitness tracker band, was subjected to an exploratory analysis. The analysis provided basic information about the available data types, the data distribution, the number of observations and features, and the correlations between variables. Next, data cleaning was applied to fix structural errors in pump data values such as those coming from different pump firmware, clean suspicious outliers indicating erroneous data, and drop observations that contained missing values. Finally, we performed a feature engineering phase, which encompasses tasks to provide additional value to the dataset. The most representative transformations involve the following physiological models:
The insulin that remains active within the body can be represented using a two-compartment model that estimates the insulin on board (IOB), 22 which is an estimation of the residual insulin accumulated in the subcutaneous tissue
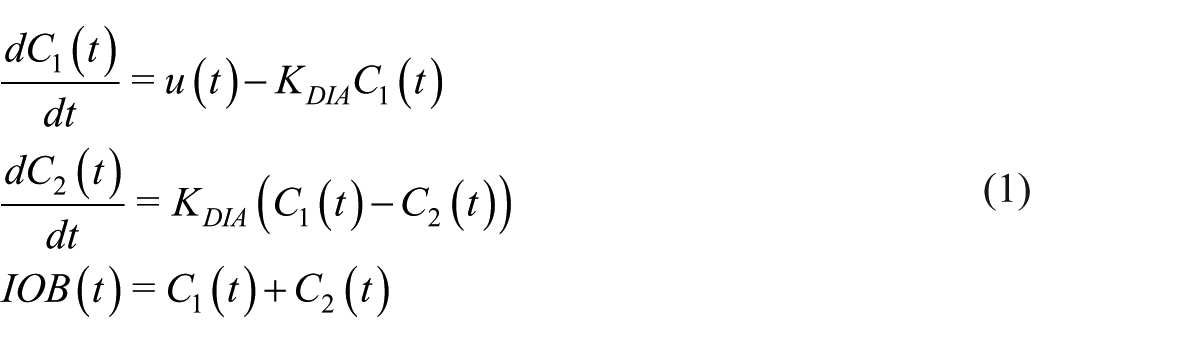
where
Carbohydrate intake may be represented using a model that delivers the glucose absorption rate
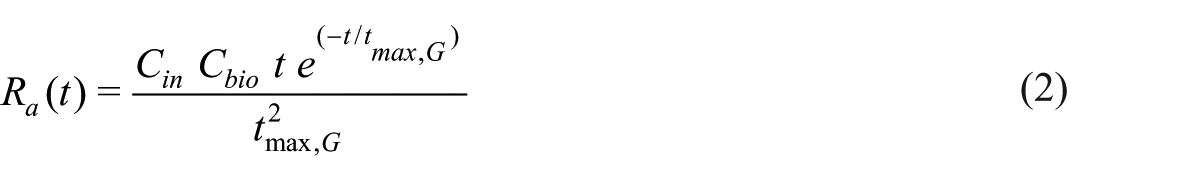
where
The activity on board (AOB) is quantified based on the total steps performed by an individual throughout the day. 24 The total number of steps performed over each sampling time is weighted by an exponential decay curve
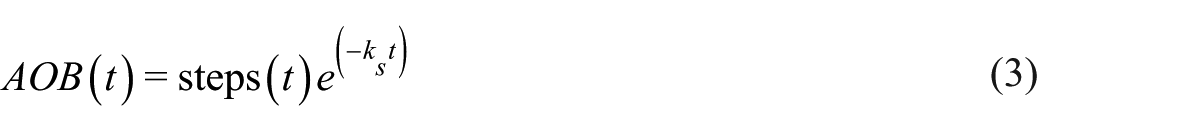
where
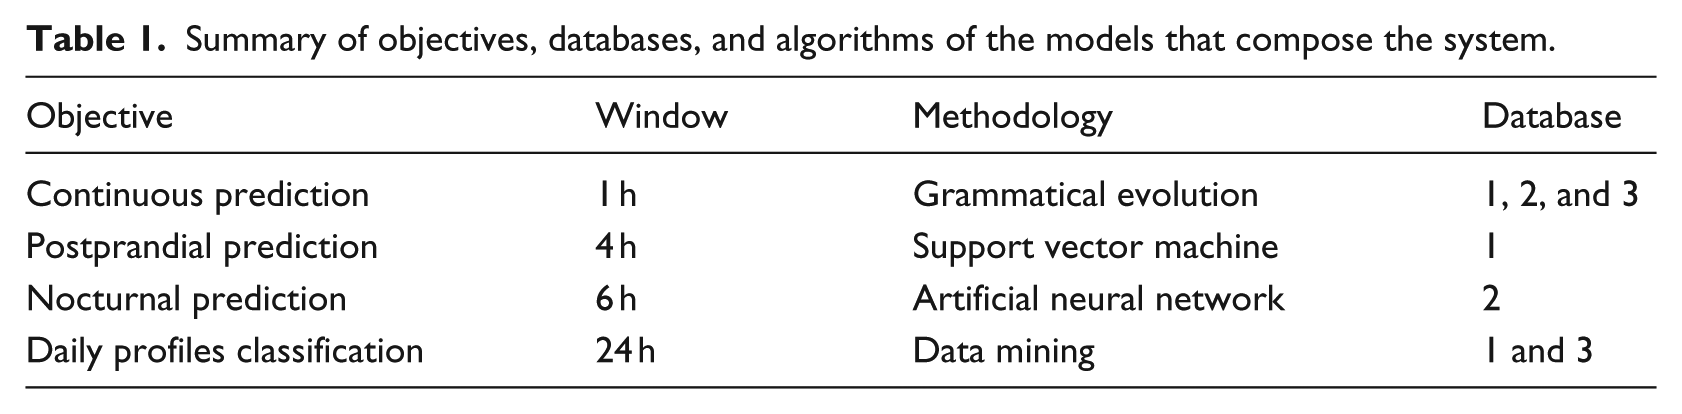
Once we have conducted an effective feature engineering phase and tapped into the domain knowledge, we present the core system, which introduces four powerful mechanisms to manage possible adverse events. Table 1 depict the four modules used in this work and the following sections will detail each of the approaches.
Summary of objectives, databases, and algorithms of the models that compose the system.
Grammatical evolution for mid-term continuous prediction
The ability to provide an early warning of ineffective or poor insulin treatment, which could lead to adverse glycaemic levels, is of considerable interest. Short- to mid-term continuous predictions of BG levels are possible, but challenging due to various factors, including variability, delays of meal and insulin absorption, and lagging BG measurements. Methods appropriately addressing such delays can provide accurate forecasts, which in turn could offer sufficient time to anticipate BG measurements and act to prevent adverse glycaemic events.
Continuous prediction is managed by a module based on grammatical evolution (GE). The evolutionary methodology aims to identify the best model within a search space of candidate models, where the best model is the one that optimises a fitness function for the problem of BG prediction. The GE module generates personalised models aiming to prevent any adverse glycaemic event. Thus, the continuous predictions provide a trade-off between the detection of hypoglycaemia (BG ⩽ 70) and hyperglycaemia (BG ⩾ 180) events. 25
GE implements a modular design based on a problem-specific free-context grammar and a fitness function. The GE grammar consists of a set of rules that incorporate the information relating to the addressed problem and defines the structure of the candidate models. The basic flow of the algorithm is an iterative process, which updates a set of solutions named the population. In each iteration, all members of the population are mapped by the grammar and assessed according the fitness function. A new population is generated, selecting the best adapted individuals in the present population. Some of these individuals remain unaltered in the next generation (elitism), and the remainder participate in the generation of the new offspring, applying transformative operations to the solutions (crossover and mutation).
The GE module was based on a version of a java evolutionary computation library (JECO). 26 It implements a fitness function that consists of a glucose-specific mean squared error. 27 The adopted grammar involves solutions that combine four sub-models associated with the BG, carbohydrates, insulin, and circadian rhythm. The grammar and the remaining hyper-parameters are detailed in Contreras et al. 28 Finally, patient data were divided into a dataset for training (66.6%) and one for validation (33.3%).
The system generates continuous prediction models using a prediction horizon of 60 min which provide punctual BG predictions based on the following semi-continuous inputs from the preprocessing stage:
The CGM values 2 h before the zero-order horizon.
Announced IOB values 2 h before the zero-order horizon.
Announced
Support vector classifier for postprandial risk assessment
The prediction of hypoglycaemic events when a patient announces a meal allows the assessment of the impact of the insulin bolus on the postprandial response and makes it possible to optimise the bolus to achieve safer dosages. The prediction architecture presented in this work is specialised to postprandial hypoglycaemia, which enables bolus re-estimation for insulin pump and MDI users. Previous approaches have been restricted mainly to nocturnal hypoglycaemia and 30–45 min prediction horizons. 29 We developed models for the prediction of hypoglycaemia within 240 min after a meal, given that the patients had a fairly regular meal intake.
Postprandial risk can be assessed using the result of a class prediction. This class can be determined by a support vector classifier (SVC) using relevant features extracted from the available inputs. SVC is a supervised learning algorithm, which has been widely employed in many classification and regression problems. Given a set of N training examples with a feature vector
In this work, we extracted an initial set of features from retrospective data, specifically the CGM signal and pump information. The selected features for postprandial hypoglycaemia were as follows:
Glucose range (GR)

where
BG[k]: The CGM value at mealtime k.
AUC: If CGM values dropped below 70 mg/dL in the last hour, the area under curve was calculated.
Glucose ROC: Rate of change of CGM values in the last 30 m.
Mean glucose: The mean value of CGM values in the last hour.
Previous basal: Cumulative sum of the basal insulin over the last 2 h.
Prediction Basal: Cumulative sum of the basal insulin for the next 4 h.
Bolus: Cumulative sum of the bolus insulin up to 1 h after its administration (to account for square and dual wave boluses).
Carbohydrate: The estimated carbohydrates of the meal in grammes.
Several scenarios were employed as models for each patient, and after testing, these were compared to select the best personalised model according to the Matthews correlation coefficient (MCC). After feature extraction and target labelling, the SVC hyper-parameters were tuned using a grid search with fivefold cross-validation. Finally, we trained the tuned models using the complete training set (80% of the data) and tested the final models using the remaining 20 per cent of the data, which was purposely excluded from the cross-validation process.
ANNs to predict nocturnal hypoglycaemia
The occurrence of hypoglycaemic events during the night is a critical hazard in T1D management. During this period, patients are sleeping and may not be able to recognise falling glucose levels, which constitutes the main defence against severe hypoglycaemia. This recognition is based on a complex hormonal system, which alerts patients to the falling levels. 31 Nevertheless, subjects that suffer from impaired awareness of hypoglycaemia are unable to detect falling glucose levels and suitably take a correction action to initiate self-treatment, increasing the risk of severe episodes. 32
ANNs simulate the human brain, by acquiring and maintaining knowledge based on information through an extensive parallel distributed process performed by single processing units, referred to as neurons. A multilayer perceptron network is one of the most widely employed ANNs for supervised learning and contains at least one layer that is hidden from both the input and output layers. Each layer is composed of a finite number of neurons, and each neuron is connected to every neuron in the next and previous layer. The output signal of a neuron given by the weighted sum of the inputs applied to a nonlinear activation function.33,34
The nocturnal hypoglycaemia predictor is driven by an ANN-based module. The aim of this module is to alert patients concerning the occurrences of future hypoglycaemic events in the upcoming hours while patients are preparing to sleep. Patients must announce to the system that they are going to bed, and based on historical data, the system will return a message informing the patient if there is a high risk of low glucose levels during the next 6-h overnight period. Considering this information, patients are able to conduct self-treatment before the occurrence of hypoglycaemia, such as by reducing basal insulin delivery rates and/or consuming a snack without bolusing, to elevate glucose levels before sleep.
Input features were obtained from historical data on glucose, insulin, meals, and physical activity considering the time instant at which the patient announced that they were preparing to sleep (sleep announcement). Inputs related to glucose data were the CGM value at sleep announcement, hourly average of CGM readings over the last 6 h before sleep announcement, hourly area under the curve below 70 mg/dL of CGM readings over the last 6 h before sleep announcement, rate of change (ROC) of CGM readings during the previous 30 min before sleep announcement, low blood glucose index (LBGI) and high blood glucose index (HBGI)
35
for the last 6 h before sleep announcement, and finally the BG difference between 60 and 30 min with respect with BG levels at sleep announcement. In addition, the values of the
Individualised models were obtained for each patient. Exhaustive search was considered to find the best input features for each patient. As the dataset exhibits an unequal distribution between its classes, the adaptive synthetic sampling (ADA SYN) algorithm 36 was employed to provide a balanced distribution during the training process. Due to the small amount of instances obtained from the dataset, fivefold cross-validation was applied in the entire dataset. This procedure was repeated 100 times to produce different splits in each repetition and reduce the influence of sample selection bias in the outcomes. Individualised results were obtained by averaging the outcomes over the 100 runs. The software MATLAB® R2016b was considered to develop this methodology.
Patient condition assessment
The high variability between glycaemic profiles of patients makes tight glycaemic control a complex task. T1D treatments are governed by an inter-patient variability, which leads to a lack of models that can respond to the particularities of each patient. In addition, the so-called intra-patient variability makes it difficult to generalise models able to capture the glucose dynamics of a singular patient. Although some systems (see for instance Medtronic CareLink Pro/Personal®) 37 have developed some functionalities to analyse BG dynamics depending on events occurring at specific periods, the majority of scenarios with a high impact on BG values are not yet detectable. The implementation of a personalised DSS with an ability to identify scenarios such as exercise, menstrual periods, sick days, seasons, diet disturbances, or habits, among others, would allow the generation of tailored T1D prediction models that can assist in the control of BG levels.
A data mining approach based on the normalised compression distance (NCD) 38 was applied to identify multiple scenarios for T1D patients. This module was implemented using a custom Java software based on the Lempel Ziv Markov compression algorithm for detecting redundancies and patterns in the content of a time series. First, we perform hierarchical clustering, in which the scenario instances are automatically and blindly grouped into a tree structure. Therefore, we consider a set of N time series to be grouped, and a similarity matrix (N × N measurements). The employed hierarchical clustering process constructs a binary tree from individual elements by progressively merging the clusters containing the two closest elements. This process is guided by the complete linkage method, 39 which was selected for its compromise between simplicity and the potential for quality solutions. The initial clustering of the training dataset, which establishes the initial classes, involves 66 per cent of the dataset. Then, an NCD-based classifier is employed to identify the underlying profile class of the validation set (66%). The approach identifies unseen daily time series by computing the minimum distance between the pre-classified classes from the initial dataset and the new instance. The features selected to profile T1D scenarios consisted of the BG measurements and insulin doses.
Databases
Three different databases were used to assess the methods individually. The datasets were labelled using several thresholds according to the definitions of hypoglycaemia 2 and hyperglycaemia. 25 In both cases, an adverse glycaemic event was predicted whenever three consecutive BG measurements (15 min) were detected above or below their corresponding levels. 40 The participants of the clinical studies related to the datasets 1 41 and dataset 2 42 provided written informed consent on data utilisation.
Database 1
Retrospective data from a cohort of 10 T1D patients was collected. The mean (±SD) age was 41 ± 10 years. The average duration of diabetes in the population was 27 ± 10 years, and they used pump therapy for 10 ± 5 years. The average body weight and HbA1c were 65 ± 13 kg and 7.3 per cent ± 0.5 per cent, respectively. Patients wore a Paradigm Veo 754® or 640G® insulin pump (Medtronic MiniMed, Northridge, CA) and Enlite-2® CGM sensors (Medtronic MiniMed) in free-living conditions. The collected data include CGM readings, carbohydrate intake estimations, and insulin doses.
Database 2
This dataset is composed by 8-week period for six adult subjects with T1D. All subjects were between 40 and 60 years and wore Medtronic 530G (Medtronic MiniMed) insulin pump with Medtronic Enlite sensors (Medtronic MiniMed). During the 8-week period, patients stored on a smart-phone several life-event data and also used a fitness band to acquire physiological signals. The collected data include CGM readings, insulin doses, carbohydrate intake, sleep information, heart rate signal, steps counter, and galvanic skin response.
Database 3
A cohort of 100 subjects was simulated using the UVa/Padova simulator 43 and a T1D patient decision-making model. 44 Each virtual patient dataset comprised the data for 14 days with a 5-min sampling period. The time series include a CGM readings, carbohydrate intake, and insulin delivery via an insulin pump. The model consists of four sub-models, which describe the physiology of the T1D patient, the device used for glucose monitoring, the therapeutic decisions of the patient, and the insulin pump.
Assessment metrics
Each method was evaluated individually. Final classification results are presented using sensitivity, specificity, and accuracy (Table 2). In addition, MCC
45
values and the Clarke error grid (CEG) percentages are reported. The MCC (Table 2) is a metric that merges the confusion matrix into a single value and is generally regarded as a balanced measure, even for imbalanced classification problems. The MCC index returns a value in the range of
Metrics used to assess each of the methodologies using metrics of a positive example classified as positive (TP), negative example classified as negative (TN), negative example classified as positive (FP), and positive example classified as negative (FN).
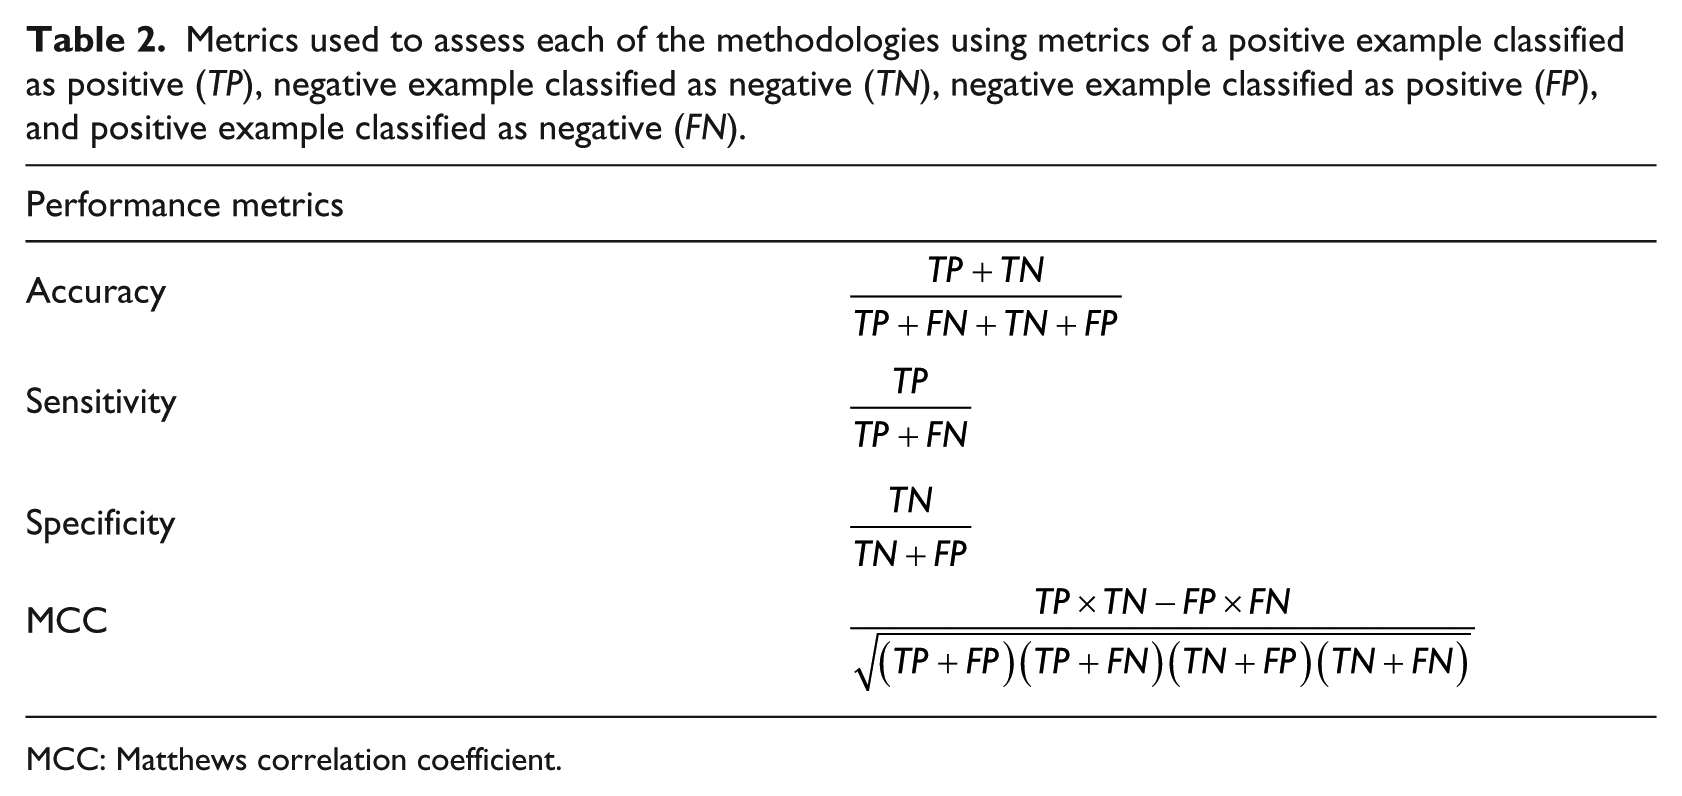
MCC: Matthews correlation coefficient.
Results
Mid-term continuous prediction
Table 3 presents results for all the databases considered in this article, presenting more than 96 per cent of the predictions inside regions A and B for the test data, which implies that the majority of the predictions were safe from a therapeutic point of view. Regarding the general distribution of the clinical harmfulness of the deviations, Table 3 presents that most of the errors out of zones A + B are concentrated in zone D. Despite always being under 4 per cent, estimations located in region D are highly undesirable because they mean that the predictions missed severe hypoglycaemia or hyperglycaemia events.
CEG analysis for the mid-term continuous prediction of BG excursions (PH = 60 min).
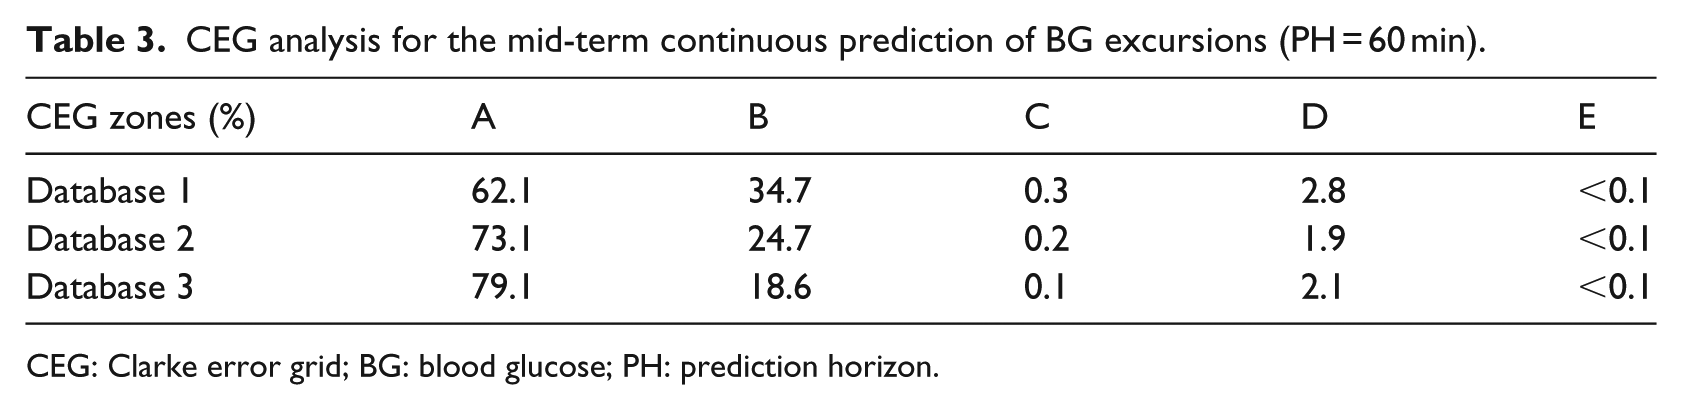
CEG: Clarke error grid; BG: blood glucose; PH: prediction horizon.
This study assesses the GE method, by computing the performance metrics (defined in Table 2) based on the number of predicted Level 1 or Level 2 hypoglycaemic events. The average results for Database 3 (20 runs) are presented in Table 4.
Population outcomes for the mid-term continuous prediction module to predict hypoglycaemia.
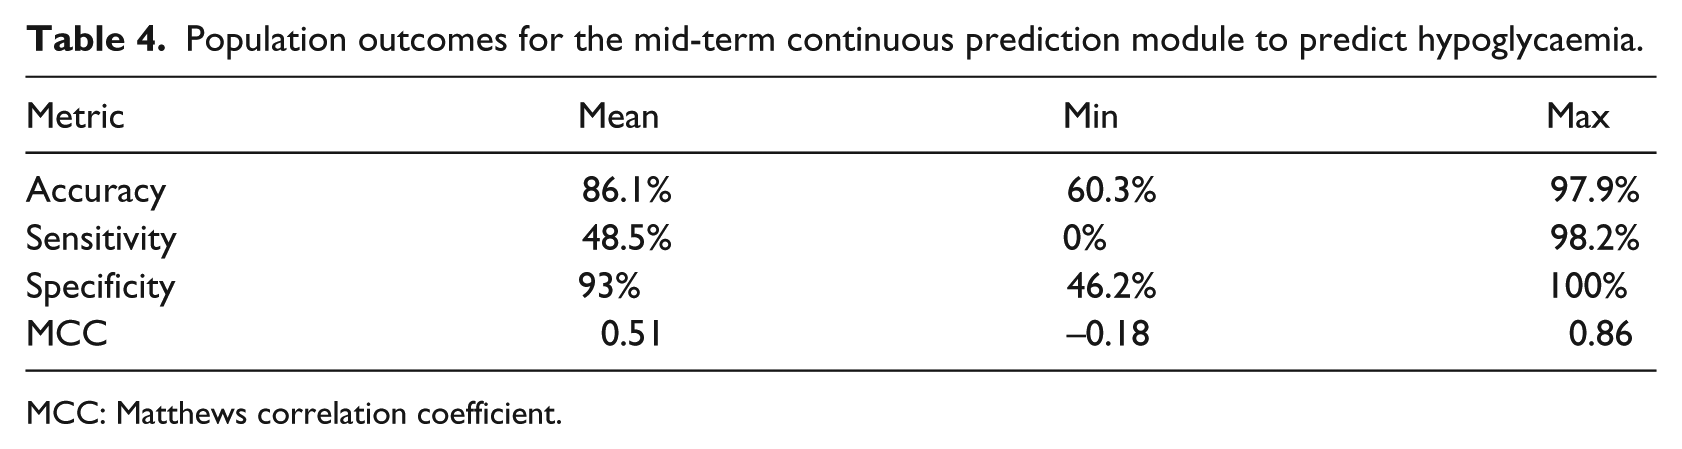
MCC: Matthews correlation coefficient.
Postprandial risk assessment
The averaged results of the prediction models are displayed in Table 5. The results of the postprandial prediction strategy show the best MCC from the 10 patients corresponding to the Database. A sensitivity and specificity of 69 per cent and 80 per cent, respectively, for Level 1 hypoglycaemia, and 75 per cent and 81 per cent, respectively, for Level 2 hypoglycaemia.
Population outcomes considering the most favourable model of each patient for hypoglycaemia Level 1 and Level 2.
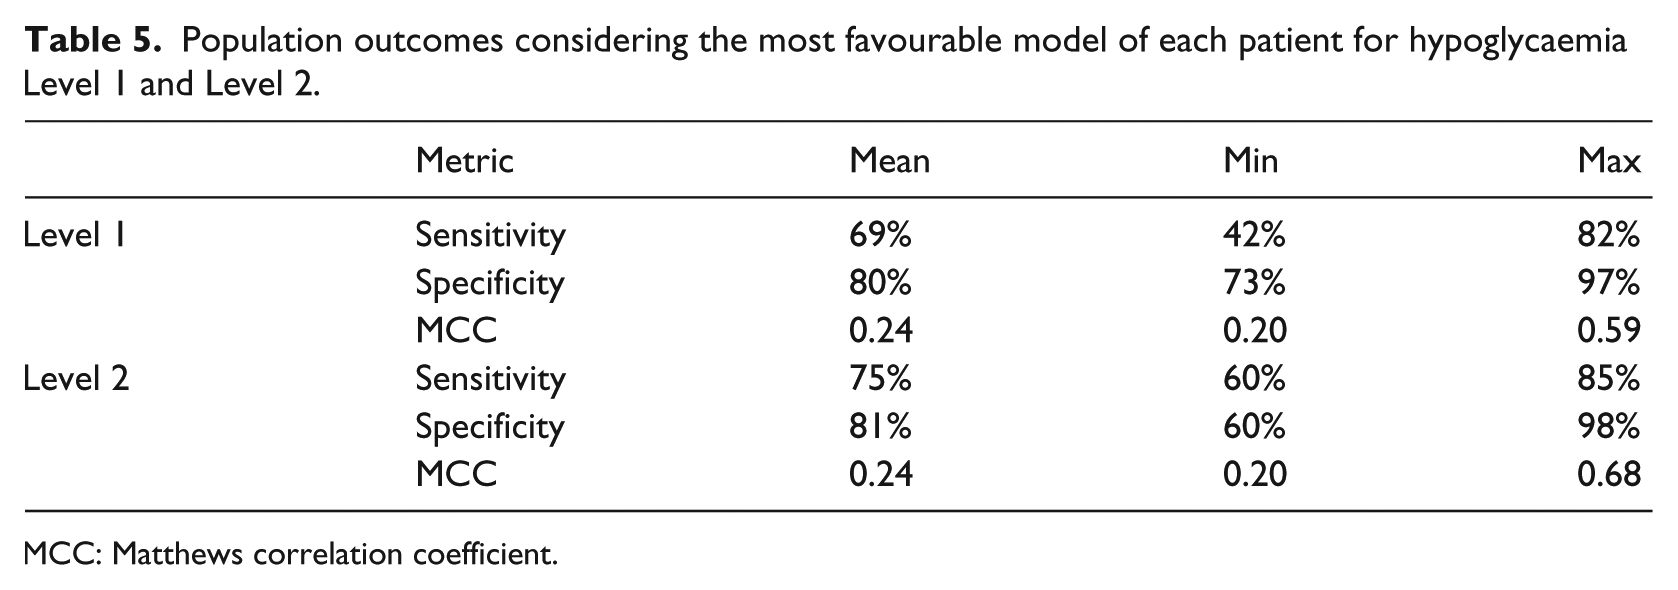
MCC: Matthews correlation coefficient.
These results were obtained for the postprandial period, using a prediction window of 4 h after meal consumption and assuming a bi-class classification scheme.
Nocturnal hypoglycaemic events
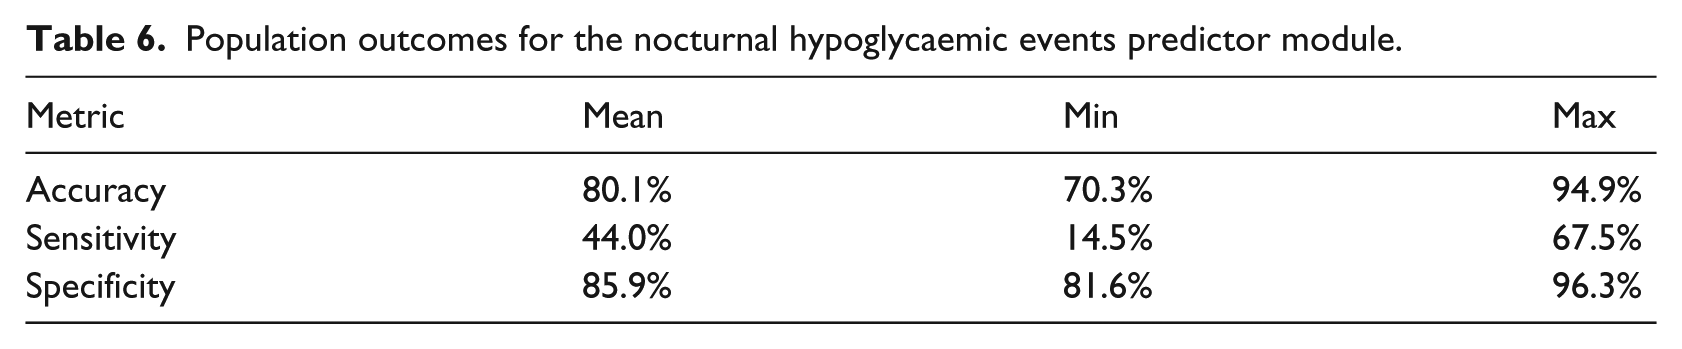
To assess the capability of the ANN to predict nocturnal hypoglycaemic events, Database 2 was considered. This database was chosen because it is the only one in which physical activity signals and sleep information are available. Population results are presented in Table 6, showing the outcomes for the entire cohort.
Population outcomes for the nocturnal hypoglycaemic events predictor module.
Patient condition assessment
Figure 1 presents the results of the last experiment performed in this study. The experiment uses the complete set of profiles which comprises a total of 280 daily time series from Database 3. The figure presents the three stronger connections of each node according to the NCD (discarding similarity values with themselves). The figure represents each time series with a circular node and, each profile with a green, blue, or grey shape (colours are just used to improve readability of the figure). The links between the time series of same profiles are coloured in black, while the connections between different profiles are coloured in red. The figure presents a total of 280 nodes with 840 connections. The 94 per cent of the edges are connecting nodes between same profiles while just 6 per cent of the links comprise an edge between different profiles. The graph shows that it is able to cluster majority of profiles, even isolating some of them completely. Although most of the profiles included in this graph are strongly connected with themselves, it also shows examples of more disperse clusters such as profile 8. Results indicate that the similarities between the days generated with different virtual models are much less frequent. By contrast, the approach is able to find a high level of similarity between the time series generated with the same virtual model. The classifier outcomes calculated for this study and Database 3 show a specificity of 92 per cent and sensitivity of 99 per cent.
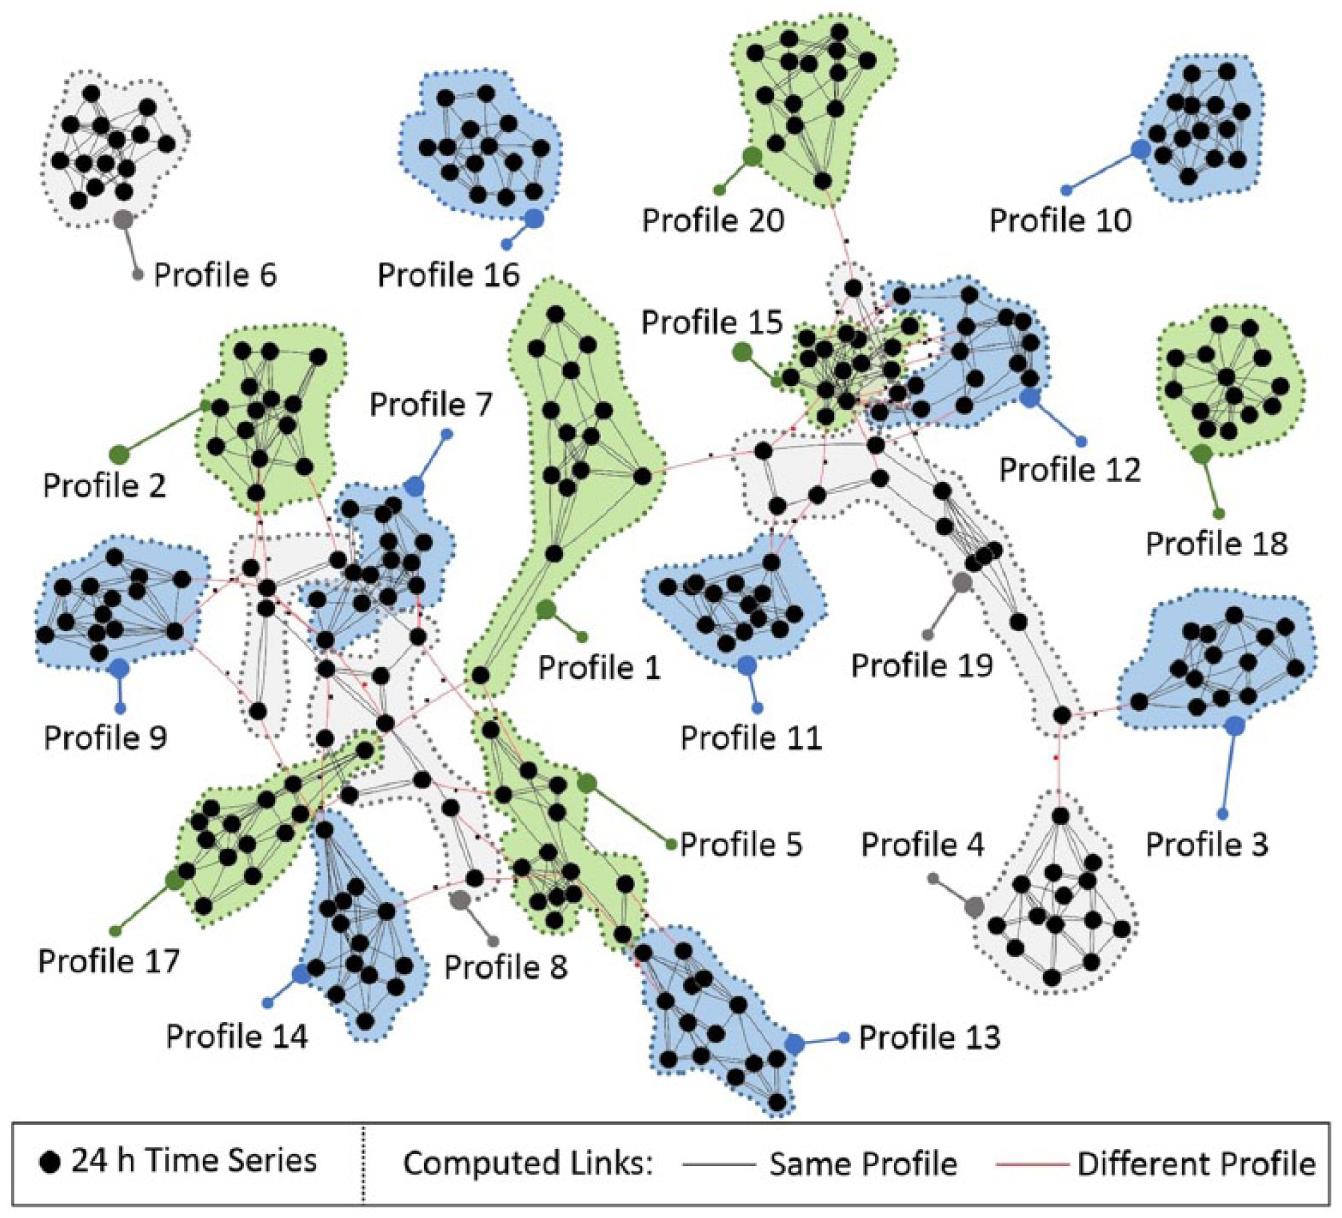
Clustering of glucose profiles. Each cluster represents a simulated T1D profile, each node a historical time series data from a type 1 diabetic pump.
Once the identification features of the NCD distance were demonstrated, we validate the approach with a classifier tool based on the NCD distance. A set of virtual profiles are used as source of knowledge to classify unseen time series. The classifier system uses 10 time series per profile as database and 4 time series aimed to validate the system. A K-fold cross-validation (K = 20) was used to select the items comprised in the sets. The classifier outcomes calculated for this study and Database 3 show a specificity of 92 per cent and sensitivity of 99 per cent.
Discussion
Algorithms for predictive modelling aim to learn underlying patterns from the data, and at the same time, they try to ignore irrelevant information or randomness in a dataset. However, even complex and flexible machine learning approaches may perform extremely well on training data but very poorly on new data, as a consequence of over-fitting. Machine learning algorithms must involve a bias-variance trade-off and prevent over-fitting using techniques such as a systematic cross-validation, feature selection, or regularisation. Successfully addressing this key issues introduces one of the most important advantages of machine learning to predictive modelling in diabetes: the ability of these methods to generate sets of customised patient models. Generalised prediction models are not usually successfully applied to diabetes treatments, because of the high inter-patient variability. These models cannot capture the specific physiological behaviours of individuals, which is ultimately translated into poor performances for the generated estimations. Furthermore, the different scenarios faced by patients may also involve a high intra-patient variability, which could complicate the process of building general models even further. Machine learning methods are able to avoid this limitation of classical modelling methods by generating personalised prediction models that patients may use as a customised approach to tackle their disease.
Figure 2 presents the proposed conceptual design of the system for hypoglycaemia prediction. It is divided into four subsystems: the first for short- to mid-term continuous prediction, the second for postprandial prediction, the third for nocturnal hypoglycaemia prediction and, finally, a integrated patient condition assessment. One of the main contributions of an integrated system using the modules described previously is to increase patient safety by forecasting unwanted events using both classification and regression approaches. This is advantageous because alarms only require an activation from a predicted class, but corrective actions should be taken based on a reliable continuous prediction. In addition, the selection of the prediction horizon for each module can be adapted to a patient’s requirements and lifestyle. In this proposal, the shortest prediction horizon corresponds to the regression task. This is because the continuous value has to be as reliable as possible, with a prediction horizon of at least 1 h, in order to take therapeutic decisions based on the predicted value. Previous studies have validated a module issuing continuous BG predictions using Databases 1, 2, and 328,47,48 that reported accurate real-time predictions. When a meal is announced, the postprandial module is able to encompass a 4-h prediction horizon, in which a labelled output will warn the patient of an upcoming hypoglycaemic event. Despite the continuous predictor being able to provide outputs constantly, it tends to underestimate hypoglycaemic events, as the majority of the training instances correspond to normal glycaemic excursions. Thus, in the case that the continuous predictor overestimates glucose values in the four hours following a meal, the postprandial module would provide a more sensitive prediction and an alternative output to avoid an upcoming missing event. The nocturnal prediction module has a similar complementary dynamic with the continuous prediction module. As this encompasses a 6-h prediction horizon, it can help to increase the patient’s safety in the overnight period. This would withdraw the need for patients to wake up in the middle of the night due to an alarm triggered by the continuous prediction module, improving sleep quality. Patients would be advised to consume a snack before sleeping. As the results obtained showed a high specificity, patients would not consume excessive carbohydrates without necessity.
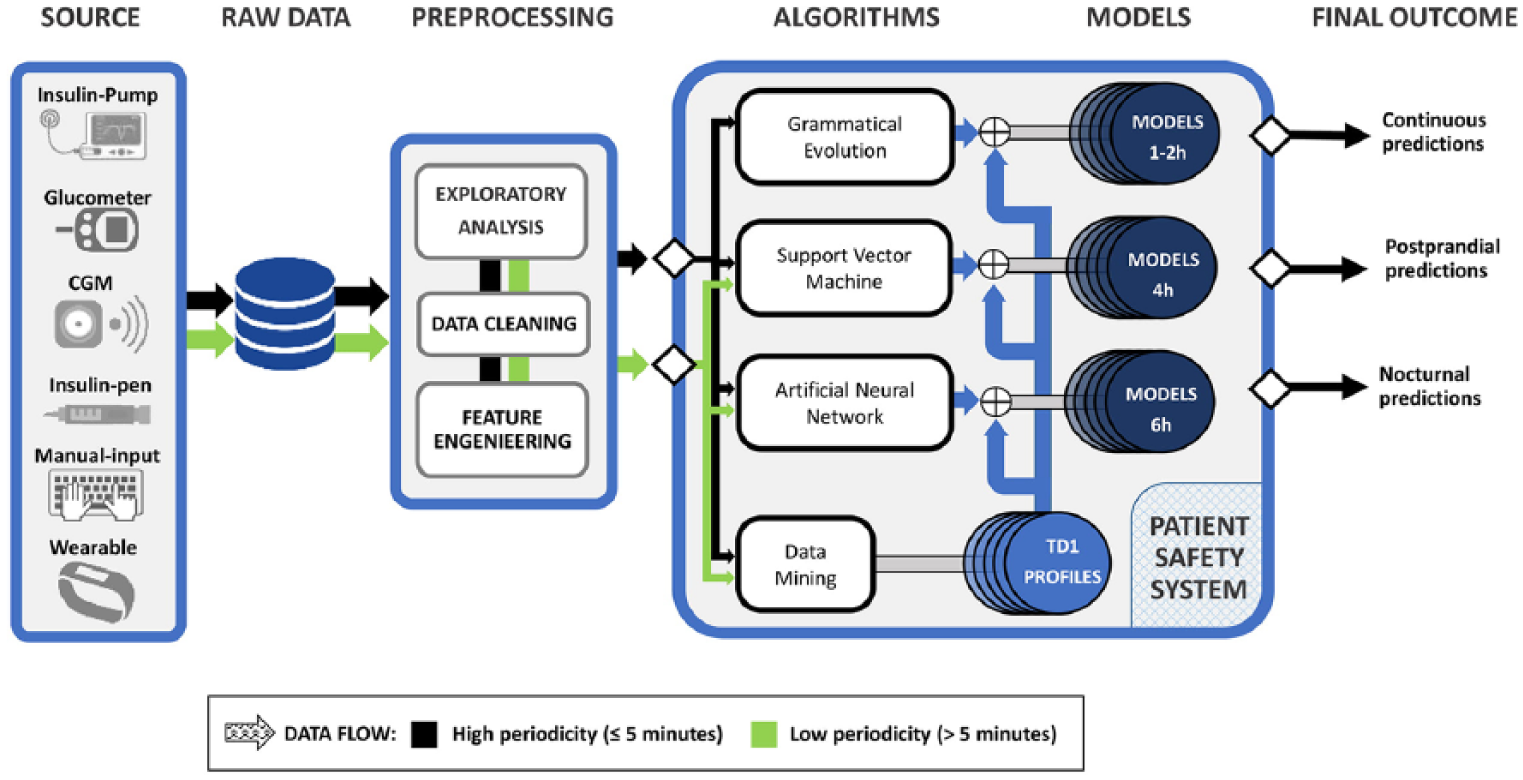
General diagram of the proposed system. The arrow colours indicate which algorithms proposed in this article may be suitable for type of data.
The patient assessment module provides a vertical approach to the modules discussed above. This method can help to identify the most common situations affecting BG control for each single patient, allowing personalised detection and identification for different patient conditions. Using an automated and blind grouping of the data, the remaining modules benefit from training the methods in different scenarios, as suggested in Figure 2. The detection of scenarios associated with glycaemic control profiles was validated in a previous study using Database 1. 41 That study performed an exploratory analysis to demonstrate the existence of significant clusters that could be exploited to further customise therapies to the specific scenarios faced by T1D patients. Also, another approach for the individual categorisation of glucose profiles has been presented.49,50 The method is based on compositional data (CoDa) analysis applied to glucose data obtained from CGM discretized into time spent in different glucose ranges. Both methods have demonstrated the existence of diverse patient conditions affecting BG control. Therefore, personalised treatment profiles would allow for more tailored insulin therapy in the identified situations, leading to more accurate glycaemic control and an improvement in the patient’s quality of life.
Our work has several limitations. The first one is that the modules were evaluated on different datasets, and consequently, under different conditions. Second, the predictive capability of the entire system has not been evaluated in this work. Since all the modules are intended to work in parallel in real-life operation, a coordinated design between all the modules must be performed. Therefore, to obtain solid conclusions regarding the efficacy of our system, all the modules should be evaluated operating jointly in the same dataset, and thus, be tested in real patients. However, the results obtained by each module are promising, especially in terms of increasing patient safety in front of hypoglycaemia and helping patients to take more accurate decisions on the management of their disease.
Conclusion
A novel system for the prediction of hypoglycaemic events in T1D patients has been presented. Machine learning methods were applied to different datasets for patient condition assessment, continuous glucose level prediction, and the prediction of postprandial and nocturnal hypoglycaemic events. Even though the systems performed effectively, they have been analysed separately considering only data from CSII therapy. However, most of the methodologies can be adapted for MDI.
Models with different prediction goals based on diverse techniques working in parallel provide an increased robustness for the proposed system. Each predictive system performs better in particular scenarios. However, the combination of different models increases the possibility of anticipating events that would probably have been missed if a unique prediction subsystem was considered. The simultaneous utilisation of these different personalised prediction models will allow the evaluation of an integrated and robust system for the prevention of hypoglycaemic events in both CSII and MDI users.
Footnotes
Declaration of conflicting interests
The author(s) declared no potential conflicts of interest with respect to the research, authorship, and/or publication of this article.
Funding
The author(s) disclosed receipt of the following financial support for the research, authorship and/or publication of this article: This work has been partially funded by the Spanish Government (DPI2016-78831-C2-2-R), by the National Counsel of Technological and Scientific Development, CNPq – Brazil (202050/2015-7 and 207688/2014-1), and by the Spanish Government through contract ES-2014-068289.