
Abstract
A consumer health informatics approach is used to investigate the development of a patient-centered decision support system (DSS) with individualized utility functions. It supports medical decisions that have uncertain benefits and potential harms. Its use for accepting or declining cancer screening is illustrated. The system’s underlying optimization model incorporates two user-specific utility functions—one that quantifies life-saving benefits and one that quantifies harms, such as unnecessary follow-up tests, surgeries, or treatments. The system requires sound decision making. Therefore, the decision making process was studied using a decision aid in the form of a color-coded matrix with the potential outcomes randomly placed in proportion to their likelihoods. Data were collected from 48 study participants, based on a central composite experimental design. The results show that the DSS can be effective, but health consumers may not be rational decision makers.
Keywords
The American Medical Informatics Association describes consumer health informatics (CHI) as focusing on “information structures and processes that empower consumers to manage their own health—for example health information literacy, consumer-friendly language, personal health records, and Internet-based strategies and resources”. 1 Although its core competencies are difficult to specify,2,3 it is clear that CHI approaches can be used to promote shared patient-physician decision making.4–8 They can also be used for home health applications 9 and to assist in the implementation of P4 medicine by creating applications that are personalized and participatory, while promoting proactive and preventative health choices.10,11
The CHI application described below concerns patient-centered clinical decision making for medical procedures that are subject to uncertainties. Although it focuses on cancer screening, the methods apply to chronic disease treatments, pharmaceutical drugs, and elective surgery. The aim of the research was to investigate the potential for a patient-centered decision support system (DSS) that uses an individualized utility function to support medical decisions that have uncertain benefits and potential harms. The article proceeds as follows. A decision model is developed that optimizes the decision to accept or decline screening based on personalized utility functions. To evaluate its efficacy, a data collection scheme is described that determines individual utilities using a graphical decision aid and a set of controlled hypothesized cancer screening scenarios. Then, results from a group of study participants are presented and discussed. Finally, the ability of health consumers to make rational decisions is analyzed.
Background
In the quest to empower health consumers to take charge of their medical care, certain challenges need to be overcome. They include “various degrees of health literacy and numeracy, consumers’ ability to effectively compare statistical and other information”. 12 Other challenges include a reluctance to choose decisions involving uncertainty, called ambiguity aversion, 13 and biases due to the way a physician presents information to consumers. 14 For example, the choice to present potential treatments in a positive frame or negative frame has been shown to bias medical decision makers. 15 Presenting a plethora of relevant information can be counter-productive, due to the biases caused by certain psychological phenomena, such as cognitive overload and anticipated regret. 16 Finally, perceived likelihoods based on an individuals’ perception of their cohort can cause decision bias. 17
The American Cancer Society (ACS) recommends that specified populations undergo routine screening for breast, colon, rectal, and cervical cancer. 18 They also recommend that high-risk individuals undertake early detection mechanisms for uterine, lung, and prostate cancer. In many cases, personalized decision are recommended. For example, the ACS recommends that a woman between the ages of 40 and 44 undergo mammography “if they wish to do so.” Increasingly, shared decision making is recommended for cancer prevention, screening, and treatments. 19 In fact, the U.S. Preventive Services Task Force recommends individualized decisions for prostate cancer 20 and breast cancer. 21
For many medical professionals and public health organizations, a single “does it save lives?” criterion has dominated cancer screening recommendations. A meta-analysis of 57 clinical trials covering multiple cancers found a consistency in the tabulation of benefits, with harms reported inconsistently. 22 However, for many consumers, the benefits of cancer screening are small and potential harms need to be taken into account.23–25 These harms include adverse side effects and effects of overdiagnosis. 26 For example, it has been reported that annual breast cancer screening saves one life per 1000 women, but about 500 women will experience a false-positive screening result, 64 will undergo an unnecessary biopsy, and 10 will undergo unnecessary cancer treatment. 27 Improved technologies may increase the decision complexity because, although they can identify more abnormalities, many of these abnormalities will not develop into cancer. 28 After getting false-positive result, individuals may be less likely to undergo future cancer screening.29,30
A clinical DSS can help empower health consumers.31,32 The DSS should include a knowledge base, a decision aid, an optimization model, and a methodology that accounts for individual consumer preferences. 33 If properly implemented, it would support decisions of individuals, groups, and organizations. 34 It could also be used by public health informatics professionals when applied to developing guidelines for disease prevention. 35 The DSS should be created by an interdisciplinary team of health informatics experts, medical practitioners, and consumers. 36
Models embedded in a DSS to support cancer screening decisions can take many forms, from qualitative rules-based checklists to artificial intelligence methodologies.19,37 Stochastic (i.e., probability-based) decision models have been employed, 38 including those that address designing a testing system 39 and those that apply signal detection theory to image evaluation. 40 Although these models include accurate estimates of probabilities associated with benefits and harms, they can suffer from the inability to quantify impacts effectively. Some models use financial estimates associated with each potential outcome. 41 This approach fails to account for individual preferences and other considerations, such as pain and anxiety. Financial considerations are not be highly relevant to many health consumers because cancer screening is offered at little or no cost.
Utility functions have been used to quantify the value an individual places on their mental and physical health by encompassing a myriad of criteria, 42 including emotions. 43 For example, higher levels of dread, uncertainty, and anxiety increase risk aversion in many individuals. 44 Utility approaches are relevant in cancer screening because preferences differ across consumers. 45 Health-related utilities are often quantified using the quality-adjusted life year index based on a standard gamble, time-trade off comparisons, and discrete choice experiments.42,46 They can encompass quality of life 47 and temporary health states. 48 They have been applied to screening decisions for prostate cancer 49 and breast cancer. 50
A graphical decision aid can enhance a decision maker’s ability to weigh benefits against harms by simultaneously presenting the likelihoods associated with more than one potential outcome. 51 Decision aids can help minimize the bias created by framing clinical options in terms of benefits. 52 They can help mitigate an individual’s inability to make compare options that include low likelihood but high severity outcomes. 53 They minimize the variation in how the same likelihood is perceived across individuals, 54 and increase the accuracy of information. 55
Methods
The scenario shown in Figure 1 represents a generic cancer screening system. The patient undergoes the screening test, with either a positive or a negative result. Those patients with a positive result undergo a more advanced follow-up test, which will identify many false-positive screening results. Patients with a positive follow-up test will undergo a biopsy, where the false-positive outcome may be detected. Patients with a positive biopsy will undergo treatment (chemotherapy, tumor removal, radiology, etc.). They will survive the cancer or die from the cancer. In some cases, the treatment may have been unnecessary because the malignant tumor would not have caused their death.
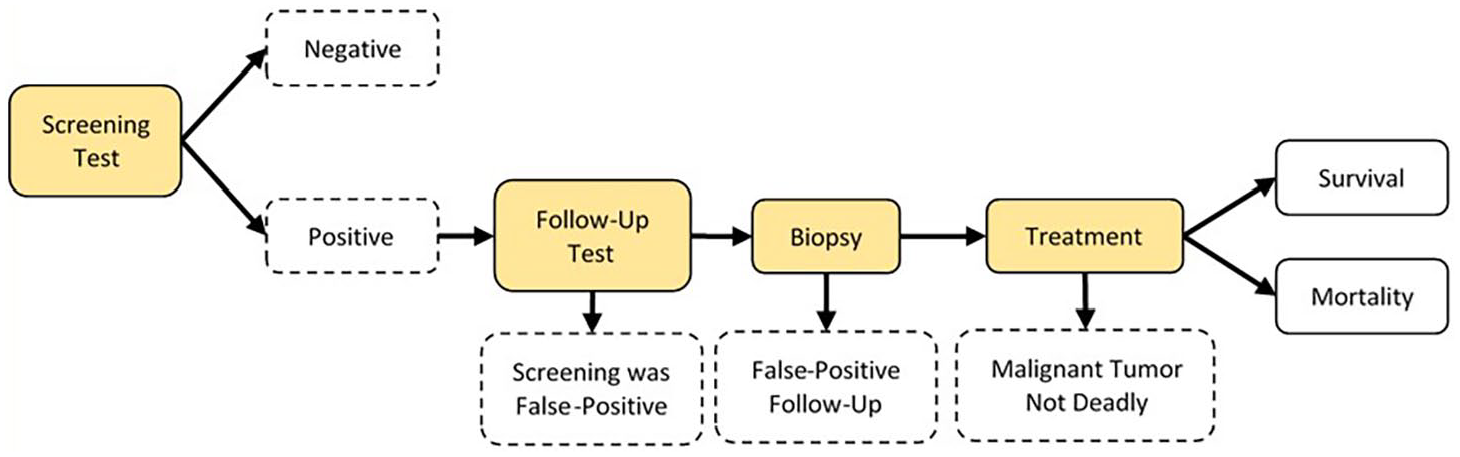
Generic Screening Test Scenario.
The probabilistic decision tree shown in the Appendix includes both the benefits and harms of cancer screening based on the generic scenario. The numerical probabilities shown as illustration are based on the mammogram performance data referenced above. 27 Table 1 summarizes the parameters used in the model and displayed in the decision tree.
Model notation.
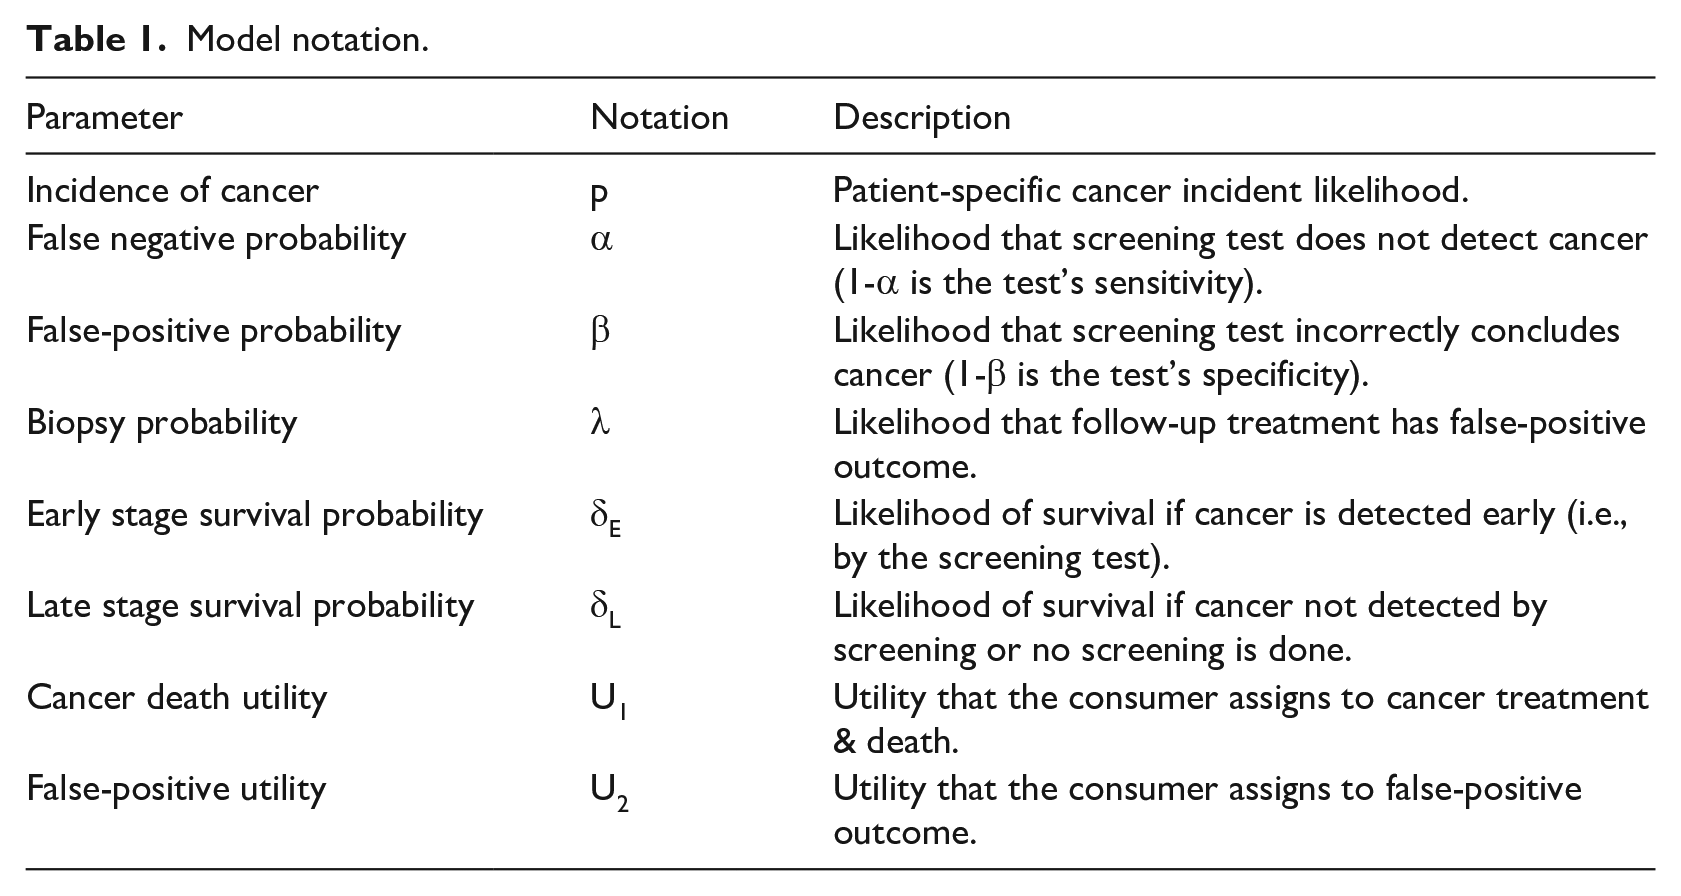
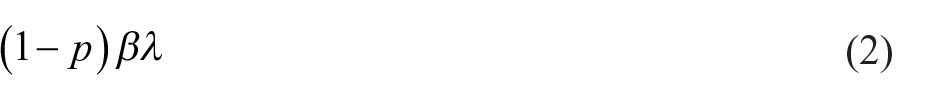
The two relevant utilities are both cost related. They are: (a) the utility the consumer assigns to cancer treatment and subsequent death (U1)—this likelihood is represented by equation (1), and (b) the utility the consumer assigns to the overdiagnosis harm associated with a false-positive outcome (U2). The false-positive outcome can be specified depending on the stage at which it is identified, such as an inconvenient follow-up test, an unnecessary biopsy, or unnecessary cancer treatment. Assuming that the false-positive outcome is an unnecessary biopsy, its likelihood is shown as equation (2).

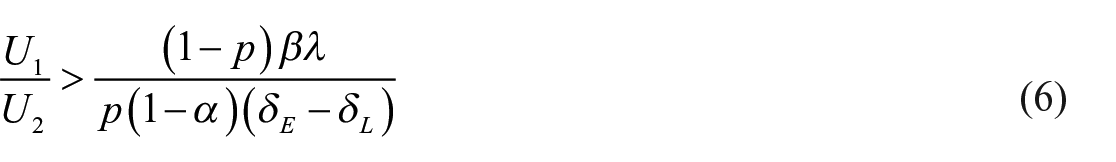
The model will identify the optimal decision based on the expected utilities for each alternative. When the false-positive outcome is defined as an unnecessary biopsy, the optimal decision is to accept screening when its expected cost is lower, as shown in equations (3–6). The ratio of the two utilities dictates the optimal decision. Equation (6) shows the conditions for which a person should accept the screening test, assuming that the false-positive outcome is defined as an unnecessary biopsy. It also shows that the ratio of utilities is equivalent to the ratio of: (a) the probability of a false-positive outcome, and (b) the screening test’s life saving likelihood.


Equation (7) shows the ratio of utilities that would cause an individual to accept cancer screening based on the mammogram performance data illustrated in the Appendix, where the false-positive outcome is an unnecessary biopsy. That is, if the individual’s utility ratio exceeds 57.2, then cancer screening would be accepted; otherwise, cancer screening would be declined.
Experimental design
The decision model would be implemented within a patient-centered DSS, where its effectiveness would depend on the accuracy of each consumer’s personalized utility ratio. Utilities are generally quantified indirectly based on information provided by a consumer. Often, utility functions are determined by presenting the consumer with a decision (i.e., two choices). Then, a systemic approach is used to determine the parameters at which the decision maker is indifferent.56,57
A set of controlled hypothesized cancer screening scenarios was presented to a group of study participants. For each hypothesized scenario, participants were asked to accept or decline screening using a procedure that identified their indifference point. This indifference point was then used to calculate each individual’s utility ratio. The scenarios were designed so that participants’ decisions could be evaluated based on changes in key decision parameters.
A modification of the EQ-5D-5L health status measurement protocol was used to quantify the range of potential overdiagnosis harms. 58 Others have used this protocol to determine health utilities.59,60 Five dimensions are included: Mobility, Self-Care, Usual Activities, Pain/Discomfort, and Anxiety/Depression. For example, the five levels for pain/discomfort are: 1 (no), 2 (slight), 3 (moderate), 4 (severe), and 5 (extreme). The consequences of a false-positive cancer screening outcome would mainly affect the last two of the EQ-5D-5L dimensions.
The experimental design controls two factors: (a) the pain level is amount of pain or discomfort expected to result from an unnecessary screening test (based on the EQ-5D-5L pain/discomfort dimension); and (b) the false-positive probability associated with specified pain level. The standard pain/discomfort definition were modified to include the approximate duration during which the patient would be affected by pain associated with overdiagnosis. Adding duration helps account for the EQ-5D-5L anxiety/depression dimension within the pain level factor. The primary experimental response, which provides the consumer’s indifference point, is the life saving likelihood associated with the screening test.
A central composite experimental design was used to model the indifference life saving likelihood (and, in turn, the utility ratio). Figure 2 shows the 12 experimental scenarios. The central composite design fits the second order empirical model shown in equation (8). It is important to include second order (i.e., nonlinear) effects because the ordinal EQ-5D-5L scale is based on categories that may not be linearly spaced. 61 The response (y) is the indifference life saving likelihood. The pain level and false-positive probability are represented by x1 and x2, respectively. The random error term is represented by ε, whose quantity is based on the four repeated center points.
Central composite experimental design.

Three uncontrolled factors were analyzed—gender, age, and marital status. The use of marital status is a surrogate that attempts to account for the “bread winner” effect. 45 Participation in the study was encouraged by excluding income and other sensitive personal information. It was assumed that screening (and treatment) would be paid by health insurance and therefore, ability to pay was not relevant.
The relationship between the experimental responses is based on equation (6). Participants were interviewed to determine their indifference life saving likelihood (y) which, in turn, is used to calculate the utility ratio at each experimental condition (equation (9)).
Data collection
For each hypothesized scenario, a decision aid (Figure 3) was used to present relevant information about the screening test. The use of a matrix is consistent with an approach proposed by others.27,55 The decision aid was designed to overcome decision bias by simultaneously presenting the most relevant but concise information using a graphical representation. The matrix consisted of 10,000 cells, with colors used to represent three potential outcomes: (a) the test was positive and your life was saved, (b) the test was positive but you did not have cancer, and (c) all other potential outcomes. Colors were chosen so that bias associated with color combinations did not lead to misinterpretation (this was verified by a sample of volunteers). By placing colors randomly in amounts corresponding to their likelihood, the decision aid was designed to convey randomness along with the relevant likelihood.
Matrix representation (25% false-positive probability, 0.32% life saving likelihood).
The participation of human subjects was approved by Boston University’s Institutional Review Board (Protocol #4836X). Study participants were primarily recruited from employees and alumni of the University. Forty-eight individuals were interviewed. They had a median age of 44 years, 52% were female, and 71% were married. Each interview involved personal contact between a researcher and a study participant. Interviews were done either in-person or on-line using teleconference software with two-way video. The interviews proceeded as follows:
Each study participant was told that they had a choice to accept or decline annual screening for 10 years and the generic screening test procedure was described. Its potential for preventing cancer deaths and its potential false-positive outcomes were explained. The typical treatment for cancer was described (this is consistent with EQ-5D-5L pain level 5).
One by one, each of the 12 experimental scenarios were presented to the participant in random order. For each scenario, the typical treatment for the false-positive outcome was described. For example, pain level 1 (an additional test with biological therapy to support your immune system, resulting in no pain or discomfort but some inconvenience for 1 month) or pain level 3 (surgical biopsy to extract a tumor followed by radiation therapy, resulting in moderate pain and discomfort for 3 months).
A matrix was presented with the relevant false-positive probability and a mid-range life saving likelihood. The user was asked to accept or decline the screening test. Based on this answer, the life saving likelihood was adjusted up or down (a maximum of 6 times using a binary search). These iterations continued until an indifferent life saving likelihood was determined.
Results
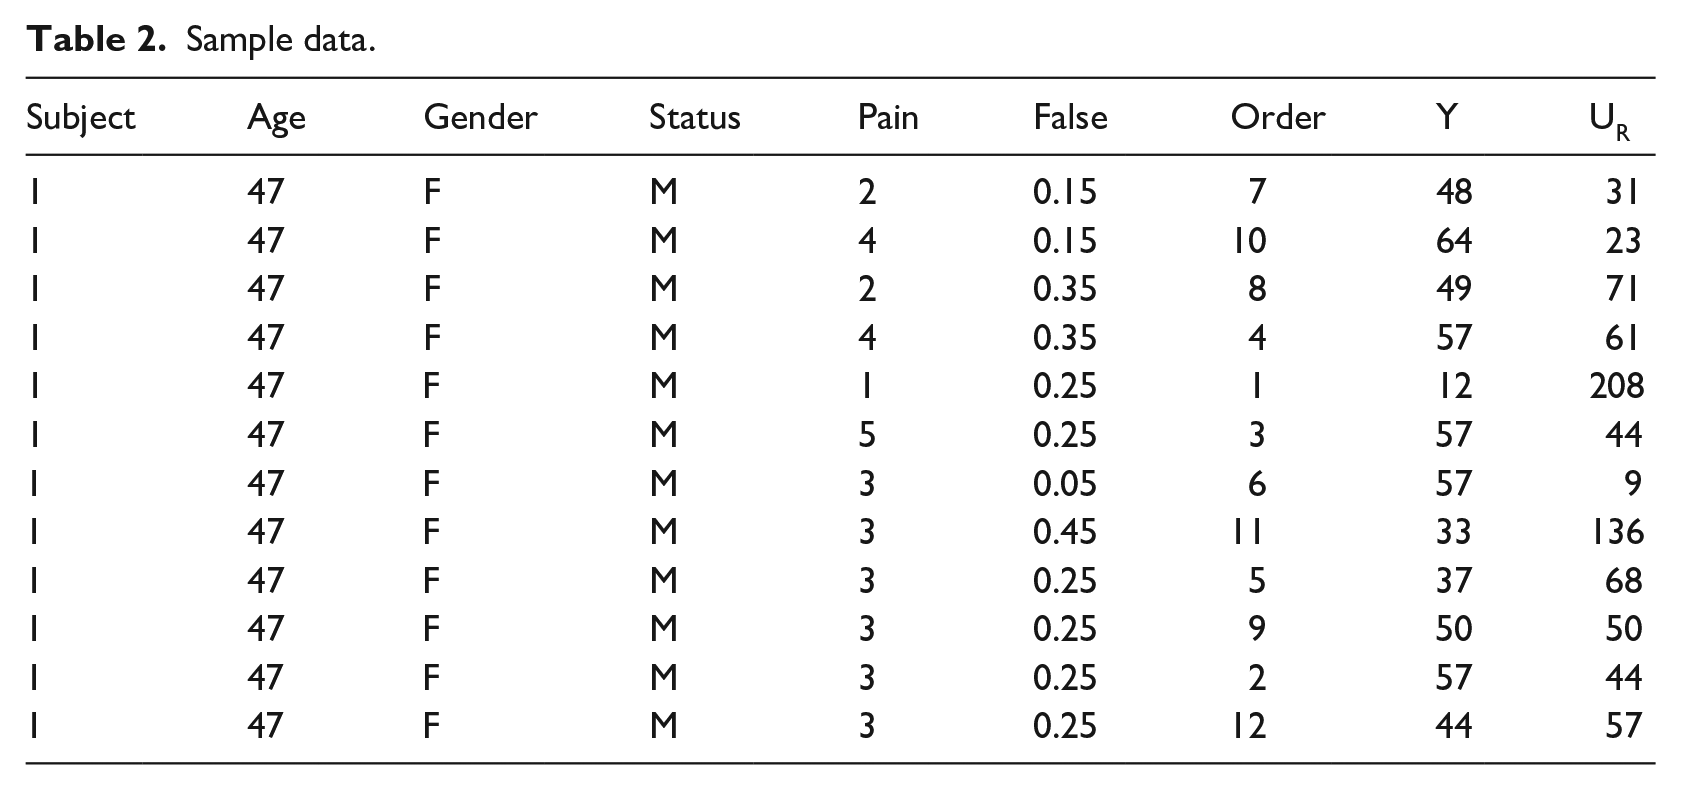
Table 2 shows a sample of data for a participant. The heading Y denotes the participant’s indifference life saving likelihood and UR is their utility ratio. The total of 576 outcomes were analyzed as 48 blocks of 12 responses each. MINITAB was used to perform the statistical analyses.
Sample data.
The average responses are shown in Figure 4, and empirical models for the average participant are shown as response surfaces in Figure 5. Although the data are analyzed statistically later in this section, it is useful to explore these results. The indifference life saving likelihoods increase as both the pain level and the false-positive probability increases (i.e., study participants are more likely to decline the screening test as either the false-positive probability or its pain level increases). The average utility ratios (shown in parentheses) decrease in proportion to the pain level, as expected. However, the utility ratios appear to increase as the false-positive probability increases. If statistically significant, this result would not be consistent with rational decision making.
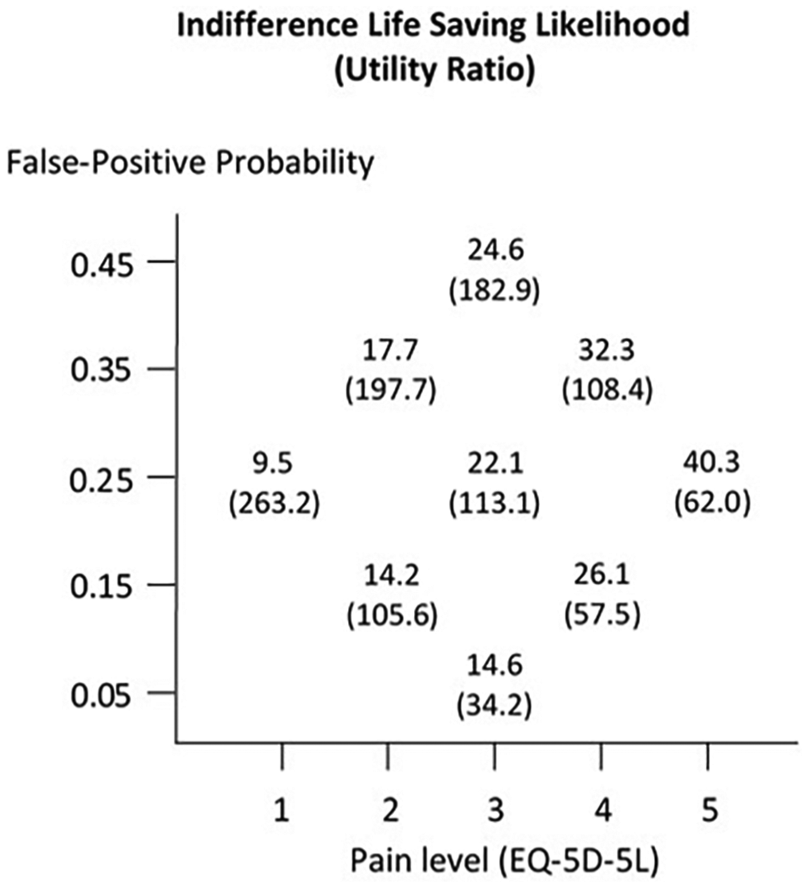
Average responses.
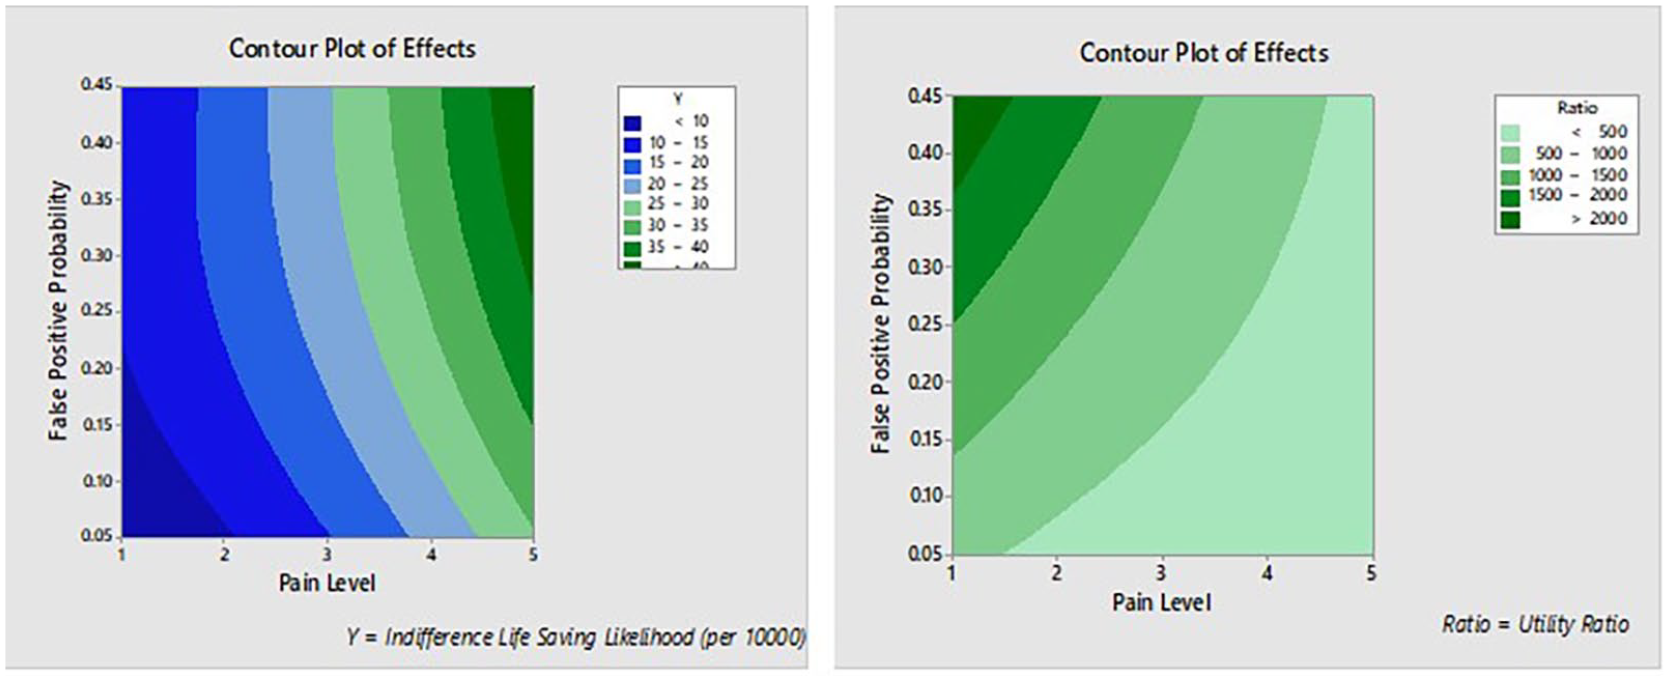
Contour plots of experimental results.
Analysis of indifference life saving likelihood
As expected, study participants differed in their average indifference life saving likelihood (p < 0.001), because of differences in their personal health preferences. It supports the viewpoint that cancer screening guidelines should be individualized, necessitating a patient-centered DSS.
The first order effects of both pain level and false-positive probability on participants’ indifference life saving likelihood were significantly (in both cases p < 0.001). Second-order effects and the interaction effect were not statistically significant (p > 0.05). The lack of a significant interaction effect means that the impact of changing the false-positive probability is consistent across the five pain levels. The analysis of residuals concluded that background noise was approximately normally distributed and that run order did not affect participant’s responses. Equation (10) shows the estimated average indifference life saving likelihood (

This indifference function is shown in Figure 6. Regions above the indifference function represent acceptance of the screening test. For example, if a screening test regimen had a 20% false-positive likelihood and this outcome would result in pain level 3, the average study participant would accept the test only if its life saving likelihood exceeded about 21 lives saved per 10,000 consumers.
Average indifference life saving likelihoods.
None of the other factors (age, gender, or marital status) had a statistically significant effect on the indifference likelihood (p > 0.05). This result implies that the roots of patient preferences may lie below the level of visible or quantifiable patient demographics.
Analysis of utility ratio
The natural log of utility ratios was used in the statistical analysis to assure normality. The first order effects of pain level and false-positive probability were significant (p < 0.001), as well as the second order effect of the false-positive probability (p = 0.036). The analysis of residuals concluded that background noise was approximately normally distributed. The pain level effect was expected because an individual’s utility ratio would be expected to vary by the magnitude of harm associated with the false-positive outcome. However, the significance of the false-positive probability is not consistent with rational decision making. The estimation equation with the significant effects is shown as equation (11).

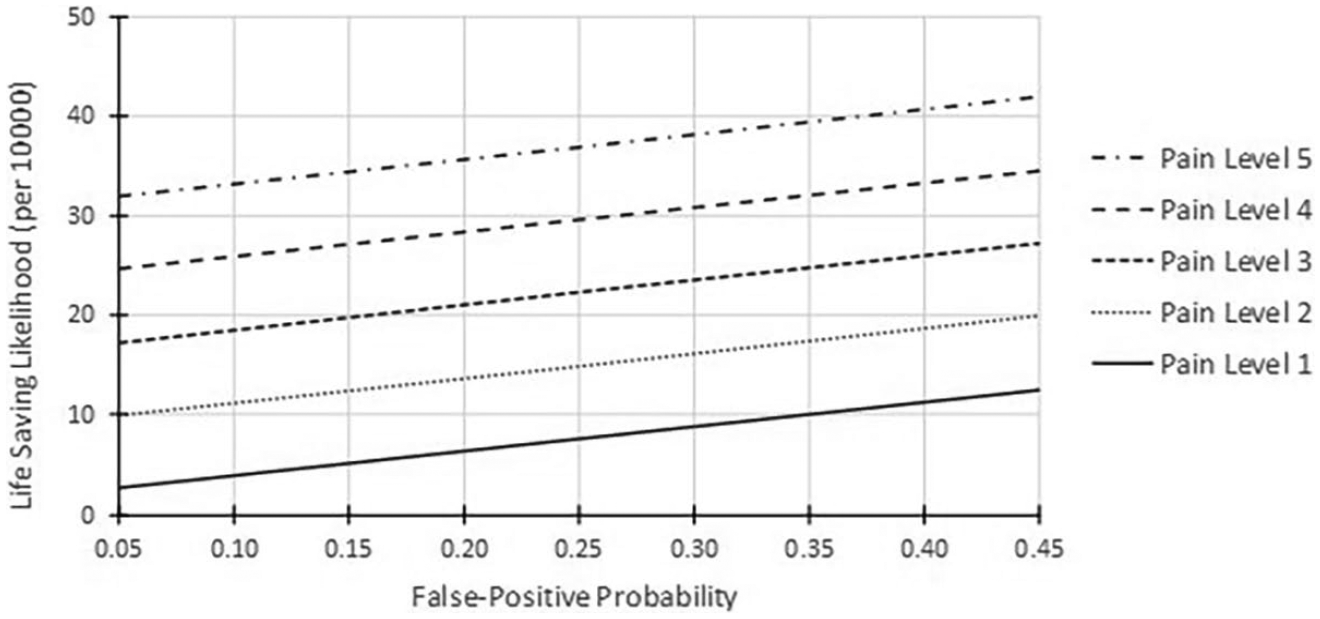
The utility ratio functions are shown in Figure 7. Rational decision makers would present as five horizontal and parallel functions with lower pain levels having greater utility ratios. Because the functions are monotonically increasing, it appears that participants rated the life saving as more important (higher utility) if the chance of overdiagnosis was higher. This effect could be associated with the inability of individuals to make sound decisions when the uncertainty levels are small. 62
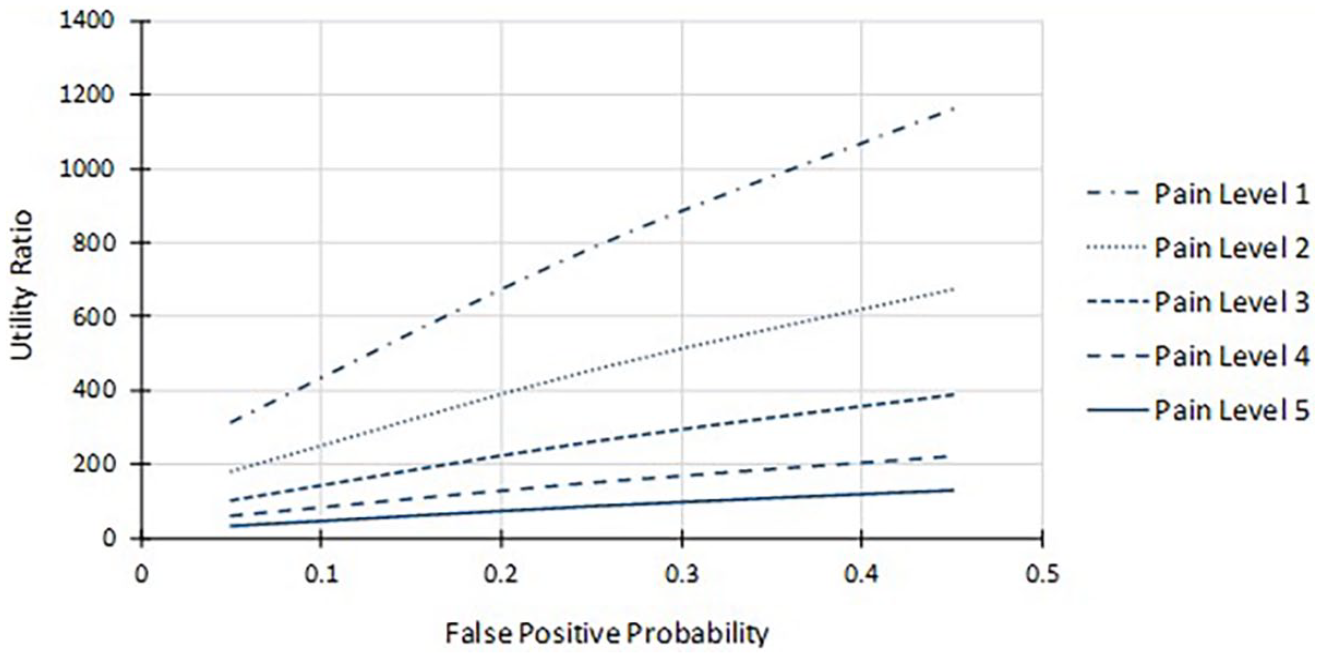
Utility ratios.
Figure 8 illustrates the irrational decision making revealed in the study. The functions shown are based on the average center point indifference life saving likelihood for pain level 3 (22.1 per 10,000). This value translates to a utility ratio of 113.1 (the 0.25 false-positive probability divided by 0.00221). The indifference function shown with the dashed line would exist were the decision maker rational (i.e., a constant utility ratio across all false-positive probabilities). However, the participants’ actual indifference function (the solid line) is inconsistent with this expectation. For example, applying the utility ratio of 113.1 to a false-positive probability of 0.05 would translate to an indifference life saving likelihood of 4.4 per 10,000 (the actual value was 17.3 per 10,000). Applying the utility ratio of 113.1 to a false-positive probability of 0.45 would translate to an indifference life saving likelihood of 39.8 per 10,000 (the actual value was 27.2 per 10,000).
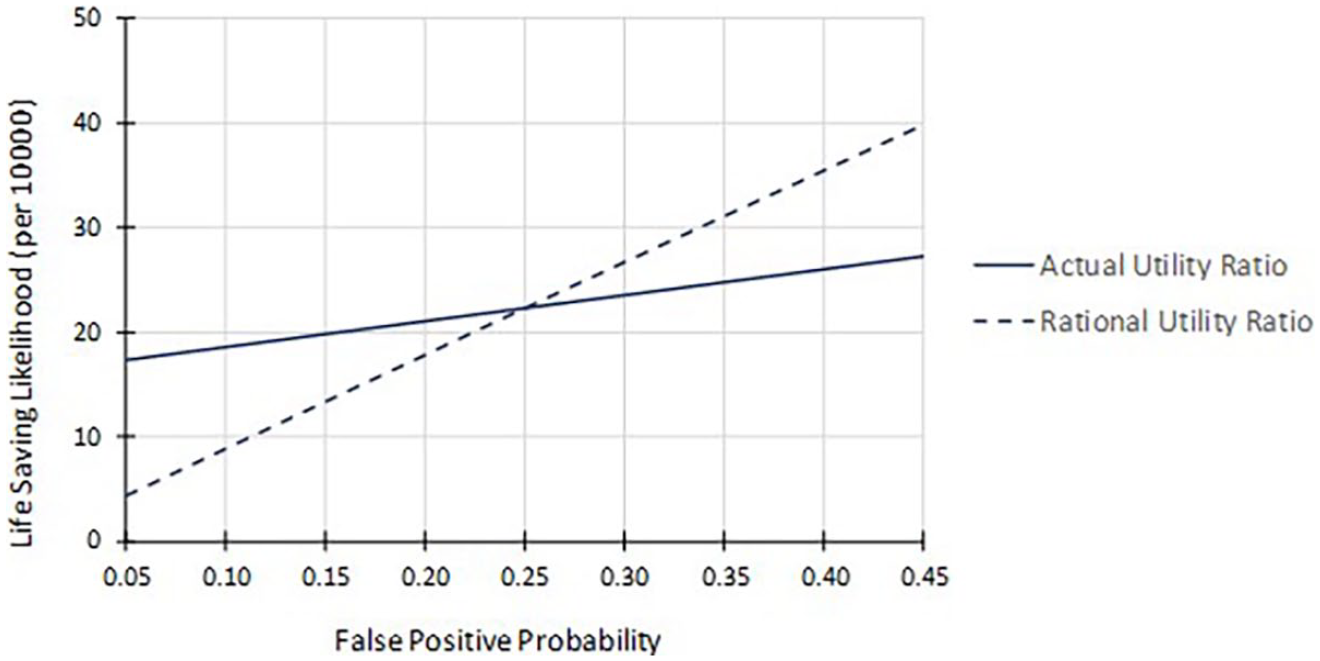
Comparison of rational and participant indifference (pain level 3).
Discussion
Many healthcare consumers are asked to participate in decision making as part of a shared decision process. Some experts argue that health consumers are ill equipped to perform this function effectively because they lack requisite knowledge and they are poor decision makers. 63 In fact, not every patient wishes to play a role in decision making. 64 Lessons can be learned from analogous settings, such as the shift of retirement planning from employer-controlled defined benefits systems to employee-controlled defined contribution systems. Research has consistently shown that individual investors are ill suited for this task. In 2017, for example, individual equity mutual fund investors underperformed the overall market by 4.7 percent points; at least half of this gap was attributed to behavioral factors. 65
This research concerned decision support for choices where potential benefits and potential harms are both subject to uncertainty. At its core, the decision is based on the ratio of two personal utility functions—one focusing on benefits and the other focusing on harm. The main contribution of this work is the quantification of personal utility that can be conveniently placed within a patient-centered DSS. The DSS can play a role in shared decision making, where clinicians and consumers would work together to make informed decisions. It could be modified to apply to many medical testing and treatment scenarios where potential benefits coexist with potentially impactful false positive outcomes or side effects. The approach applies to individualized decisions or decisions targeting clusters of healthcare consumers with similar utilities.
The research has some inherent limitations and exposes a particularly important concern. First, its application is only effective when a consumer has the ability to grasp the relationship between the decision aid’s structure and the reality of the treatment under consideration. Second, it relies on decision scenarios where two outcomes are considered (although this limitation should be easily overcome in future extensions). The research exposed that, in the presence of uncertain benefits and harms, health consumers’ decisions may be irrational. This finding is potentially important for both individual consumers and policy makers who seek to create system-wide recommendations or regulations. Future research directions include applying the methodology to a wider range of medical decisions, and the reconciliation of potentially irrational patient decisions with the recommendations of medical professionals.
Footnotes
Appendix
Declaration of conflicting interests
The author(s) declared no potential conflicts of interest with respect to the research, authorship, and/or publication of this article.
Funding
The author(s) received no financial support for the research, authorship, and/or publication of this article.