
Abstract
This study uses eye-tracking technology to assess the differences in gaze behaviours between ophthalmologists of different experience levels while interpreting retinal images of diabetic retinopathy. The differences in gaze behaviours before and after a teaching intervention which introduced a suggested search strategy is also investigated. A total of 9 trainees and 10 consultant ophthalmologists interpreted six retinal images. They were then shown a 5-min tutorial that demonstrated a search strategy. This was followed by six further retinal image interpretations. Participants completed questionnaires indicating clinical signs seen, appropriate retinopathy grade, and confidence. Eye movements were tracked during each interpretation.Overall, trainees compared to consultants demonstrated more uncertain and unstructured gaze behaviours. Trainee eye gaze metrics included: longer interpretation time, 36.5 s (SD = 6.2 vs. 31.4 s) (SD = 4.2) (p = 0.024), higher visit count, 17.38 visits (SD = 5.13) versus 12.18 visits(SD = 2.64) (p = 0.01), higher proportion of fixation, 57.0 per cent (SD = 5) versus 50.5 per cent (SD = 5) (p = 0.05) and shorter time to first fixation, 0.232 s (SD = 0.10) versus 0.821 s (SD = 0.77) (p = 0.001), respectively. The teaching intervention resulted in more focused gaze patterns in both groups. Pre-intervention and post-intervention mean proportion fixation on areas of interest were 38.6 per cent (SD = 6.8) and 51.8 per cent (SD = 13.9) for the trainee group, respectively, and 39.9 per cent (SD = 4.1) and 50.9 per cent (SD = 9.3) for the consultant group (p = 0.01).Consultants used more systematic and efficient approaches than trainees during interpretation. After the introduction of a suggested search strategy, trainees showed trends towards consultant eye gaze behaviours. Eye tracking gives an interesting insight into the thought processes of physicians carrying out complex tasks. The implication is that eye tracking may have future use in teaching and assessment. Its use in objectively assessing different teaching strategies could be a valuable tool for medical education.
Keywords
Introduction and background to study
The practice of medicine involves many highly visual tasks. Many specialties routinely involve visual interpretation: cardiologists interpret electrocardiograms (ECGs), radiologists and physicians interpret radiographs and pathologists interpret microscope slides for example. The difficulty in the past to understanding the processes behind image interpretation is that visual processes are largely unconscious and reporting of visual behaviour is often unreliable or incomplete. 1 Eye-tracking technology is the first objective technique that allows a more complete understanding of the processes behind the visual aspects of learning and performance. Eye tracking detects and measures the point of gaze. It has been shown in many studies to be reliable in analysing gaze patterns. 2 For example, eye-tracking technology has been used to analyse ‘global metrics’ such as heat maps and total time spent looking at areas of interest (AOI). 3
Search strategies used by ophthalmologists in interpreting retinal images are important to understand, as ophthalmologists use images to guide diagnostic reasoning and inform management decisions on a regular basis, for example, diabetic retinopathy screening.
Furthermore, capacity challenges in providing medical retinal care in United Kingdom to patients with age-related macular degeneration and retinal vein occlusions has led to innovative working practices, not least the adoption of ‘virtual clinics’. Thus, strategies for retinal image interpretation is a highly valid visual task to study as this mirrors what is done in routine patient care every day in many ophthalmology clinics.
The focus of this study is to identify if ophthalmologists have established specific search strategies for interpreting retinal images. For example, radiologists often have established mental checklists for interpreting chest X-rays (e.g. first check patient demographics, then look at bones, then hilar details, then lung apex, and so on.). 4 In identifying specific eye movements, light may be shone on cognitive processes, decision-making and possibly thereby the experience of the participant.
This study has two aims. First, to establish what differences there are between the eye gaze metrics of ophthalmology consultants and ophthalmology trainees. Comparing gaze patterns and search strategies used for a specific set of retinal images of consultant ophthalmologists (considered as ‘experts’) and trainee ophthalmologists (considered as ‘novices’) gives insight into when these search strategies are developed during a physician’s career and how consistently they are used.
Our second aim is to determine what changes are seen in the eye gaze metrics of both groups after an educational intervention. The intervention suggests a structured search strategy and the impact on gaze patterns of the experts and novices during a subsequent image interpretation session is analysed. It has been previously hypothesised that introducing a systematic search strategy into training may improve the accuracy and efficiency that trainees demonstrate while interpreting images. 5
Materials and methods
Ethical approval was granted by the Queens University Belfast Research Ethics Committee. A total of 10 trainees and 9 consultant ophthalmologists were recruited from one main teaching hospital in Belfast. Consultants with a specialist interest in diabetic eye disease were excluded, as were trainees within 1 year of completion.
All participants were briefed on the study protocol and gave informed signed consent. Each participant was then ‘calibrated’ by the eye-tracking software to ensure optimal accurate readings. They were then asked to interpret six retinal images while their eye movements were tracked using the Tobii X60 eye-tracking device. 6 Once image interpretation was completed, they were asked to describe any pathology they found and the most appropriate grade of diabetic retinopathy, which allowed an accuracy score to be calculated. They were also asked to grade from 1 to 5 how confident they were in these findings (5 being most confident). This was followed by a short PowerPoint tutorial outlining a suggested search strategy and outlining the currently accepted diabetic retinopathy grading criteria. Then, a further six retinal image interpretations were performed after the completed tutorial.
In total, 12 anonymised retinal images demonstrating a range of diabetic retinopathy grades were randomly selected. The areas of interest for each image were selected to reflect the search strategy suggested in the educational intervention, that is, optic disc, macula, areas of vascular pathology, peripheries and any other pathology.
All of the retinal images were interpreted independently by three diabetic retinal sub-specialists (‘super-experts’) who routinely perform retinopathy grading. They were each asked to identify pathology and the associated grade of diabetic retinopathy. All pathologies identified by super-experts were taken to be correct clinical findings. The grade assigned by the ‘super-experts’ was taken to be the ‘correct’ grade of diabetic retinopathy. All three super-experts agreed on grade of retinopathy in nine cases. In three cases, agreement of two of the three super-experts was achieved.
The Tobii X60 device involves a non-intrusive unit that sits below the monitor and tracks corneal reflections of an infrared light that the unit emits. It has accuracy of 0.5° and a sampling rate of 60 Hz (recording Cartesian eye gaze coordinates every 16.7 ms). 6 The Tobii studio software determines eye gaze metrics for the whole retinal image and each area of interest, included time to first fixation, fixations before, first fixation duration, total fixation duration, fixation count, Mean visit duration, total visit duration and visit count.
The suggested search strategy was demonstrated using a colour-coded flow chart with four steps: to first look at the optic disc, then the macula, then the vessels and finally the peripheries. Each step was further described and key features were shown that may be found in each of these areas. To improve retention, this flow chart was shown at several stages through the presentation, and discussion slides where also colour coded. The final slides in the presentation outlined the accepted grading protocol of diabetic retinopathy as described by the early treatment diabetic retinopathy study scale. The aim of this education intervention is to give structure to image interpretation and improve efficiency which is a recognised technique applied to other tasks such as chest X-ray interpretation. 4
Data were exported from the Tobii software and analysed using statistical analysis software (SPSS, v24; SPSS Inc., Chicago, IL, USA). Statistically significant differences between expert and novice group data were analysed using a non-parametric test, namely, the Mann–Whitney U test with an alpha value of 0.05. Where appropriate, bivariate correlation was determined producing a Pearson correlation coefficient.
Results
A total of 19 participants were recruited to the study, 10 males and 9 females. The participants were grouped according to their experience: consultants (‘experts’) and trainees (‘novices’). The ‘novice group’ consisted of 9 trainee ophthalmologists (8 males and 1 female). The ophthalmology trainees were further sub-categorised by years of service, with 5 ‘junior’ trainees having 2 or less years’ experience and 4 ‘senior’ trainees having 3 or more years’ experience. A total of 10 consultant ophthalmologists (2 males and 8 females) made up the ‘expert group’. The consultants were further sub-categorised by their area of specialisation being medical retina or non-medical retina, consisting of four and six participants, respectively.
One consultant participant was unable to be calibrated due to excessive movement, and therefore no eye gaze data could be obtained. As they still completed their questionnaire under study conditions, their clinical findings, diagnosis and confidence ratings were still used. The eye-tracking software failed for technical reasons during the post-intervention analysis for one of the trainee participants, so only the pre-intervention data could be included for this participant. To account for this when analysing the data, mean results for the pre-intervention groups where calculated based on nine consultants and nine trainees and for the post-intervention group, nine consultants and eight trainees, this needs to be taken into consideration when interpreting the outcomes.
Accuracy score
An ‘accuracy score’ was determined for each interpretation by combining the score for correct grade of diabetic retinopathy (DR) and correct clinical findings. For a correctly identified grade of DR one point was allocated and for an incorrect grade of DR no points were allocated. Similarly, for a correct clinical finding one point was allocated and for a missed or incorrect clinical finding one point was deducted. The authors felt that deducting a point for missed or incorrect findings was valid in this research context, as missing a vital clinical finding or incorrectly stating a clinical finding could have negative implications for a patients’ diagnosis and treatment.
Overall, the consultant group achieved a higher mean accuracy score than the trainee group, 2.46 (SD = 1.22) and 1.83 (SD = 1.22), respectively, however this was not statistically significant (Mann–Whitney U test, p = 0.242).
For all the groups taken together, there was no significant difference between accuracy score pre- and post-intervention. Trainees attained a mean score of 1.91 (SD = 0.82) pre intervention and 1.76 (SD = 2.00) post intervention (p = 0.755). Consultants scored an average 15.2 (SD = 5.1) pre intervention and 14.3 (SD = 4.7) post intervention (p = 0.818).
Confidence
Confidence rating was reported after each image interpretation using a Likert-type scale with 5 representing very confident and 1 representing not very confident. The mode for all confidence gradings was 4 for trainees and consultants and this did not change between pre-intervention and post-intervention.
The Pearson correlation coefficient was 0.571 (p < 0.001) suggesting a strong positive correlation between total confidence rating and total accuracy score (Figure 1).
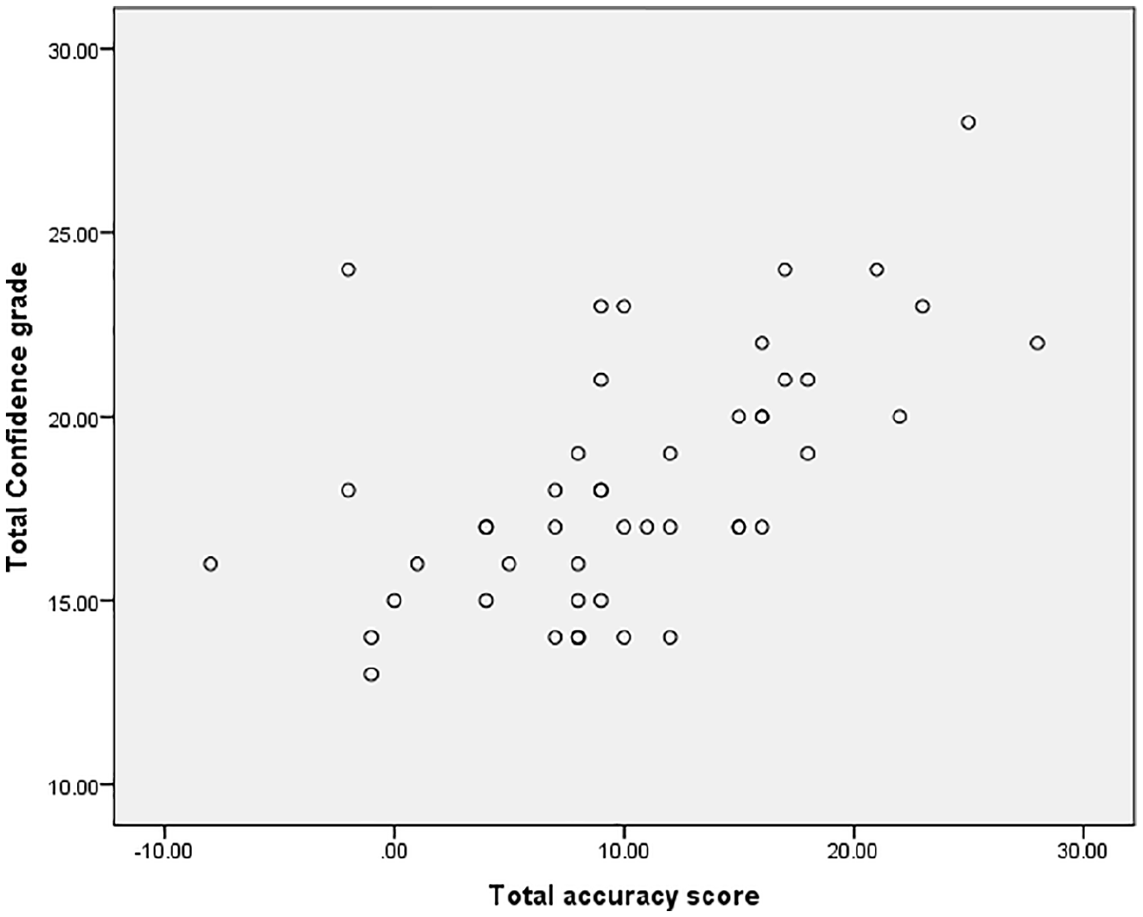
Correlation scatter plot between total confidence grade and total accuracy score.
Interpretation duration
Interpretation duration represents the duration of time in seconds spent interpreting each retinal image. The trainees spent significantly longer on average interpreting the images than the consultant group, mean durations were 36.5 s (SD = 6.2) and 31.4 s (SD = 4.2), respectively (p = 0.024) (Table 1).
Differences in eye gaze metrics between experts and novices.
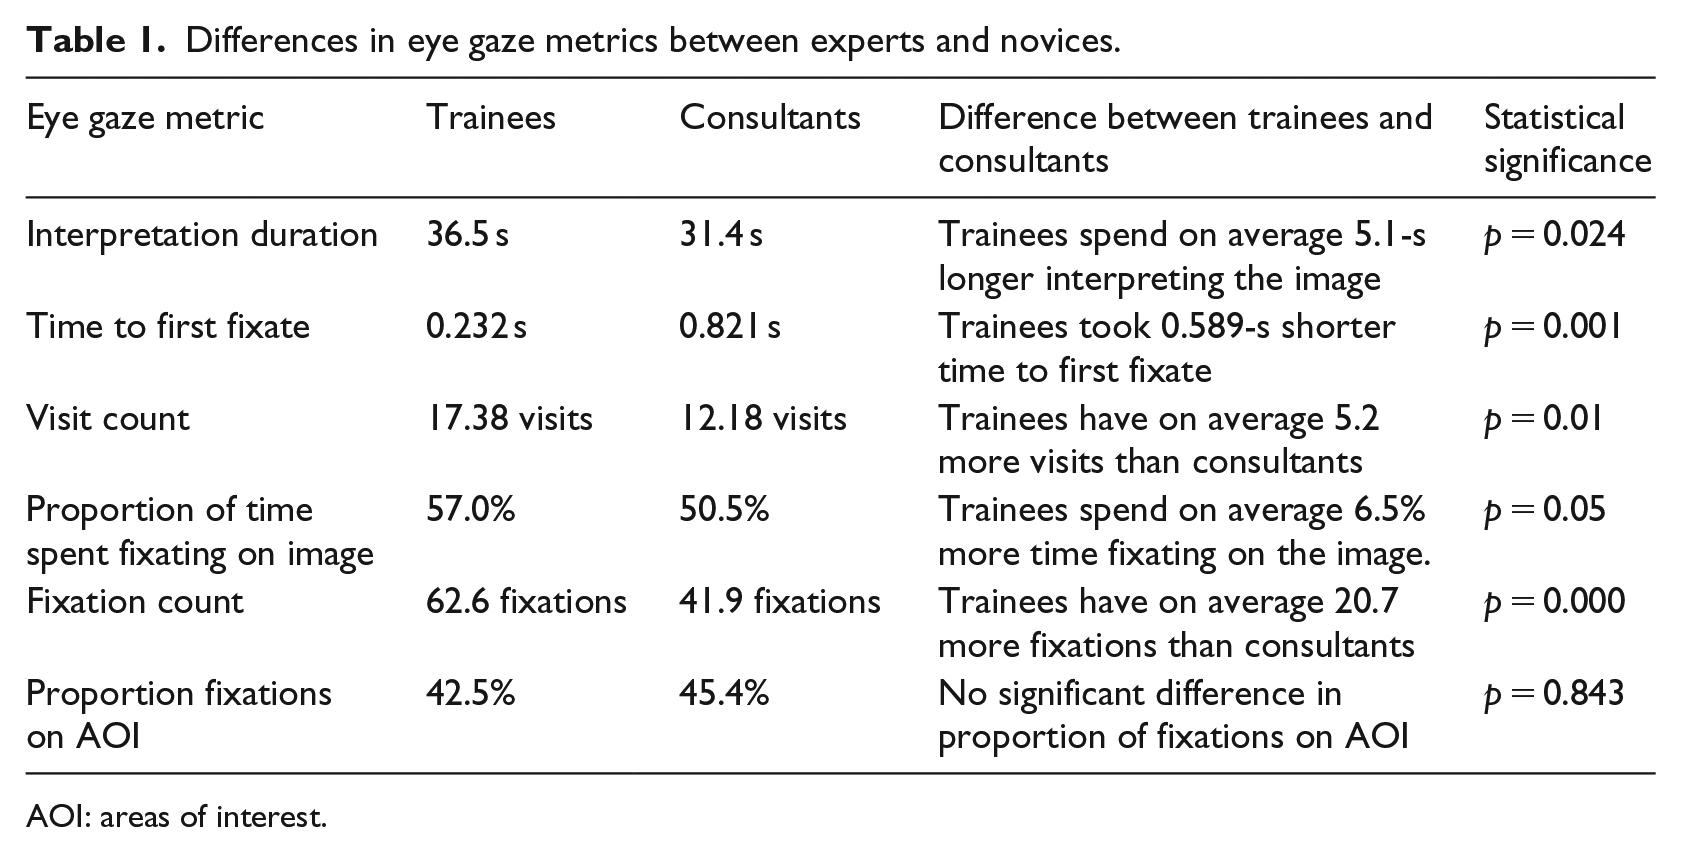
AOI: areas of interest.
Both groups spent significantly longer interpreting the images post intervention than pre intervention. For the trainee group, the mean duration for the pre-intervention images was 33.8 s (SD = 4.5 s), and 39.3 s (SD = 6.7 s) for the post-intervention images (p = 0.038). For the consultant group, the mean duration for pre-intervention images was 29.6 s (SD = 2.4 s), and 33.2 s (SD = 4.7 s) for the post-intervention images (p = 0.045).
Time to first fixation
Time to first fixation represents the length of time it takes from the start of the interpretation to fixating on any area of the total image. The trainees had a significantly shorter time to first fixation compared to consultants, with a mean time to first fixation of 0.232 s (SD = 0.10) and 0.821 s (SD = 0.77), respectively (p = 0.001) (Table 1).
However, there was no statistical difference between the pre- and post-intervention groups for either experience level. For the trainee group, pre-intervention mean time to first fixation was 0.246 s (SD = 0.09), and 0.219 s (SD = 0.11) for post intervention (p = 0.818). For the consultant group, pre-intervention mean time to first fixation was 0.739 s (SD = 0.714), and 0.903 s (SD = 0.89) for post intervention (p = 0.932).
Visit count
A visit is defined as a period of time when the participant directs gaze towards an area of interest. This includes at least one fixation but could be a brief glance or include multiple fixations.
Trainees were found to have a significantly higher visit counts than consultants, with trainee mean visit count 17.38 visits (SD = 5.13) and consultant mean visit count 12.18 visits (SD = 2.64) (p = 0.01) (Figure 2).
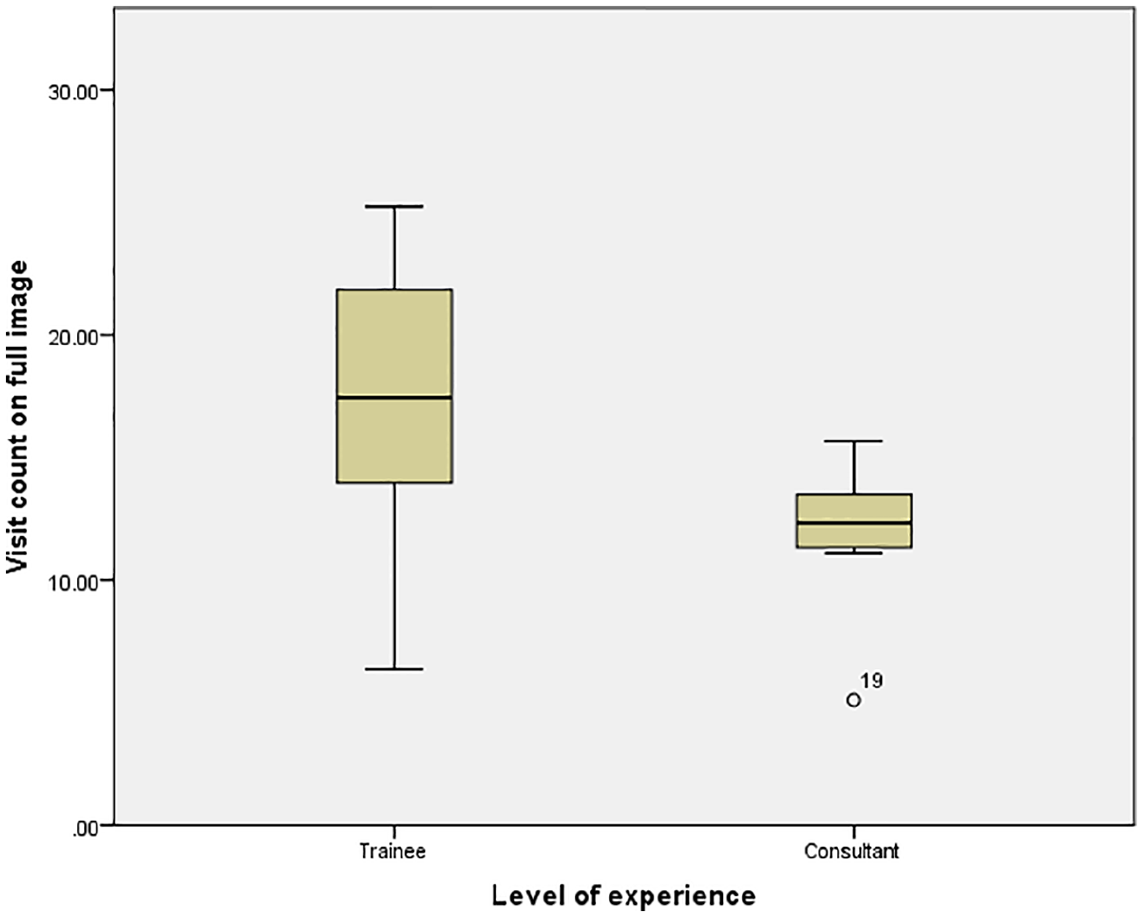
Visit count according to level of experience.
There was no significant difference found in visit count for either group between the pre- and post-intervention interpretation. Trainees had a pre-intervention mean visit count of 17.22 visits (SD = 3.74), and 17.54 visits (SD = 6.61) for post intervention (p = 0.786). The consultant group mean visit count for pre-intervention was 11.94 visits (SD = 0.83), and 12.43 visits (SD = 3.82) for post intervention (p = 0.551).
Proportion of time spent fixating on image
Fixation is classed as a prolonged gaze at a specified area. Trainees spent a significantly higher proportion of the time fixating on the image than the consultant group, with mean proportion fixation 57.0 per cent (SD = 5) and 50.5 per cent (SD = 5), respectively (p = 0.05) (Table 1).
For the trainee group, mean proportion of time fixating for pre-intervention images was 59.7 per cent (SD = 5.2%), and post-intervention images was 54.5 per cent (SD = 3.4%) (p = 0.028).
For both groups, there was a reduced proportion of time fixating on the image after intervention. A more marked effect was seen in the trainee group than the consultant group, with a difference in proportion between pre- and post-intervention of 5.19 per cent and 2.7 per cent, respectively.
Fixation count
Fixation count is the number of times the participant fixated on the image during the interpretation time. Consultants were found to have a lower fixation count than trainees, with mean fixation count 41.9 fixations (SD = 3.8) and 62.6 fixations (SD = 7.3), respectively (p = 0.000) (Table 1).
Proportion of fixations on AOI
The proportion of fixations on AOI is the percentage of the total fixations that are directed at areas of pathology or important areas for diabetic retinal examination.
There was no significant difference between the different experience groups for the mean proportion of fixations spent on AOI. For trainees, the mean proportion of fixations on the AOI was 45.2 per cent (SD = 12.6) compared to 45.4 per cent (SD = 9.0) for the consultant group (p = 0.843).
However, both groups had a significant difference between the proportion of fixations on AOI before and after the teaching intervention. For the trainee group, pre-intervention and post-intervention mean proportion fixations on AOI were 38.6 per cent (SD = 6.8) and 51.8 per cent (SD = 13.9), respectively. For the consultant group, pre-intervention mean proportion of fixations on AOI was 39.9 per cent (SD = 4.1), and 50.9 per cent (SD = 9.3) for post intervention (p = 0.01) (Table 1).
Full coverage
Full coverage of the image was taken as all AOI being fixated on at some point during the interpretation. For this analysis, the experience groups were further sub-divided into junior trainees, with 2 or less years of experience, senior trainees, with 3 or more years of experience, medical retina specialists and non-medical retina specialists.
When the four sub-divided groups where compared for their percentage achievement of full coverage, there was a significant difference between groups. Junior trainees achieved full coverage 67 per cent (SD = 22.3) of the time, with senior trainees, non-medical retina consultants and medical retina consultants achieving full coverage 66.7 per cent (SD = 30.8), 41.63 per cent (SD = 28.9) and 43.1 per cent (SD = 20.7), respectively (p= 0.019) (Table 2). Consultants were found to have lower percentage full coverage achieved, with moderate negative correlation between experience and full coverage achieved, Pearson correlation coefficient −0.442 (p = 0.002).
Full coverage achieved, and percentage AOI missed.
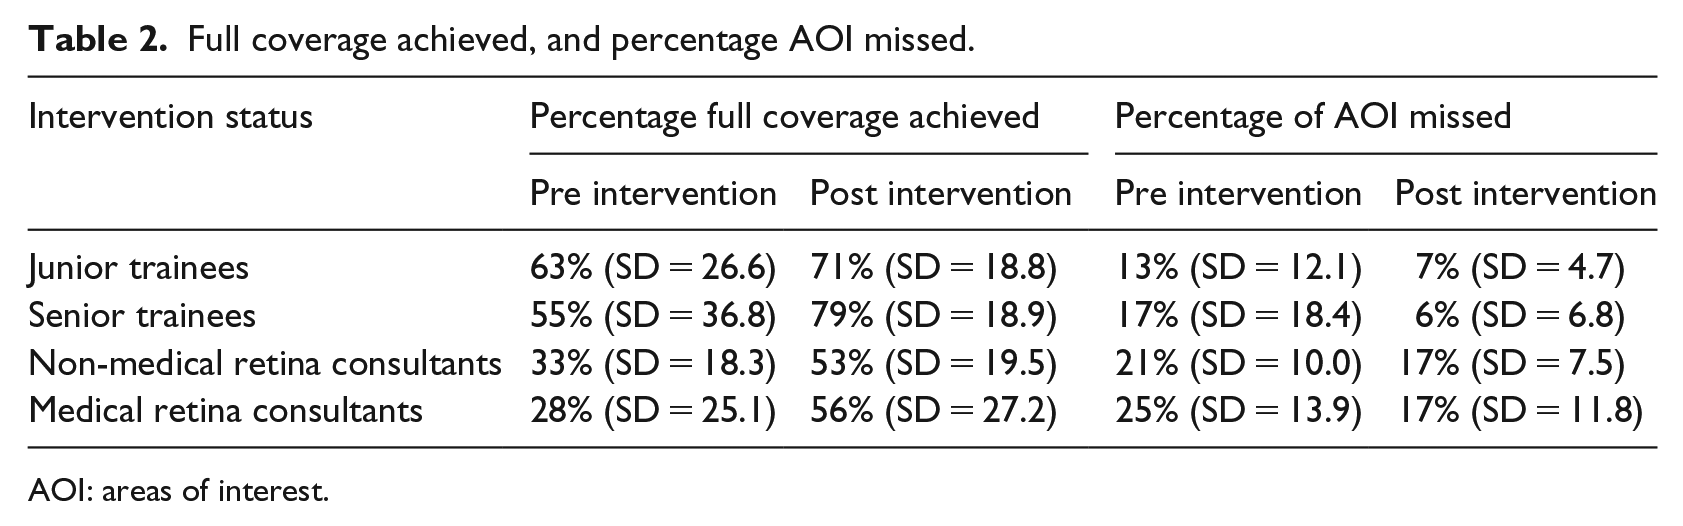
AOI: areas of interest.
The junior trainees achieved full coverage 63 per cent (SD = 26.6) pre intervention and 71 per cent (SD = 18.8) post intervention, demonstrating an improvement of 8 per cent post teaching intervention (p = 0.818). The senior trainees showed the greatest improvement after the teaching intervention, although statistical significance was not found, with 55 per cent (SD = 36.8) achieving full coverage prior to the intervention and 79 per cent (SD = 18.8) after the intervention, an improvement of 24 per cent (p = 0.240) (Table 2).
Medical retina specialists were the main group to show statistically significant differences in full coverage. Achieving full coverage 28 per cent of the time (SD = 25.1) pre intervention and 56 per cent (SD = 27.2) post intervention (p = 0.041). Non-medical retina specialists had full coverage of 33 per cent (SD = 18.3) pre intervention and 53 per cent (SD = 19.5) post intervention (p = 0.132). Again, statistically significant correlation was found between improved percentage full coverage achieved and post intervention interpretations, Pearson correlation coefficient 0.359 (p = 0.012).
Missed AOI
There are multiple AOI in each retinal image. Some participants fixate on all of these and some only fixate on a proportion during the interpretation. For those participants that do not fixate at any point during the interpretation on one of these AOI, this is classed as a missed AOI. This is another measure of image coverage but represents in more depth how many AOI were missed if full coverage was not achieved.
Comparison between experience groups showed statistically significant differences. With trainees missing on average 10.7 per cent (SD = 11.8) of the AOI and consultants missing on average 20.0 per cent (SD = 10.9) (p = 0.001). A moderate positive correlation was also found, demonstrating more experienced participants had a higher percentage of missed AOI, Pearson correlation coefficient 0.386 (p = 0.007).
The junior trainees missed on average 13 per cent (SD = 12.1) of AOI pre intervention and 7 per cent (SD = 4.7) post intervention (p = 0.589). The senior trainees missed 17 per cent (SD = 18.4) AOI pre intervention and 6 per cent (SD = 6.8) post intervention (p = 0.310). Therefore, the senior trainees showed a greater reduction in missed AOI post intervention than the junior trainees, with a reduction of 11 per cent and 6 per cent, respectively (Table 2).
The medical retina specialists missed on average 25 per cent (SD = 13.9) of AOI pre intervention and 17 per cent (SD = 11.8) post intervention (p = 0.818). Non-medical retina specialists missed on average 21 per cent (SD = 10.0) AOI pre intervention and 17 per cent (SD = 7.5) post intervention (p = 0.240). Therefore, no statistical difference found between the different experience levels within the consultant group. There was however an overall improvement of 5 per cent fewer missed AOI post intervention (Table 2). A moderate correlation was found, demonstrating that fewer AOI were missed post intervention, Pearson correlation coefficient −0.299 (p = 0.039).
Heat maps
Heat maps demonstrate the distribution of the gaze on the retinal image. Heat maps were generated for all participants in the consultant group and all participants in the trainee group, for each retinal image.
The heat maps were generated on the basis of fixation counts and are scaled as demonstrated on each heat map with deep red corresponding to the denoted fixation count. Green therefore denotes areas of lower fixation count.
For the six pre-intervention images, the consultant group demonstrates more areas of high fixation count, denoted by red ‘heat’, which are more evenly distributed throughout the AOI. Comparing this to the trainee heat maps, we can see that there is similar distribution of ‘heat’ representing fixations, however they demonstrate fewer areas of very high ‘heat’ markers representing intense fixation on fewer areas (Figure 3).
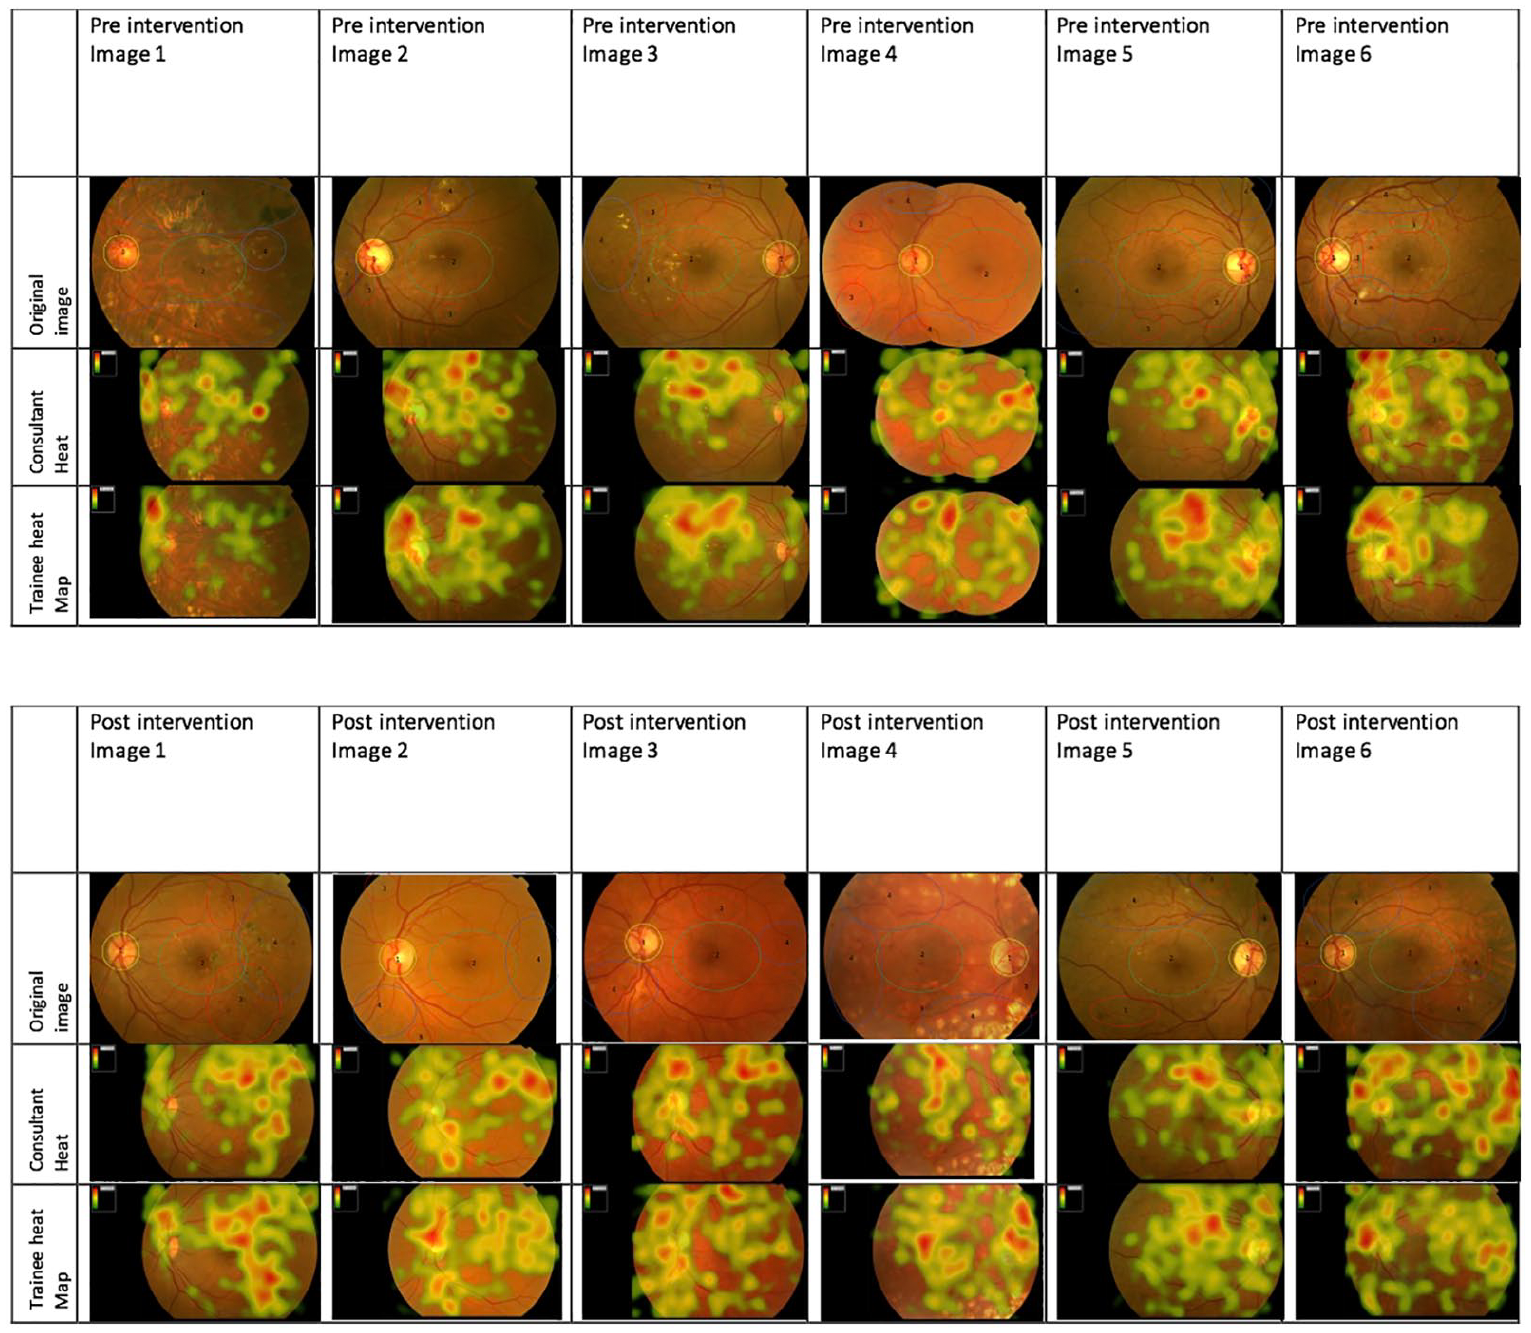
Heat maps for total consultant group and total trainee group for pre-intervention and post-intervention images.
Post-intervention heat maps demonstrate a shift in heat map patterns. Both consultants and trainees show a much better distribution on the heat markers in the post-intervention images. Trainees particularly show more areas of high ‘heat’ signal distributed over more AOI (Figure 3).
Discussion
In this study, consultant ophthalmologists used a more systematic and efficient approach than trainee ophthalmologists in interpreting diabetic retinopathy images. This was demonstrated using eye gaze technology, which showed that consultants had a shorter interpretation time, a longer time to first fixation, reduced visit and fixation counts, and most importantly improved accuracy scores and confidence in diagnosis.
With the introduction of a suggested search strategy and after a short teaching intervention, the trainees showed trends towards the eye gaze behaviours of consultants in the areas of proportion fixation, fixation count and proportion fixation on AOI. This suggests that implementing a suggested search strategy to trainees can improve their ability to scan the image and only fixate on areas of clinical relevance rather than spending unnecessary time on normal retina.
Unfortunately, this did not translate into improved diagnostic accuracy in either group and this may reflect that short-term teaching interventions cannot replace the experience that comes with clinical practice and exposure to many patients with these findings. This finding was also eluded to by Warren et al. 7 who found that active teaching with repeated case examples was more effective than traditional lecture style teaching.
Despite little impact on accuracy, there is still merit in improving efficiency which was seen as a result of applying the search strategy. Although the applicability of search strategies in many areas of medicine has not yet been established, there have been several studies in radiology were systematic viewing and checklist type training have resulted in improved physician performance.8,9 Therefore, it is likely to have wider merit beyond diabetic retinopathy grading and is worth further investigation. The possible implication would be with time and practice in using these strategic approaches to interpretation, that diagnostic accuracy could improve, and clinical care impacted for the better.
The role that eye gaze technology has in allowing assessment and deeper insight into interpretation is clear. If we had only analysed accuracy scores in this study, we would have found little differences between the experience groups. However, the in-depth detail that is provided by the eye gaze metrics reflects the significant differences in how visual tasks are performed between physicians of different experience. Kelly et al. 10 reported similar findings, with registrars in their study having similar eye-tracking behaviour as consultants but lower levels of diagnostic accuracy, suggesting interpretation skills may predate expert diagnostic skills. With further investigation into these metrics and the role they have as markers of efficiency, they could be used as a tool to assess trainees transitioning into consultant roles. Eye tracking could give a better insight into how students or trainees come to the diagnostic conclusions that they do, engendering relevant reflection and discussion.
User experience (UX) researchers using eye-tracking technology recognise the superior insight it gives into the complete UX including recognising behaviours that participants cannot accurately describe. One limitation to consider is that eye tracking may impact on the participant behaviour during the task, however, the tracking device used during this study was a non-intrusive unit below the monitor and once the task is underway it is felt that most participants forget it is there and it has minimal impact of physician practice. 11 In the particular area of ophthalmology, there are many allied health professionals taking up extended roles, for example, optometrists, orthoptists and nurses. In the area of diabetic retinopathy screening, the use of eye-tracking metrics may be an additional training tool and provide quality assurance of work for professionals as they train in this skill. O’Meara et al. 12 showed in their study that the use of eye-tracking feedback combined with video feedback resulted in 90 per cent of students reporting greater insight into their performance. The knowledge of the gaze strategies used and how these may be improved or adjusted to be more efficient could add to the robust and varied training tools available in this area.
The potential of eye tracking as a formative tool is formidable, as trainees could learn in an objective way how they grade DR images. Time is finite in clinical practice, and while accuracy should never be sacrificed to save time, if accuracy can be maintained and time saved learning a new search strategy, there would be benefits for public health as a whole, for example, as any individual could grade more patients’ images.
The role of eye tracking as an objective and useful assessment tool has previously been recognised by Tien et al. 13 Further studies could directly compare current summative assessment modalities, for example, objective structured clinical examinations (OSCEs), with eye-tracking technology as an assessment tool. 13 The use of eye tracking as a proxy measure of clinical experience would require much more data to ensure that eye gaze behaviour robustly reflected experience, and some would argue that the outcome of any clinical task matters, rather than how the outcome is reached.
Eye tracking is an ever-improving technology and its application in medical education and assessment has great potential. This study has demonstrated its role in assessing medical teaching strategies and their impact. Further studies into other teaching techniques could guide how we teach and assess students and doctors in the future.
Footnotes
Declaration of conflicting interests
The author(s) declared no potential conflicts of interest with respect to the research, authorship and/or publication of this article.
Ethical approval
Ethical approval was granted by the Queens University Belfast Research Ethics Committee.
Funding
The author(s) received no financial support for the research, authorship and/or publication of this article.