
Abstract
Numerous reports describe unintended consequences of electronic health record implementation. Having previously described physicians’ failures to recognize patient safety issues within our electronic health record simulation environment, we now report on our use of eye and screen-tracking technology to understand factors associated with poor error recognition during an intensive care unit–based electronic health record simulation. We linked performance on the simulation to standard eye and screen-tracking readouts including number of fixations, saccades, mouse clicks and screens visited. In addition, we developed an overall Composite Eye Tracking score which measured when, where and how often each safety item was viewed. For 39 participants, the Composite Eye Tracking score correlated with performance on the simulation (p = 0.004). Overall, the improved performance was associated with a pattern of rapid scanning of data manifested by increased number of screens visited (p = 0.001), mouse clicks (p = 0.03) and saccades (p = 0.004). Eye tracking can be successfully integrated into electronic health record–based simulation and provides a surrogate measure of cognitive decision making and electronic health record usability.
Keywords
Introduction
Electronic health record (EHR) use has demonstrated rapid growth over the last decade. This growth has been fueled in part by substantial advancements in technology, the use of financial incentives for their adoption and an increasing belief in the ability of the EHR to serve as a tool to improve patient safety and quality.1–3 However, with higher adoption rates, an increasing number of reports have documented numerous unintended consequences to their use. Specifically, a number of studies suggest that key issues, such as those associated with poor implementation strategies, increased data density afforded by EHRs and alert fatigue, have hindered successful use and at times have even increased the number of adverse events.4–6 These reports are most prevalent in intensive care unit (ICU) environments, where the combination of high data density, suboptimal data finding and high incidence of alert fatigue all combine and conspire to negatively affect healthcare delivery.4,7
With increasing evidence of EHR-related patient harm, the American Medical Informatics Association (AMIA) Board of directors convened a taskforce, which recommended special emphasis to usability-related principles in the design of EHRs in order to improve patient safety. 8 This requires a shift in the current paradigm of EHR use and training. Such a paradigm shift needs to overcome significant barriers. One significant barrier is related to the variability in both clinical EHR use and deployment. When observing real-life users of the EHR in the context of daily work, there are a number of use characteristics associated with efficiency. This may include specific proficiencies with order entry, data extraction and the recognition of important clinical trends, which can vary between users, institutions and clinical environments. 9 The EHR exists within a complex sociotechnical environment, which necessitates its use by multiple users in multiple environments. 10 Each of the over 350 commercial EHRs available today has its own unique user interface, which profoundly affects user interactions and training protocols. 11 These EHRs are typically further customized by healthcare organizations, and even individual end users, which leads to a plethora of different processes with respect to EHR use. Furthermore, unintended consequences associated with using different EHR interfaces may only be apparent after the system is implemented and in general use. 12 Finally, no two patients are exactly identical with respect to their clinical condition or their data stored in the EHR. Thus, clinicians have individualized experiences with respect to their interaction with the EHR, which also significantly affects their proficiency as they use the system.
The other domain of issues rest in the observational method used to define factors associated with successful EHR use. Usability assessment is well developed in fields such as aviation, and while informatics can learn many lessons from aviation, however, the principles that can be well applied in the cockpit are often less applicable to complex healthcare scenarios. 13 EHR vendors are also typically less engaged in the process of usability engineering-informed improvements in the EHR interface than their counterparts in the aviation industry. 14 ISO 9241 defines ergonomic requirements for office work with visual display terminals, including presentation of data, menu, form filling and command dialogs, however, it has proven to be difficult to translate these standards into the healthcare environment, where a variety of strategy solutions, both hardware and software, are utilized to deliver EHR data to end users. The lack of clarity of the conditions when specific guidelines can be applied has also hindered adoption of standards. 15
Prior studies that have attempted to understand how the EHR user interface impacts clinical decision making have been significantly limited by these factors. Typically, research focusing on user interaction with EHR interfaces depended on protocols such as think-aloud methods. While these methods can be detailed, they can also be less effective in the healthcare system, where subjects are processing large amounts of complex information rapidly and tend to work automatically. 16 Subjects may also not be able to clearly verbalize heuristic thinking processes or use a conceptual language to describe their clinical reasoning. 17 This is particularly so when different subjects are studied in real-life settings because of the non-duplicable nature of real-life patients. Passive or observational methods of assessment, such as tracking the number of screens utilized by subjects, while informative as to general EHR use trends, fail to inform on cognitive decision making. This is due to the fact that these strategies focus only on screens, but they are unable to discern the actual data elements that are being viewed on the screen in question, a major issue given the high data density on the average EHR screen. While physical observations by human researchers allow tracking some nuances of subject behavior, they also do not allow capture of specific details of the subject’s data acquisition as they move from one EHR screen to another.
One strategy to overcome this is to utilize real-time eye tracking technology. Eye tracking is particularly compatible with EHR interface usability research as it has already been successfully employed to study how users engage in online searches, website usability, website and advanced interface design as well as a means to study visual attention and learning in video games.18–23 In relation to medicine, the majority of studies have employed eye tracking to better understand factors associated with accurate interpretation of radiologic studies.24–26 However, the employment of eye tracking in EHR usability is still in its infancy. Only a handful of studies have been reported with these focusing on very simple provider tasks, such as identifying a medication allergy or reading progress notes within the EHR.27,28
In order to effectively use observational methodologies, including any protocols utilized for eye tracking, it is important to standardize the clinical presentation of cases to subjects. This can be achieved by utilizing simulation in order to effectively conduct EHR usability research. Use of current eye tracking technology typically requires a protocol that includes the following: (1) placement of the eye tracking device in a location that allows it to capture subject gaze, (2) calibration of the device and (3) recording of data, including at a minimum x and y coordinates, screen identification and sequential use patterns, and time spent by the subject focusing on specific screen data elements. Our group and others have developed EHR simulation environments, with developed test cases employed to inform on blind spots in EHR usability and in one study, to inform on EHR interface design.29,30 We created an EHR simulation exercise with high-fidelity simulated cases that include complex clinical conditions and a significantly high number of data points similar to real-life cases.30,31 Each case contains a number of patient safety issues to be identified and acted upon. This allows us to anchor any objective measure of EHR usability (such as eye tracking) to a clinically relevant marker of successful EHR use, for example, recognition of dangerous changes in patient condition.
The goal of this study was to determine the feasibility of incorporating a commercial eye tracker, which provides gaze and screen tracking, into our high-fidelity EHR simulation exercise, which requires participants to interact with all of the relevant data domains required for delivery of care in the ICU. We hypothesize that by using standardized cases, we can develop a series of consistent markers to serve as surrogates associated with successful EHR use. For this study, successful EHR use is defined as recognition and verbalization of patient safety issues embedded into simulated cases. If successful, these surrogates will be capable of serving a baseline data for future studies focused on modification of either EHR training or interface design.
Methods
The study was approved by the Oregon Health & Science University Institutional Review Board. The study was deemed minimal risk, and formal informed consent was not required; however, all participants were provided with an information sheet about our research protocol.
Creating the simulation environment
The details of our simulation exercise and environment have been previously published elsewhere.30,31 To summarize, we first created a clone of our current EHR environment (EpicCare; Epic Systems Inc., Madison, WI) within which we hosted user customization details in addition to the simulated cases that we created. This “sandbox” study environment was devoid of clinical protected health patient information, but imported all end-user customizations from the actual production environment in order to provide subjects with a user experience that would closely replicate their actual clinical EHR use. These cases were then loaded into the simulation EHR environment in preparation for testing.
Creating clinical cases
We created two simulated ICU patients, each with a 5-day ICU admission. We attempted to make the simulated patient scenarios as robust as possible, with the inclusion of realistic data, including hourly vital signs, lab results, and nursing, resident and attending notes.
Recruitment process, subject characteristics and testing scenario
Residents and fellows rotating through the Medical ICU were eligible for enrollment. Participants were provided a written “signout” and then given 10 min to review data on one of the simulation cases, with instructions to review the EHR as if they were assuming care for the patient and would be presenting them on rounds, along with any potential changes in management that would be required for their care. At the end of 10 min, participants then presented the care plan for the patient to a member of the study team. Participants were graded on the number of safety issues they verbalized during this presentation, followed by a debriefing of the safety issues associated with the case. During this debriefing, they were also provided training with use of the EHR in order to efficiently identify similar issues in the future. Participants were able to participate more than once, depending on when they rotated in the ICU; if they did participate twice, the second session was separated by at least a week from the first session (usually more than a month) and a different case used that with their first round of testing. 31
Testing environment
Simulations were conducted in the ICU to maximize the fidelity of the simulation. We utilized an empty pod in the ICU where a mobile EHR workstation (a “computer-on-wheels”) was placed, similar to the hardware used by subjects while providing care. The Tobii eye tracker was mounted unobtrusively to the lower bezel of the monitor. In addition to the subject, a member of the study team was also present in the ICU pod at all times.
Calibrating and using the eye tracker hardware
We outfitted our testing station with a commercial eye tracker mounted below the monitor (Tobii X1 Light Eye Tracker (30 mHz); Tobii Systems, Danderyd Municipality, Sweden) (Supplementary Figure 1). This system does not require participants to wear additional glasses or other on-head devices and is reliable in a variety of lighting conditions with an optimal sampling rate at a user distance of 65 cm. At this distance, the viewing angle is up to 30° with an accuracy of 0.3°. Before testing, the eye tracker was calibrated to each subject using the 9-point calibration algorithm recommended by the manufacturer. This process of calibration took approximately 1–3 min and need not be repeated for the user for the duration of the simulation activity.
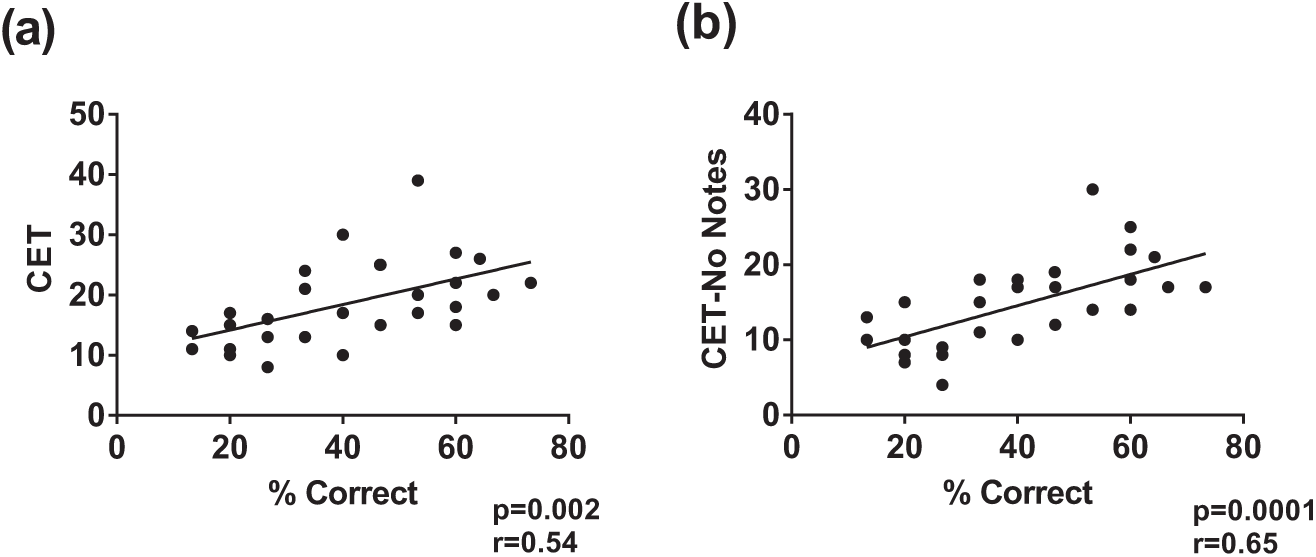
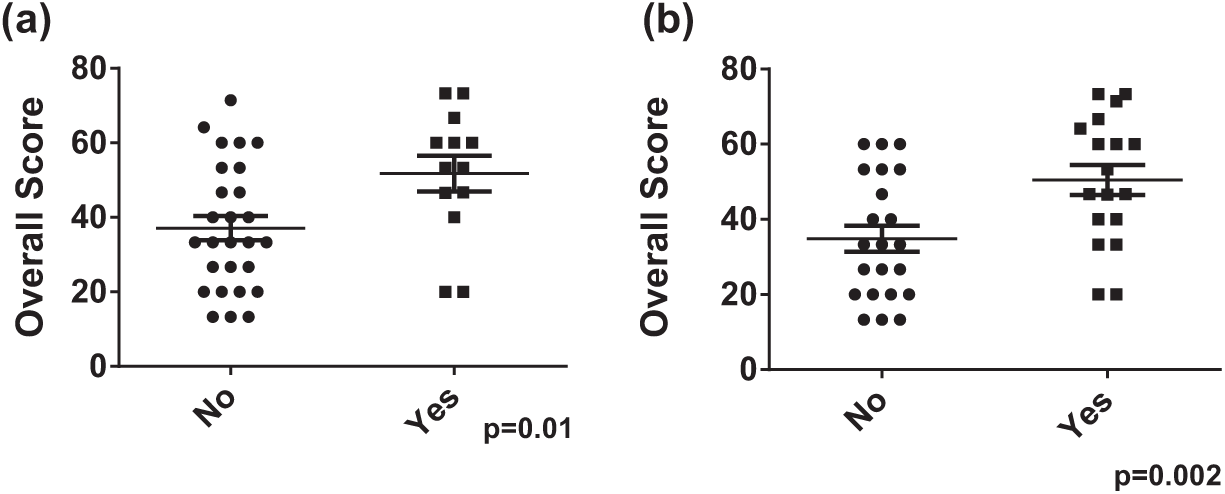
Eye tracker Composite Eye Tracking (CET) score correlates with performance on EHR simulation. In total, 29 participants underwent EHR simulation in conjunction with eye tracking. A composite score was generated reflecting the number of times patient safety items were viewed during the simulation. (a) This composite score correlated with performance on the simulation. (b) This association became stronger when the composite score was recalculated to exclude safety items viewed within progress notes.
Capturing data
Once the simulation began, eye tracking software (Tobii Studio; Tobii Systems) captured a variety of real-time information, including screenshots, keystrokes, mouse clicks, subject ocular saccades and eye fixations. If participants were distracted from the screen (e.g. to write notes), the eye tracker had the ability to recapture their gaze, once their gaze returned to the monitor. All testing was done using a fixed back chair maintaining an eye to monitor distance of 60–65 cm, with no swivel or tilt capabilities to ensure that participants’ gaze would be efficiently captured by the eye tracker.
Analyzing data
Once complete, the software-generated video for each subject was trimmed to include only the testing period. The eye tracking software identified smooth pursuit movements by analyzing directional shifts of the eye and classified them as fixations in gaze (defined as a point of focus lasting at least 35 ms) 32 or saccades (if they were in excess of a velocity threshold of 30°/s). Several related measures such as total saccade duration (total amount of time spent in saccades), mean and median fixation duration, fixation velocity, mean and median saccade duration and saccade velocity were also computed by the software.
Each video generated by the eye tracker was also screened for any gaps in time for which no fixations or saccades were recorded. When protracted gaps of more than 6 s were identified in the presence of other evidence of computer use (e.g. mouse movement, mouse clicks or keystrokes), all eye tracking data for the subject were excluded from gaze analysis. However, we included screen data (i.e. number of screens visited) as well as keystrokes and mouse clicks for these participants since these are unaffected by participant gaze.
In addition to software analysis, we wished to better understand usability issues with relation to each specific participant and to determine whether there was a direct correlation between items viewed during the simulation and participant performance. To that end we developed an evaluation instrument in the form of a scoring tool. Each video was reviewed individually and scored manually using a composite score instrument developed by us—the Composite Eye Tracking score (CET score)—based on specific safety-related items viewed within the case. 31 For each participants’ video, we recorded the identity of the screen visited (screens were numerically coded) and whether any fixation occurred on any data item that was associated with the safety issues built into the case. For discrete items (e.g. the wrong dose of a specific medication), participants were given “credit” for the presence of a gaze fixation over the dose of the medication. For items which involved recognizing data trends (e.g. a change in blood pressure), participants were given credit if they viewed the data longitudinally (multiple sequential fixations on the same data category). Furthermore, we identified whether this longitudinal viewing of data occurred for only the previous 24 h or for data older than the prior 24 h. While participants could receive credit for viewing the same item on multiple screens (or on revisiting the same screen), they were only credited once per item per individual visit to a screen. Finally, we summed all credits for each subject to create the CET score. Preliminary data suggested 80 percent agreement between the CET scores of multiple reviewers. When evaluating differences between reviewers, it was noted that differences were almost exclusively in instances where short fixations were recorded, specifically when participants were viewing data located in progress notes. Once the process for scoring videos was standardized, all videos were scored exclusively by a single member of the study team who was completely blinded to the participants’ actual performance in the simulation.
For analysis, we correlated elements of the CET score and data collected during testing to performance on the simulation (specifically, the number of safety issues recognized, also termed % correct) using Pearson’s correlation for parametric data and Spearman’s correlation for non-parametric data. Differences in performance between groups with specific usability characteristics were compared using Student’s t-test. All analyses were performed using GraphPad Prism (GraphPad, La Jolla, CA), and a p-value < 0.05 was considered statistically significant.
Results
In total, 34 participants participated in 39 simulations with the eye tracker for which videos were screened to assess for usability in gaze data analysis. In this group of participants, there were 19 interns, 10 residents and 5 fellows. We excluded 10 video files (26%) due to the presence of “gaps” in gaze capture. The excluded videos were still used for screen and mouse click utilization data collection. There was no difference in subject performance on the simulation with respect to either the number for screens visited or mouse clicks used during the simulation between the group with valid eye tracking data and the group that was excluded from gaze analysis (data not shown).
We first sought to determine whether the CET score we had devised could serve as a surrogate for effective EHR use (i.e. whether a high CET score was associated with superior performance on the simulation). Overall, the CET score correlated well with performance on the simulation (r = 0.54; p = 0.002) (Figure 1(a)).
We next wished to discern if there were differences in performance on the simulation between participants viewing the data in their primary locations (the EHR screen that was emphasized during training as the go-to screen to access specific information, for example, results screens for laboratory studies or a medication screen for medication dose information) or in a synthesized document (i.e. progress or nursing notes with information collated from the EHR database). We reanalyzed our data to assess the robustness of the CET for all items viewed in primary locations. Doing this actually increased the robustness of the CET score (r = 0.65; p = 0.0001) (Figure 1(b)). Conversely, the CET for just the items viewed within the non-primary locations (e.g. progress note) had no correlation with performance on the simulation (data not shown).
With regard to specific safety items built into the cases, we looked to identify whether viewing the associated data within the EHR was associated with verbalization of the safety item during the simulation. Overall, no safety item was viewed 100 percent of the time, with a mean of 28 percent (range 6%–67%) of participants failing to visualize an individual safety item in the EHR. For common themes between the cases, such as ventilator data, there was no association between viewing the ventilator data in the EHR and recognition of inappropriate tidal volumes or high plateau pressures. There was, however, an association between viewing laboratory trends within the EHR and verbalization of the trend in the simulation. For example, longitudinal viewing of the platelet count (i.e. looking at all 5 days of the platelet values) was associated with a greater likelihood of recognizing the 50 percent reduction in platelets (Figure 2). We also noted that for inappropriate antibiotic dosing, viewing the low antibiotic trough result increased likelihood that the participant would verbalize underdosing of antibiotics (75% vs 16%; p = 0.03).
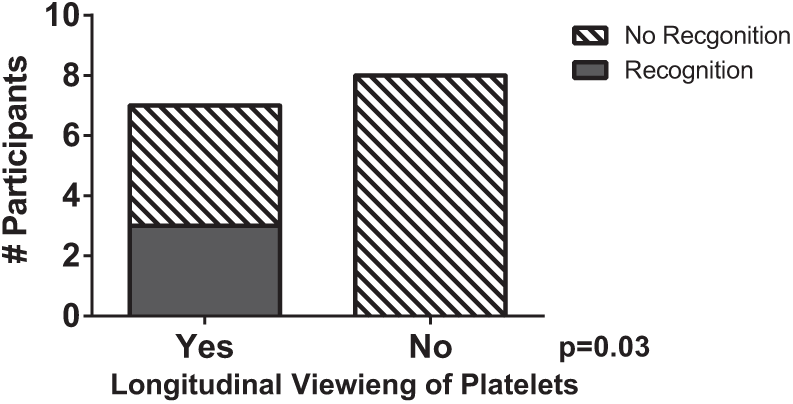
Longitudinal viewing of platelet counts corresponds with recognition of thrombocytopenia. For one of the cases employed, eye tracking videos were scored for whether participants viewed platelet count longitudinally across time (e.g. all 5 days) and whether they recognized the 50 percent drop in platelet count in the scenario.
We next sought to determine whether a specific pattern of screen use was predictive of performance on the simulation. We first examined the number of screens utilized. In total, 39 users visited a total of 105 unique EHR screens. On average, an individual user visited 18.3 ± 6.7 individual screens and 36.9 ± 14.5 total screens during the simulation, suggesting multiple screens were visited multiple times during the simulation (note that, for the purpose of testing, progress notes were classified as a single screen, no matter the number viewed) (Figure 3(a)). Furthermore, the number of individual screens visited correlated with overall performance on the simulation (r = 0.5; p = 0.001) (Figure 3(b)). We also analyzed the number of mouse clicks per subject and their association with performance during the simulation and found a weak correlation between the number of mouse clicks and performance on the simulation (r = 0.33; p = 0.03) (Figure 4).
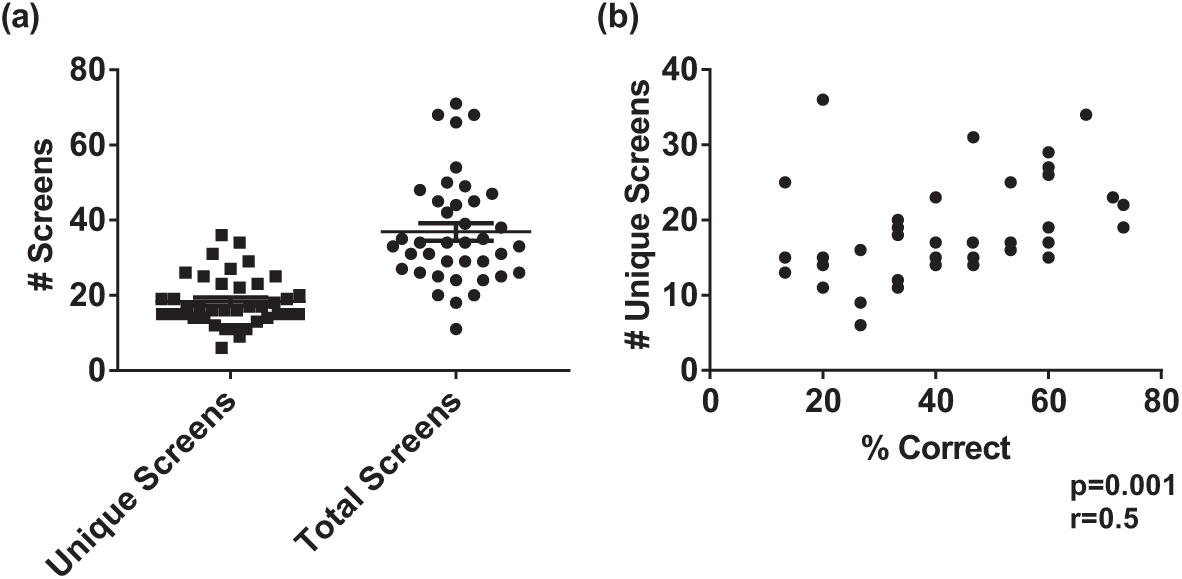
Degree of data fragmentation and its effect on performance during EHR simulations. (a) For 39 participants who participated in EHR simulation in conjunction with screen capture from eye tracker, the number of unique and total screens viewed during the simulation. (b) The number of unique screens viewed correlates with performance on the simulation.
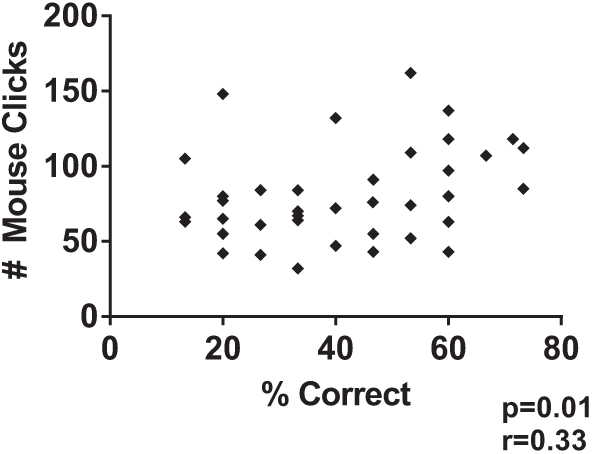
Mouse clicks correlate with performance on EHR simulation. Number of mouse clicks correlates with performance on EHR simulation.
Next, we looked at whether visualization of any individual screen was associated with superior performance. For each simulated case, we identified the top and worst three performers to identify differences in patterns of screen use. Once these outliers were identified, we then analyzed the cohort as a whole. Based on our analysis, we identified two screens, the “orders manager screen” and our custom-built “glucose screen” to be associated with improved performance on the simulation (Figure 5(a) and (b)). Interestingly, while the use of our glucose screen was associated with better overall performance, there was no difference in identification of the embedded safety issues which could be identified on that screen (data not shown), suggesting its use may be a more global marker of better users of the system. Finally, of the 105 total screens viewed, only 13 of them accounted for 75 percent of the gaze events of safety issues.
Use of specific screens associated with improved recognition of patient safety issues in EHR simulation. Participants who viewed either (a) “orders manager” or (b) “glucose report” performed significantly better on EHR simulation exercise compared to those who did not.
Given that data viewed in progress notes actually impaired the strength of the CET score, we analyzed whether the use of progress notes was associated with differences in overall performance. In general, there was no association between the number of individual notes viewed and performance (r = −0.09; p = 0.58) (Figure 6(a)). However, in secondary analysis, interns were more likely to view more notes than residents (Figure 6(b)). Furthermore, when interns did view notes, they were much more likely to view them early (arbitrarily defined as the first half of the simulation) in their data gathering process than residents (49.6% vs 13.7% of notes; p = 0.004) (Figure 6(c)).
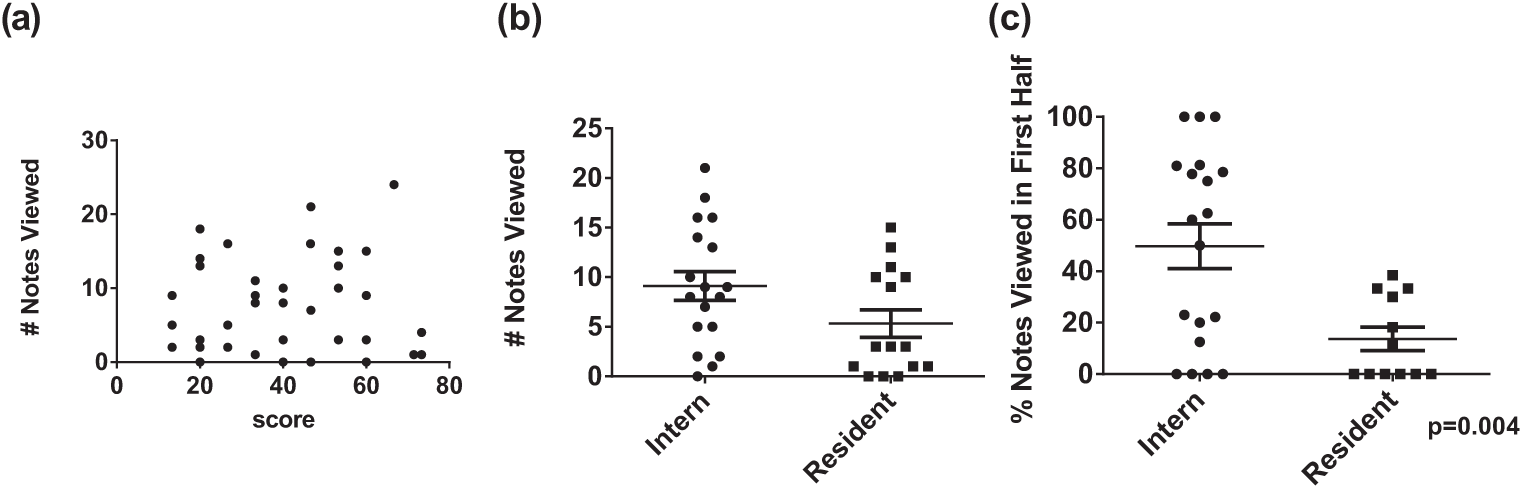
Effect of training level on EHR utilization: (a) Lack of association between number of notes viewed and performance in the simulation. (b) Interns viewed significantly more notes during the simulation than residents. (c) Interns were more likely to view notes during the first half of the simulation compared to residents.
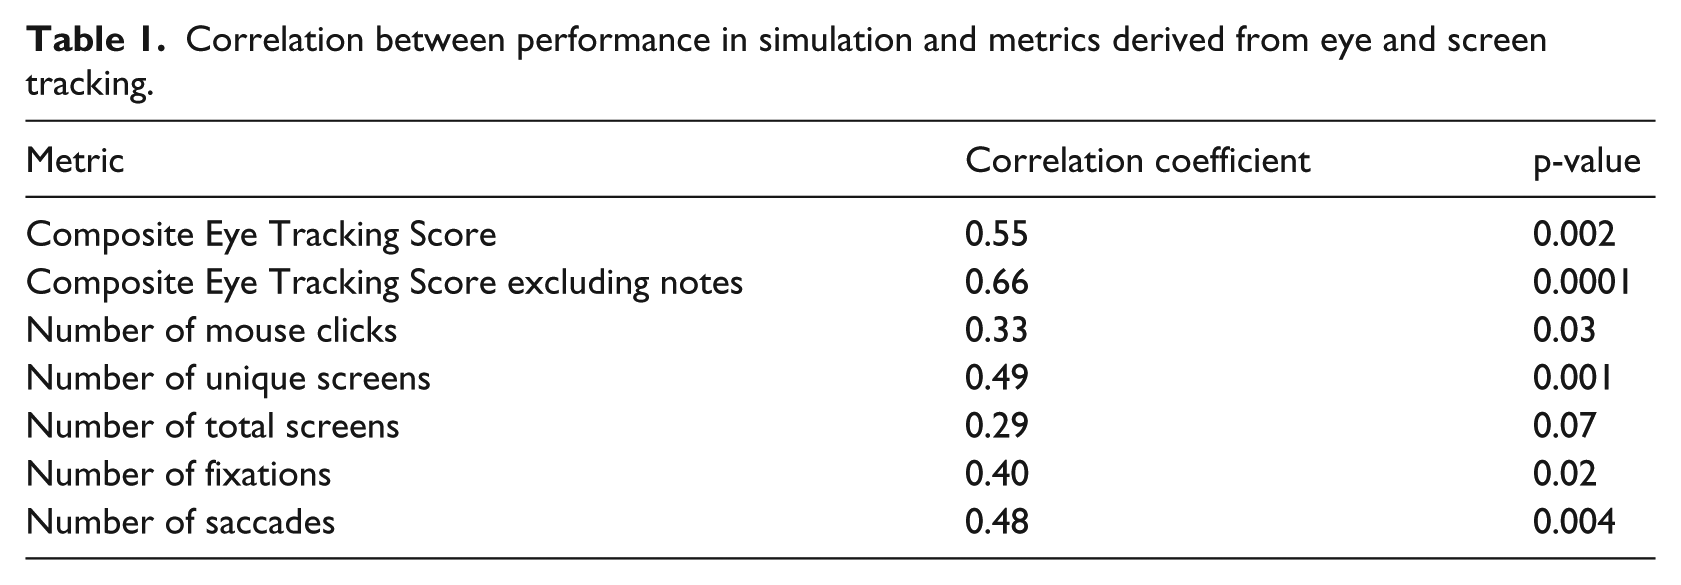
With regard to more traditional metrics associated with eye tracking, we analyzed the correlation between performance and the number of fixations and saccades exhibited by participants. Interestingly, while there was a weak correlation between the total number of fixations and performance (r = 0.4; p = 0.02) (Figure 7(a)), there was a stronger correlation between the total number of saccades (r = 0.48; p = 0.004) and performance (Figure 7(b)). There was no association between mean or median fixation duration, fixation velocity, mean/median saccade duration and saccade velocity and performance (data not shown). A summary of all of the use metrics and their correlations with performance on the simulation can be found in Table 1.
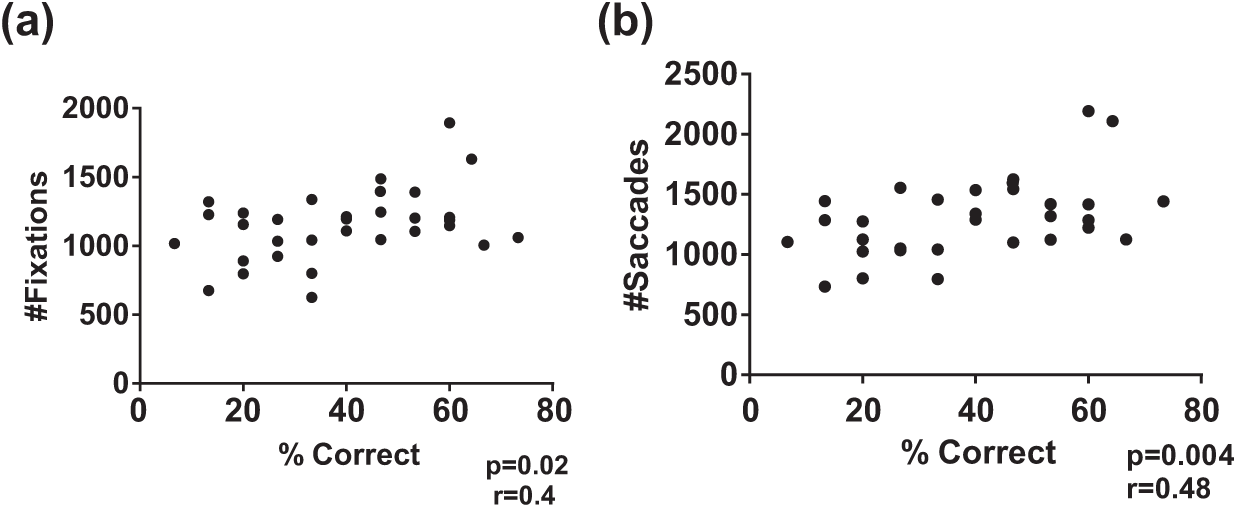
Correlation of gaze metrics with performance on EHR simulation. Participants who had valid gaze data (N = 29) had (a) number of fixations and (b) number of saccades and correlated with performance on EHR simulation.
Correlation between performance in simulation and metrics derived from eye and screen tracking.
Discussion
In this article, we demonstrate the feasibility and utility of integrating eye and screen-tracking technology into a high-fidelity, data-dense EHR simulation exercise. Specifically, we illuminate a number of consistent surrogates for effective EHR use, in this case, defined as the ability of providers to recognize dangerous patient safety issues built into the case. To achieve this, we drew upon the methodology defined by Lilholt et al., 33 who used a combination of standardized cases and talk-aloud studies juxtaposed with video recordings to assess the usability of a Computerized Provider Order Entry (CPOE) system. Their use of video recording, while innovative, was limited, in part, due to the lack of certainty as to where on the screen the subject was actually focusing. Eye tracking technology offers a potential solution to overcome such a limitation.
While eye tracking hardware and software allows us to conduct studies where we can objectively record the on-screen data elements at which clinicians are actually looking, most EHR screens employ both vertical and horizontal scrolling (due to the high degree of per-screen data density). This issue was magnified in this study where participants were required to navigate through multiple screens to complete the exercise (as opposed to focusing on one specific screen or data element). It is therefore extremely difficult, if not impossible, with current software to designate areas of interest around items relevant to a specific case to allow for automated scoring. We sought to overcome this by developing a manual scoring system (CET score) to identify fixations on specific data points relevant to the simulations. Since each case had a number of predetermined safety issues to be identified by viewing data presented on different EHR screens, we generated a CET score for each individual, which in essence acts as a measure of the efficiency of identification of safety issues viewed within the case. The CET score correlated quite well with performance on the simulation, suggesting its potential use as a measure of effective EHR use in these simulations.
Of interest is the fact that while visualization of some items correlated directly with recognition of that issue (i.e. visualization of the vancomycin trough correlates with recognition of sub-therapeutic dose), this did not hold true for all safety issues. This highlights the complexity of understanding EHR usability, as suboptimal utilization is often a combination of both specific EHR (data finding) and EHR-provider (cognitive) factors.34,35 The incorporation of eye tracking now potentially allows for dissection of these factors on an item by item basis. Of greater interest was the fact that when we compared the CET score generated by excluding all data obtained when the subject was viewing clinical progress notes with the subject’s original CET score, the correlation significantly improved. This is consistent with a recent small study which suggests that hospitalists, when viewing the progress note, spend little time looking at the objective data (laboratory values and vitals) in the note. 27 Whether this suggests that progress notes were used by the average subject merely to confirm previously viewed data or whether the format of the note itself negatively impacts data recognition will be the subject of future studies.
Multiple studies suggest that data fragmentation and the consequent reduction in efficiency are significant factors confronting EHR users and can negatively impact patient safety. 34 Our data confirmed a high degree of issues related to data fragmentation. Interestingly, participants who viewed more screens and utilized more clicks were more successful at identifying patient safety issues embedded within the case. This was surprising since our initial assumption was that expert users of the system would navigate the EHR with greater efficiency and thus utilize fewer mouse clicks and visit a fewer number of screens. In stark contrast, our findings suggest that greater comfort with the system allows for more rapid screening of data, a skill that expert users then employ to visit a greater number of screens to ensure that they are visualizing all the relevant data that will be necessary to make an appropriate clinical decision. Of course, this may also suggest that expert users understand the limitations imposed by fragmented data and have developed a “workaround” which allows them to visualize more screens in a given timeframe, thus maximizing the amount of data viewed and thus minimizing the likelihood of missing relevant data elements. Whether these markers of successful recognition of data within the EHR are unique to our current system or a generalizable feature of all EHRs has yet to be determined. These data will now be able to serve as a baseline for both intersystem analysis (with the same standardized cases) or for intrasystem analysis for different care environments.
In addition to providing general information on screen utilization, the use of standardized cases combined with a simulation exercise linked to a meaningful clinical endpoint (e.g. recognition of patient safety issues) allows for determination of optimal practices associated with successful EHR use. Analysis of our data helped us determine that participants who viewed data presented by two specific screens within our EHR performed at a significantly higher level during the simulation. While one of these screens was a standard EpicCare screen, the other was a screen customized at our institution. This suggests that the use of specific screens associated with superior performance is not necessarily limited to generic screens included in the EHR released by the vendor.
Another potential application of the data is to be able to determine differences in EHR utilization among groups of learners, in a manner similar to what has been described for electrocardiogram (ECG) interpretation. 36 In particular, we noted that interns relied much more heavily on the use of progress notes as compared to residents. Of even greater interest was that as opposed to residents, who usually viewed the majority of the notes in the latter half of the simulation, interns were more likely to view the notes early in their data gathering. One potential explanation for this observation is that interns are more likely to use the notes as the source of their primary data, while residents tend to utilize notes to confirm their impressions of the data. While the significance of this behavior is still to be determined, it emphasizes how the combination of the use of standardized cases across a wide variety of providers provides deep insight into how each group have adapted EHR technology to serve their own individual workflow.
The incorporation of the eye tracker also allowed us to establish gaze surrogates for effective EHR use. A priori we expected to find an association between subject performance and the number of gaze fixations, especially since fixations are considered to represent data processing equivalents, the actual association in our study was relatively weak. 32 Surprisingly, the stronger association was between the number of saccades and performance on the simulation. The theory that saccades could be involved in cognitive decision making has gained greater attention. In one model, Linear Accumulation to Threshold with Ergotic Rate (LATER), when multiple targets are present in the visual field (such as in the EHR) saccadic eye movements restrict users to a smaller number of choices than all the data visible on the EHR screen.37,38 This suggests that expert users of the system are intrinsically aware of the location of the data they need to review and able to effectively scan from one predetermined point to another to avoid being overwhelmed by large amounts of on-screen data. When faced with uncertainty, participants scan the screen in a less efficient pattern, moving from data point to data point and pausing to reflect upon the significance of each individual element, thus generating longer fixations. Our findings are similar to those of Wood et al., 36 where experts had faster gaze times in ECG interpretation compared to novices. In a similar fashion, Eghdam et al. 28 found that in assessing the use of a new antibiotic decision support tool, expert users were more likely to focus on specific items, while novices spent more time “searching,” which indicates ambivalence. Unlike our study, neither study distinguished between saccades and fixations, and both studied very finite tasks. Overall, the strength of the association observed by us does suggest that the number of saccades as measured by a well-designed EHR simulation might be an important surrogate for measurement of effective data processing utilizing within the EHR.
There are some limitations to our study. First, all studies were conducted with internal medicine trainees on ICU cases using a single EHR. In order to verify the generalizable nature of our results, this methodology would need to be replicated (1) in other clinical environments and (2) with other EHR systems to determine whether the results obtained are truly generalizable surrogates for EHR usability or rather specific to the ICU environment in which our simulations were conducted. This will be important to also discern whether the gaze metrics elucidated (saccade number) are intrinsically linked to other measures of usability such as screen number, especially as EHR interfaces are redesigned. Second, we were only able to obtain accurate eye tracking data on 74 percent of tested participants. This is in part due to the ergonomics of our testing station in the ICU. We wished to closely replicate the clinical environment, and conducted our simulations within the ICU, using an empty cubicle. While this enhanced fidelity of the simulation, it also resulted in the inability to entirely control the environment and data loss associated with the fact that some participants would move out of range of the eye tracker. Third, while the CET score correlated quite well with performance on the simulation, we acknowledge that this is still a form of manual scoring subject to potential bias.
In conclusion, in this study, we demonstrated the feasibility of utilizing a commercial eye tracker to assess EHR usability. We further developed and tested specific markers that can be utilized by researchers conducting EHR usability studies with gaze tracking. Using standardized cases and incorporating eye tracking hardware into a controlled high-fidelity simulation exercise with specifically designed standardized cases allow us to link these markers of usability to meaningful measures of EHR use. Future studies will determine whether these markers are generalizable beyond our institution and EHR or whether measures must be uniquely determined for each patient care environment and EHR product.
Footnotes
Declaration of conflicting interests
The author(s) declared no potential conflicts of interest with respect to the research, authorship, and/or publication of this article.
Funding
The author(s) disclosed receipt of the following financial support for the research, authorship, and/or publication of this article: This project was supported by grants from the Agency for Healthcare Research and Quality R18HS021637 and the Donaghue Foundation.