
Abstract
This report is a description of a balanced scorecard design and evaluation process conducted for the health information management department at an urban non-teaching hospital in Canada. The creation of the health information management balanced scorecard involved planning, development, implementation, and evaluation of the indicators within the balanced scorecard by the health information management department and required 6 months to complete. Following the evaluation, the majority of members of the health information management department agreed that the balanced scorecard is a useful tool in reporting key performance indicators. These findings support the success of the balanced scorecard development within this setting and will help the department to better align with the hospital’s corporate strategy that is linked to the provision of efficient management through the evaluation of key performance indicators. Thus, it appears that the planning and selection process used to determine the key indicators within the study can aid in the development of a balanced scorecard for a health information management department. In addition, it is important to include the health information management department staff in all stages of the balanced scorecard development, implementation, and evaluation phases.
Keywords
Introduction
In an effort to more effectively manage healthcare resources, the balanced scorecard (BSC) has been adopted from the business sector where it has been used for decades as a strategic management tool to address issues like operational efficiency and performance management.1,2
BSCs improve internal capacity and support organizational development. 3 As such, managers have used the BSC to initiate operational discussions and other activities such as information dissemination, process reporting, and knowledge exchange with staff. 4 Several benefits of BSCs have been identified within the literature, which include providing a simple means of translating an organization’s strategy into operational terms, aligning the organization’s strategy with its structure, facilitating the development of a process to help communicate the organization’s strategy, and supporting the continuous transformation of the organization’s vision. 5 When properly designed and correctly understood, the BSC has been known to effectively communicate desired results, provide feedback, facilitate learning, increase accountability, and enhance employee motivation. 6 Because of the overall effectiveness of the BSC as a management tool, 7 more not-for-profit organizations and government agencies have employed a BSC in their strategic management practice.
Kaplan and Norton 8 developed the BSC as a strategic framework in an effort to integrate performance indicators derived from organizational strategy. Since its development, BSCs have been the focus of many research studies particularly in the area of strategic management 5 and performance measurement. 9 The original design of the BSC consisted of four perspectives or dimensions: (1) financial, (2) customer, (3) internal processes, and (4) growth and learning. 5 Financial indicators measure whether an organization’s strategic initiatives are contributing to bottom-line improvement. Performance measures from the customer perspective look at whether the organization creates value through customers. Internal process indicators identify the critical internal processes required to help the organization excel. Indicators in the growth and learning perspective such as people, systems, and procedures help identify essential infrastructure that the organization must build to create long-term growth and improvement.
To design an effective BSC, three structural attributes need to be considered. According to Kaplan and Norton,1,10 the BSC metrics must measure those activities that lead to the implementation of the strategy and should focus on strategic initiatives derived from the organization’s strategy. More recently, Soderberg et al. 6 stressed that performance measures are a minimum criteria for the tool to be considered to be a BSC. As well, another key factor is that balance exists between the four BSC domains. Most importantly, this balance should exist between outcome and driver measures, and the financial and non-financial indicators. Finally, both measures need to be causally linked. A well-designed BSC contains linkages between different indicators within each performance dimension and also across the BSC dimensions. 6
In terms of utilization of BSCs, in 2000, 43 Canadian hospitals, which represent less than 3 percent of all Canadian hospitals, reported using a BSC as a management tool in their organization. 11 About three-quarters of those surveyed reported successful implementation of the BSC. Furthermore, administrators who implemented a BSC in these Canadian hospitals forecasted that the utilization of a BSC would change significantly over the following 5 years of implementation. 11 Because the BSC can point to issues that can be addressed by management, the interest of healthcare organizations in employing the BSC as part of their management culture continues to grow. Accordingly, healthcare leaders and managers need to gain a good understanding of its implementation issues to ensure successful adoption as a strategic management tool in their organizations.7,12
Recently a large urban non-teaching hospital in Canada serving a very diverse community, with 28,000 inpatients, more than 200,000 outpatients, and over 100,000 emergency visits and over 5000 births in 2010–2011, engaged in the development of a BSC for their Health Information Management (HIM) department 13 to align with all of the other departments that already had one.
This initiative to extend the BSC development to the HIM department was driven by the organization’s 3-year corporate strategy to pursue excellence in the delivery of integrated patient-centered care while remaining focused on the continued building of an academic foundation. The development of a BSC for the HIM department linked closely with the building of a strong academic foundation focused on research, innovation, and scholarly activities and the expansion of education to improve health outcomes. These strategic directions represent distinct dimensions in the corporate BSC. As such, the HIM BSC was derived with these larger corporate goals in mind, but also included a third dimension to monitor and measure key enabling areas. Specifically, the enablers were designed to monitor people, fiscal stewardship, health information technology and innovation, communication, and partnerships.
Overall, the BSC development within the HIM department was precipitated by the organization’s aim to provide all of their healthcare leaders and managers access to a fully electronic BSC to equip them with the necessary metrics to support informed decision making.14,15
Methods
Sample
In all, 45 members of the HIM department comprised managers (9), analysts (7), and administrative staff (29) who supported the BSC planning, development, and evaluation.
Instrument
Analytic hierarchy process questionnaire
To identify priority levels within the HIM BSC, the leadership management team was asked to complete an analytic hierarchy process (AHP) questionnaire. The AHP is a theory of measurement that is conducted through pairwise comparisons of alternatives and is reliant on experts to identify priority scales that measure the intangibles inherent in decisions in relative terms. The comparisons are made using a scale of absolute judgments that represent the degree of dominance of one element over another with respect to a given attribute. 16 It is beneficial in that it eases the effect of judgment biases, integrates the vast amount of information in the BSC, and offers a comprehensive measure for performance assessment. 7 The AHP is useful in providing a structure as well as an algorithm to develop a comprehensive measure that is useful for comparative purposes and is used to assess face and content validity within the final indicators in the BSC. Construct validity could not be examined because of the absence of BSCs for HIM departments within other hospitals across the country. Using the AHP as a tool, 10 questions were developed to address different aspects of the HIM BSC. This survey tool was distributed online via Survey Monkey (Appendix 1).
Evaluation tool
The BSC evaluation tool consisted of 10 questions that were derived and adopted from Barnardo and Jivanni’s 17 formative evaluation conducted in 2009. The survey was divided into four sections (Appendix 2). The first two questions collected demographic information from the respondents. The next section asked questions regarding the HIM scorecard as a reporting tool. Questions regarding the usefulness of the scorecard as a management tool were asked in section 3 of the tool. Finally, the last two questions required respondents to give their opinion on the secondary benefits of the HIM scorecard development activities.
Procedure
The construction of the HIM BSC involved three different phases: (1) planning, (2) development, and (3) evaluation.
Planning phase
The creation of a HIM BSC began with a review of the hospital’s current strategic plan and initiatives. To ensure alignment of the HIM BSC to the larger corporate BSC, the same approach was used to create the HIM strategy map (Figure 1).
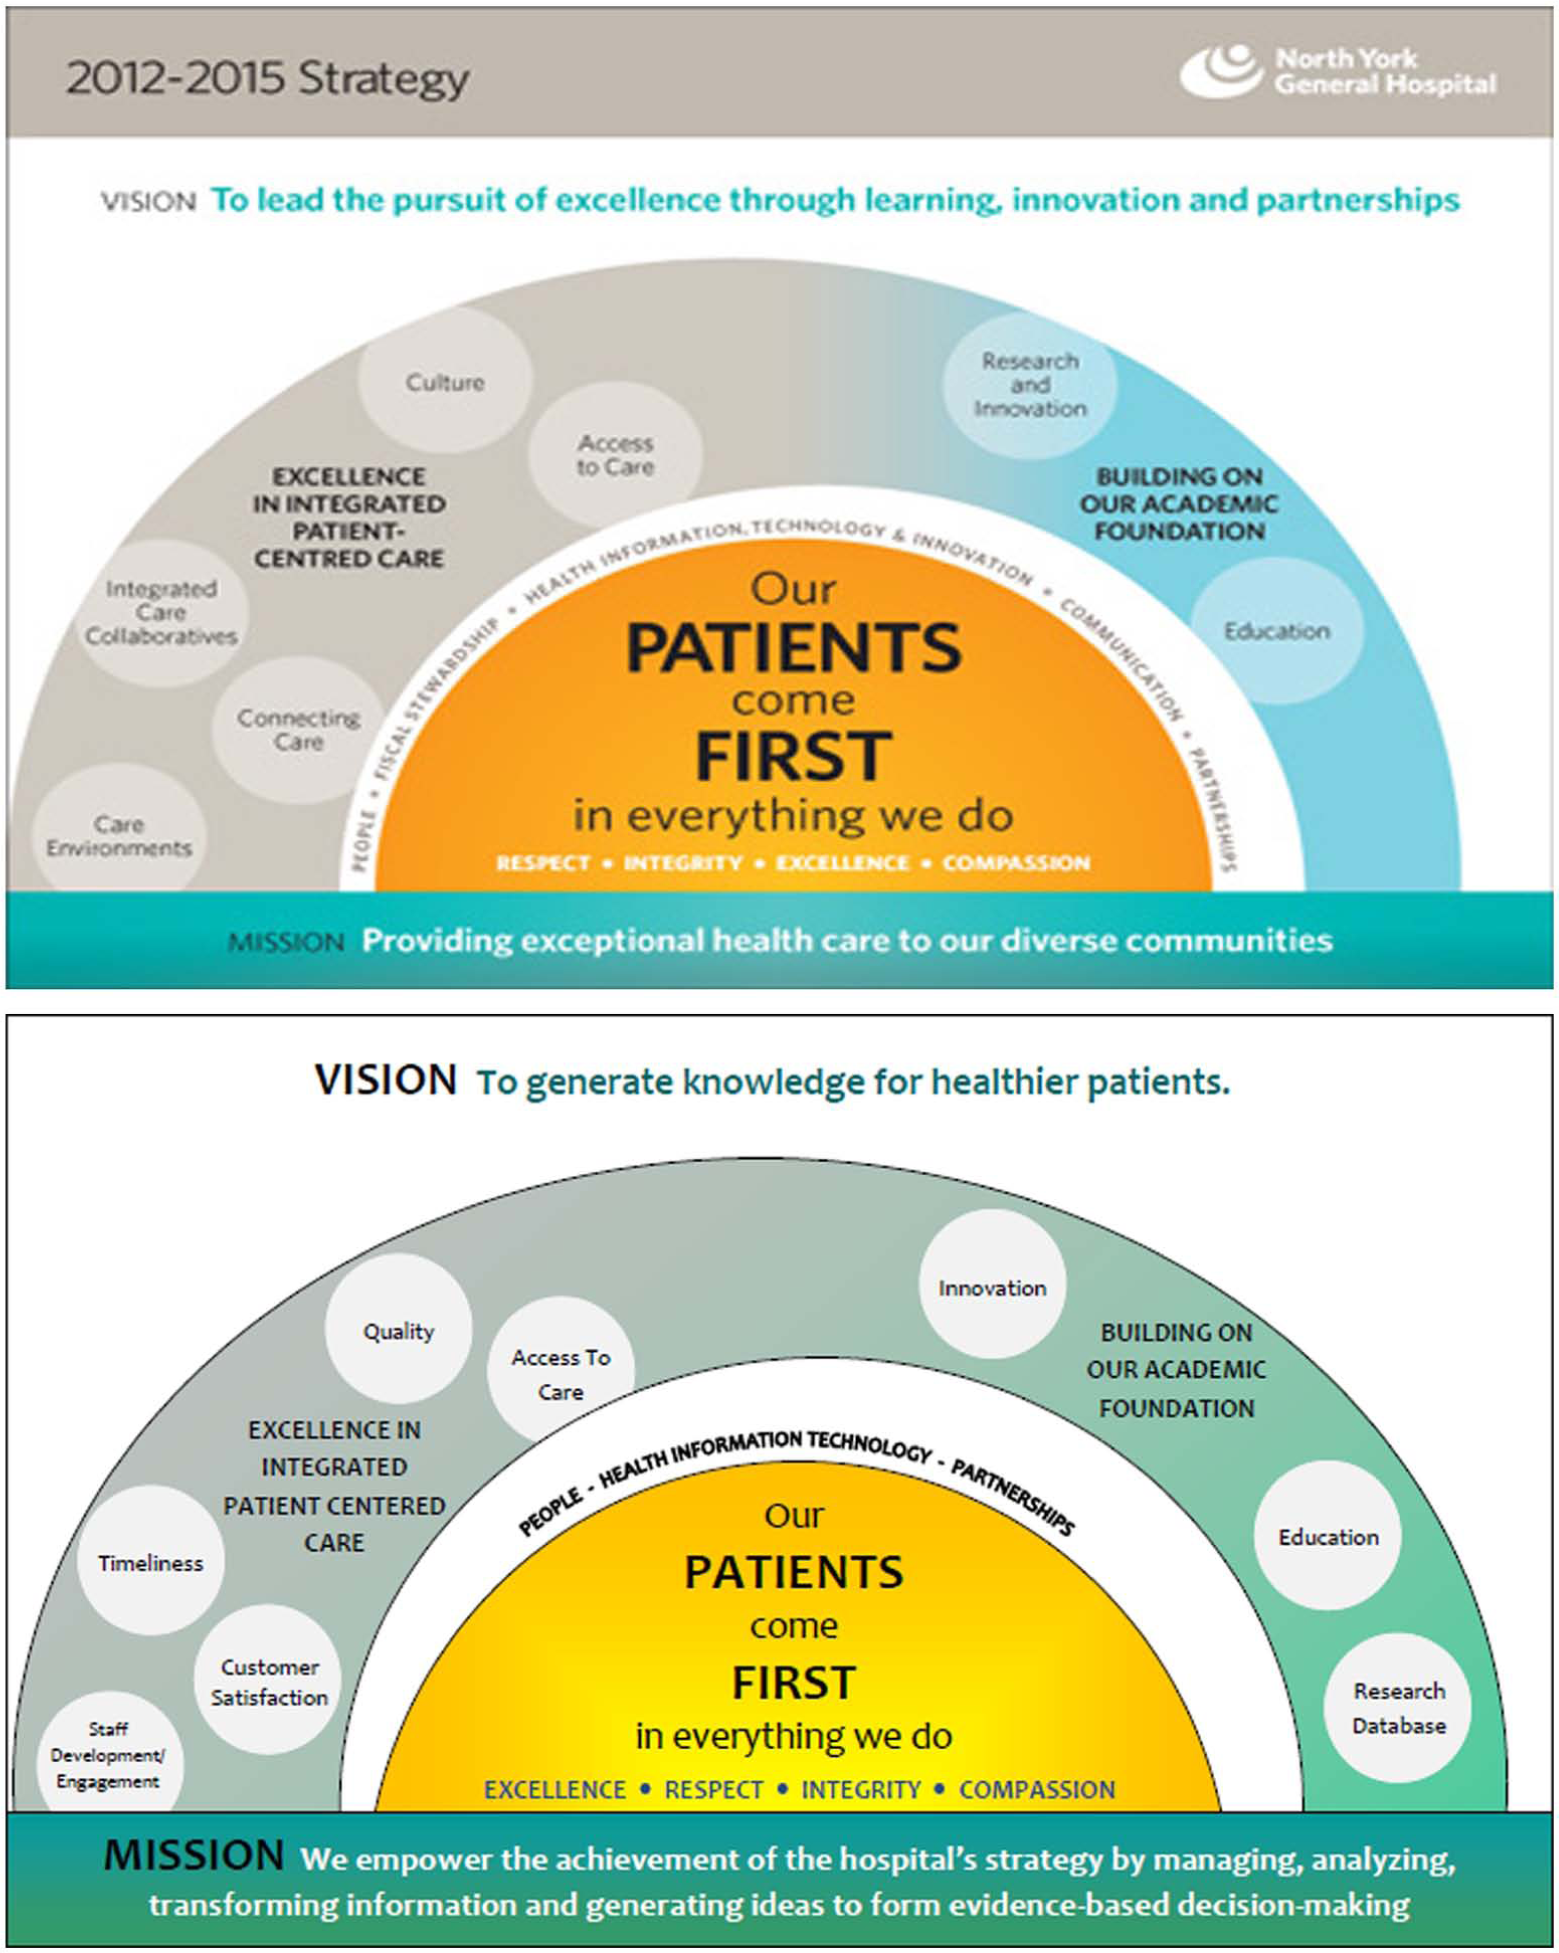
HIM Strategy Map 2012-2015.
Some elements of the corporate strategy map (e.g. vision, mission, and strategic initiatives) were modified and reworded to fit the function and strategic activities of the HIM department. An exhaustive examination of the different functions and activities within the department was conducted through review of relevant intranet web pages and interviews with managers and supervisors from key HIM areas. This was done to ensure that the indicators selected within the BSC would adequately and accurately measure the key functions and activities within each HIM area. The HIM department provides a wide range of services, from processing and management of patient health records to conducting strategic analysis of health information designed to the support organizational planning.
The next step of the planning phase involved a review and update of the HIM department’s organizational chart (Figure 2). Seven key areas were identified based on distinct business activities that were carried out throughout the department: (1) health records—coding and abstraction; (2) health records—transcription; (3) health records—records processing; (4) decision support; (5) patient flow and bed control; (6) registration; and (7) privacy, freedom of information, and release of information.
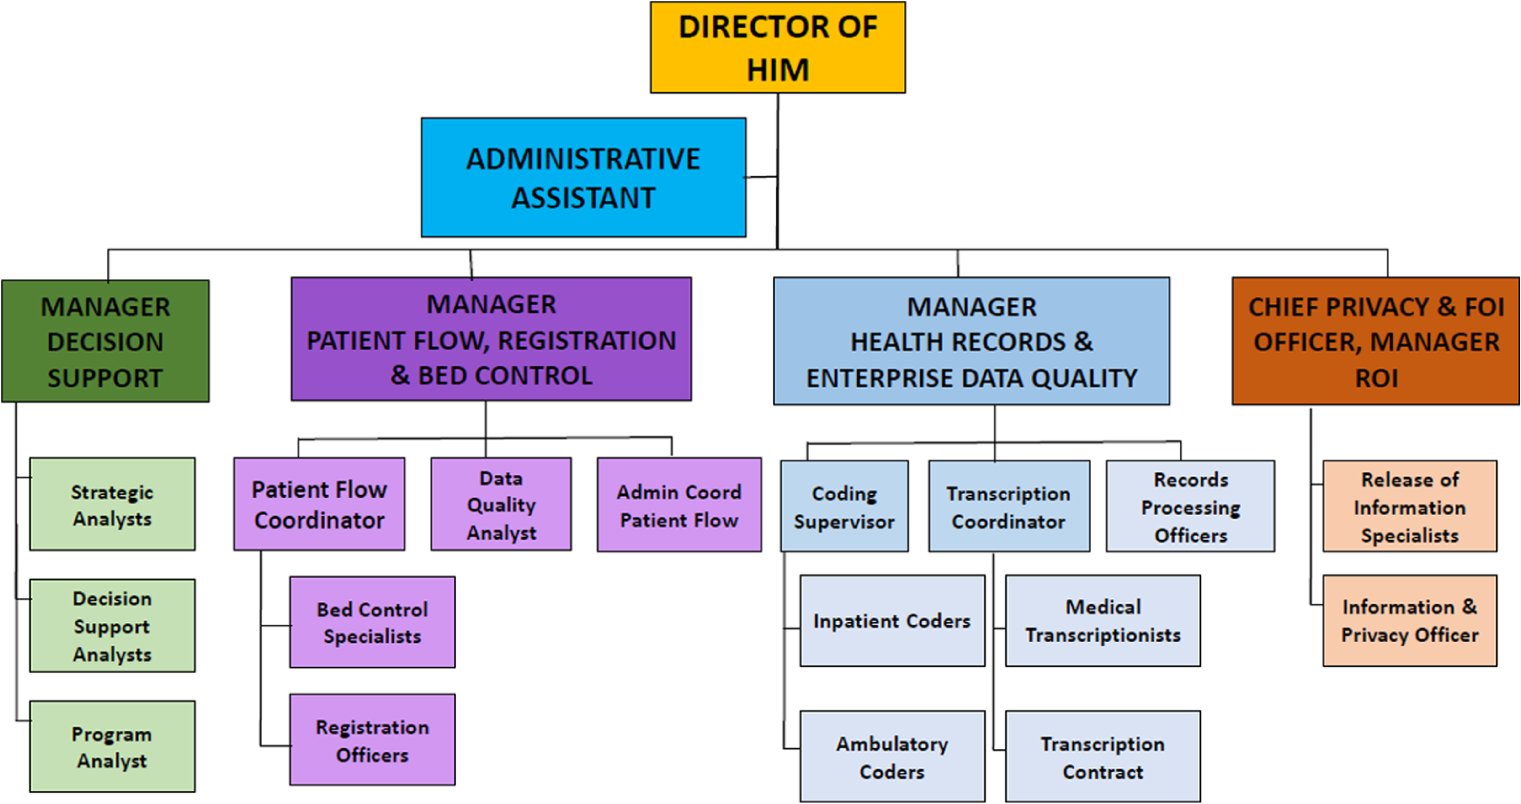
HIM department organizational chart.
Health Records is responsible for ensuring the accuracy and integrity of the patient health record and also provides healthcare providers with access to health information critical in the delivery of appropriate patient care. Three specialized areas report directly to the Health Records manager: Coding and Abstraction (CA), Transcription, and Records Processing. These three departments control administrative data and clinical data such as the patients’ medical history, reason for visit, and diagnoses that are then captured and indexed into electronic records to be tracked. The Health Records department uses the data captured to monitor clinical indicators such as infection rates, cesarean section rates, and mortality rates. This allows them to review internal performance and financial performance with respect to surgical volumes and cost per weighted case. The data from the Health Records department are submitted to a number of registries that can be accessed and then publicly reported by healthcare bodies such as the Canadian Institute for Health Information (CIHI), Statistics Canada, the Institute for Clinical Evaluative Studies (ICES), and the Public Health Agency of Canada (PHAC).
Decision Support is the analytic branch of the HIM department. As seen in Figure 2, the team is made up of decision support analysts, program analysts, and strategic analysts. They offer leadership and consultative services to various internal and external decision-makers by providing their expertise and knowledge of various data sets and databases. As such, they are responsible for the validation of tools and reports that are used by both internal and external sources. They also respond to ad hoc requests to support different management teams in the hospital, provide feedback and analysis to the various leaders within the organization regarding their programs’ performance, and monitor hospital performance while keeping leaders and managers in the hospital informed.
Based on information obtained from reviewing relevant intranet web pages, interviews with the leadership management team, and observation of operational activities, process maps were developed for key areas to visualize the various business processes in the department. A Suppliers-Inputs-Process-Outputs-Customers (SIPOC) chain model was used to construct a visual model of the activities in each area (Figure 3). A SIPOC diagram is a simple high-level process mapping tool often used within traditional Six Sigma projects. 18 This tool has been proven to assist managers in identifying critical stages in the business process needed to yield productive and valuable goods and ideas. 19 In order to develop key performance metrics for any HIM BSC, the literature indicates that it is essential to create SIPOC diagrams for the relevant department areas. As such, SIPOC diagrams were created for Coding and Abstraction (Figure 4), Transcription (Figure 5), Records Processing (Figure 6), and Decision Support (Figure 7).
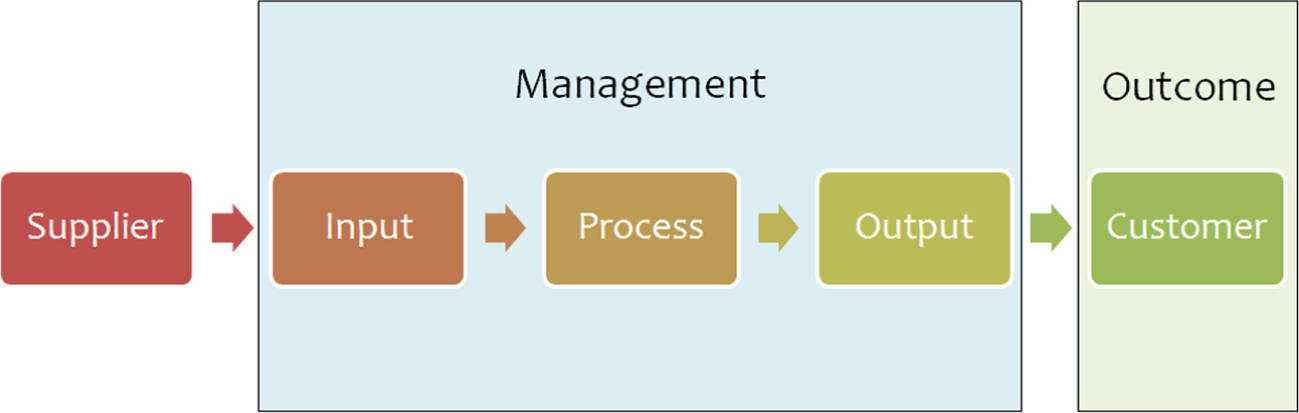
Supplier-input-process-output customer basic diagram.
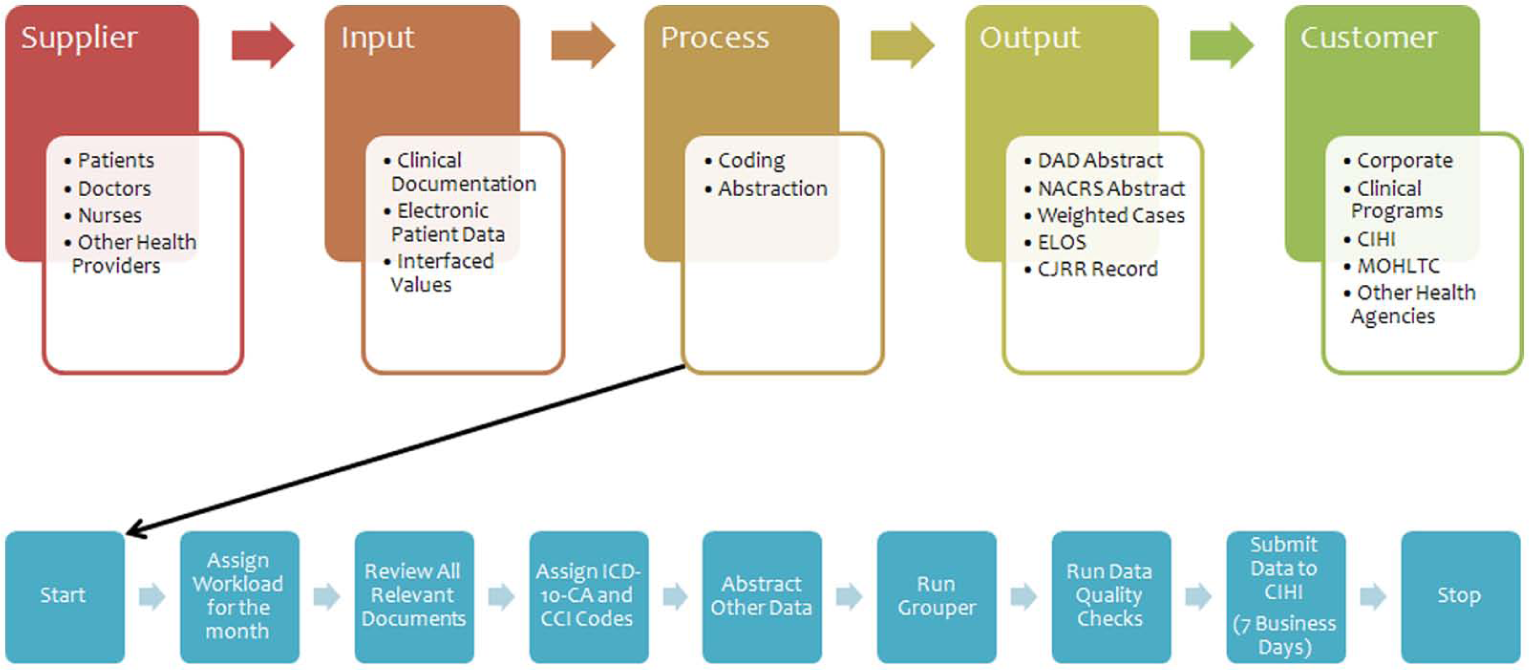
SIPOC diagram—coding.
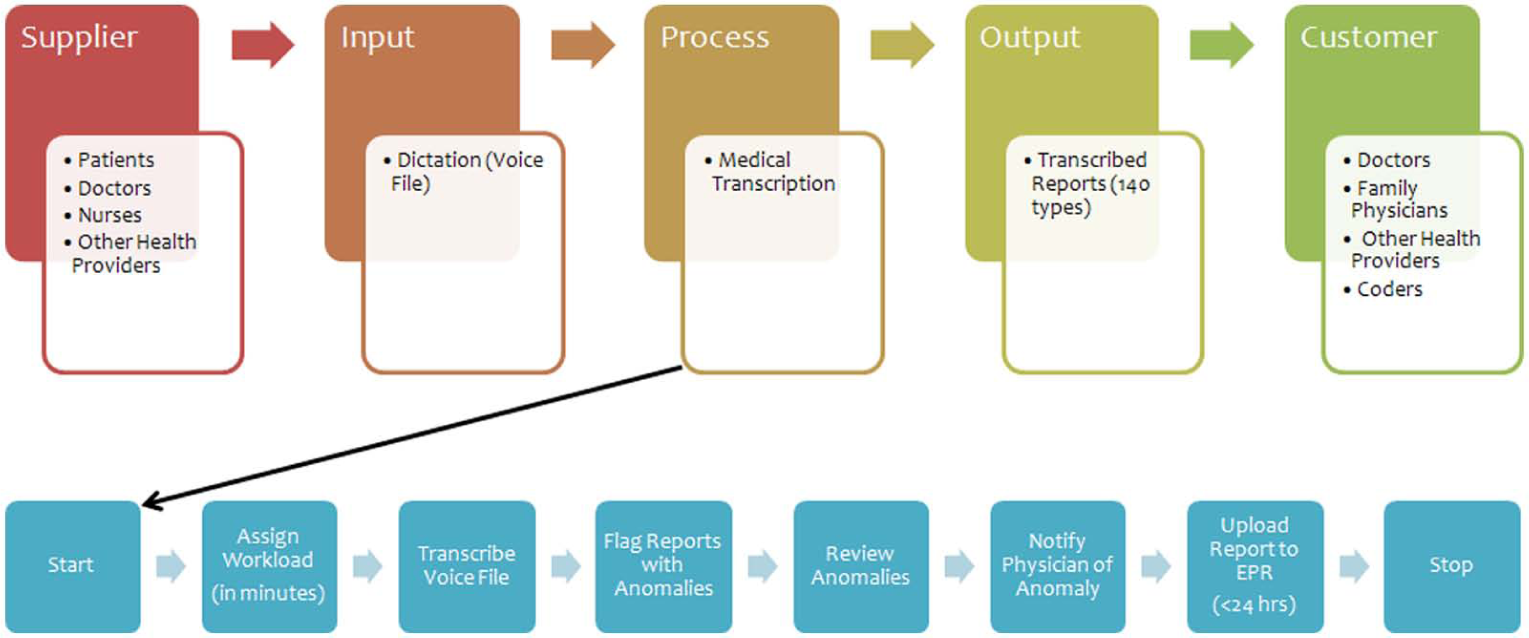
Supplier-input-process-output customer diagram—transcription. Contractor performs a random review a transcribed reports (5%). Internal review is also conducted.
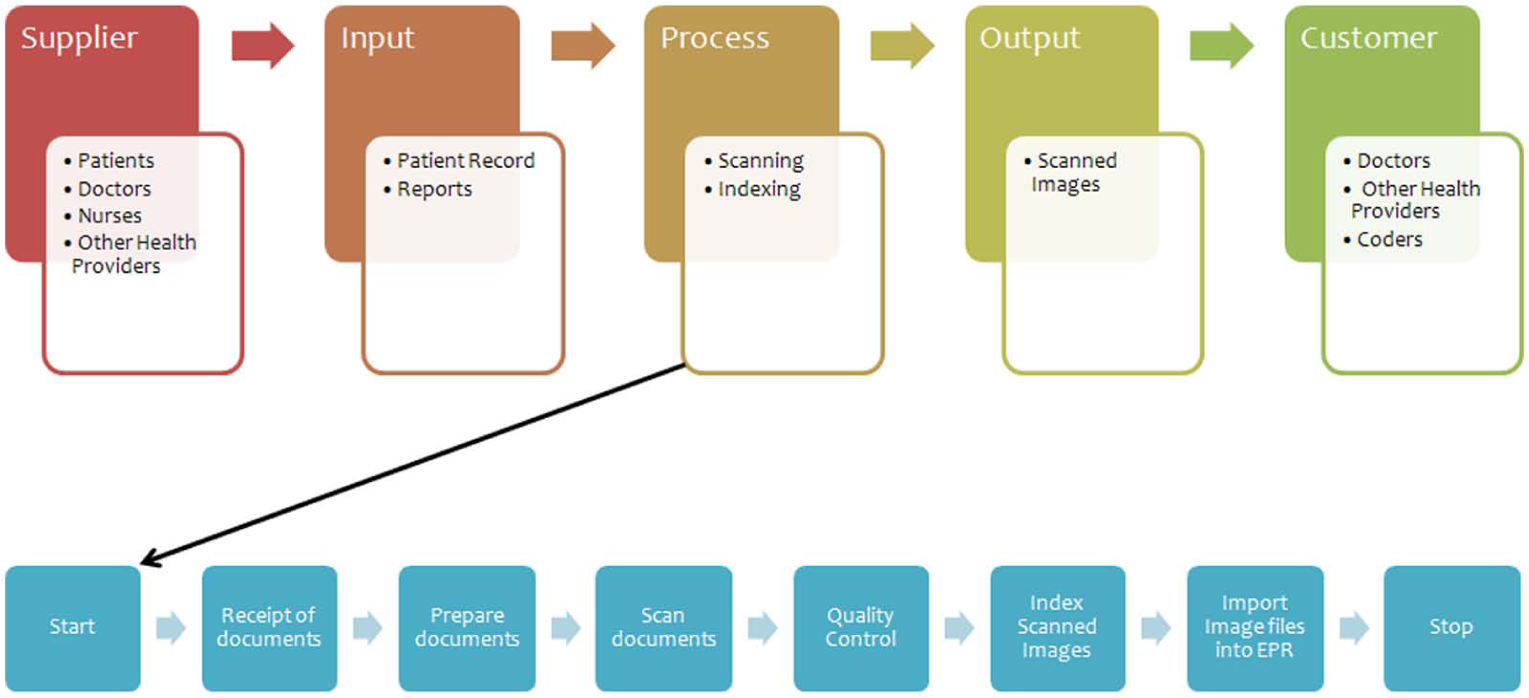
Supplier-input-process-output customer diagram—records processing.
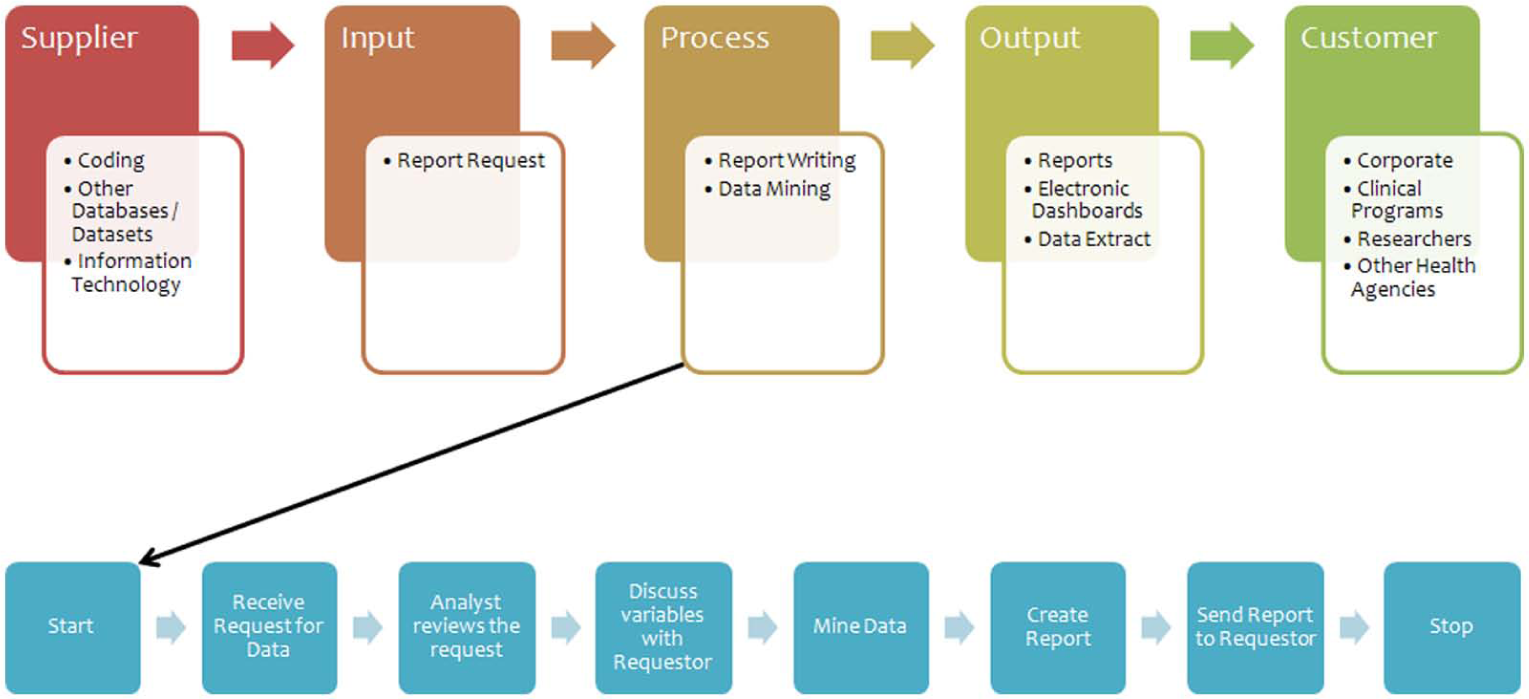
Supplier-input-process-output customer diagram—decision support.
An information flow map was also constructed to identify key data sources for the performance indicators (Figure 8). Five data sources were identified: (1) Finance, (2) Human Resources, (3) Coding, (4) Cerner (the information technology management service provider), and (5) Data Mart(s). The completion of this phase required 2 months.
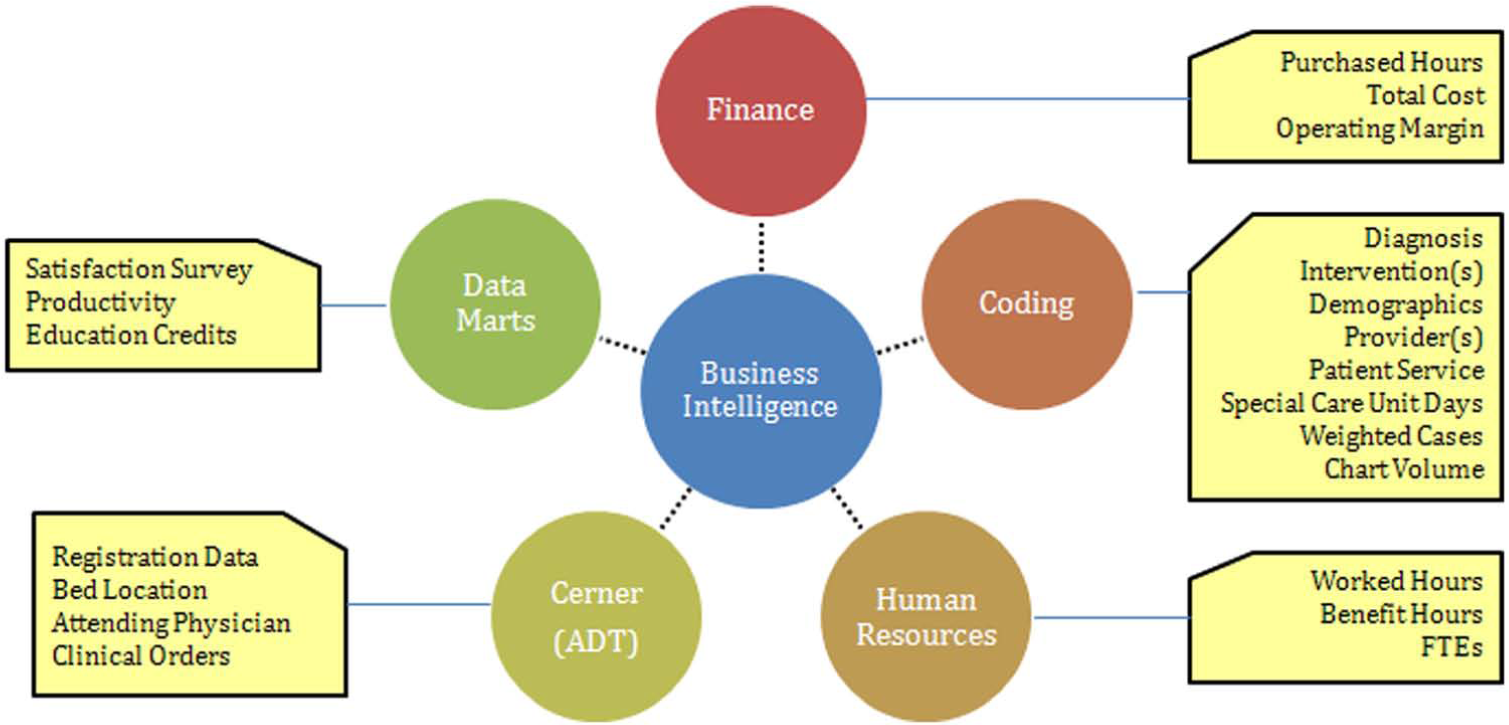
Information flow map.
Development phase
Good performance metrics have the characteristics of being relevant, understandable, timely, comparable, reliable, and cost effective, 21 which formed the basis for the final metrics selected. Using the SIPOC chain model developed in the initial phase, four major categories of performance indicators were identified: (1) input measures, (2) process measures, (3) output measures, and (4) outcome measures. Within each major category, subcategories of indicators were created. An inventory of metrics was developed consisting of 52 potential indicators representing all of the key areas in the HIM department. Performance indicators were narrowed down through consultation with the director and members of the leadership management team. This selection and refinement of indicators required 1.5 months to complete.
A total of 20 performance indicators made up the final HIM BSC design (Figure 9). Although the individual performance indicators may vary from one institution to another, it is important to consider including indicators from across the various categories of (1) input measures, (2) process measures, (3) output measures, and (4) outcome measures. The final design and technical report of the HIM BSC was presented to the director for review and approval. The technical report contained key information about each indicator, which included a supporting definition, method of calculation, any relevant reference, and additional explanation when required, target levels, the data source used to derive the target levels, reporting responsibility, and status. To identify the priority levels of the indicators within the HIM BSC, the leadership management team was asked to complete the AHP questionnaire. This survey tool was distributed online for 2 weeks via Survey Monkey. The distribution and analysis of the survey required 1 month to complete.
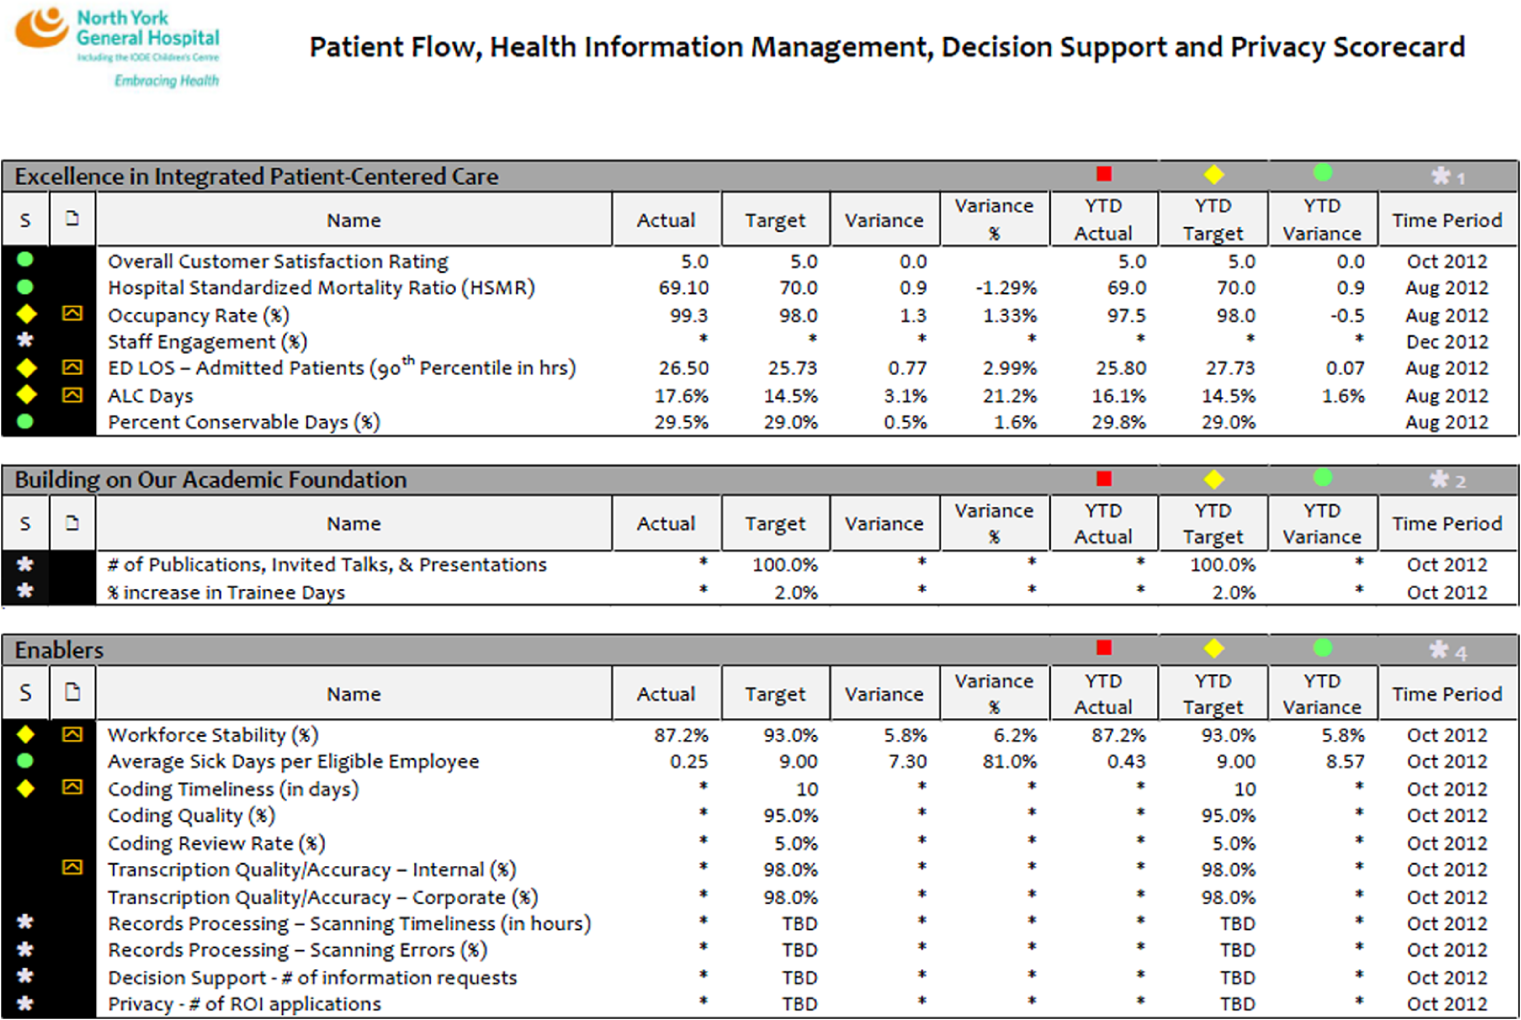
HIM balanced scorecard final design.
A meeting with 45 participants was organized to provide an opportunity for the HIM staff to learn more about the corporate strategy and their role in helping achieve the organization’s goals and initiatives. Members of the senior executive team were invited to talk about the hospital’s strategic directions and the strategic plan for the next 3 years, which provided the opportunity to demonstrate how the HIM BSC could support the larger hospital goals. The completion of the entire development phase required 3 months.
Evaluation phase
Following the staff meeting, all participants were given a paper-based questionnaire to evaluate the utility of the BSC as a reporting tool and to determine the utility of the tool as an effective management tool. The completion of this phase required 1 month.
Results
The AHP questionnaire yielded the following results seen in Table 1. The table reflected prioritization for performance, input, process, output, and outcome measures. The most important in terms of priority was assigned to “outcome” when measuring performance workload. When measuring the input measures, workload was the top priority, while the top priority for process measures was “quality,” and “accuracy” was deemed to be the top priority for the output measures, while “compliance of standards” was the top priority for the outcome measures.
Analytic hierarchy process questionnaire results.
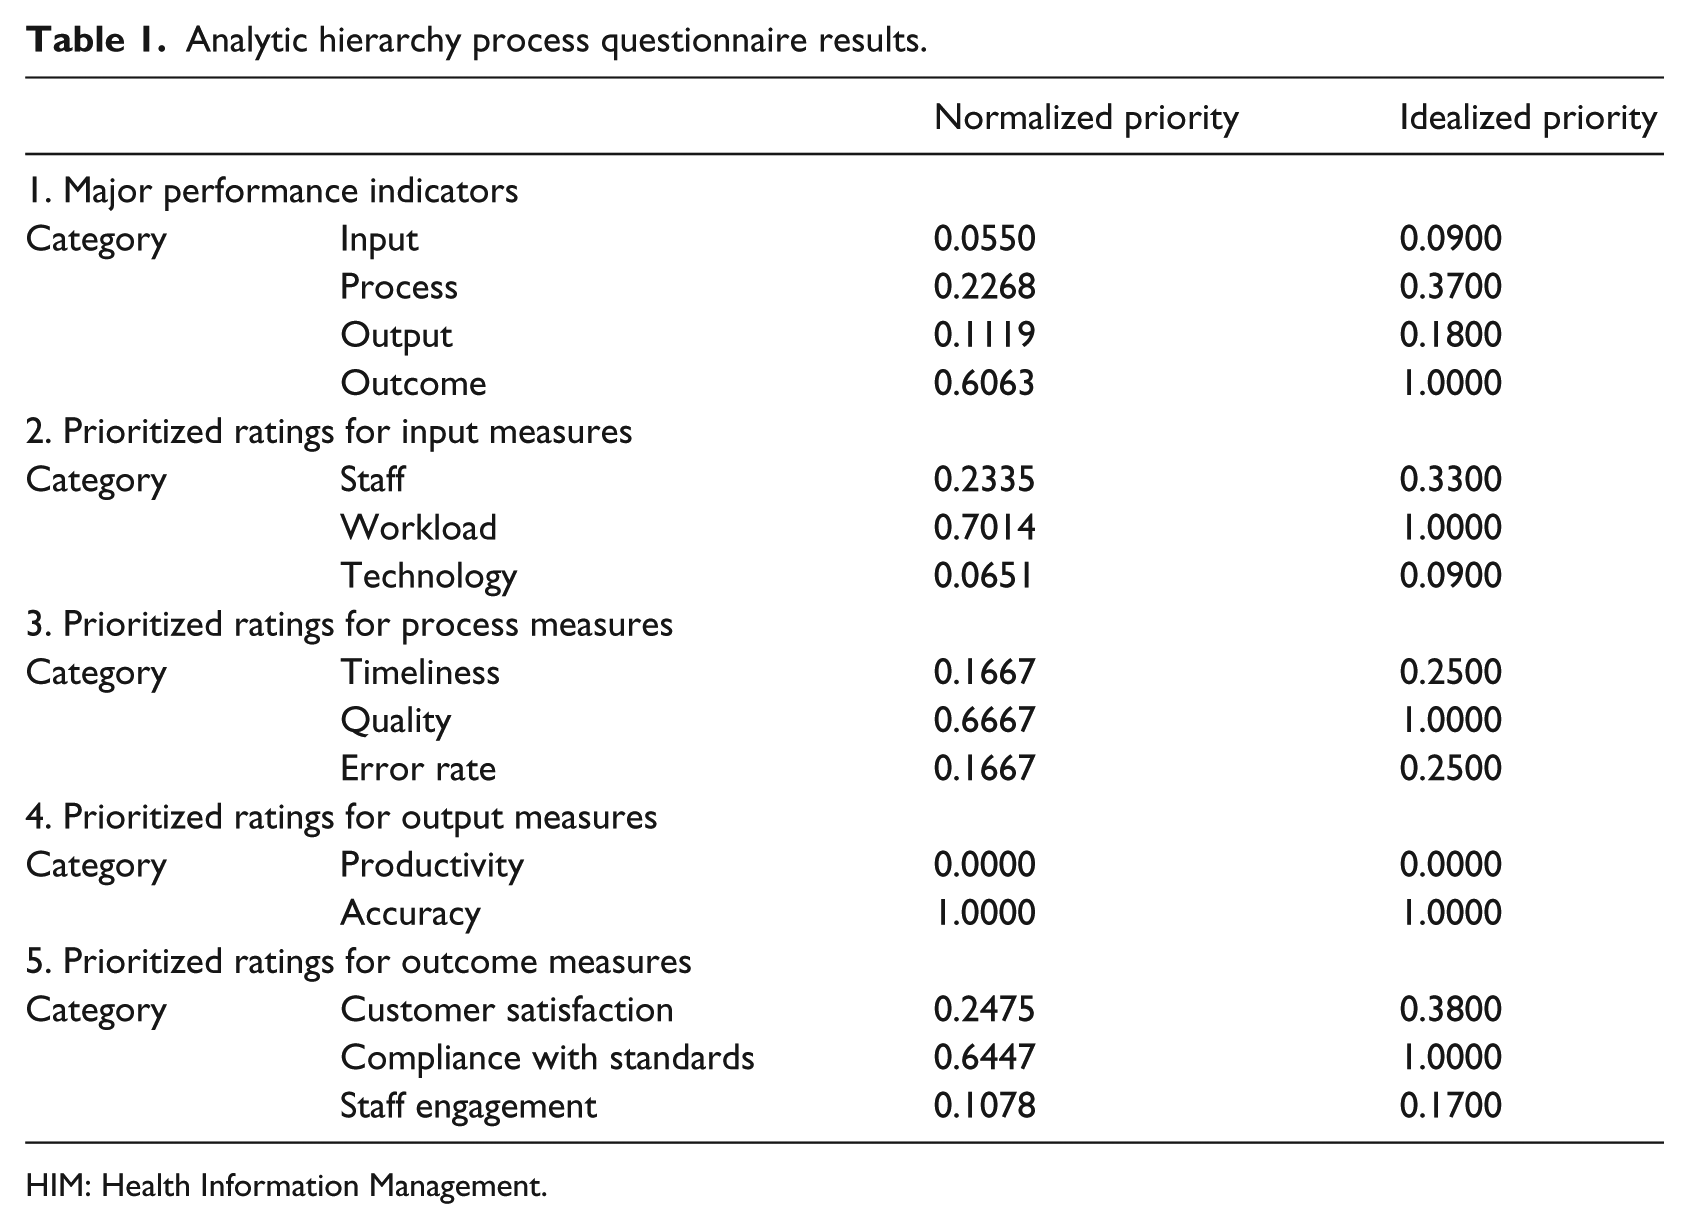
HIM: Health Information Management.
Descriptive statistics were used to analyze the survey responses from the HIM staff following the development of the BSC. There were 45 members of the HIM department who attended the staff retreat with a final response rate of 93 percent (42 respondents). Respondents were categorized based on their role and years of service. Of the 42 respondents, 14 percent (6) were members of the leadership management team, 17 percent (7) were analysts, and 69 percent (29) were frontline and administrative staff. Among the respondents, 2 percent (1) had been working at the hospital for less than a year, 12 percent (5) had been working between 1 and 5 years, 19 percent (8) had been working between 6 and 10 years, and 67 percent (28) had been with the hospital for more than 10 years.
In order to assess the usefulness of the HIM BSC as a performance-reporting tool, respondents were asked to provide their opinion on the number of indicators in the scorecard. In all, 83 percent of the leadership management team indicated that the number of indicators in the scorecard was “just right” compared to 43 percent of the analysts, and 83 percent of the frontline and administrative staff, respectively. Overall, 76 percent of the respondents indicated that the number of indicators in the HIM BSC was “just right.” Respondents were also asked whether the scorecard was easy to understand. In all, 95 percent of all respondents indicated that the scorecard was “very easy” and “somewhat easy to understand” and also agreed and strongly agreed to the statement: “The HIM scorecard is a useful tool in reporting performance” (Table 2).
The HIM balanced scorecard as a performance-reporting tool.
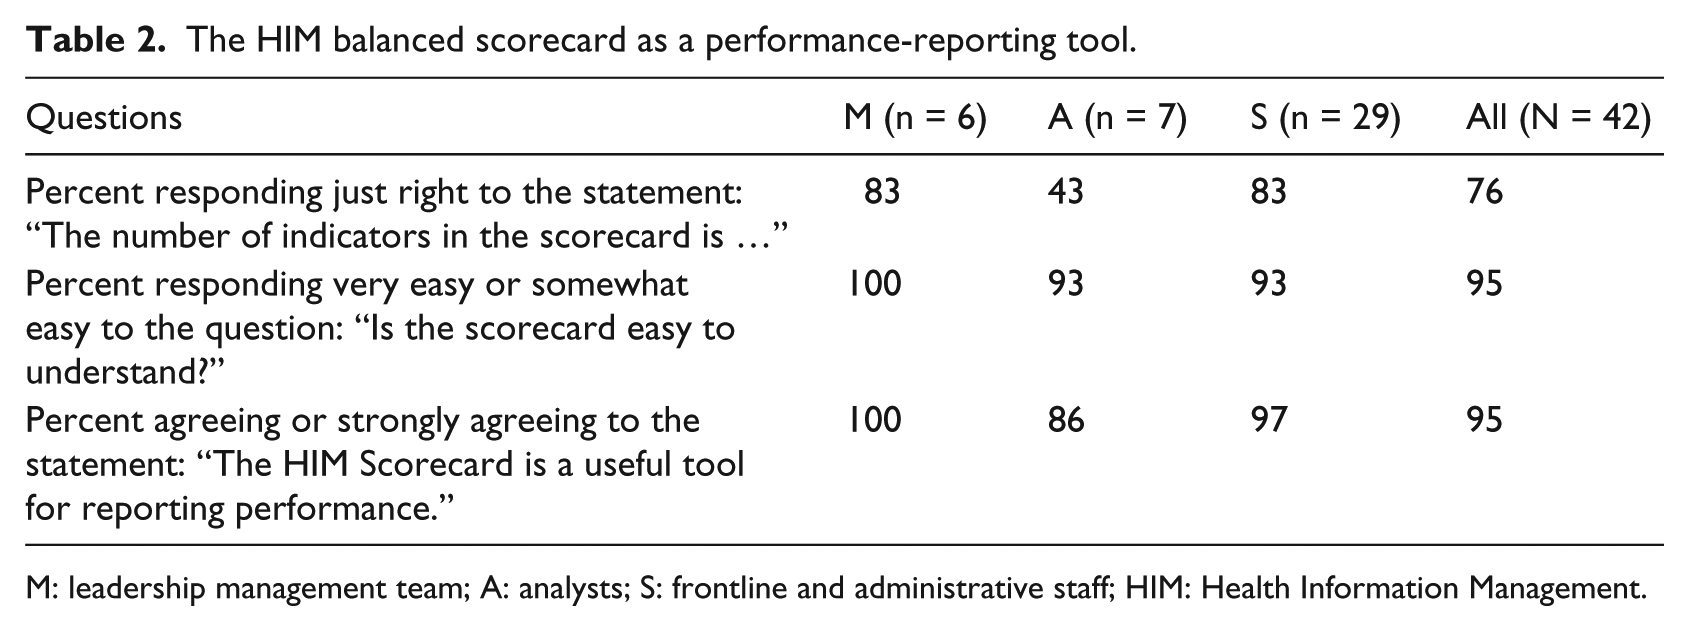
M: leadership management team; A: analysts; S: frontline and administrative staff; HIM: Health Information Management.
In order to assess the usefulness of the HIM BSC as a management tool, respondents were asked to select the most suitable response to the following statement: “The HIM scorecard is a useful tool in managing performance.” All of the leadership management team agreed and strongly agreed to this statement compared to 71 percent of analysts and 72 percent of frontline staff. An overall 76 percent approval rating for the whole group was calculated. Respondents were also asked to evaluate the level of alignment of the HIM scorecard indicators to the corporate strategy. Overall, 81 percent said that the indicators were completely and partially linked (Table 3).
The HIM balanced scorecard as a management tool.
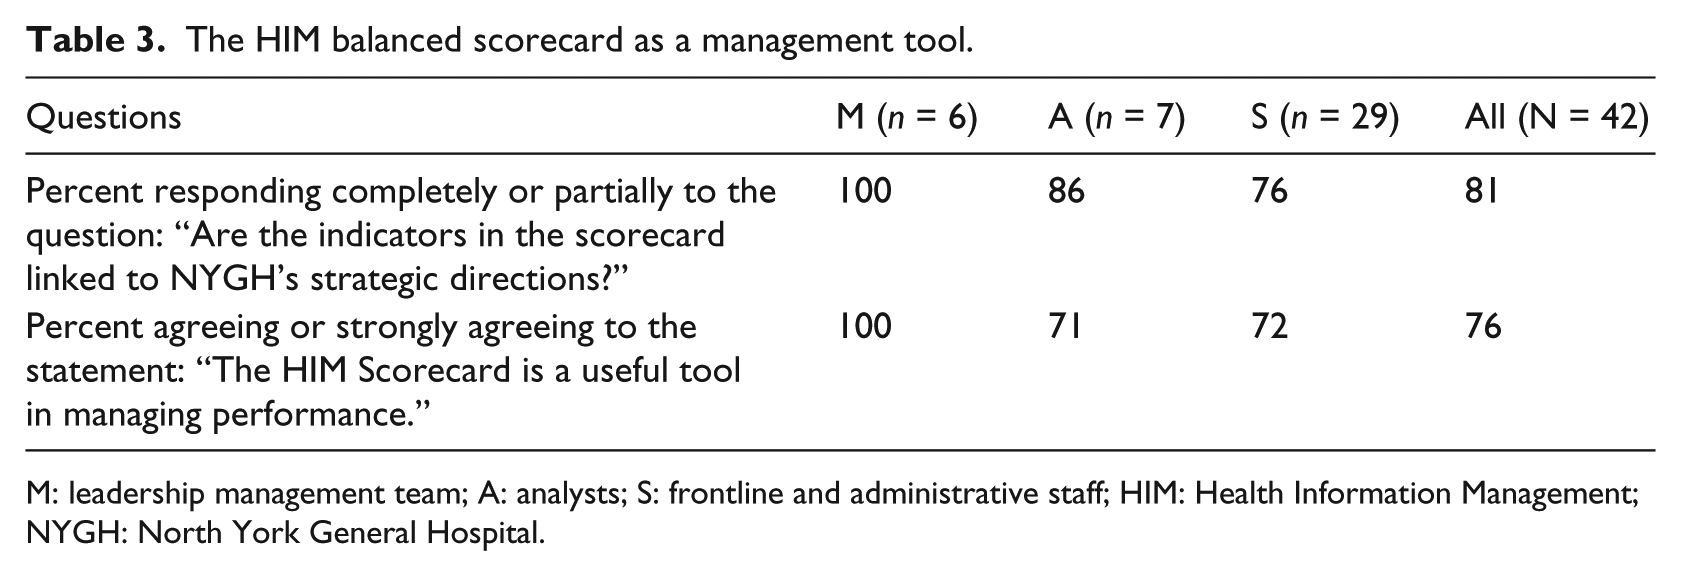
M: leadership management team; A: analysts; S: frontline and administrative staff; HIM: Health Information Management; NYGH: North York General Hospital.
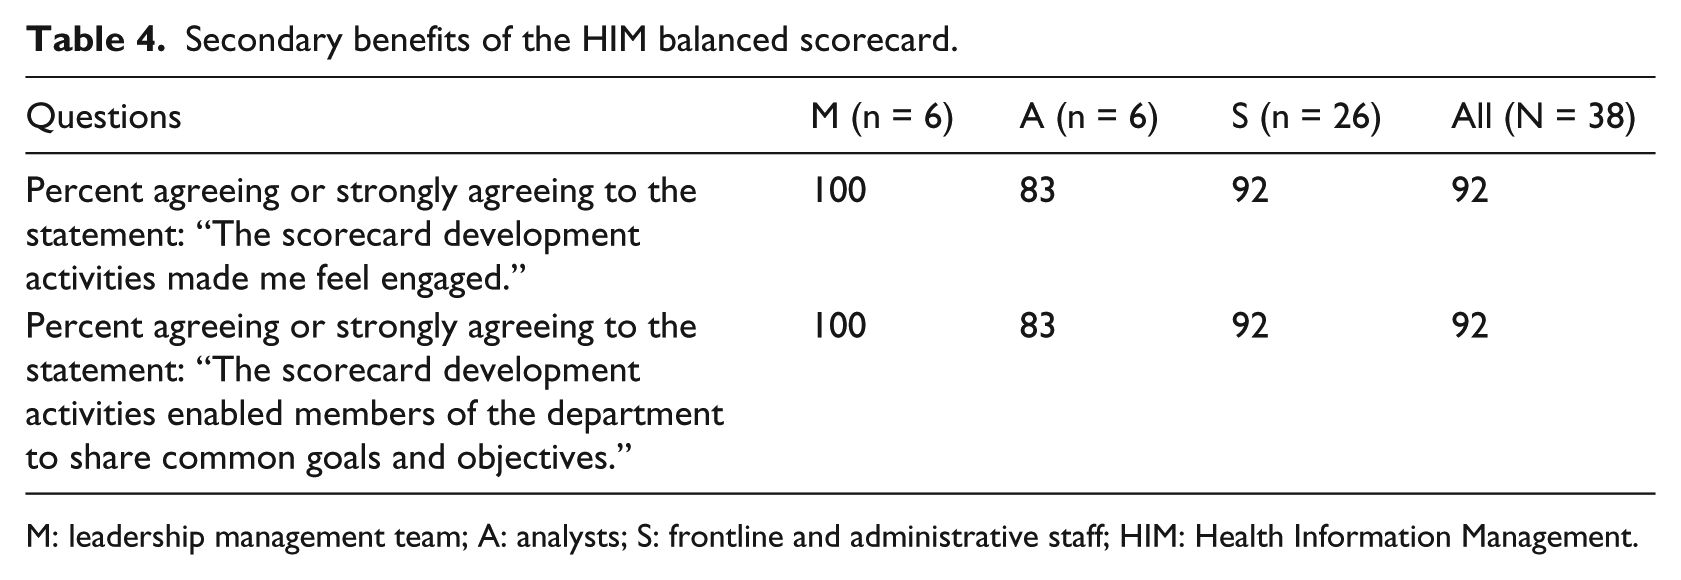
The last section of the survey assessed staff views on the secondary benefits of the HIM BSC development and implementation. Respondents were asked whether the scorecard development activities made them feel engaged. Overall, 92 percent of the respondents indicated that they felt engaged. Respondents were also asked whether the scorecard development activities enabled members of the department to share common goals and objectives. A total of 92 percent of the respondents answered “agree” and “strongly agree” to this question (Table 4).
Secondary benefits of the HIM balanced scorecard.
M: leadership management team; A: analysts; S: frontline and administrative staff; HIM: Health Information Management.
Discussion and recommendations
The Canadian healthcare environment is rapidly changing. Thus, in order for healthcare organizations to optimize their successful delivery of services they must be responsive and actionable to change within the environment through the utilization of innovative and evidence-based approaches. As a result, hospitals in Ontario are required to publicly report several performance indicators within their BSC, which are largely focused directly on patient outcomes and quality of care, but do vary between institutions. 22 Thus, there exists some variability between hospitals, and, currently, HIM-specific indicators are not being captured within the BSC of any hospital because they are not ministry reportable indicators. The inclusion of HIM indicators in a hospital BSC will allow the leaders and managers in different levels of an organization to stay focused and well informed about their departmental progress, as it will enable them to align their departmental operations with the larger hospital BSC, and this will promote evidence-based management. The findings from the evaluation of the HIM BSC indicated that the HIM managers, staff, and analysts felt that it was both a useful performance-reporting tool and a useful management tool.
However, according to the literature, subsequent evaluation should be performed after a BSC has been in use for a few years. As cited by Barnardo and Jivanni, 17 according to Kaplan and Norton, it takes 2–3 years for a BSC to fully integrate into the management culture. For this reason, it is highly recommended that a formative evaluation be carried out to assess the effectiveness of the tool in fulfilling the HIM departmental strategy a year or two after its implementation. As well, performance metrics should be reviewed and analyzed on a yearly basis to test the relevance of each measure to the department’s strategy14,21 and the wider hospital’s corporate strategy.
Thus, the evaluation tools used in both the planning and development phases within this study can be utilized within other healthcare organizations to assist with the mapping of key departmental processes and the selection of categories of performance metrics to support the measurement of HIM activities. Capturing HIM-specific indicators will help gauge performance and promote process improvement within an HIM department, however, the derived indicators within the current study may not be entirely applicable to other organizations. The health information data within an organization that is used to build an HIM BSC are strongly influenced by several hospital factors that vary from one institution to another and will therefore influence the HIM performance indicators within the BSC. These variations may result in different performance metrics for different types of institutions. Therefore, the utility of the specific indicators as benchmarks may be limited to hospitals that have similar characteristics to the hospital examined within the current study. In general, BSC creation within an HIM department should focus on developing categories of performance metrics, similar to those established within the current study, which are linked to input, process, output, and outcome, but the specific metrics within each category may vary between hospitals of different size and type.
Given the favorable response within the current study from all members of the HIM department, active involvement of HIM staff in all BSC development activities is recommended. In conclusion, the following recommendations are proposed for other HIM departments seeking to develop a BSC based on the success of the current study:
Apply SIPOC mapping to effectively map departmental processes to aid in the development of appropriate performance indicators.
Adopt the AHP to assist with the selection of final BSC indicators.
In addition to continuous process monitoring, conduct a formative evaluation after 2–3 years of BSC implementation.
Ensure active involvement of all members of the department in all phases of the development, implementation, and continuous evaluation of a BSC.
Footnotes
Appendix 1
Appendix 2
Declaration of Conflicting Interests
The author(s) declared no potential conflicts of interest with respect to the research, authorship, and/or publication of this article.
Funding
The author(s) received no financial support for the research, authorship, and/or publication of this article.