
Abstract
The accurate identification and prediction of high-cost Chronic obstructive pulmonary disease (COPD) patients is important for addressing the economic burden of COPD. The objectives of this study were to use machine learning approaches to identify and predict potential high-cost patients and explore the key variables of the forecasting model, by comparing differences in the predictive performance of different variable sets. Machine learning approaches were used to estimate the medical costs of COPD patients using the Medical Insurance Data of a large city in western China. The prediction models used were logistic regression, random forest (RF), and extreme gradient boosting (XGBoost). All three models had good predictive performance. The XGBoost model outperformed the others. The areas under the ROC curve for Logistic Regression, RF and XGBoost were 0.787, 0.792 and 0.801. The precision and accuracy metrics indicated that the methods achieved correct and reliable results. The results of this study can be used by healthcare data analysts, policy makers, insurers, and healthcare planners to improve the delivery of health services.
Keywords
Introduction
In recent years, with overall improvements in living standards, health care is becoming increasingly important worldwide. The total cost of health care is also gradually increasing. In 2006, the total cost of medical and health care in China was ¥984.3 billion, while in 2016 China’s total health expenditure rose to ¥4634.5 billion, an increase of nearly four times. Other countries are showing similar trends in healthcare spending. In the United States, health spending increased from US$680.8 billion in 2006 to US$989.23 billion in 2016. 1
Research into medical expenses is often concentrated on medical management in foreign countries, especially in countries with advanced levels of medical care. Since the 1980s, the potential use of medical insurance administrative claims data for predicting demand has become the subject of considerable research. Many studies have proposed prediction models based on administrative claims data for medical expenses.2–5
These predictive models can be used for individual and group cost predictions, and as a basis for patient intervention in health management. Several algorithms have been used for review of financial reimbursement and insurance pricing. In China, due to the public welfare and nonprofit nature of medical and health services in the past, domestic research into the prediction of medical expenses is rare. There are similar situations in developing countries. Therefore, developing an expenditure-forecasting model that is applicable to countries such as China should provide effective methodological support for controlling the excessive growth of medical expenses, and for the review of medical insurance costs.
Chronic obstructive pulmonary disease (COPD) is a severe chronic disease that is a major cause of morbidity and mortality. In the developed world, COPD is the fastest growing cause of death. 6 In China, air pollution has worsened over the past few years, due to rapid industrialization and urbanization. COPD has become a major leading cause of death in China. There are more than 38 million patients with COPD in China, and the prevalence rate of COPD in patients over 40 years old reached 9.9 percent in 2015. 7
Accurately identifying and predicting high-cost COPD patients are significant steps in addressing the potential economic burden of COPD. Research has been conducted into the predictive modeling of medical costs or expenditures based on claims data, using statistical approaches such as heuristic rules and regression methods.8,9 Most of this research has focused on high-cost profiles among patients who have been diagnosed with specific medical conditions including asthma,10,11 chronic disease,12,13 and cancers. 14 Despite the prevalence of COPD and its debilitating effects on the patient quality of life, most research has focused on the prevention of exacerbation and the management of COPD.15–17 There have been a few studies evaluating the economic burden of this disease. 18 A significant shortcoming of those studies is the predictive approach. Traditional statistical methods are still the most popular. There are few forecasting models that use China’s medical insurance data or claims data. Increasingly, many people have identified machine learning approaches as being valuable for the analysis of healthcare data.19,20 However, a drawback of these algorithms is that they often require many variables with which to build a predictive model. For example, Lee et al. 21 applied neural network and decision tree models to predict the hospital charges of colorectal cancer patients, using 154 variables. Some variables used in research using data from the Medical Expenditure Panel Survey (MEPS), such as body mass index (BMI), smoking status, household income, and family population are unavailable in China,22–24 and the differences in the datasets may affect the performance of predictive models. Therefore, we aimed to develop a model for predicting high-cost patients using China’s existing database, and we tried to identify key predictors among a large number of variables obtained from admissions information, in order to construct a model that still generalizes well.
We ranked the variables, used machine learning approaches to identify high-medical-cost COPD patients, and predicted high-expenditure patients. The model uses a minimal number of high-impact variables, including some that are unique to China. Three algorithms were used: logistic regression, random forests (RF), and extreme gradient boosting (XGBoost). The main contribution of this article is that we implement common machine learning approaches which can be used by medical workers in other regions of China. Similar results can be obtained using key variables, which are easy to collect because Medical Insurance Data in other parts of China includes similar fields. This study follows the recent trend of using machine learning approaches to forecast healthcare-related issues. For example, Liu and Shi 25 developed a predictive model and applied an ensemble of binary classification and regression techniques to predict how many days patients would spend in the hospital in the following year. Araújo et al. 26 applied machine learning classifiers (random trees, naive Bayes, support vector machines, and nearest neighbor) to support healthcare professionals in making pre-authorization decisions. The findings of this study can be of significant value for healthcare data analysts, policymakers, insurers, and healthcare planners for improving the delivery of health services, especially in cases in which the medical data are imperfect.
Materials and methodology
We aimed to use patients’ previous year’s hospitalization information to predict potential high-cost patients for the following year. The research methodology is shown in Figure 1. It is divided into the following steps: (1) we introduce the data of this study; (2) preprocessing the data: sample selection, attribute selection, and definition of the high-cost patient; (3) we use three machine learning methods and their final attributes to build predictive models, and select the best predictive model based on three performance metrics—area under the receiver operating characteristic curve (AUC), sensitivity (SEN), and specificity (SPE); (4) for the best model we rank the impact of the variables, and then use the best model and the key variables to repeat the predictions, and compare the results with the original model.
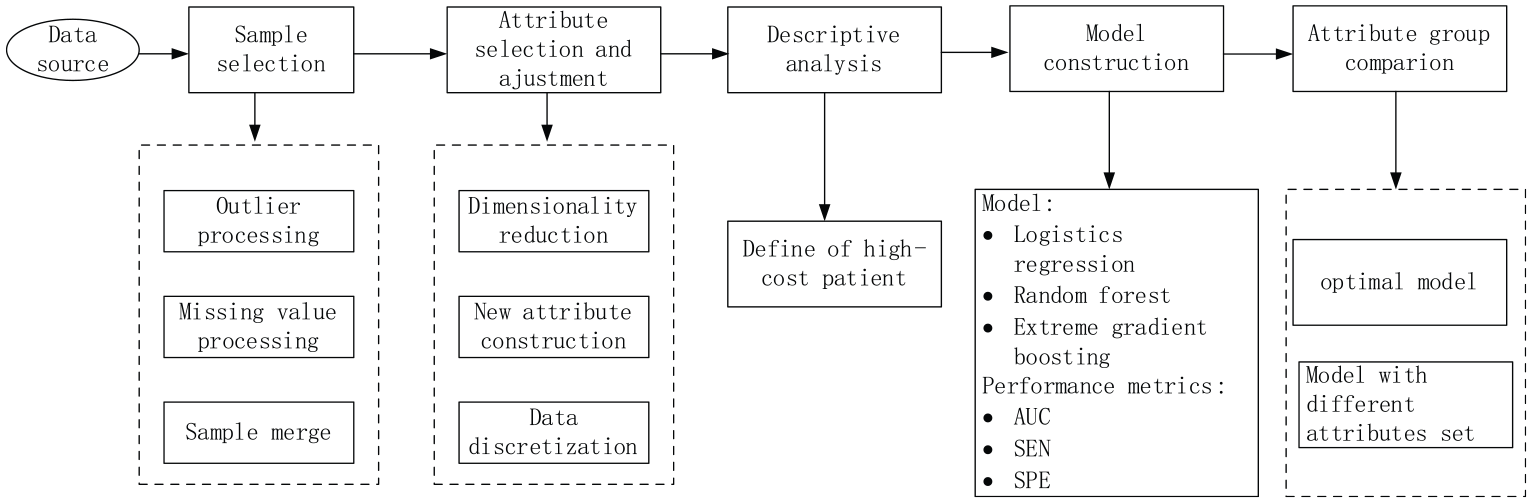
Research methodology.
Data source
This study used Medical Insurance Data from a large city in western China for the period from 1 January 2011 to 31 December 2013. We extracted data from the admission records of COPD patients, whose ICD-10 codes for any of the first three diagnoses were J44.1 or J44.901, with 780,295 records. Each admission record contains basic demographic information, diagnostic information (using ICD-10-CM code, International Classification of Diseases, 10th Revision, Clinical Modification), clinical and medical information regarding hospitalization, together with cost information. Based on an extensive review of all the variables in the database files, we selected 54 basic variables. We grouped the original 54 variables into four separate categories: Demographics (5 attributes), Disease information (8 attributes), Hospitalization information (30 attributes), and Medication information (11 attributes) (Table 1).
The original 54 attributes.
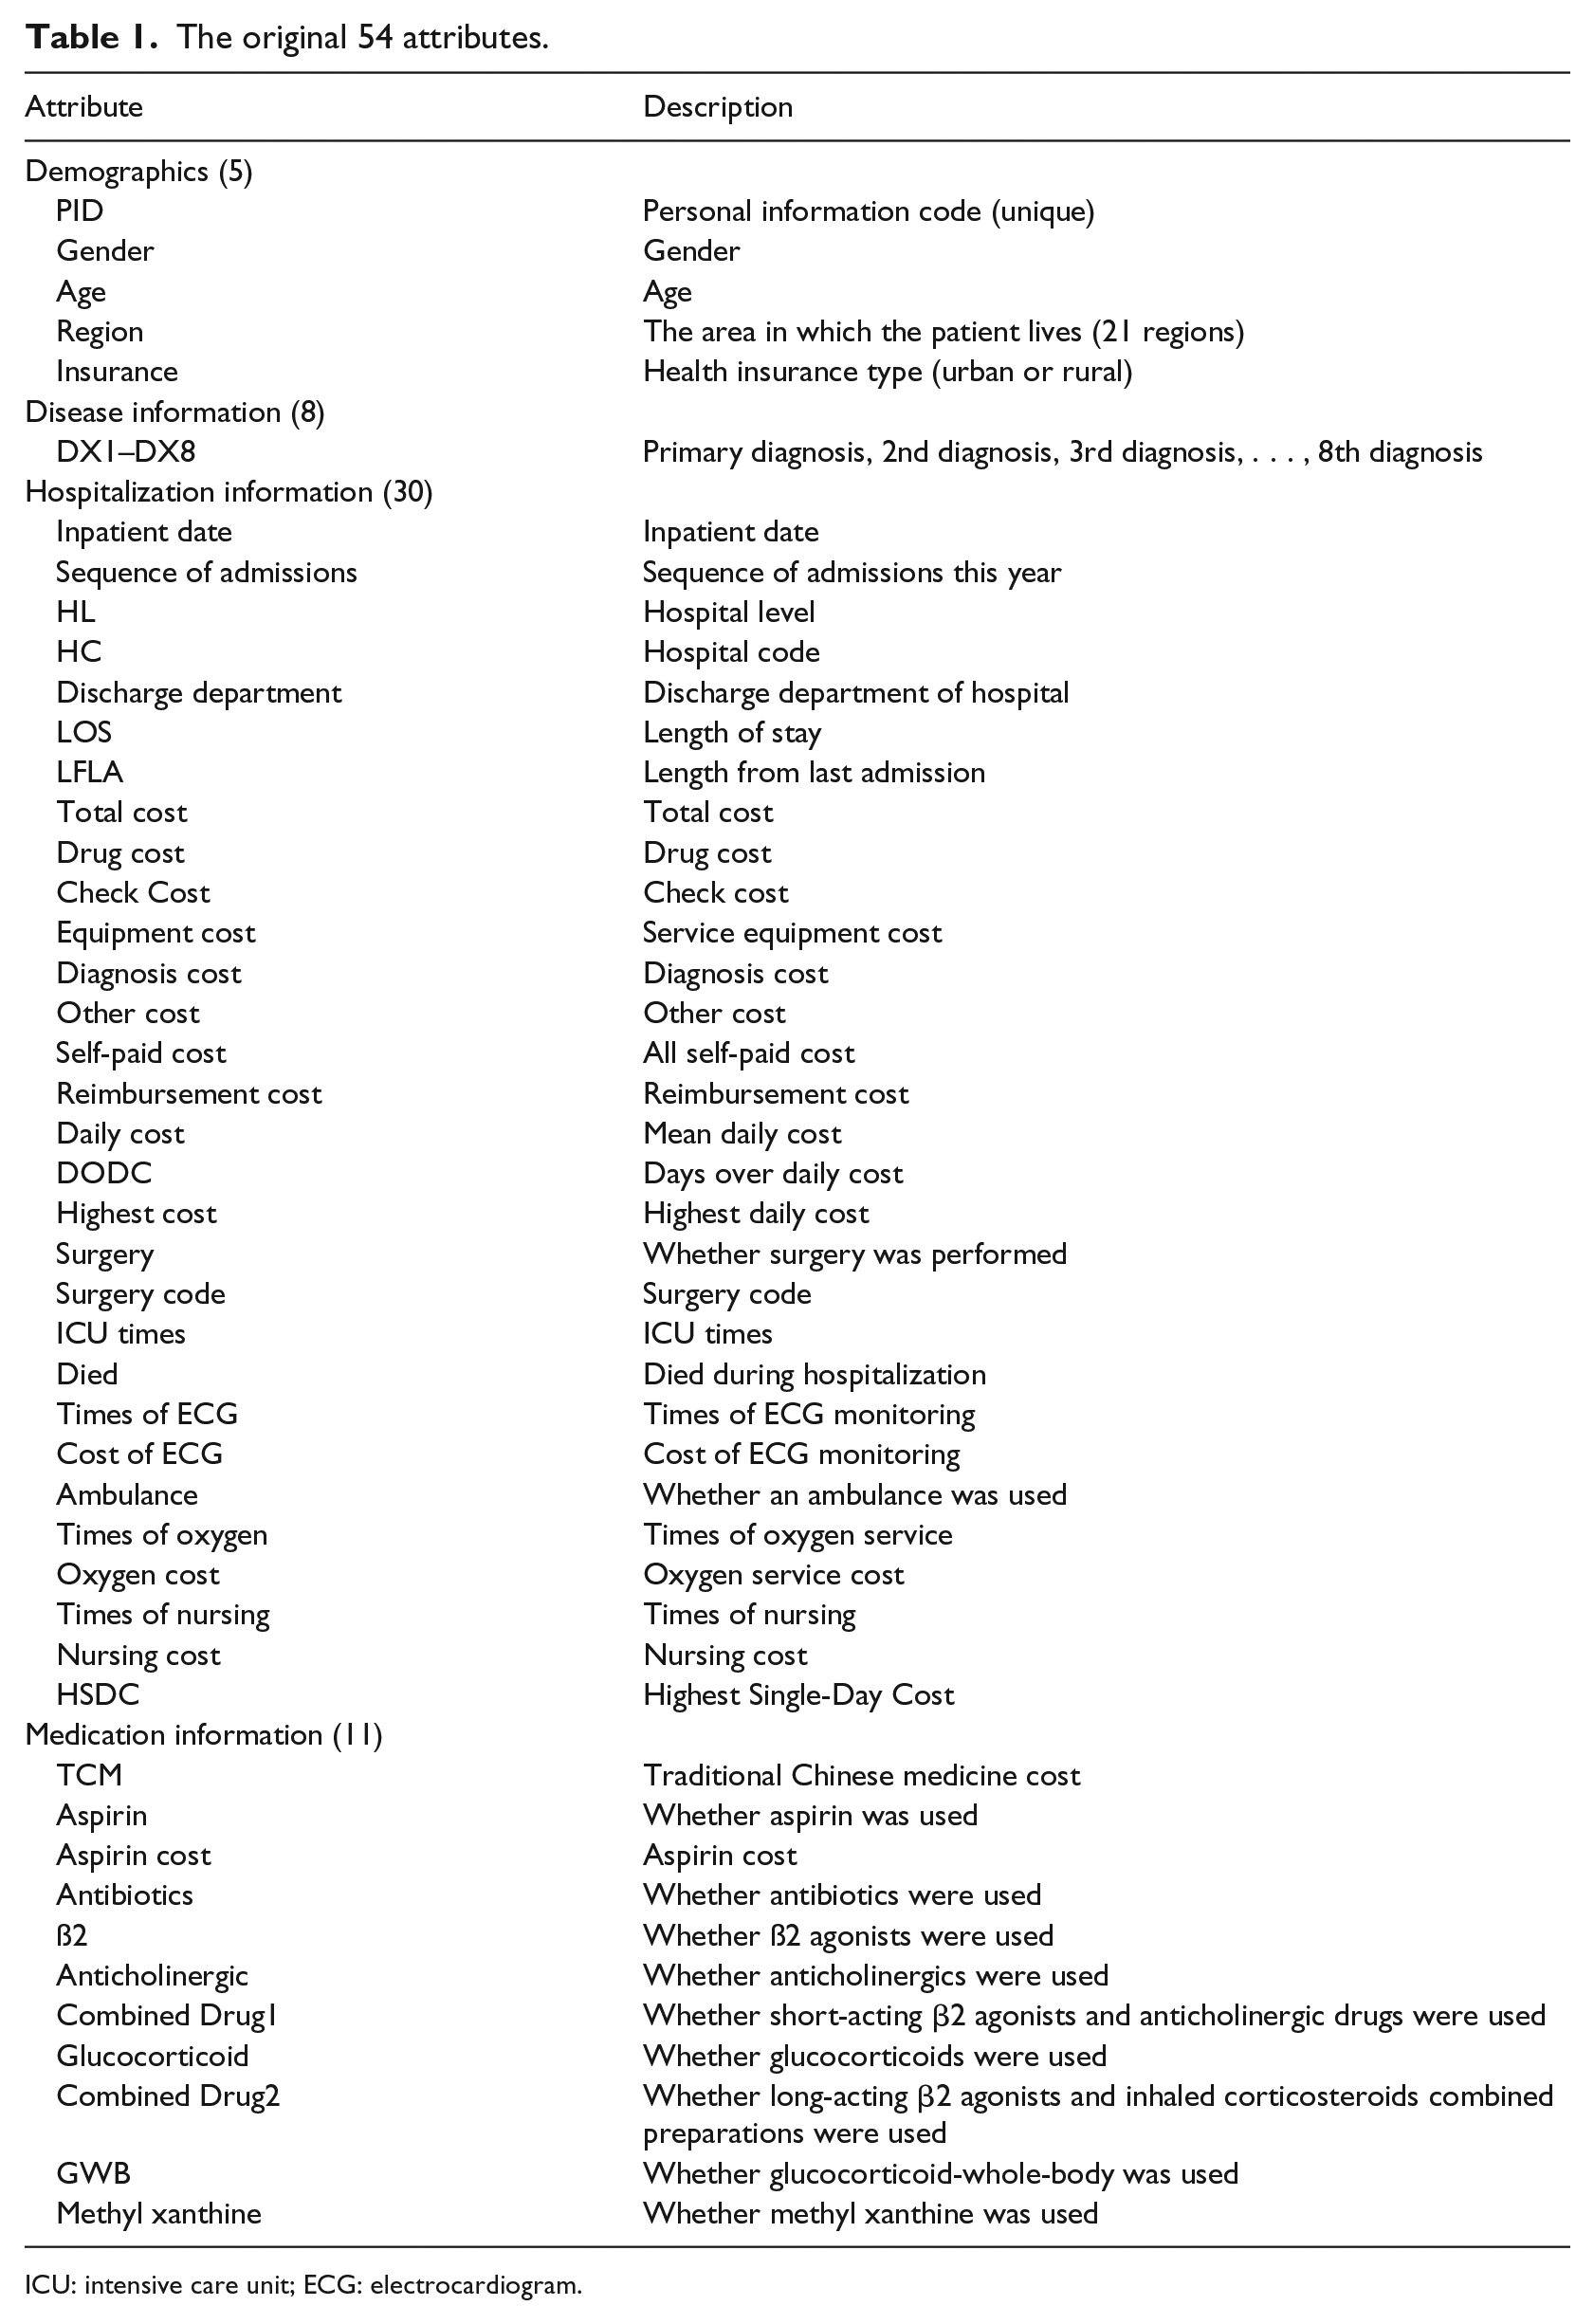
ICU: intensive care unit; ECG: electrocardiogram.
Data preprocessing
High-quality data are important for accurate predictive modeling. Data preprocessing was divided into two phases: sample selection and variable selection. All data preprocessing was performed using the R software.
Sample selection
The primary dataset included 780,295 records, with each record representing one COPD patient’s admission record, and 54 attributes. After removing records with more than 60 percent null values for variables, removing records with negative values or abnormal sex attributes, and discarding records of patients who died during their hospital stay; the final dataset included 650,839 rows. We aimed to predict whether these patients would become high-cost patients in the next year, using the patient’s first-year admission data. Therefore, we needed to merge the records of each patient’s hospital admission by year. After the data were combined, we identified three kinds of COPD patients: COPD patients in 2011 (n = 62,490), COPD patients in 2012 (n = 93,760), and COPD patients in 2013 (n = 106765).
Attribute merger and adjustment
Variables were then merged and adjusted. The detailed conversion of variables is shown in Table 2.
Variables after consolidation by year.
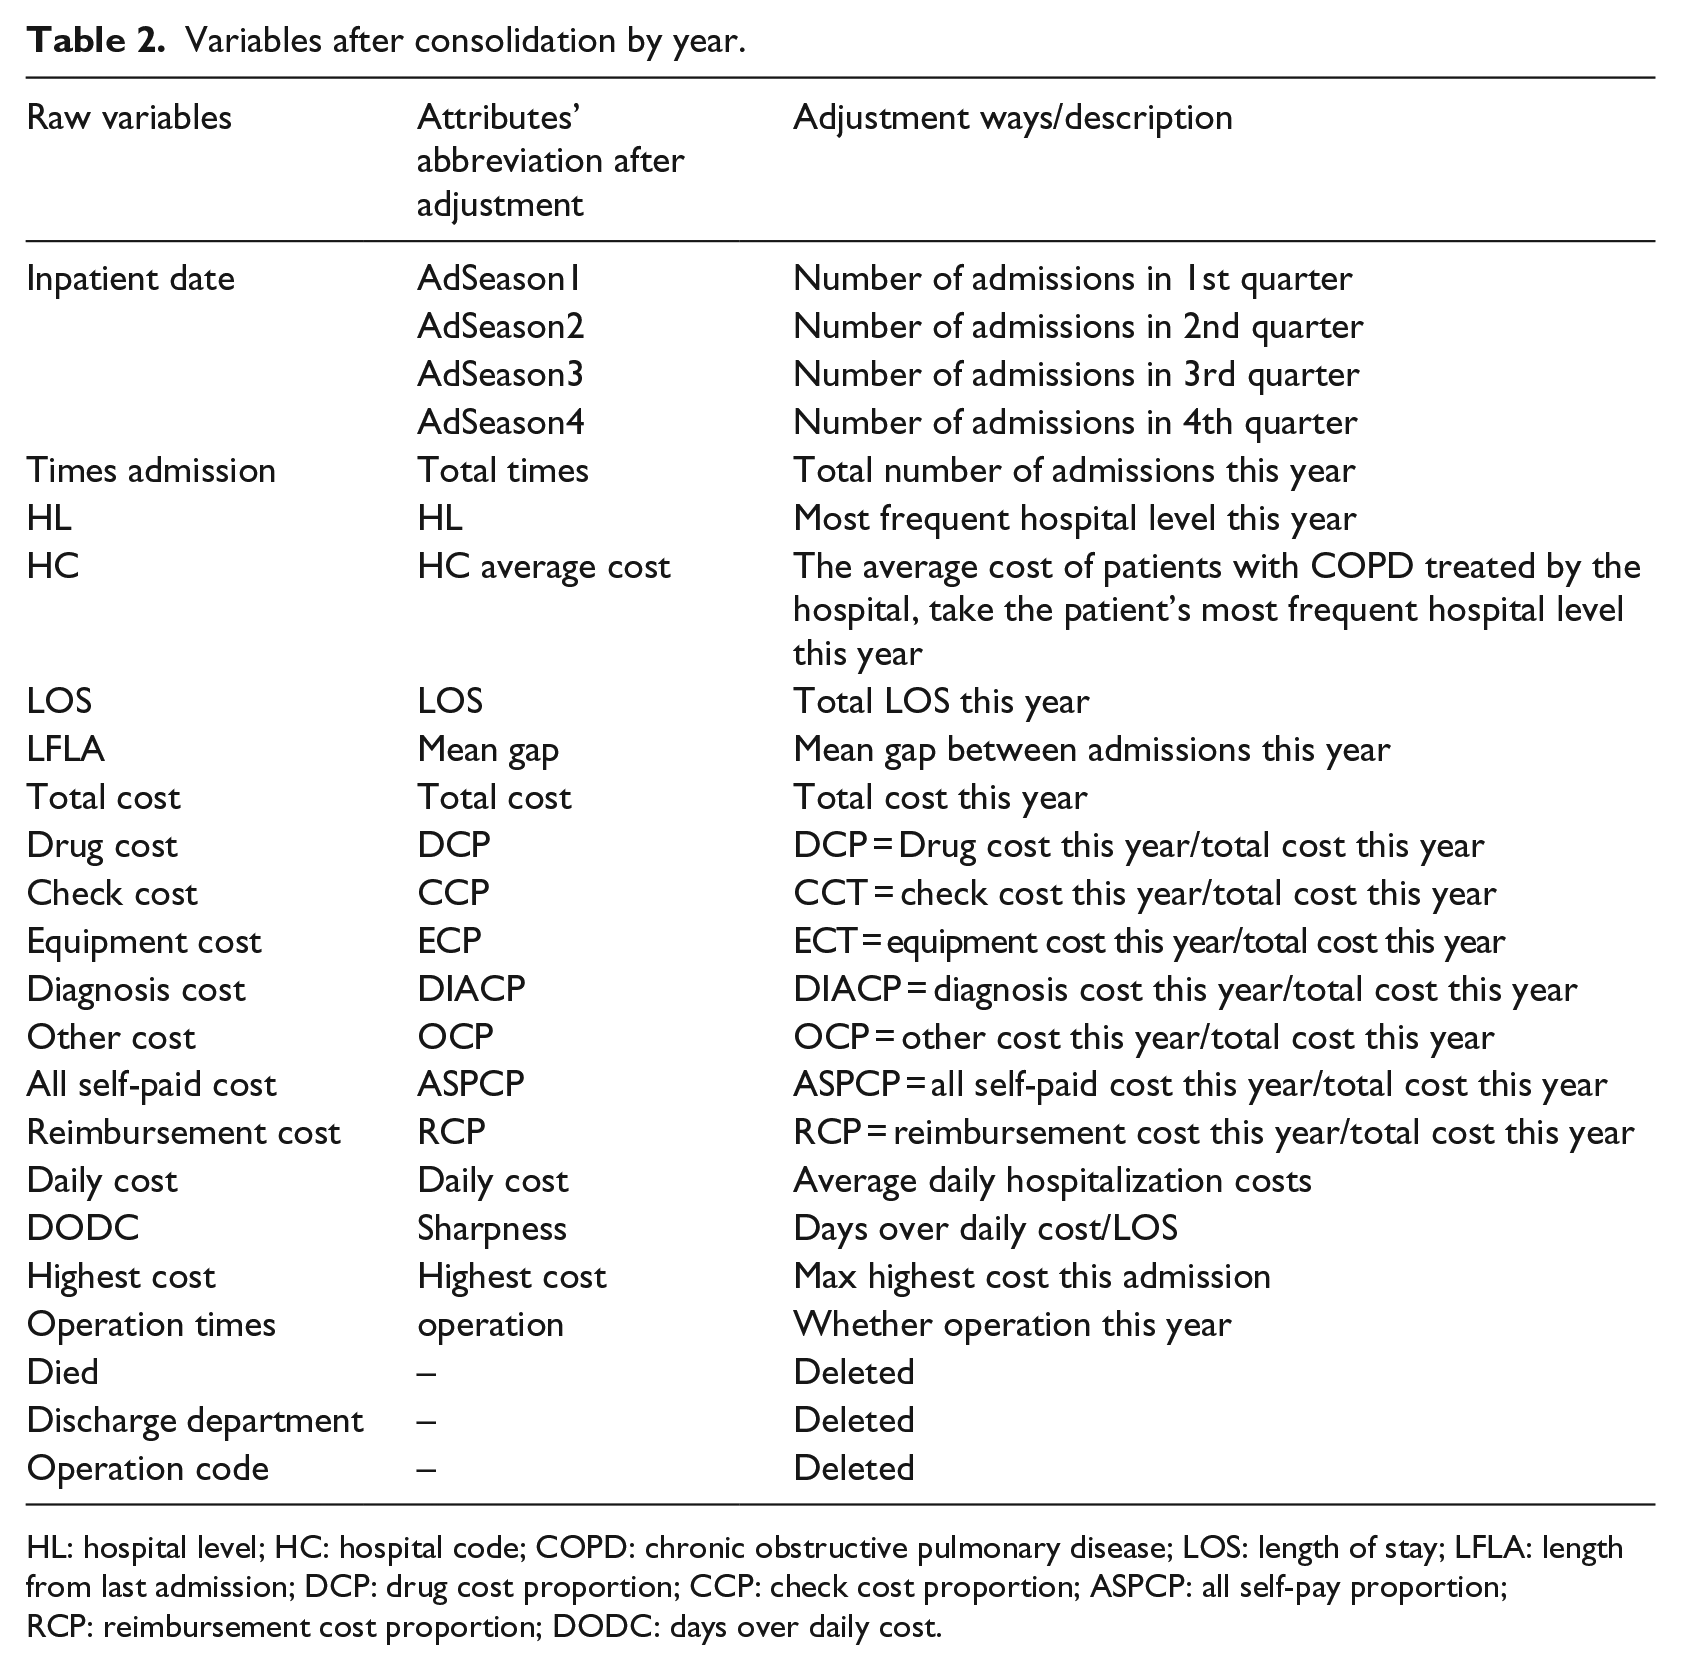
HL: hospital level; HC: hospital code; COPD: chronic obstructive pulmonary disease; LOS: length of stay; LFLA: length from last admission; DCP: drug cost proportion; CCP: check cost proportion; ASPCP: all self-pay proportion; RCP: reimbursement cost proportion; DODC: days over daily cost.
Demographics
In the demographics, after the variables were combined Gender, Age, Region and Insurance were not changed. We removed PID from the demographics group.
Disease information
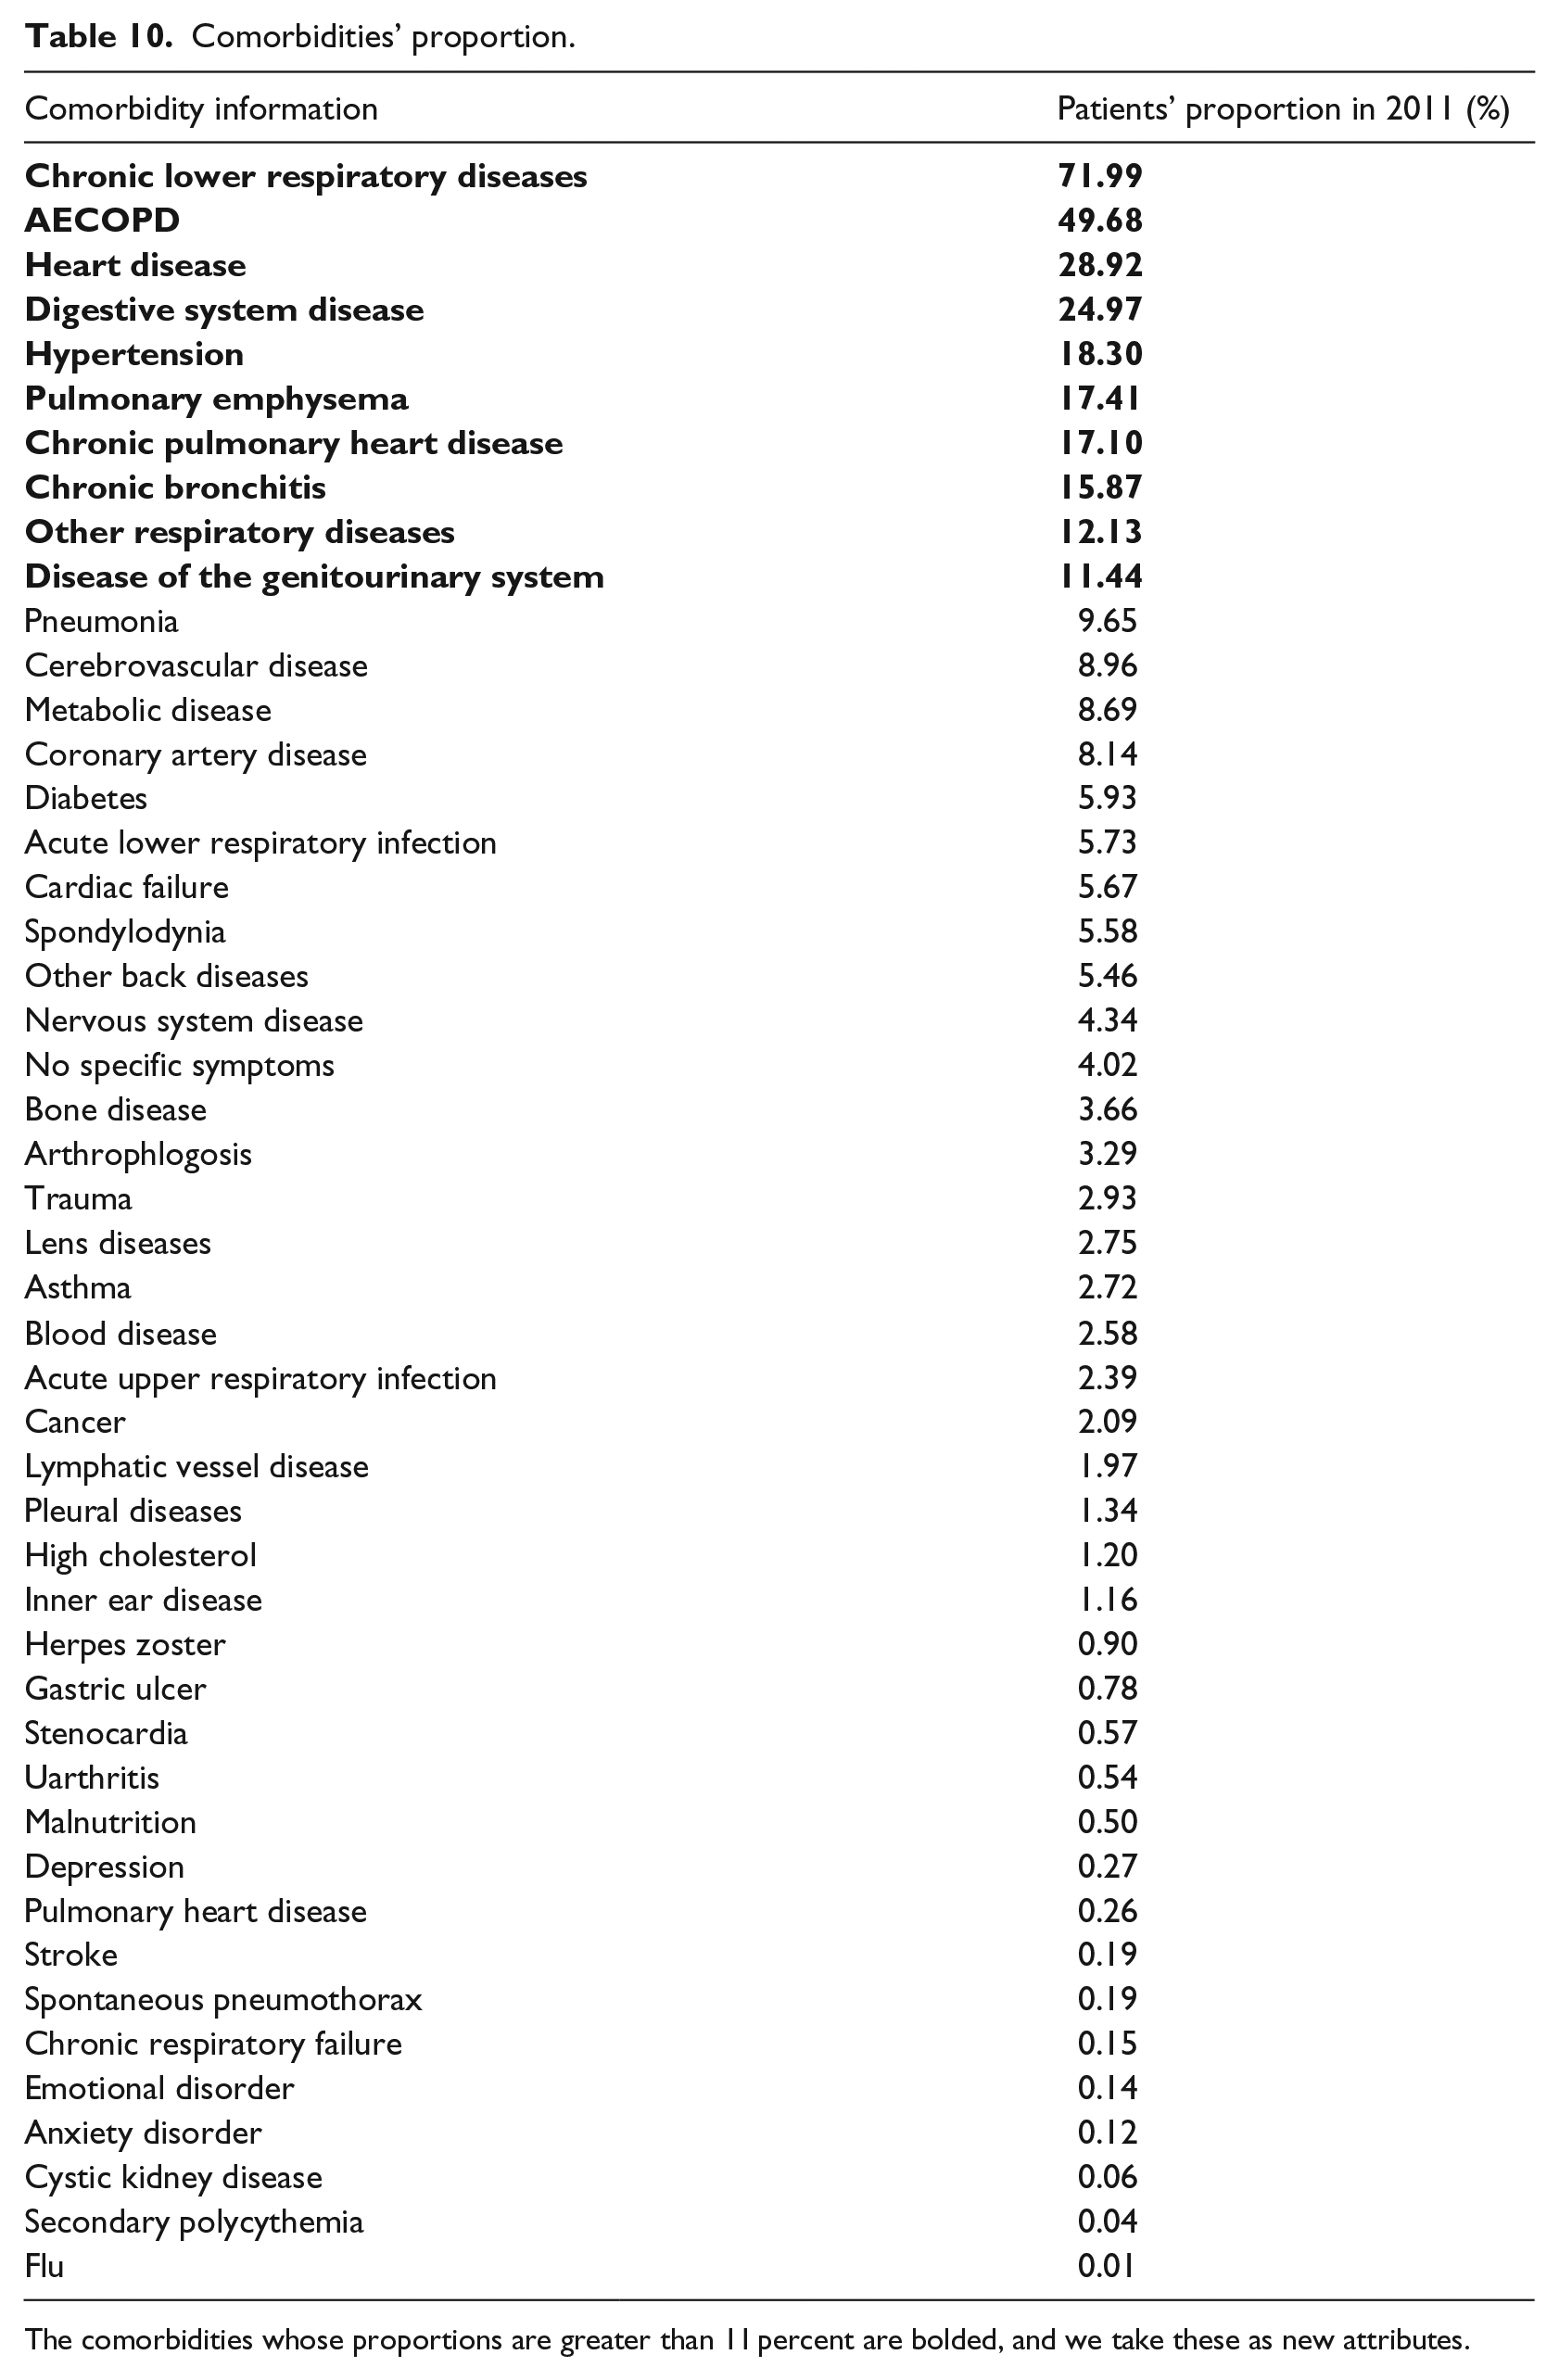
For the diagnosis information, we summarized the comorbidities of these patients by ICD-10 code (Table 9 in Appendix 1), and calculated the number and proportion of patients with comorbidities (Table 10 in Appendix 1). We then added the top 10 ranked comorbidities (comorbidities with proportions greater than 11 percent, shown in bold in Table 10 in Appendix 1), as new attributes. Among those comorbidities, there was high correlation between CPHD, which stands for chronic pulmonary heart disease, and Heart Disease (Pearson’s r = 0.774, significant, p value < 0.001); the correlation between Digestive System Disease and No. Comorbidities (the number of complications) is also highly significant (Pearson’s r = 0.486, significant, p value < 0.001), and the latter are more relevant to the target. Therefore, we removed CPHD and Digestive System Disease from the Disease information group.
We added four new attributes, including Cancer, and Hypertension, because chronic diseases have a large influence on costs for the following year. 27 We also added Which dia. COPD (which diagnosis is COPD) and No. Comorbidities to reflect the severity of the patient’s illness.
Comorbidity is the presence of one or more disorders or diseases co-occurring with the primary disease or disorder. 28 The Charlson Comorbidity Index (CCI) is a weighted index that takes into account the number and seriousness of the comorbid diseases. 29 In our study, we built CCI score sheets for this study using 14 modified CCI conditions, scoring standards and scores (Table 3), as in research published by Sundararajan et al. 30 The scores represent the objective risk of dying associated with each condition. Finally, we calculated the CCI score of each patient based on the modified CCI and discharge diagnosis, and used it as a predictor in the model.
Modified CCI.
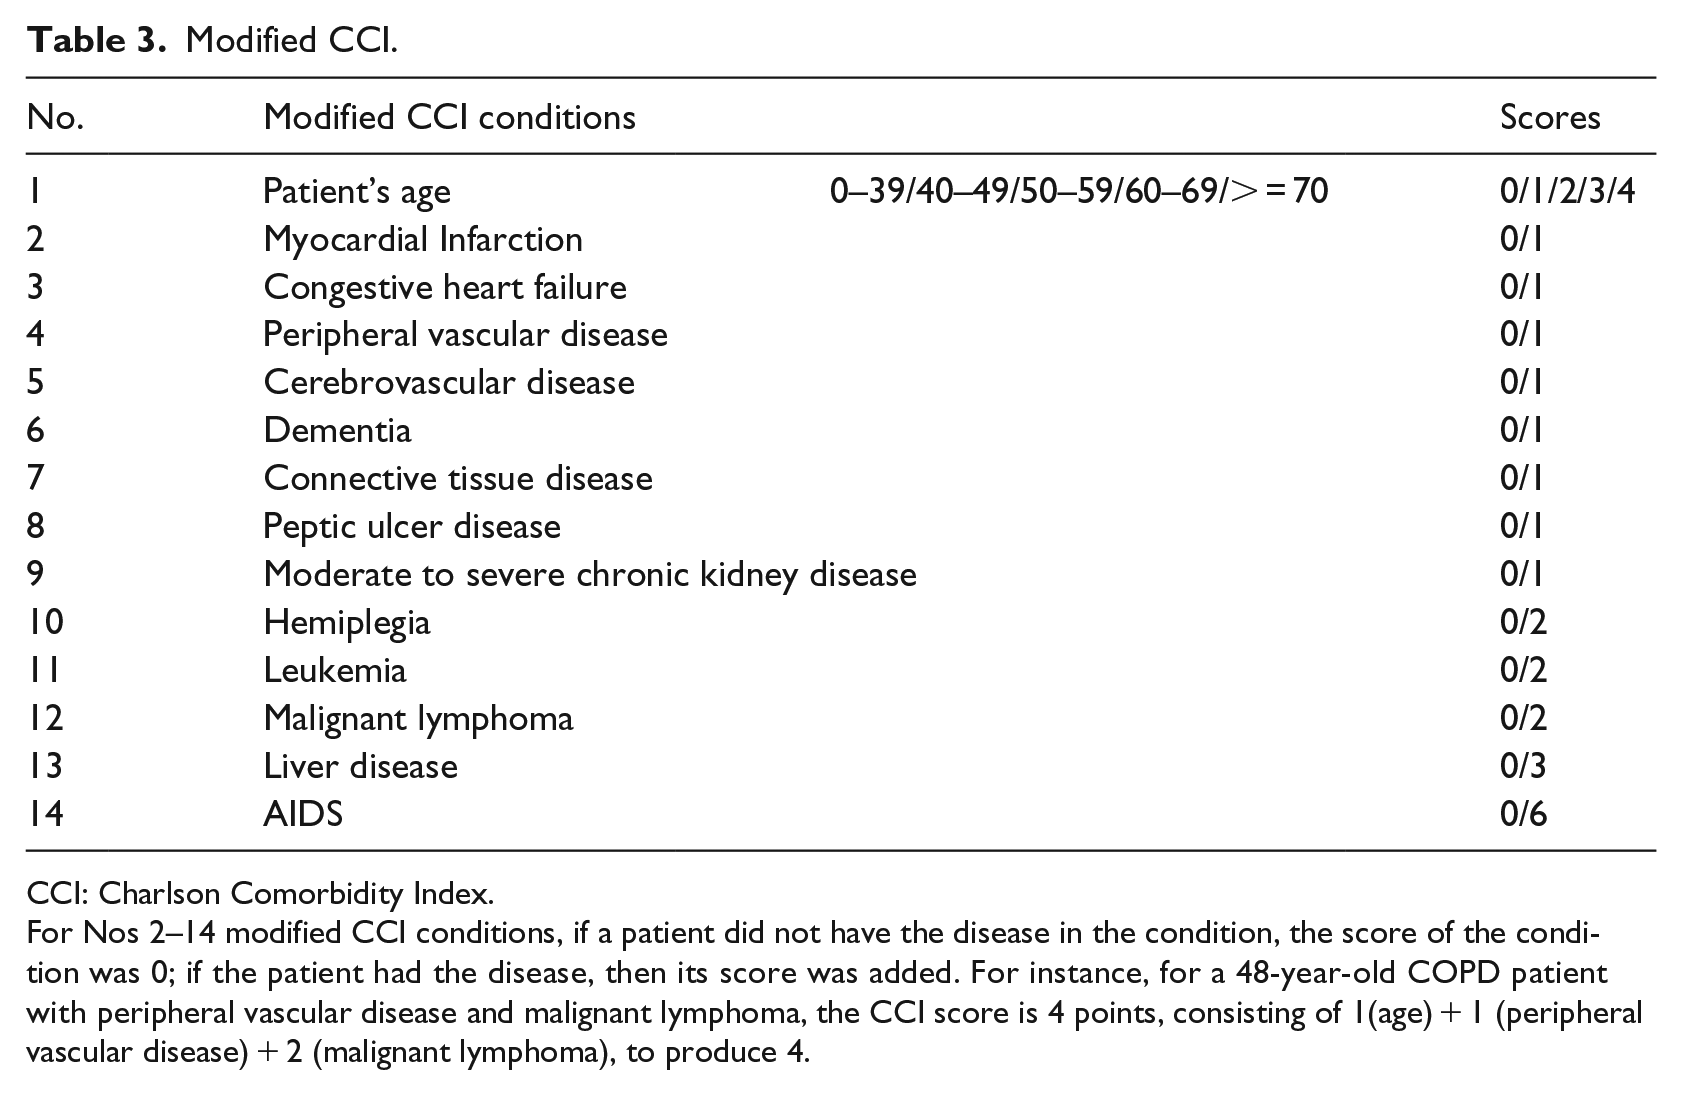
CCI: Charlson Comorbidity Index.
For Nos 2–14 modified CCI conditions, if a patient did not have the disease in the condition, the score of the condition was 0; if the patient had the disease, then its score was added. For instance, for a 48-year-old COPD patient with peripheral vascular disease and malignant lymphoma, the CCI score is 4 points, consisting of 1(age) + 1 (peripheral vascular disease) + 2 (malignant lymphoma), to produce 4.
Hospitalization information
We replaced the readmission date with the Sequence of Admissions in each quarter. We removed Died, Discharge department, and Surgery code because (1) we excluded the dead patients, so there is no reason for us to retain the attribute Died, and (2) the attributes Discharge department and Surgery code had too many missing values, due to improper recording, and so were removed from our data.
We converted the expenditure-related variables to percentages with the total cost of a specific item as the numerator and the total hospitalization cost as the denominator. For example, Drug Cost Proportion (DCP) is the proportion of the total drug cost in the given year to the total hospitalization cost, and reimbursement cost proportion (RCP) is the proportion of the reimbursement cost.
LOS, CCP (Check Cost Proportion
We converted HC to a new variable, HC average cost, the average cost of hospitalized COPD patients in the hospital in the current year. In addition, based on the day of the patient’s maximum daily hospitalization cost, we created a new variable, MAXGAP, which is equal to the date of discharge minus the date when the highest daily hospitalization cost occurred. Finally, we considered fluctuations in the daily cost of two patients with the same average daily cost and the same length of stay. For example, looking at two records (Figure 2), it is apparent that although the average daily cost is the same, fluctuations in the daily cost of sample 1 are more extreme than those of sample 2. We created a new variable, Sharpness, which reflects fluctuations in the cost of hospitalization for patients. Sharpness equals the number of hospital days in excess of the average daily cost divided by the total number of length of days in hospital (days over daily cost/LOS).
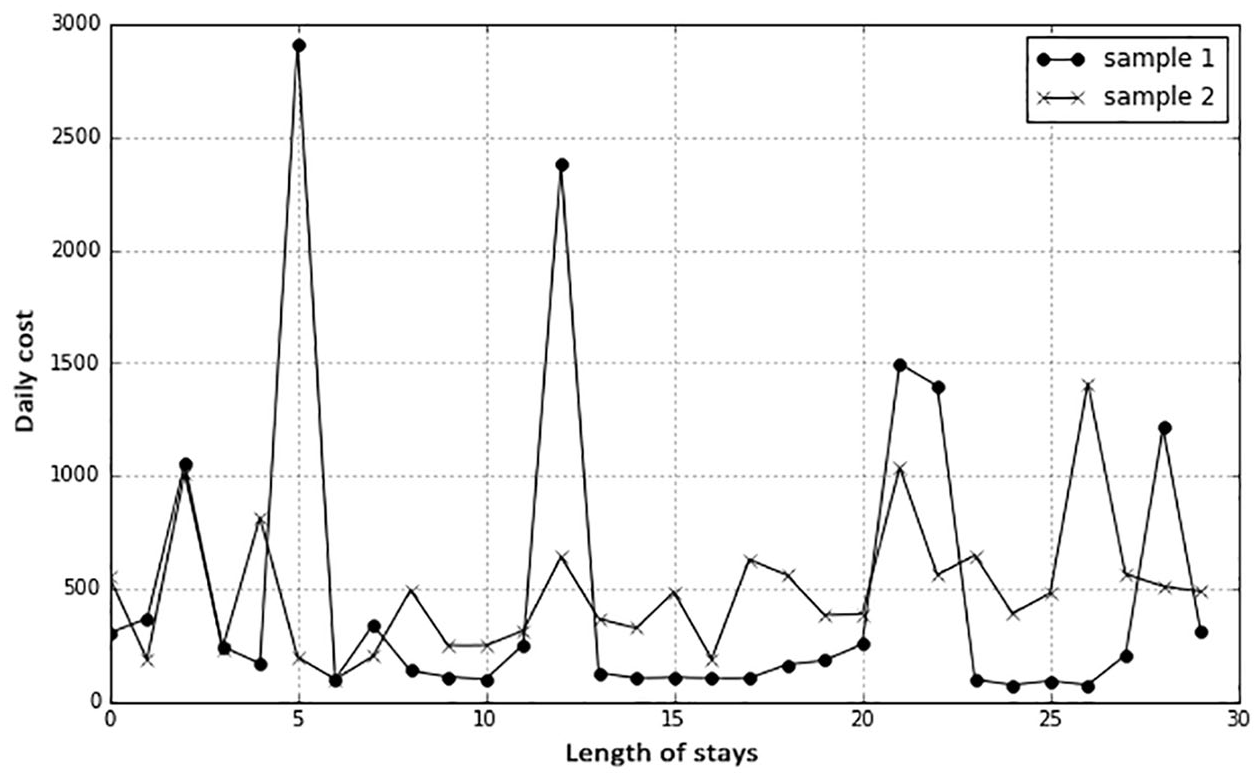
Daily cost fluctuations of two samples, with the same average daily cost and length of stay.
Medication information
Anticholinergics and Combined Drug1 (Pearson’s r = 0.930, significant, p value < 0.001); B2 LABA and Glucocorticoid (Pearson’s r = 0.548, significant, p value < 0.001); and Total hospitalization cost and Combined Drug2 (Pearson’s r = 0.363, significant, p value < 0.001) were significantly correlated, so we discarded Combined Drug1, Glucocorticoid, and Combined Drug2.
Through the variable selection process, we identified 50 predictors that could be used for modeling. Table 4 presents descriptive statistics for the 62,490 members in the combined model building and testing subsamples, as well as for the subset of children (n = 12,498) with cost in the top 20 percent. The proportion of high-cost patients with urban health insurance is much higher than that of the whole sample, which means that urban health insurance patients are more likely to become high cost. The number of comorbidities in high-cost patients was significantly higher than the number of comorbidities in the full-sample patients.
Fifty attributes of the samples (2011).
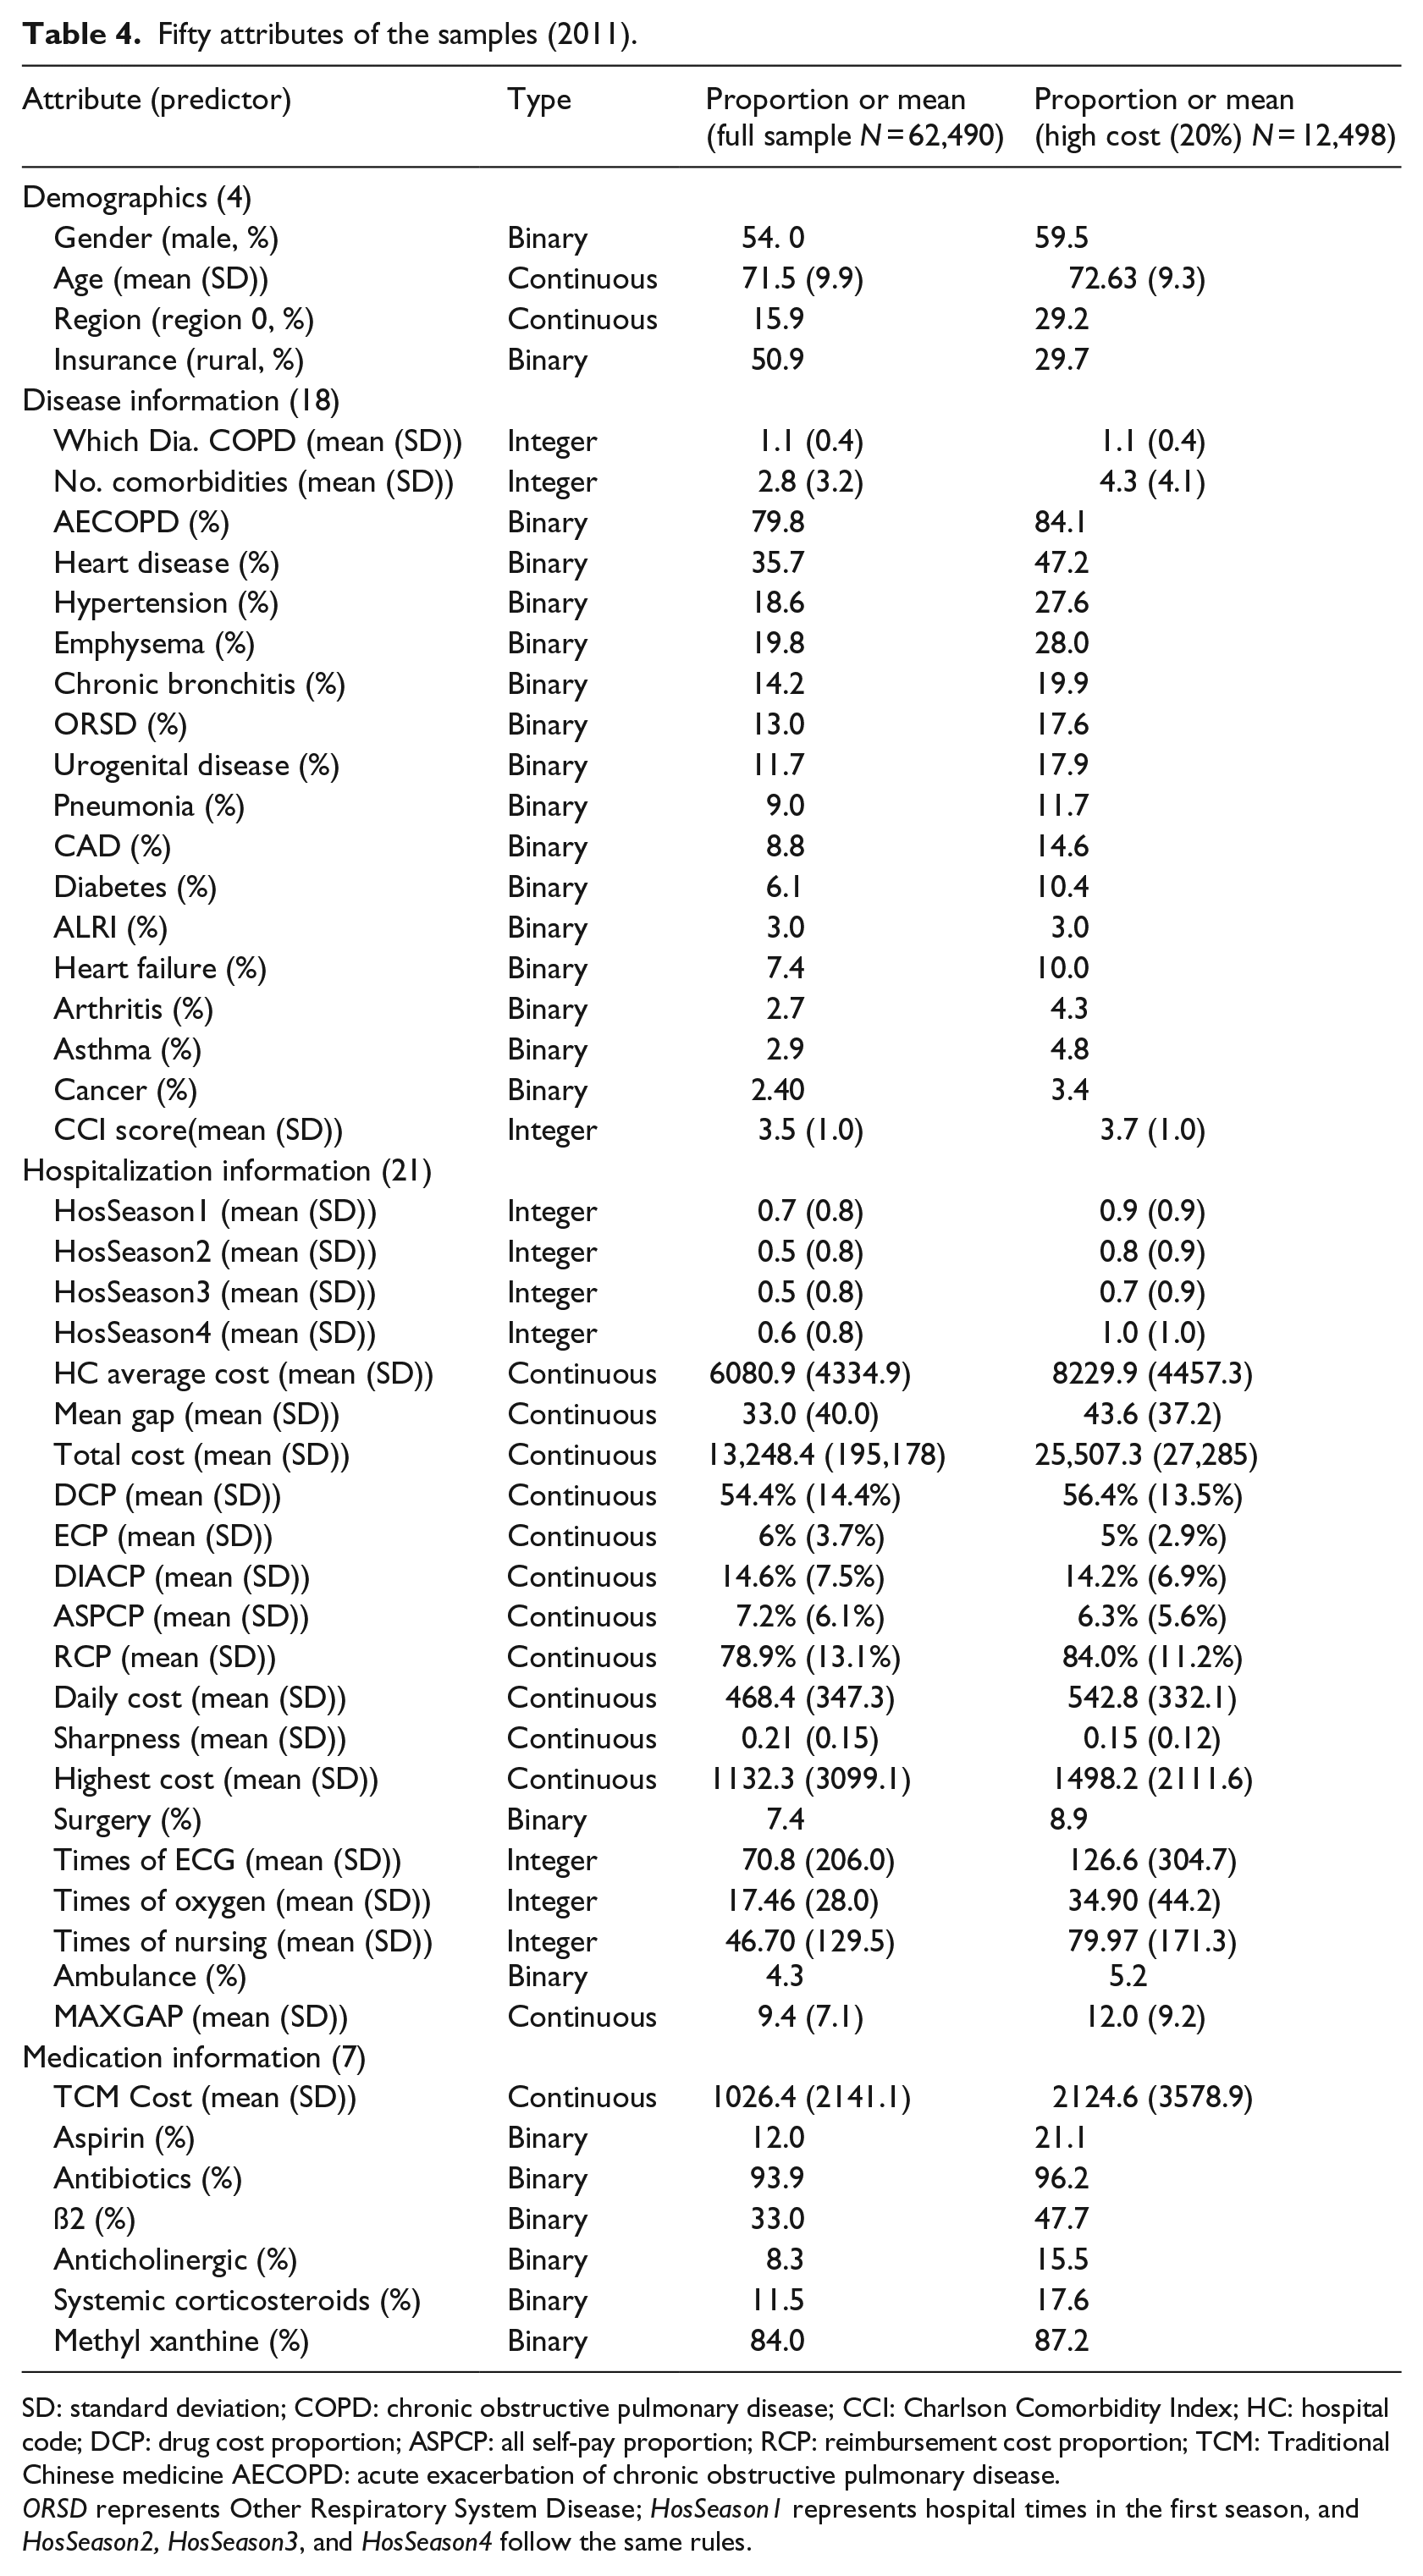
SD: standard deviation; COPD: chronic obstructive pulmonary disease; CCI: Charlson Comorbidity Index; HC: hospital code; DCP: drug cost proportion; ASPCP: all self-pay proportion; RCP: reimbursement cost proportion; TCM: Traditional Chinese medicine AECOPD: acute exacerbation of chronic obstructive pulmonary disease.
ORSD represents Other Respiratory System Disease; HosSeason1 represents hospital times in the first season, and HosSeason2, HosSeason3, and HosSeason4 follow the same rules.
Before building the predictive model, we needed to discretize the continuous variables. We used the equation Xi = (Xi—mean (X))/SD(X) to discretize Age, No. Comorbidities, Which Dia. COPD, HC Average Cost, Mean Gap, Total Cost, Daily Cost, Highest Cost, MAXGAP, TCM Cost, Times of ECG, Oxygen Times.
Definition of future high-cost patient
We aimed to use information from 1 year to identify potential high-cost COPD patients and predict the potential high-cost COPD patients in the next year. The way in which to define thresholds for high-cost patients is an open question. Various thresholds (top 5%, 10%, 20%, and 50%) for defining “high cost” have been used.19,29,31 Due to the lack of standard high-cost patient definitions, we explored the high-cost thresholds through data analysis. The cumulative cost in 2011 to 2012 COPD patients was ¥7 million, with the top 5, 10, and 20 percentiles accounting for 35.2 percent, 51.8 percent,, and 72.1 percent of the total cost, respectively. Similar cost figures are obtained for patients in 2012 to 2013 COPD patients (Table 5).
COPD patients’ next-year-cost in 2011 and 2012.
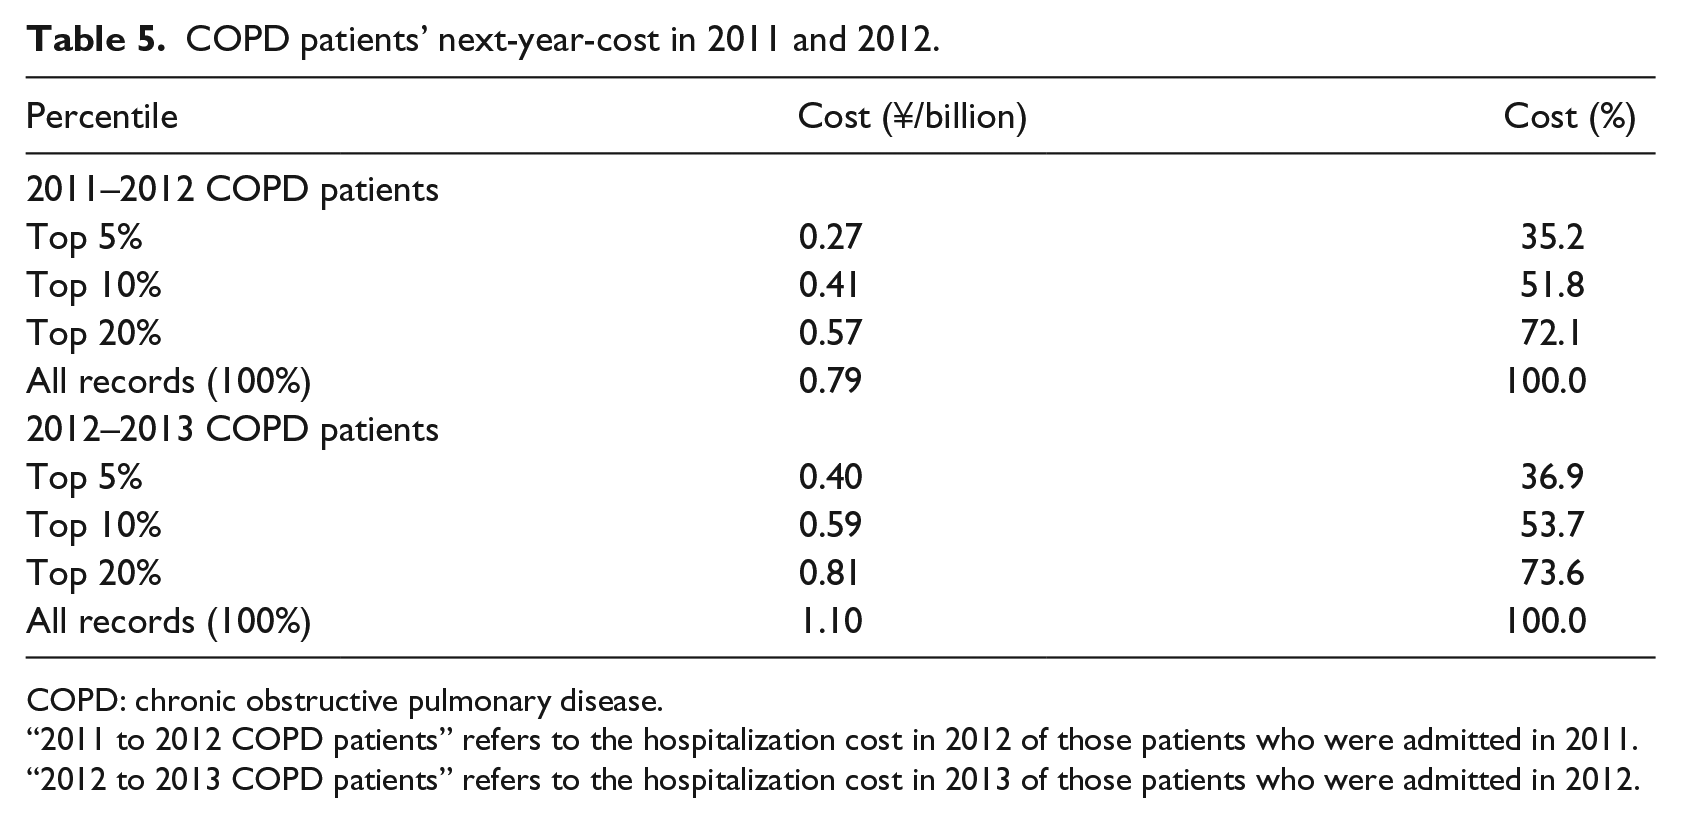
COPD: chronic obstructive pulmonary disease.
“2011 to 2012 COPD patients” refers to the hospitalization cost in 2012 of those patients who were admitted in 2011.
“2012 to 2013 COPD patients” refers to the hospitalization cost in 2013 of those patients who were admitted in 2012.
The well-known 80/20 Pareto principle (also known as the 80/20 rule) was proposed by the 19th-century Italian professor of political economy Vilfredo Pareto. He calculated that the top 20 percent of any country’s population accounts for approximately 80 percent of its total income. The 80/20 rule is widely used in economics and management.32,33 Inspired by the 80/20 rule, Gondra 34 used two machine learning algorithms—artificial neural networks and support vector machines—to predict the potential faultiness of software components at an early stage. He proposed that testing effort can be focused on a subset of software components, the potentially “most troublesome” 20 percent. In recent years, more and more medical cost/expenses-related research has found that the 80/20 rule holds, and have used it to identify high-cost thresholds.35,36
In this study, we found that 20 percent of patients with COPD consumed nearly 80 percent of the medical resources. Figure 3 shows the proportion of patients with high and low costs in 2011 and 2012 when 20 percent is the high-cost threshold. About 19.4 percent of COPD patients in 2011 were high-cost patients, and 81 percent were low-cost patients. Among these high-cost patients, about 47 percent of those in the next year (2012) were still high-cost patients, and the remaining 53 percent were low-cost patients; about 14 percent of low-cost patients in 2011 were converted to high-cost patients in 2012, and 86 percent of patients continued to be low-cost patients.
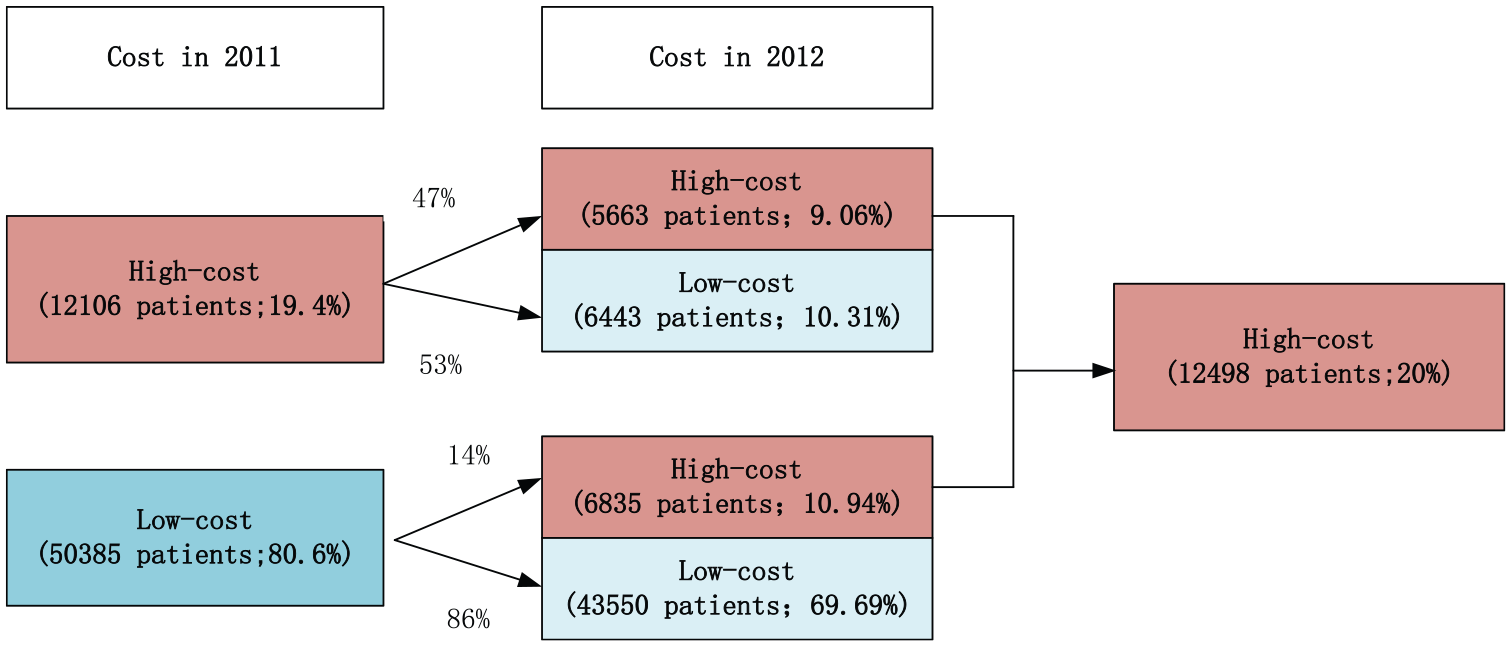
Next year cost level for high-cost (top 20%) patients in 2011.
Methods
We applied three machine learning approaches to predict high-cost COPD patients: logistic regression, RF, and XGBoost. Logistic regression has the advantages of low computational cost, ease of understanding, and ease of implementation. The term “ensemble learning” refers to an algorithm that combines base learners such as decision trees and linear classifiers; the RF and XGBoost approaches are examples of ensemble learning methods. 37 RF is a relatively new predictive method. Its superior performance on large covariate lists and complex interaction structures are the reasons we considered it to be applicable to our study. We adopted XGBoost for the following reasons: (1) Gradient boosting is a well-known machine learning technique for classification and regression problems, and produces a prediction model in the form of an ensemble of weak prediction models, which are typically decision trees. The algorithm builds the model in a stepwise fashion, similar to other boosting methods, but is more general than many approaches because it allows the optimization of an arbitrary differentiable loss function. 25 (2) The XGBoost approach utilizes a form of gradient boosting to create an appropriate model for the data without overfitting. It has been successfully used in machine learning applications and performs efficiently. 38 All models were implemented in Python. We used the Sklearn package for logistic regression, and random forest classifiers, and the AdaBoost classifier for RF and XGBoost.
We divided the data from 2011 into a training set (70%) and a validation set (30%). In order to avoid accidental errors due to random sampling, we performed 100 random samplings, so each model was repeated 100 times. The data from 2012 were used as test set I (2012 all tests) and the data from 2013 was used as test set II (2013 all tests).
We assessed the predictive performances of our models using three main measures: AUC, SEN, and SPE, all commonly used performance measures.39,40
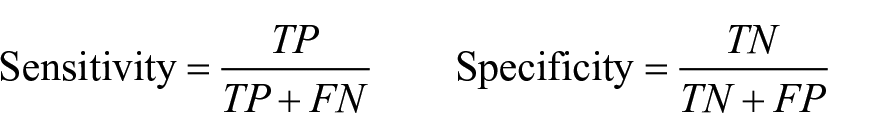
The classifier’s sensitivity, also known as true positive rate (TPR), is defined as the ability to correctly identify the true value (TP) of the cases. In this study the metric measures the probability of correctly identifying high-cost patients. The classifier’s specificity, also referred to as true negative (TN), is defined as the ability to correctly identify negative cases. In this study it measured the probability of the model correctly identifying low-cost patients. The AUC is a measure comparing different classification models, which combines sensitivity and specificity. Sensitivity and specificity are calculated as follows
Results
We initially used thresholds of 5 percent, 10 percent, and 20 percent for high-cost patients to test the predictive performances of all three models with different thresholds. We then selected 20 percent as the threshold for further investigation.
Performance of the algorithms
We ran the three algorithms using the training set, in order to build better classifiers by debugging the parameters of each algorithm, and calibrated the classifiers using the validation set. Table 6 shows the performance metrics. The predictive performances of the three different classifiers are significantly higher than that of random guessing on the validation set, test sets I and II, indicating that the model selection and data preprocessing approaches are appropriate. As shown in Table 6, as the threshold is increased, the AUC of each model gradually decreases, for instance, the AUC of XGBoost decreased from 0.842 when using a threshold of top 5 percent to 0.80 when using a threshold of top 20 percent by 0.04 in the validation set. The AUC of RF decreased significantly. When the top 5 percent was used as the high-cost criterion, the AUC of RF in the validation set was 0.828, whereas in test set I, the AUC decreased to 0.752. Compared to logistic regression, it only decreased from 0.826 to 0.817, indicating that the prediction model constructed by RF is less stable than the other two prediction models.
Performance evaluation of the classifiers with various thresholds for defining high cost.
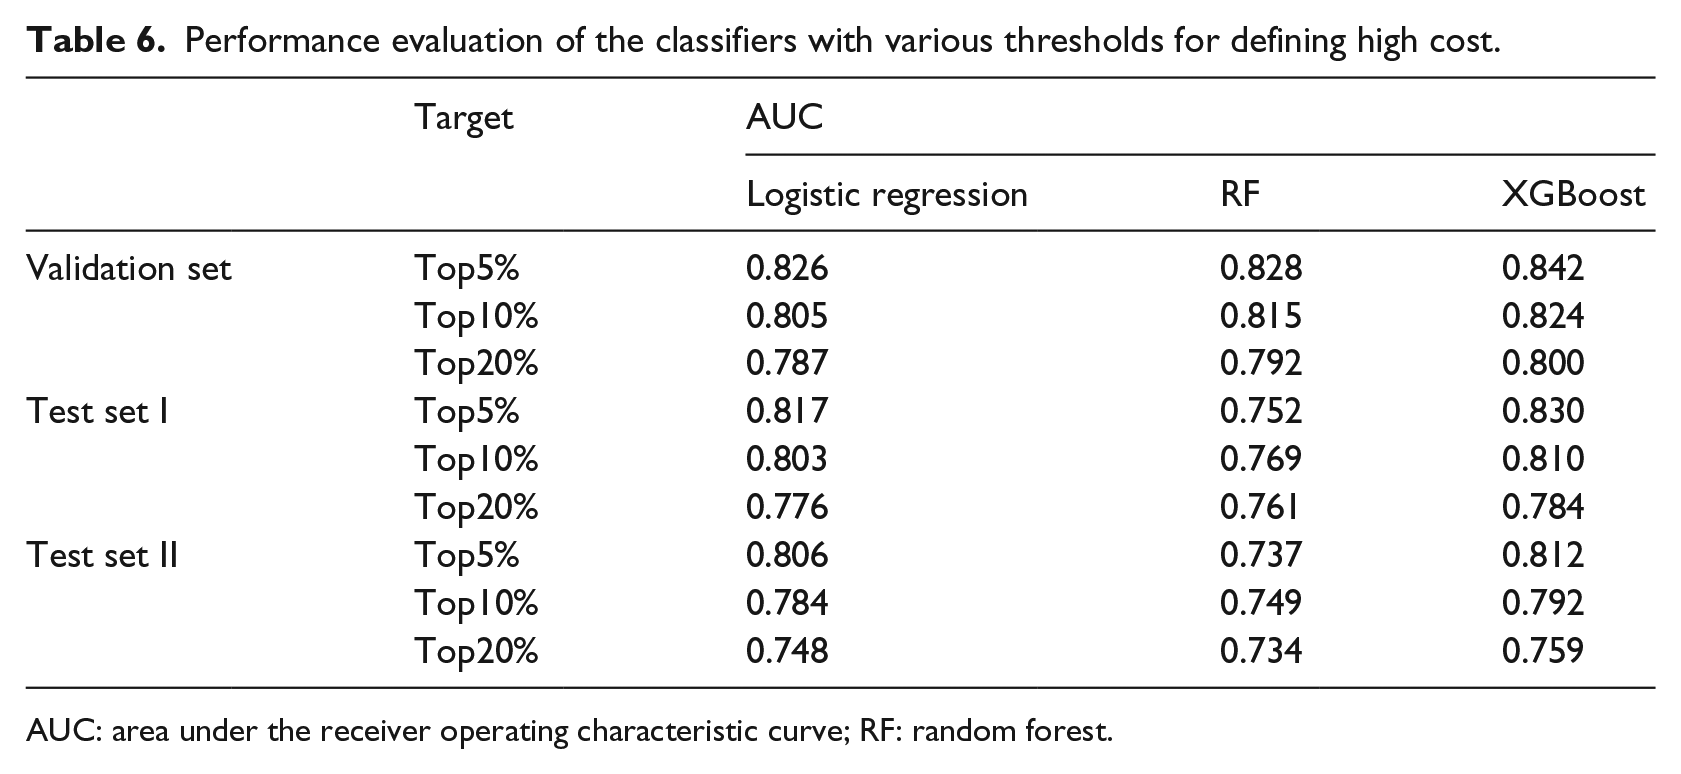
AUC: area under the receiver operating characteristic curve; RF: random forest.
Although the predictive performances using the 20 percent threshold were not optimal, we selected the top 20 percent as the cost target because it is commonly used as a classification standard. Then, we used one classical machine learning algorithm, logistic regression, with all variables, to build predictive Model I, and logistic regression with the base variables to build predictive Model II. The base variables include Age, Gender, Region, Insurance, and No. Comorbidities. We used the other two algorithms, RF and XGBoost, to build predictive Models III and IV. Our predictive model was constructed using the final 50 variables. The details of the model’s performance are shown in Table 7. The optimal values of the performance metrics sensitivity, specificity, and AUC of the four models are indicated in bold font. For the four models, we used the validation set from the 2011 data with the 20 percent threshold.
Performance evaluation of the classifiers using 50 attributes.
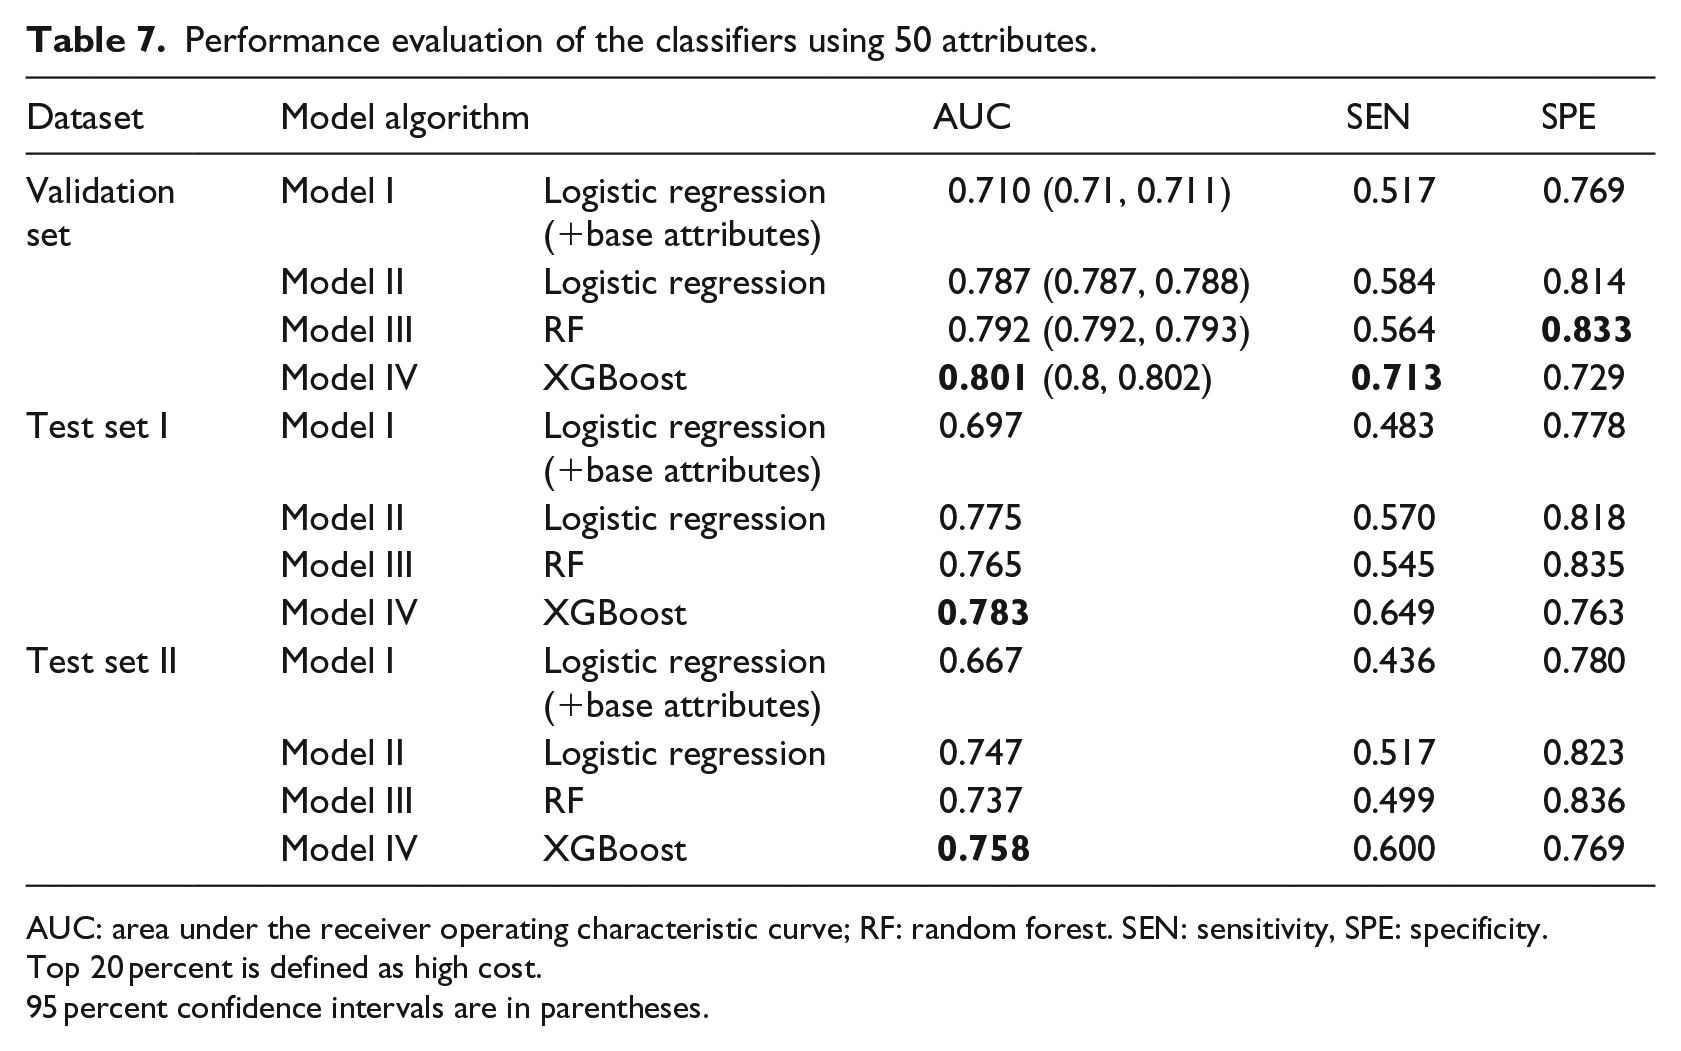
AUC: area under the receiver operating characteristic curve; RF: random forest. SEN: sensitivity, SPE: specificity.
Top 20 percent is defined as high cost.
95 percent confidence intervals are in parentheses.
(A) Model IV (XGBoost) produced the highest AUC (0.801) [95% confidence interval (CI), 0.8–0.802] compared to Model III (RF, 0.792 [95% CI, 0.792–0.793]) and Model II (logistic regression, 0.787 [95% CI, 0.787–0.788]). Among Models II, III, and IV, each model had markedly improved performance compared to the AUC (0.71 [95% CI, 0.71–0.711]) of Model I. In addition, XGBoost provides the highest sensitivity (71.3%), which is far greater than those of the other four models.
(B) Model III produced the highest specificity (83.3%) compared to Model II (81.4%), Model I (76.9%), and Model 4 (72.9%).
(C) The performances of Model II are not the best under any of the metrics.
The performance metrics of Models II and III are similar, while Model IV shows excellent predictive performance on test sets I and II. Compared to the validation set, AUC and sensitivity decrease on test set I, while Model IV performs the best. The specificities for the four models increased on test sets I and II. Since the AUC of Models II, III, and IV are not significantly different on the verification set, we performed an independent sample T test on the AUC values of 100 experiments in Models II–IV. Before the T test, we first tested the normality of the AUC values of Models II–IV. The three sets of results passed the normality test, based on the p value of Model II (p = 0.568, asymptotic significance), Model III (p = 0.939, asymptotic significance), and Model IV (p = 0.748, asymptotic significance). Subsequently, an independent sample test was performed on the AUC values of the three models. The results showed that there was a significant difference in the AUC values of the three models (p < 0.05).
Overall, Model IV (XGBoost) yielded the best sensitivity and AUC values, key metrics of predictive performance. For these reasons, we conclude that Model IV outperformed the other three models.
Attribute importance and attribute group comparison
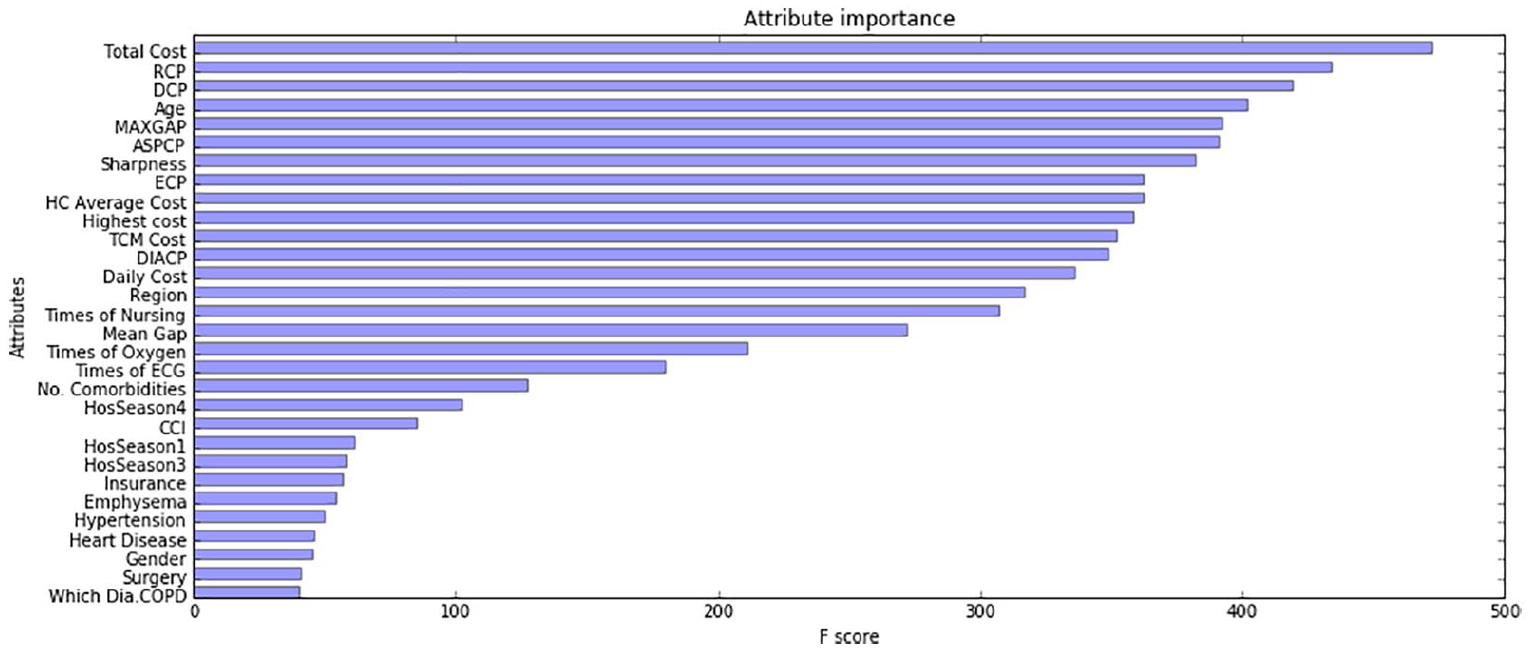
XGBoost can score the importance of variables via the Gini index. By sorting all the variables, we gradually stripped out the unimportant variables and got the final 30 variables (see Figure 4). The top 30 variables, as ranked by the XGBoost model, are as follows:
Demographics (4): Age, Region, Insurance, Gender;
Hospitalization information (19): Total Cost, RCP, DCP, MAXGAP, ASPCP, Sharpness, ECP, HC Average Cost, Highest Cost, DIACP, Daily Cost, Times of Nursing, Mean Gap, Times of Oxygen, Times of ECG, HosSeason4, HosSeason1, HosSeason3, Surgery;
Disease information (6): No. Comorbidities, CCI Score, Emphysema, Hypertension, Heart Disease, Which Dia. COPD;
Medication information (1): TCM Cost.
Primary variable importance scores in the XGBoost model.
We use XGBoost with the top 30 variables to build predictive models. We compared two AUC values, one from a prediction model that contains all 50 variables, and the other from the top 30 ranked variables. The average AUC of the latter was 0.798, and was subjected to an independent sample T test, which found a statistically significant difference (p < 0.001).
Total Cost ranks first among all variables, followed by Age and MAXGAP. Most cost-related variables are ranked from first to tenth. The reason why the expenditure-related attributes occupy most of the positions is readily apparent: this year’s cost will directly affect the cost of the next year. However, we found that the new variables we derived are also important. For instance, Sharpness is ranked seventh. In order to verify the predictive importance of the new attributes (such as Sharpness and CCI Score), and other non-cost variables, we recombined different attributes to get three attribute sets.
The first 30 attributes are set 1.
We combined eight attributes associated with direct hospitalization costs from the Hospitalization information group and four attributes from Demographics group as set 3.
The remaining 11 attributes of the hospitalization information group and the attributes of the other groups became set 2.
We built a predictive model in the validation set using the XGBoost algorithm with three attributes set, and then compared the AUC values obtained using the different attribute sets (Table 8).
Comparison of the classifiers using three different attribute sets.
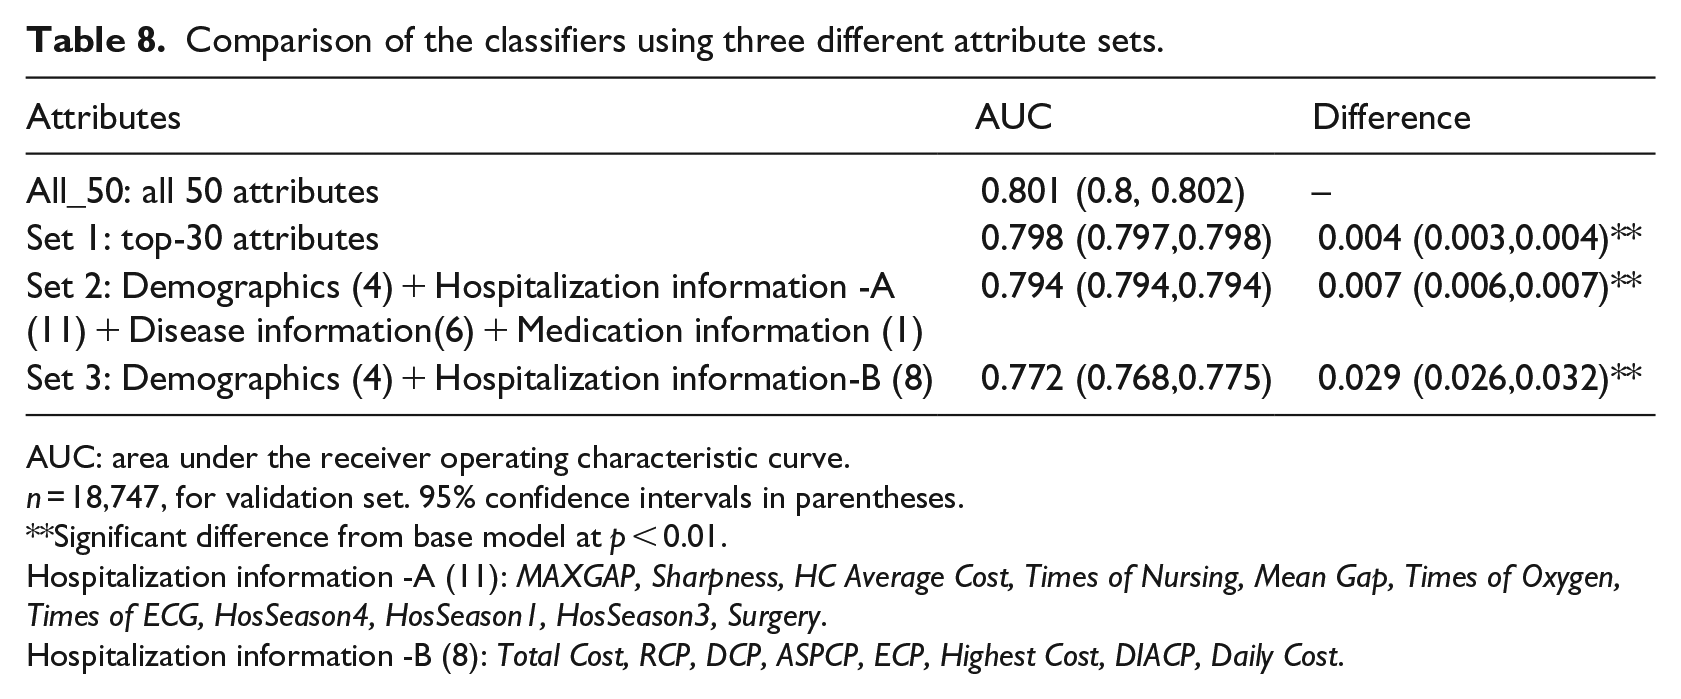
AUC: area under the receiver operating characteristic curve.
n = 18,747, for validation set. 95% confidence intervals in parentheses.
Significant difference from base model at p < 0.01.
Hospitalization information -A (11): MAXGAP, Sharpness, HC Average Cost, Times of Nursing, Mean Gap, Times of Oxygen, Times of ECG, HosSeason4, HosSeason1, HosSeason3, Surgery.
Hospitalization information -B (8): Total Cost, RCP, DCP, ASPCP, ECP, Highest Cost, DIACP, Daily Cost.
The performance of the prediction models constructed using the three attribute sets declined to different extents. The AUC value using set 1 only decreased by about 0.004. The difference was small compared with the original model. The AUC value using set 3 decreased by about 0.029. However, it increased by 0.06, compared with Model I (logistic regression + base attributes) in Table 7.
Discussion
Several studies have investigated the prediction of high-cost/high-medical cost patients using statistical analysis techniques, such as regression and analysis of variance.41–43 For example, Fleishman and Cohen 42 used logistic regression methods to predict the upper 10 percent of expenditures using data from the MEPS. However, with the development of information technology in recent years, the medical and health industry has become an important field for big data applications. It is important to investigate how in-depth analysis can be carried out via data mining approaches to determine the cost trends and variation for patients with a specific disease, based on the big data that are collected by healthcare institutions and insurance companies. Our study attempted to compare the performances of different models and identify high-cost COPD patients by ranking the key variables that can help predict whether a patient will be in the upper 20 percent of the distribution of the subsequent year’s expenditures. We first used 50 attributes to construct COPD high-cost forecasting models based on three data mining algorithms: logistic regression, RF, and XGBoost. Then, we identified the key indicator group, consisting of 30 variables, by scoring their importance using the best forecasting model, Model IV (XGBoost). Finally, in order to investigate the importance of the new variables we created (Sharpness, CCI, etc.) and other non-cost variables for prediction, we re-split the top 30 attributes to get three different combinations of attributes (sets 1, 2, and 3). We compared the differences in AUC of the three attribute sets. Although the predictive performance of the model with sets 1, 2, and 3 decreased slightly, the AUC value still reached 0.798, 0.794, and 0.772, indicating that these 30 variables can also be used to construct the prediction model, and these variables are easy to obtain.
Our research and that of Fleishman and Cohen 42 differ in terms of data sources, the definition of high-cost patients, and experimental designs. Using machine learning methods to predict the cost of medical care has become a trend in recent years. However, no study has determined whether these models are suitable for Chinese medical data. The latter uses only logistic regression, and we chose three machine-learning approaches, logistic regression, RF, and XGBoost, to construct four models. Among the four models, the predictive performance of Model IV (XGBoost) was optimal, and met the application requirement. On the validation set, the AUC of Model 4 of 0.801 was the best, followed by Model 3 (RF, 0.792) and Model 2 (logistic regression, 0.787). Logistic regression,20,44 neural networks,27,44,45 and decision trees3,27 are currently very popular predictive methods and have achieved good predictive performances. We used conventional machine learning methods (logistic regression and RF) based on previous studies and also the latest ensemble algorithms (XGBoost). The ensemble model, XGBoost, was the optimal model with the highest AUC value. This study shows that the performance of our predictive models is similar to those using data from other countries and studies, 27 based on machine learning methods and Chinese Medical Insurance Data.
We reduced the number of attributes from 50 to 30 by scoring the variables in terms of importance using XGBoost. We found the following: (1) Prior studies suggest that the categories of Demographics (Age 35 , Region), 22 Hospitalization information (Total Cost, ECP), 3 and Disease information (Emphysema, Hypertension) 46 contribute significantly to the prediction of expenditure, similar to the results that were obtained in our study. Our variables contain extensive diagnostic information that is related to COPD, as diagnosis-based models are better at identifying people with “manageable” conditions and those with increasing expenditure trends. (2) We also found that the new variables created in this study, HC Average Cost, MAXGAP, Sharpness, No. Comorbidities, and CCI Score, also played positive roles in the forecasting model. (3) Two doctors suggested that TCM Cost, Aspirin, Antibiotics, and other four drugs are highly related to COPD. These seven variables consist of medication information. We found that TCM Cost is the key predictor variable in the medication information. Our research supports related research, and demonstrated that some new variables make a significant contribution to the prediction. These variables have not been mentioned in other publications.
Our findings have several implications. Research based on predictive models using big data can be applied to disease management, nursing management and resource utilization review. 43 The results of the model can be used as a reference by medical insurance policymakers. Medical policymakers can use the forecasting model with key variables to design local or national surveys, develop a reimbursement policy for COPD patients, and formulate more targeted medical budgets for the high-cost patients. A small proportion of people consume most of the medical resources; such people have become the focus of cost control. Commercial insurance companies can accurately target the potential pool. Based on the attributes of the high-cost patients, they can identify high-spending groups and track them. Machine learning approaches can be used to identify target customers. Before they seek medical help, insurance companies can develop plans for appropriate prevention and response measures, which will help to resolve the conflict between supply and demand of medical and health resources.
Our work has several limitations. The utility of a predictive model depends on the specific context in which it will be used, the cost of data collection, and the ease of interpreting the results. 42 There is no BMI, smoking status, household income, or family population information in the Medical Insurance Data set in our study. However, these predictors can be found in other research, for example, studies22,23 and 13 used data from the Veterans Health Administration (VHA), MEPS, and claims data, respectively. Due to the unique nature of Medical Insurance Data, the primary variables in our study are different from those in other studies, and our original dataset may limit the generalizability of our results and the ease of comparison of our results with those of other research. Approaches used in this study are static models constructed with static variables. In reality, costs can change dynamically over time. The best way in which to construct a dynamic predictive model that adapts to the patient’s state over time is a question worthy of further exploration.
Conclusion
In sum, we applied four machine learning models to predict high-cost COPD individual in the top 20 percentile among COPD patients using Medical Insurance Data. We found that Model IV (XGBoost) performed best, and was an accurate method with which to predict high-cost COPD patients. We ranked the variables using XGBoost and found a set of variables key to the forecasting model. The variables we created were also important contributors to the prediction. We then split and recombined the top 30 variables, and found that set 2, which included the combination of non-cost variables and new variables, still had good predictive performance. Our results provide a basis for medical insurance departments, commercial insurance companies, and hospitals to assist them in formulating management control strategies to reduce medical expenses.
Footnotes
Appendix 1
Comorbidities’ proportion.
| Comorbidity information | Patients’ proportion in 2011 (%) |
|---|---|
|
|
|
|
|
|
|
|
|
|
|
|
|
|
|
|
|
|
|
|
|
|
|
|
|
|
|
|
|
|
| Pneumonia | 9.65 |
| Cerebrovascular disease | 8.96 |
| Metabolic disease | 8.69 |
| Coronary artery disease | 8.14 |
| Diabetes | 5.93 |
| Acute lower respiratory infection | 5.73 |
| Cardiac failure | 5.67 |
| Spondylodynia | 5.58 |
| Other back diseases | 5.46 |
| Nervous system disease | 4.34 |
| No specific symptoms | 4.02 |
| Bone disease | 3.66 |
| Arthrophlogosis | 3.29 |
| Trauma | 2.93 |
| Lens diseases | 2.75 |
| Asthma | 2.72 |
| Blood disease | 2.58 |
| Acute upper respiratory infection | 2.39 |
| Cancer | 2.09 |
| Lymphatic vessel disease | 1.97 |
| Pleural diseases | 1.34 |
| High cholesterol | 1.20 |
| Inner ear disease | 1.16 |
| Herpes zoster | 0.90 |
| Gastric ulcer | 0.78 |
| Stenocardia | 0.57 |
| Uarthritis | 0.54 |
| Malnutrition | 0.50 |
| Depression | 0.27 |
| Pulmonary heart disease | 0.26 |
| Stroke | 0.19 |
| Spontaneous pneumothorax | 0.19 |
| Chronic respiratory failure | 0.15 |
| Emotional disorder | 0.14 |
| Anxiety disorder | 0.12 |
| Cystic kidney disease | 0.06 |
| Secondary polycythemia | 0.04 |
| Flu | 0.01 |
The comorbidities whose proportions are greater than 11 percent are bolded, and we take these as new attributes.
Acknowledgements
The authors gratefully acknowledged the support from the West China Biomedical Big Data Research Center of Sichuan University and Chengdu Medical Insurance Administration.
Declaration of conflicting interests
The author(s) declared no potential conflicts of interest with respect to the research, authorship, and/or publication of this article.
Ethical approval
The study does not involve human subjects and adheres to all current laws of China.
Funding
The author(s) disclosed receipt of the following financial support for the research, authorship, and/or publication of this article: This project was sponsored by the Nature Science Foundation of China (Nos 71532007 and 71131006).