
Abstract
Objective
Investigating progression risk insights of high-grade gliomas through habitat radiomics analysis.
Methods
A cohort of 89 patients with high-grade gliomas was enrolled, with 63 patients in the train cohort and 26 patients in the test cohort. The methodology involved delineating the region of interest (ROI) within the tumor area on magnetic resonance imaging images, followed by multisequence registration. The ROI was further divided into subregions using K-means clustering. Radiomics features were extracted from the subregions, and feature selection was performed using least absolute shrinkage and selection operator regression. Four separate models were created: radiomics model, clinical model, habitat model, and combined model that merged the habitat signature with clinical factors. The accuracy of the models was evaluated using concordance index (C-index) and receiver operating characteristic analysis.
Results
The ROI was divided into three subregions, from which 36 features were extracted and selected. The habitat model, radiomics model, clinical model, and combined model were constructed by combining the extracted features with clinical data. The habitat model showed excellent predictive performance with the C-index values of 0.879 in the train cohort and 0.781 in the test cohort. Using this model, patients were classified into high-risk and low-risk groups, resulting in significantly different median progression-free survival (mPFS) times of 7 and 31 months, respectively (P < 0.001). Stratifying the patient cohort based on isocitrate dehydrogenase status also revealed distinct mPFS outcomes for high-risk and low-risk patients.
Conclusion
The habitat model demonstrated outstanding predictive performance for forecasting the progression risk of patients with high-grade gliomas.
Introduction
According to a survey by the Chinese Society of Oncology, brain gliomas have an annual incidence rate of 6.4 per 100,000 individuals, making them the most common primary malignant tumor in the central nervous system among adults. 1 The main treatment for high-grade gliomas involves maximal surgical resection, radiotherapy, and chemotherapy with temozolomide.2,3 However, the 5-year overall survival (OS) rate remains low, ranging from 6.6% to 30.9%, with a median survival time of 1.25 to 3 years. Early disease progression within the first year is associated with worse prognoses.4–6 Identifying patients with progression within 1 year before treatment is crucial for personalized interventions and improving survival rates.
Radiomics is a high-throughput process that extracts measurable imaging features from medical images, enabling the assessment of treatment response and prediction of tumor outcomes.7–10 Habitat analysis enhances radiomics by identifying distinct areas or habitats within tumor subregions using imaging biomarkers. 11 This approach provides detailed insights into tumor subregion and contributes to understanding tumor formation and progression.6,9,10,12,13
Habitat analysis has proven to be an accurate and practical approach with predictive potential in various cancers, including nasopharyngeal carcinoma and lung cancer.11,14 Its application in gliomas, which exhibit significant tumor heterogeneity, is noteworthy.13,15 However, there are limitations in current research. Some studies focused only on the edematous area, neglecting the impact of enhanced tumor regions on progression risk.10 Additionally, some studies have not adequately considered the impact of invasiveness and other factors associated with different grades of gliomas on patient progression risk, which complicates the progression risk analysis. 16 High-grade gliomas have greater clinical significance due to their increased invasiveness and malignancy, leading to poor prognoses and shorter survival times. Therefore, studying high-grade gliomas is crucial.
The main objective of this study is to develop a progression risk prediction model based on the habitats of high-grade gliomas. This model will be used to assess the progression risk of patients and provide valuable insights for guiding treatment decisions.
Materials and methods
Patient population
Between June 2016 and June 2023, we prospectively recruited patients diagnosed with high-grade gliomas (grades 3–4) confirmed by integrated pathological diagnosis at our center. For this retrospective analysis, inclusion criteria required patients to meet the following: (1) diagnosed with high-grade gliomas (grades 3–4) through integrated diagnostic methods, (2) no prior treatment before the confirmed diagnosis of glioma, (3) available axial magnetic resonance images, and (4) relevant clinical information. Exclusion criteria included: (1) not meeting the criteria for grades 3–4 upon integrated diagnosis, (2) incomplete preoperative imaging sequences, (3) ambiguous or artifact-affected magnetic resonance imaging (MRI) images, and (4) lack of posttreatment follow-up data. Figure 1 visually illustrates the detailed patient selection process.

Flow chat of patient selection.
Treatment and follow-up
Before treatment, we collected clinical characteristics from our health information system. These included demographic parameters such as age, sex, height, and weight, as well as clinical variables like chronic disease history, family medical history, glioma grade, body mass index (BMI), glioma type, and so on. Tumor measurements, including volume, were obtained by defining the region of interest (ROI) using ITK-SNAP software. Then, after screening by the aforementioned inclusion and exclusion criteria, eligible patients received a combined treatment regimen. This consisted of radiotherapy at a total dose of 60 Gy delivered in 30 fractions over 6 weeks. Concurrently, temozolomide was administered daily at 75 mg/m2 for 6 weeks, followed by a 4-week treatment break. Subsequently, patients received maintenance therapy with temozolomide at a dose of 150–200 mg/m2 on days 1–5 of each 28-day cycle, for up to 6 cycles. Upon completion of treatment, patients entered a follow-up phase, which involved dynamic observation and MRI and functional MRI scans every 3 months. Recurrence was assessed according to the response assessment in neuro-oncology criteria by a multidisciplinary team (MDT) from the Departments of Radiotherapy, Neurosurgery, and Radiology. The MDT analyzed clinical manifestations, the extent of enhancement, and the timing of recurrence. All patients underwent MRI scans, with additional functional MRI techniques, such as magnetic resonance spectroscopy and perfusion-weighted imaging, evaluated as needed. Disease progression was determined based on the following criteria: (1) target lesions: ≥25% increase in sum of the products of perpendicular diameters, or ≥40% increase in total volume of enhancing or nonenhancing target lesions, or both, on stable or increasing doses of corticosteroids not attributable to radiation effect, edema, or comorbid events. (2) New enhancing or nonenhancing lesion: in the case where the baseline or best response demonstrates no measurable disease (visible or not visible), then any new measurable (>10 mm×10 mm) lesions are considered progressive disease. The primary endpoint of the study was progression-free survival (PFS), defined as the duration during which patients showed no signs of disease progression during or after treatment.
Study design
A retrospective cohort design was employed to analyze MRI data collected from a single institution, involving multiple imaging sequences. The study pipeline is visually depicted in Figure 2. The initial phase consisted of image preprocessing techniques, including tasks such as delineating the ROI, coregistration, and normalization. Subsequently, the region was divided into different habitats using the K-means clustering method. Finally, radiomics features were extracted using Pearson's correlation analysis, univariable Cox regression, and least absolute shrinkage and selection operator (LASSO)-Cox regression analysis. Further details regarding the proposed approach will be elaborated based on the descriptions provided in Figure 2.
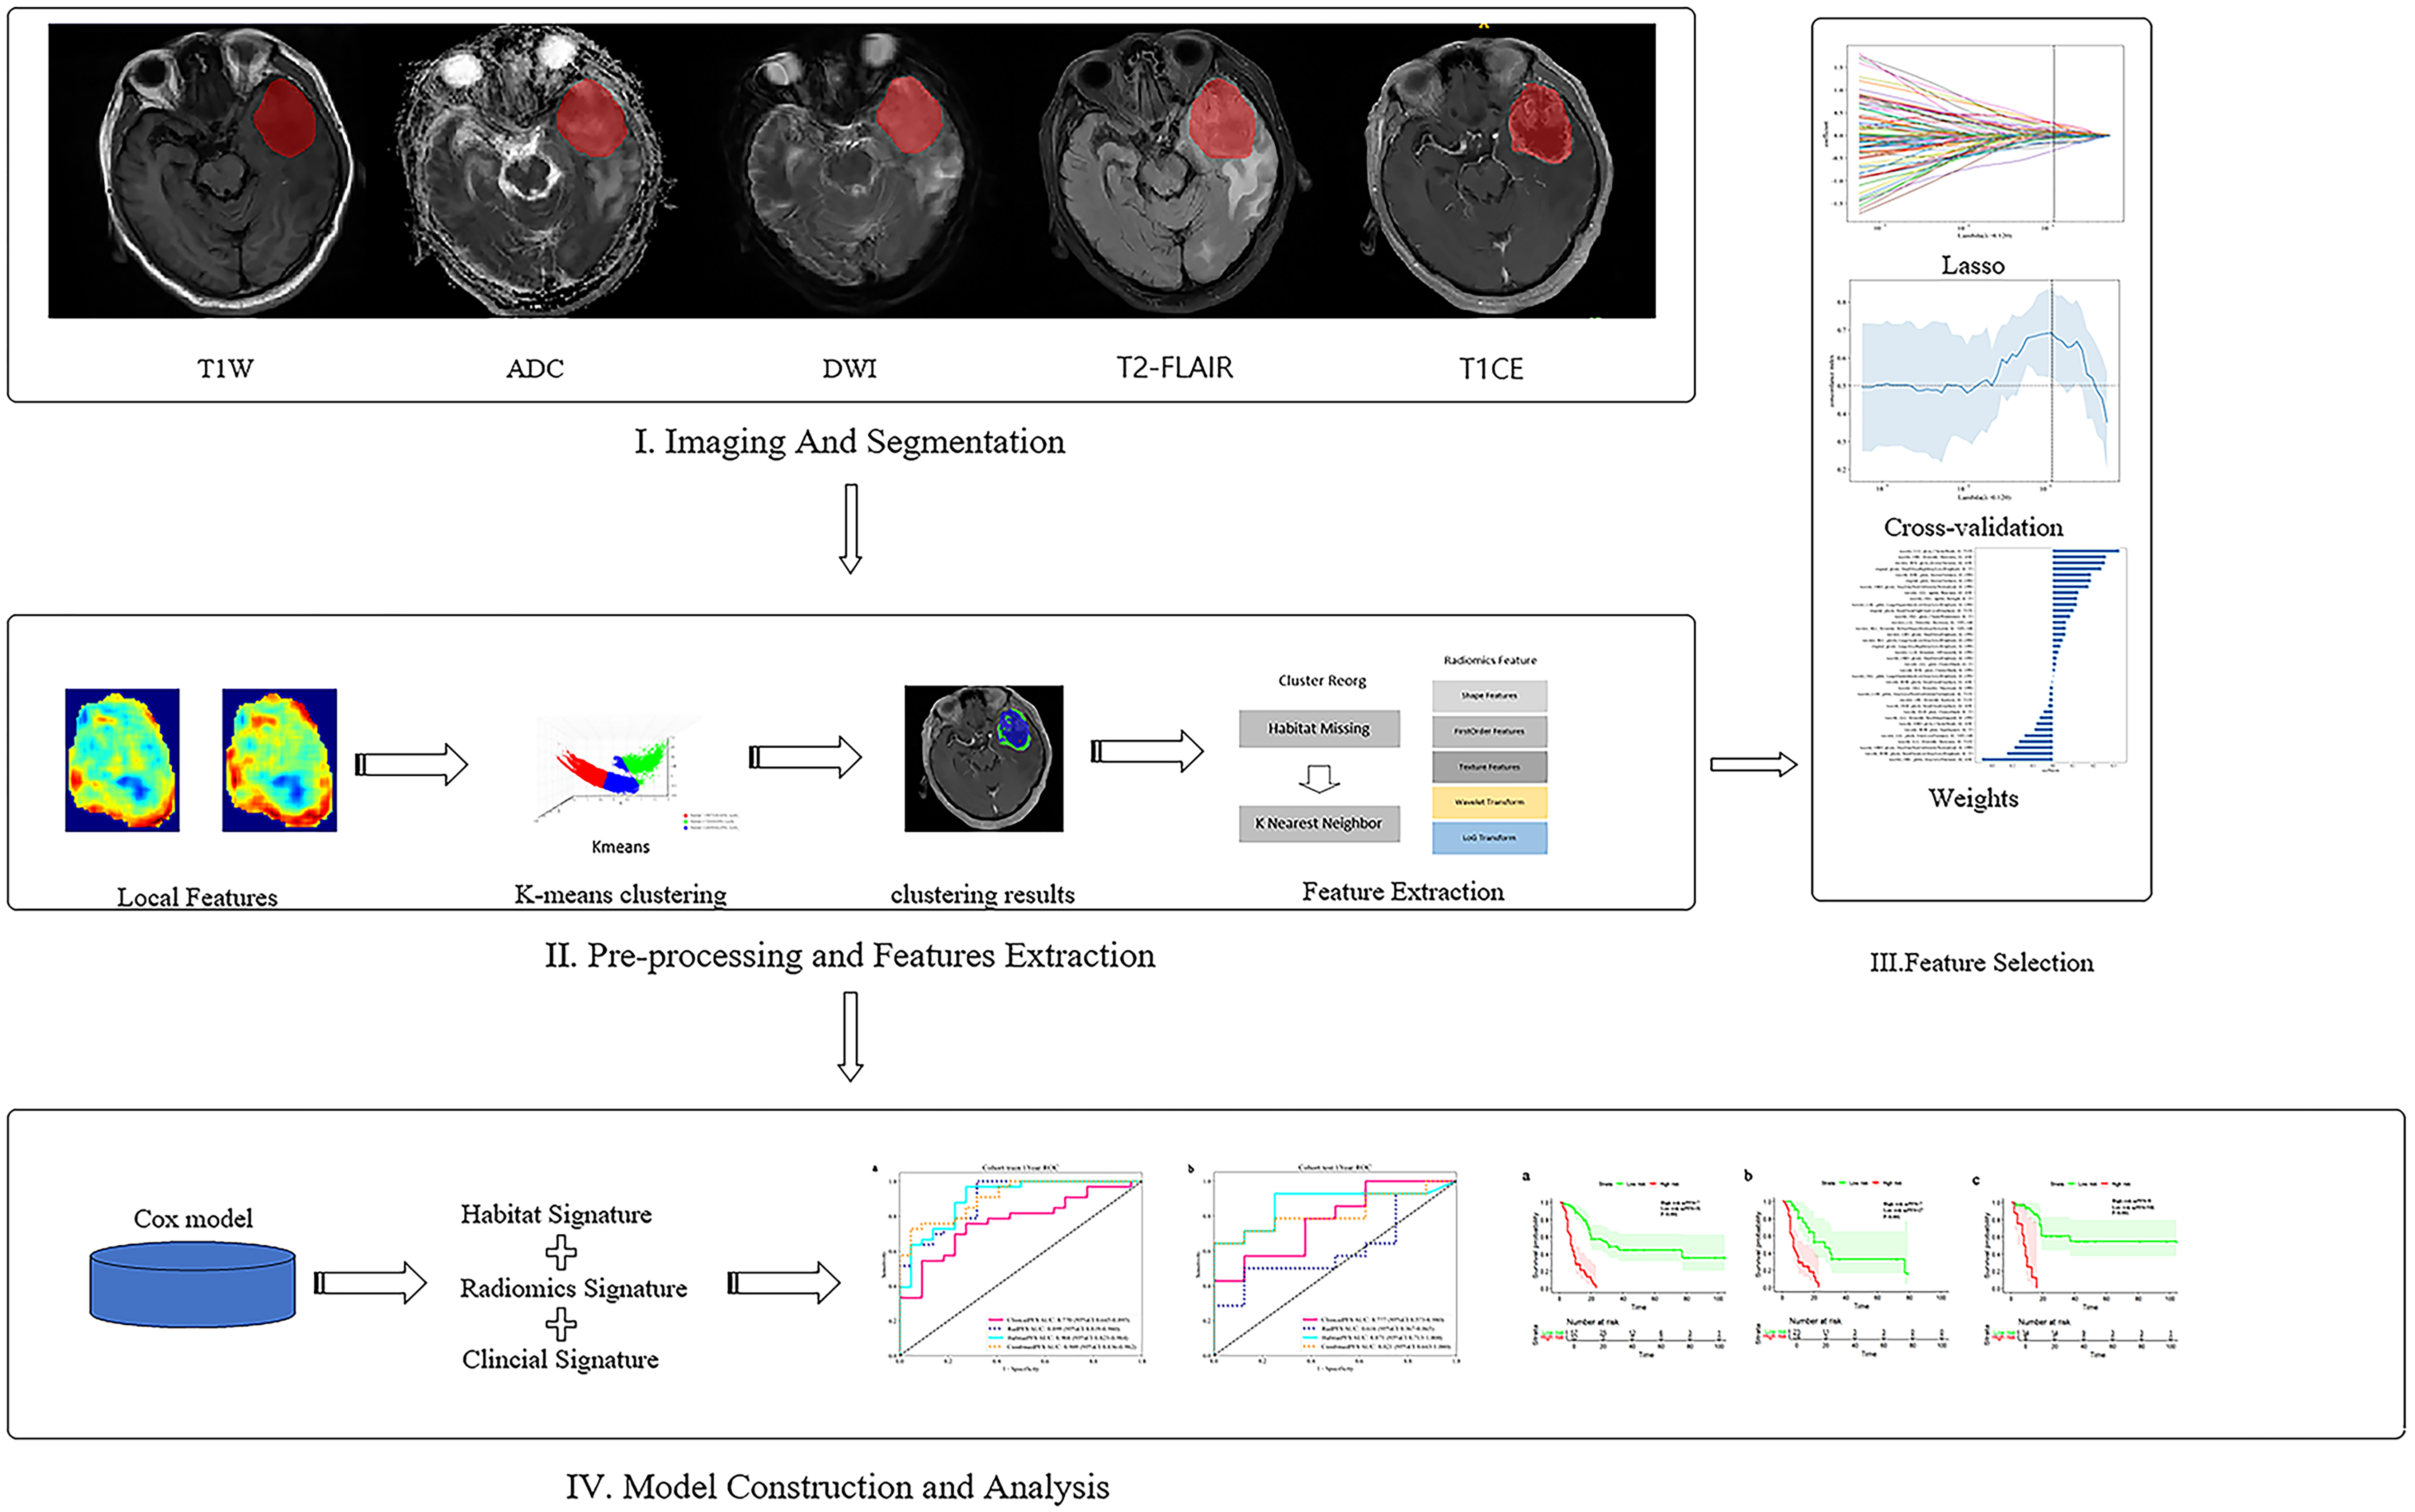
The workflow of the glioma habitat signature assessment method used in this study.
The research methodology involved a sequential three-step process. Initially, subregions were segmented by employing manual delineation techniques within the tumor regions. Subsequently, habitat analysis features were extracted and selected. Finally, the performance of models utilizing the habitat signature score, traditional radiology, clinical data, and the combined approach integrating the habitat signature score with relevant clinical factors was meticulously evaluated using an independent test dataset.
Processing of the ROI
Our dataset comprises five imaging sequences: apparent diffusion coefficient (ADC), diffusion-weighted imaging (DWI), T1-weighted contrast-enhanced imaging (T1CE), T1-weighted (T1W), and T2-weighted fluid-attenuated inversion recovery (T2-FLAIR). All patients received 3.0-T MRI scans, which included T1W, T2-FLAIR, DWI, ADC, and T1CE. Detailed parameters for these sequences are provided in Supplemental A1. The ROI on the T1CE sequence was independently delineated by two radiologists with 10 years of experience using ITK-SNAP software. During delineation, the ROI was required to include the enhancing, nonenhancing, and necrotic regions while excluding the abnormal signals of the peritumoral edema area; any discrepancies were resolved by a senior radiologist with 19 years of experience. ITK-SNAP was also utilized to align the other sequences with T1CE, with further adjustments made by expert radiologists to ensure optimal alignment accuracy.
Additionally, to further improve the model's predictive performance, we employed a standardized approach in our medical image analysis study to achieve consistent voxel spacing. We utilized a fixed resolution resampling strategy to standardize the resolution of different volumes of interest at 1 mm × 1 mm × 1 mm. This standardization was crucial for enabling accurate image comparisons and significantly enhancing the precision and reliability of our analysis outcomes.
Heterogeneity region generation
We addressed the difficulty of manually outlining tumor subregions in high-grade gliomas by employing an automatic segmentation method with the K-means clustering algorithm. This approach effectively divided the tumor into separate areas, each showing uniform signal intensity across different MRI modalities, including T1CE, ADC, DWI, T1W, and T2-FLAIR.
We employed a 5 × 5 × 5 moving window on T1CE images to analyze local features like entropy and energy for precise characterization of ROI regions, resulting in a 19-dimensional feature vector for each voxel (detailed in Supplemental A2). By combining these local features with voxel intensities from all modalities, we created a 24-dimensional global matrix for each sample. This matrix was processed using voxel-based K-means clustering to segment the tumor into distinct habitats, as outlined in Supplemental A3 (Supplemental equation (A.1)).
Our automated segmentation algorithm effectively produced spatially distinct habitats with homogeneous signal patterns. To determine the optimal number of clusters (ranging from 2 to 10), we evaluated metrics such as the Calinski–Harabasz score, Silhouette score, and Davies–Bouldin index using the scikit-learn package.
Feature extraction and selection
To analyze each subregion across all modalities, we categorized the features into geometry, intensity, and texture. These features were extracted using Pyradiomics 3.0.1 software, following the established guidelines. The extraction process was performed independently for each subregion. In cases where regions had insufficient voxel counts, a k-nearest neighbor strategy was employed.
To identify and remove redundant features, we utilized Pearson's correlation analysis, selecting only those with a correlation coefficient below 0.9. Feature selection was further refined by employing univariable Cox regression, which ranked features based on their P-values. The final set of features was determined using LASSO-Cox regression, and cross-test methods were applied to identify the optimal regularization parameter. Supplemental A4 provides additional details on this process.
Model construction and clinical evaluation
Model construction
Based on the extracted and selected features, we constructed the following models.
Habitat model: Following LASSO feature screening, Cox regression was employed to model the selected features and estimate the average expected survival time, resulting in the development of our radiomics signature. It should be emphasized that the habitat signature, derived from habitat analysis results, provides a unique perspective on comprehending the intricacies of intratumoral heterogeneity.
Radiomics model: After applying LASSO feature screening to streamline the feature set, we utilized Cox regression to analyze the selected features. This modeling approach allowed us to predict the average expected survival time and ultimately create our radiomics signature.
Clinical model: We incorporated clinical characteristics into a Cox model and designated the anticipated survival time as the clinical signature.
Combined model: To assess the effectiveness of a multi-omics strategy, the clinical signature and habitat signature were combined using a Cox model to create a combined model.
Clinical evaluation
In our research, we used advanced analytical methods to tackle challenges in medical image analysis. For survival analysis, we employed Cox proportional hazards models with L2 regularization and determined optimal cut-off thresholds using X-tile software. This enabled us to categorize patients into high and low-risk groups, which were evaluated using Kaplan–Meier survival curves. Stratification was based on predicted hazard ratios, and the significance of group separation was assessed through a multivariate log-rank test. This comprehensive approach ensured a thorough evaluation of the predictive models’ effectiveness in clinical settings.
Additionally, we assessed diagnostic effectiveness at specific time intervals, such as 1-year PFS, using time-dependent receiver operating characteristic (ROC) curves. Statistical significance was defined as a two-tailed P-value below 0.05.
Statistical analysis
We employed Shapiro–Wilk test to assess the normality of clinical characteristics. For normally distributed continuous variables, we conducted t-tests, while Mann–Whitney U test was used for non-normally distributed variables. Categorical variables were evaluated for statistical significance using chi-square tests. Detailed patient characteristics are provided in Table 1. Statistical analyses and machine learning model development were carried out using Python (version 3.7.12), Onekey (version 3.3.5), and scikit-learn (version 1.0.2). The training utilized an NVIDIA 4090 GPU alongside the MONAI (version 0.8.1) and PyTorch (version 1.8.1) frameworks.
Baseline clinical characteristics of patients.

BMI: body mass index; IDH: isocitrate dehydrogenase.
Result
Patient characteristics
Between June 2016 and June 2023, a total of 234 patients diagnosed with high-grade gliomas were initially recruited from our center. After excluding 89 patients with missing MRI image sequences, 50 patients with incomplete postoperative follow-up data, and 6 patients with blurry imaging data, the final analysis included 89 patients (46 males and 43 females). Baseline characteristics such as age, gender, BMI, pathological type, and so on were evaluated. Statistical analyses confirmed no significant differences (P > 0.05) between the two cohorts. The clinical data of the study are presented in Table 1.
Heterogeneity region generation
In our analysis, we tested cluster numbers ranging from 2 to 10 to evaluate their efficiency. As the number of clusters increased, we observed distinct trends among the indices: the Calinski–Harabasz index decreased slightly, the Silhouette index first rose and then fell, while the Davies–Bouldin index exhibited the opposite trend, first falling and then rising. Based on a comprehensive evaluation of these three metrics, this study determined that the optimal clustering performance is achieved with a cluster number of 3. The clustering information is presented in Figure 3.

(a) Calinski–Harabasz score of different cluster and (b) three clusters’ visualization of features.
To illustrate the concept, we generated visual representations of typical clustering outcomes. These images depict a patient diagnosed with grade 4 glioblastoma in the left frontal lobe with a negative isocitrate dehydrogenase (IDH) mutation. The tumor is clearly visible, featuring a distinct central necrotic area surrounded by a region with discernible characteristics. This information can be found in Supplemental Figure 1.
Feature extraction
Handcrafted features statistics: Our study involved extracting 1834 distinct handcrafted radiomics features, which were organized into shape, first-order, and texture divisions. This comprehensive feature extraction process utilized a tool developed within the Pyradiomics framework. More information about this tool can be found at http://pyradiomics.readthedocs.io.
Feature selection
In our study, we used the LASSO method for feature selection through a LASSO logistic regression model, which helped us identify nonzero coefficients essential for developing the Rad-score. The coefficients and mean standard error from 10-fold tests are visualized in panels (a) and (b), respectively. Additionally, panel (c) shows the histogram of the Rad-score based on the selected features. This information is presented in Supplemental Figure 2.
Model construction and predictive performance
Model construction and signature comparison
In our study, the habitat, radiomics, clinical, and combined models demonstrated varying levels of predictive accuracy. The habitat model had the highest concordance index (C-index) values of 0.879 in the train cohort and 0.781 in the test cohort, indicating superior predictive performance. Incorporating tumor heterogeneity into the model significantly enhanced accuracy and predictive power. For a comprehensive overview of the C-index values for each model, refer to Table 2.
C-index in prediction PFS.

C-index: concordance index; PFS: progression-free survival.
Time-dependent ROC analysis
In the train cohort (Figure 4(a)), the combined model achieved the highest area under the curve (AUC) of 0.909, outperforming the habitat and radiomics models. In the test cohort (Figure 4(b)), the habitat model had the highest AUC of 0.871, followed by the combined, clinical, and radiomics models. These results indicate that the habitat model consistently demonstrated superior AUC scores, particularly in the test cohorts, suggesting its robust performance and potential predictive capability. However, further improvements are needed to enhance the generalizability of these findings in clinical applications.
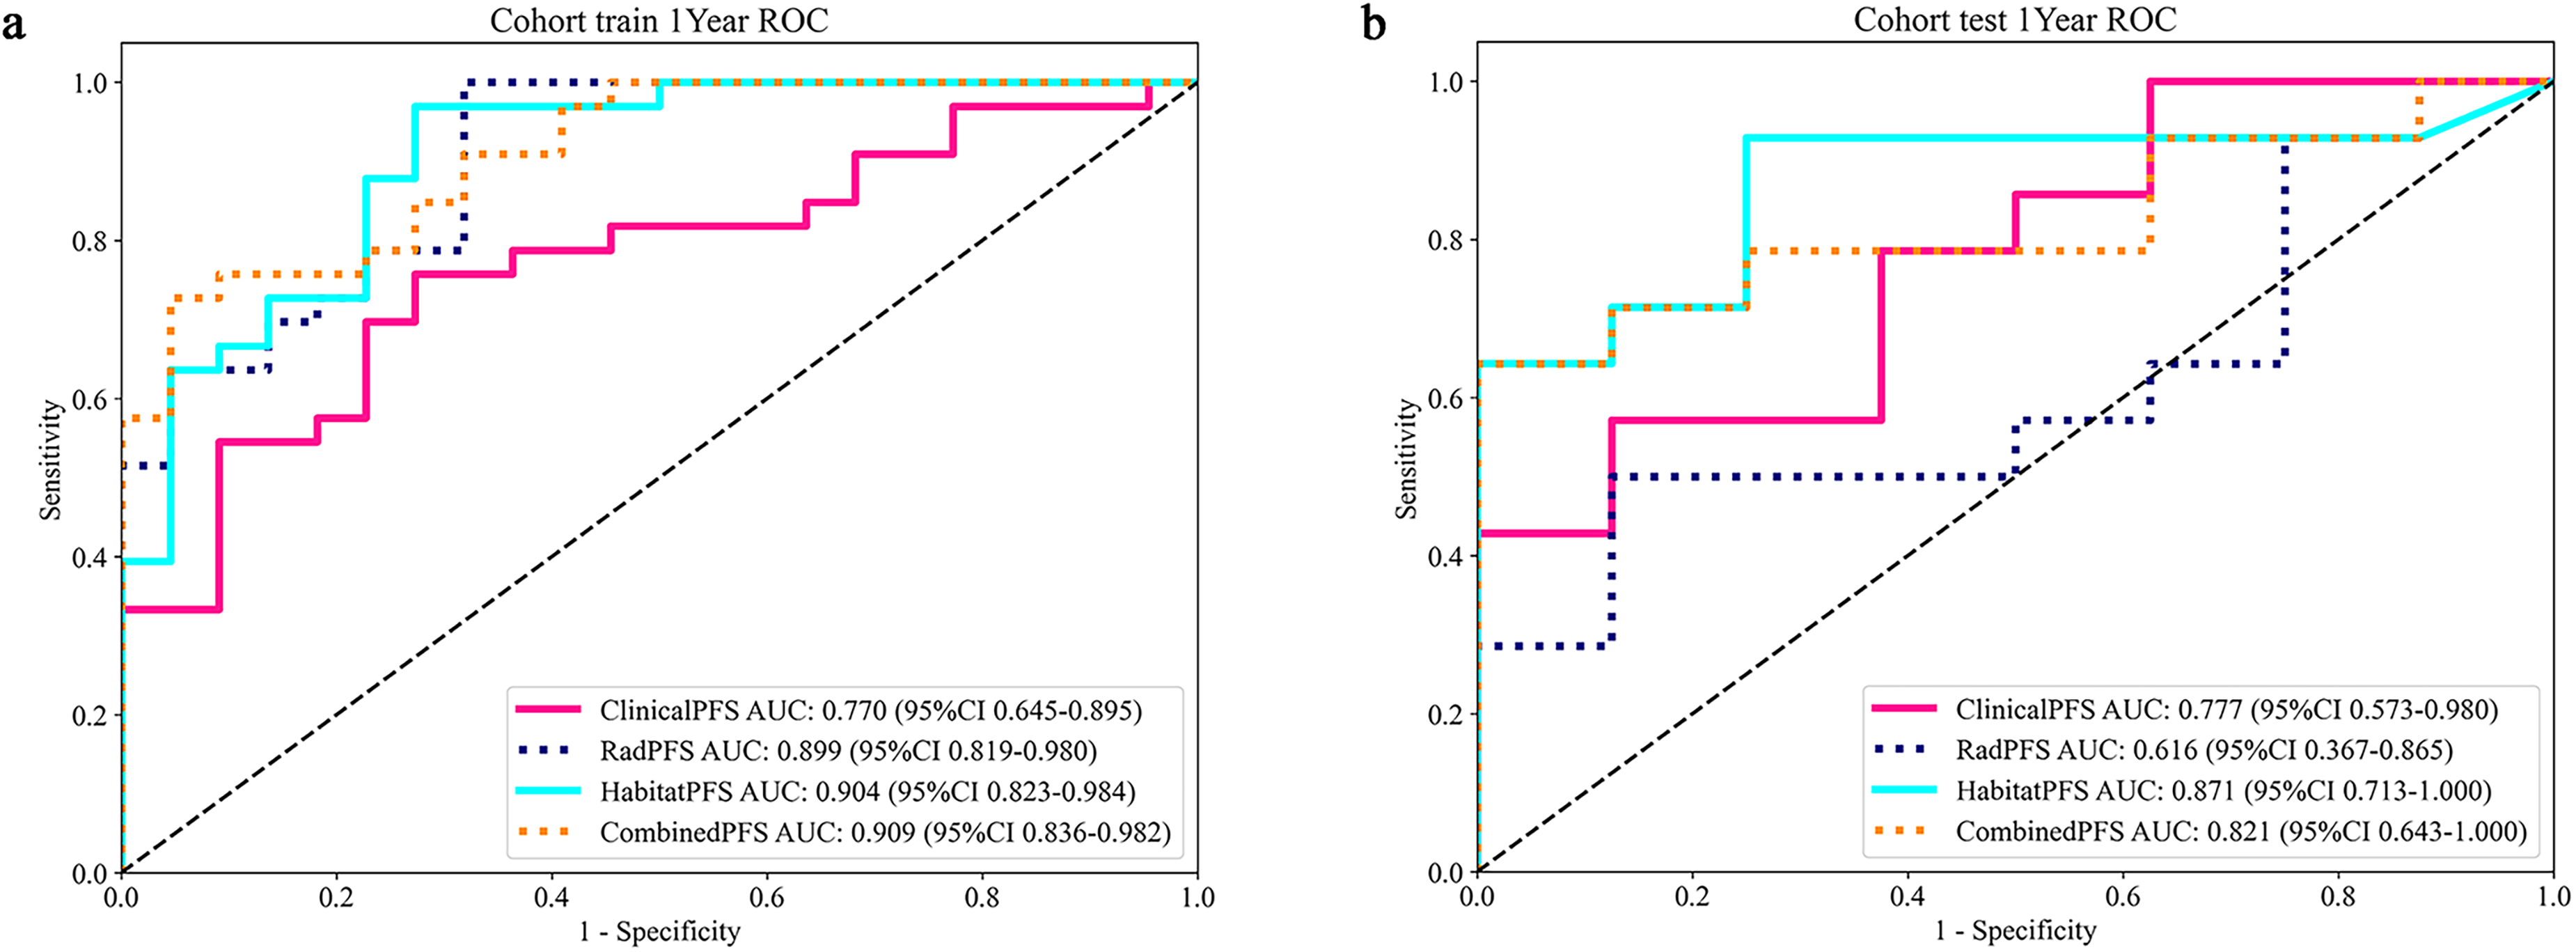
The ROC curves of machine learning algorithms for habitat model in the train and test cohorts (a, b). ROC: receiver operating characteristic.
Risk stratification and IDH status distinguish progression risk
In our study, the habitat model consistently outperformed other models in both the train and test cohorts, making it the optimal choice for further analysis. Using this model, we stratified patients into high-risk and low-risk groups based on survival curves (panel a, P < 0.0001). In the IDH-negative patient cohort, the median progression-free survival (mPFS) for the high-risk group was 7 months, which was shorter than that of the low-risk group (panel b, P < 0.001). In the IDH-positive patient cohort, the same pattern was observed, namely that the mPFS of the high-risk group was significantly lower than that of the low-risk group (panel c, P < 0.001). These findings demonstrate a strong stratification effect, effectively distinguishing between high-risk and low-risk patients. The information can be found in Supplemental Figure 3.
Discussion
In our study, we employed habitat analysis on MRI data to develop a predictive model for high-grade glioma progression risk. The habitat model demonstrated a superior progression risk value in both the train cohort (C-index = 0.879, AUC = 0.904) and the test cohort (C-index = 0.779, AUC = 0.871). Additionally, stratifying patients based on the habitat model, particularly focusing on IDH status, enhanced survival prediction and offered further insights for progression risk stratification.
Previous studies have used radiomics models to predict high-grade glioma progression risk.17–19 However, these studies did not extensively explore intratumoral heterogeneity analysis. Recent research has shown that habitat analysis models outperform radiomics models due to their ability to capture multidimensional information within tumors.20,21 Our own study further supports the superiority of the habitat model over traditional models. Subregional analysis, which provides a more detailed depiction and better reflects progression risk, outperforms overall analysis, highlighting the substantial heterogeneity observed in gliomas.
Our study differs from previous articles in key aspects. Yang et al. focused on the edema region, which has weaker progression risk capability compared to the tumor region and cannot accurately reflect patient progression risk. Yang et al. included gliomas of grades 2, 3, and 4, introducing significant tumor heterogeneity that could impact the accuracy of progression risk prediction. 15 In contrast, Liu et al. utilized the superior K-means clustering algorithm instead of the Otsu algorithm, 22 which has better performance in three-dimensional image thresholding and can provide more precise image segmentation. 23 Additionally, Bailo et al. incorporated positron emission tomography-computed tomography imaging, which is time-consuming, costly, and carries greater safety risks compared to MRI. 24 Furthermore, our research focuses on a wider range of imaging sequences. The inclusion of DWI and ADC sequences enhances our progression risk predictions by providing important insights into tissue microstructure, cellular architecture, and white matter integrity, playing a crucial role in progression risk prediction.25,26
We also examined the relationship between our model-based grouping results and IDH status. Patients with IDH wild-type and high-risk status had significantly shorter PFS, consistent with previous research.13,27 This highlights the valuable insights provided by our model-based grouping approach regarding the progression risk implications associated with IDH status in high-grade gliomas.
The combined model showed slightly lower effectiveness in the test set compared to the habitat model. This suggests that including multiple modalities does not universally improve performance. Possible factors contributing to this disparity include the relatively small sample size and potential overlap between specific clinical characteristics and radiological features. 28 Careful selection and integration of clinical features are crucial to avoid redundancy. 29
Habitat subregion analysis utilizes imaging biomarkers to identify distinct functional zones or “habitats” within a tumor, thereby intuitively revealing intratumoral heterogeneity and offering a critical perspective for a deeper understanding of tumor initiation and progression mechanisms. 13 Building on this, by quantitatively comparing the contributions of different habitat subregions to tumor malignancy, we can enhance the performance of the predictive model, thereby achieving a more refined stratification of patient progression risk. This precise risk stratification serves as the core basis for formulating personalized treatment strategies (such as more optimal therapeutic plans) and for the dynamic assessment of treatment response.10,22
Compared to other models, the habitat radiomics model developed in this study demonstrated the optimal predictive performance. In clinical practice, this habitat radiomics model can serve as an auxiliary tool for risk stratification in patients with high-grade glioma, thereby providing a quantitative basis for clinical decision-making. Based on the risk stratification output by the model, clinicians can formulate more individualized therapeutic strategies. This study has demonstrated that the model can effectively identify the patient population at high risk of progression. For this specific cohort, clinicians may prioritize the following interventions when making treatment decisions: (1) whether to adjust the radiation dose and irradiation range during the concurrent radiotherapy combined with temozolomide (TMZ). (2) Whether to consider combining electric field therapy or anti-angiogenic therapy during the concurrent radiotherapy phase and the six-cycle oral TMZ phase. (3) Consider extending the duration of maintenance therapy to achieve a better prognosis. (4) Attempt to administer medication preoperatively to obtain better surgical conditions and improve the quality of life after treatment. (5) For patients with a poorer prognosis, more frequent follow-ups can help detect changes in their condition earlier, allowing for timely treatment. For low-risk patients, the following measures can be considered: (1) consider appropriately reducing the radiotherapy dose to lower the side effects experienced by the patient during radiotherapy. (2) Appropriate extension of patient follow-up intervals can reduce their economic burden.
The limitations of this study warrant attention in future research. First, as a single-center retrospective study, it lacks external validation and a formal sample size calculation was not conducted. The sample size was constrained by several factors: (1) the initial diagnostic MRI scans for some patients were performed at external institutions, and the heterogeneity of scanning protocols across these institutions precluded the standardization and integration of the corresponding imaging data; and (2) some patients were lost to follow-up after treatment. Collectively, these factors limited our sample size and may have affected the model's internal and external generalizability to some extent. Second, the model's predictive performance and biological interpretability were dually limited: (1) the inclusion of multiple high-grade glioma subtypes introduced inherent heterogeneity that could interfere with model training; (2) the study's failure to perform independent delineation and comparative analysis of different tumor subregions (such as the enhancing, nonenhancing, necrotic, and edematous areas) weakened the model's biological interpretability and constrained the further improvement of its performance. Third, this study only predicted PFS and did not incorporate OS. To further enhance the model's predictive accuracy and generalizability, our future work will focus on the following: (1) expanding the sample size and conducting multicenter studies to achieve more robust external validation; (2) focusing on a single glioma pathological subtype to reduce tumor heterogeneity and improve model performance, and conducting in-depth analyses and comparisons of different tumor subregions to reveal their deeper biological associations with tumor progression and provide new insights for personalized treatment; and (3) analyzing OS to enhance the model's clinical applicability and relevance.
Conclusion
Our research developed a habitat model for predicting the progression risk of high-grade gliomas, which demonstrated superior predictive performance compared to other models. This study offers valuable insights for refining personalized treatment strategies and progression risk evaluations in high-grade gliomas.
Supplemental Material
sj-docx-4-dhj-10.1177_20552076251412634 - Supplemental material for A feasibility study on predicting disease progression in high-grade gliomas using magnetic resonance imaging habitat radiomics based on response assessment in neuro-oncology (RANO) criteria
Supplemental material, sj-docx-4-dhj-10.1177_20552076251412634 for A feasibility study on predicting disease progression in high-grade gliomas using magnetic resonance imaging habitat radiomics based on response assessment in neuro-oncology (RANO) criteria by Yuchen Zhu, Gefei Jiang, Xingjian Sun, Lei Qiu, Kexin Shi, Mengxing Wu, Yinjiao Fei, Jinling Yuan, Jinyan Luo, Yurong Li, Yuandong Cao, Weilin Xu and Shu Zhou in DIGITAL HEALTH
Supplemental Material
sj-csv-5-dhj-10.1177_20552076251412634 - Supplemental material for A feasibility study on predicting disease progression in high-grade gliomas using magnetic resonance imaging habitat radiomics based on response assessment in neuro-oncology (RANO) criteria
Supplemental material, sj-csv-5-dhj-10.1177_20552076251412634 for A feasibility study on predicting disease progression in high-grade gliomas using magnetic resonance imaging habitat radiomics based on response assessment in neuro-oncology (RANO) criteria by Yuchen Zhu, Gefei Jiang, Xingjian Sun, Lei Qiu, Kexin Shi, Mengxing Wu, Yinjiao Fei, Jinling Yuan, Jinyan Luo, Yurong Li, Yuandong Cao, Weilin Xu and Shu Zhou in DIGITAL HEALTH
Supplemental Material
sj-csv-6-dhj-10.1177_20552076251412634 - Supplemental material for A feasibility study on predicting disease progression in high-grade gliomas using magnetic resonance imaging habitat radiomics based on response assessment in neuro-oncology (RANO) criteria
Supplemental material, sj-csv-6-dhj-10.1177_20552076251412634 for A feasibility study on predicting disease progression in high-grade gliomas using magnetic resonance imaging habitat radiomics based on response assessment in neuro-oncology (RANO) criteria by Yuchen Zhu, Gefei Jiang, Xingjian Sun, Lei Qiu, Kexin Shi, Mengxing Wu, Yinjiao Fei, Jinling Yuan, Jinyan Luo, Yurong Li, Yuandong Cao, Weilin Xu and Shu Zhou in DIGITAL HEALTH
Supplemental Material
sj-csv-7-dhj-10.1177_20552076251412634 - Supplemental material for A feasibility study on predicting disease progression in high-grade gliomas using magnetic resonance imaging habitat radiomics based on response assessment in neuro-oncology (RANO) criteria
Supplemental material, sj-csv-7-dhj-10.1177_20552076251412634 for A feasibility study on predicting disease progression in high-grade gliomas using magnetic resonance imaging habitat radiomics based on response assessment in neuro-oncology (RANO) criteria by Yuchen Zhu, Gefei Jiang, Xingjian Sun, Lei Qiu, Kexin Shi, Mengxing Wu, Yinjiao Fei, Jinling Yuan, Jinyan Luo, Yurong Li, Yuandong Cao, Weilin Xu and Shu Zhou in DIGITAL HEALTH
Supplemental Material
sj-csv-8-dhj-10.1177_20552076251412634 - Supplemental material for A feasibility study on predicting disease progression in high-grade gliomas using magnetic resonance imaging habitat radiomics based on response assessment in neuro-oncology (RANO) criteria
Supplemental material, sj-csv-8-dhj-10.1177_20552076251412634 for A feasibility study on predicting disease progression in high-grade gliomas using magnetic resonance imaging habitat radiomics based on response assessment in neuro-oncology (RANO) criteria by Yuchen Zhu, Gefei Jiang, Xingjian Sun, Lei Qiu, Kexin Shi, Mengxing Wu, Yinjiao Fei, Jinling Yuan, Jinyan Luo, Yurong Li, Yuandong Cao, Weilin Xu and Shu Zhou in DIGITAL HEALTH
Supplemental Material
sj-csv-9-dhj-10.1177_20552076251412634 - Supplemental material for A feasibility study on predicting disease progression in high-grade gliomas using magnetic resonance imaging habitat radiomics based on response assessment in neuro-oncology (RANO) criteria
Supplemental material, sj-csv-9-dhj-10.1177_20552076251412634 for A feasibility study on predicting disease progression in high-grade gliomas using magnetic resonance imaging habitat radiomics based on response assessment in neuro-oncology (RANO) criteria by Yuchen Zhu, Gefei Jiang, Xingjian Sun, Lei Qiu, Kexin Shi, Mengxing Wu, Yinjiao Fei, Jinling Yuan, Jinyan Luo, Yurong Li, Yuandong Cao, Weilin Xu and Shu Zhou in DIGITAL HEALTH
Supplemental Material
sj-csv-10-dhj-10.1177_20552076251412634 - Supplemental material for A feasibility study on predicting disease progression in high-grade gliomas using magnetic resonance imaging habitat radiomics based on response assessment in neuro-oncology (RANO) criteria
Supplemental material, sj-csv-10-dhj-10.1177_20552076251412634 for A feasibility study on predicting disease progression in high-grade gliomas using magnetic resonance imaging habitat radiomics based on response assessment in neuro-oncology (RANO) criteria by Yuchen Zhu, Gefei Jiang, Xingjian Sun, Lei Qiu, Kexin Shi, Mengxing Wu, Yinjiao Fei, Jinling Yuan, Jinyan Luo, Yurong Li, Yuandong Cao, Weilin Xu and Shu Zhou in DIGITAL HEALTH
Footnotes
Ethical considerations
This study was performed in line with the principles of the Declaration of Helsinki. Approval was granted by the Ethics Committee of Nanjing Medical University First Affiliated Hospital (No. 2024-SR-912). And informed consent was waived because it was a retrospective study.
Author contributions
Yuchen Zhu, Gefei Jiang, and Xingjian Sun contributed equally to this article and shared first authorship. Lei Qiu, Kexin Shi, and Mengxing Wu collected clinical data. Yinjiao Fei and Jinling Yuan collected MRI images. Jinyan Luo and Yurong Li completed the data sorting and induction. Xingjian Sun finished segmentation of the MRI images. Yuchen Zhu and Gefei Jiang analyzed the data and wrote the manuscript. Yuchen Zhu validated ROI. Yuandong Cao, Weilin Xu, and Shu Zhou provided study supervision and article revision. All authors contributed to the article and approved the submitted version.
Consent to participate
This is not applicable to this study.
Consent for publication
This study does not contain personal details and will not lead to the disclosure of patient information, hence it is not applicable.
Funding
The authors received no financial support for the research, authorship, and/or publication of this article.
Declaration of conflicting interests
The authors declared no potential conflicts of interest with respect to the research, authorship, and/or publication of this article.
Data availability statement
The datasets generated during and/or analyzed during the current study are available from the corresponding author on reasonable request.
Declaration of AI tool usage
The authors confirm that no artificial intelligence (AI) tools, including but not limited to large language models (e.g. ChatGPT), AI-assisted writing software, or generative AI, were used in the creation, writing, analysis, or revision of this manuscript. All work presented is the original product of the human authors.
Guarantor
Zhou Shu.
Supplemental material
Supplemental material for this article is available online.
References
Supplementary Material
Please find the following supplemental material available below.
For Open Access articles published under a Creative Commons License, all supplemental material carries the same license as the article it is associated with.
For non-Open Access articles published, all supplemental material carries a non-exclusive license, and permission requests for re-use of supplemental material or any part of supplemental material shall be sent directly to the copyright owner as specified in the copyright notice associated with the article.