
Abstract
The objective was to assess risk of hospitalization and mortality of comorbidities using divisive hierarchical risk clustering to advice clinical interventions. Subjects and Methods: Data from the EHR of a general population, 3799885 adults, followed by 5 years. Model were performed using Spark and Scikit-learn and accuracy for the models was analyzed. Results: The number of models generated depends in part on the number of chronic diseases included (ex testing a sample of six diseases, a total number of 397 models for all-cause mortality and 431 models for hospitalization). The estimated models offered an ordered selection for the relevant clinical variables and their estimated risk as a group and for the individual patient in the group. Accuracy was assessed according to age, sex and the cardinality of the comorbid groups. A mobile version and dashboard were developed. Conclusion: The software developed stratified hospital admission and mortality risk in clusters of chronic diseases, and for a given patient, it could advise intensifying treatment or reallocating the patient risk.
Keywords
Introduction
Chronic diseases are the main cause of mortality and morbidity, accounting for more than 75% of the health care burden in Europe and costing several hundred billion euros each year. 1 They require coordinated input from a wide range of health professionals over a period of years, and assessing risk is a relevant issue for planning tailored decisions. Comorbidity, the co-occurrence of two or more chronic diseases, usually produces an increment in risk of hospitalization and mortality which depends not only on the disease itself, but also on the moment in which a co-occurrence takes place. 2 Generally, it is expected that the greater the number of diseases (cardinality), in a comorbidity group, the greater the risk respect to the most general groups sharing some of the diseases.
Great effort has been directed at identifying clinical risk groups in terms of potential costs, and several approaches in the literature have tried to find scaled measures. Examples of this are CIRS (Cumulative Illness Rating Scale), 3 ICED (Index of Coexisting Disease) 4 and Clinical Risk Groups (CRG). 5 Other kinds of aggregated scales have included age and sex to the disease clusters, e.g., ACGs (Adjusted Clinical Groups), 6 DRGs (Diagnosis-Related Groups) 7 and HRGs (Healthcare Resource Groups). 8 Each creation procedure is different depending on the objectives pursued and the kind of algorithm used. These approaches have been questioned because they are purely descriptive and they are not appropriate for making clinical decisions.
The above-mentioned scales have used agglomerative hierarchical clustering methods dependent on the similarity of patient characteristics with different selection procedures, regardless of whether the procedures are supervised or unsupervised, and using mathematical inferences. Comorbidity clustering, however, allows a patient to be reallocated into comorbidity groups. This so-called divisive hierarchical risk clustering can provide relevant information about risks and can drive information for clinical interventions. In the present study, a divisive hierarchical risk clustering of 4 million adults observed during a period of 5 years was performed. Big Data technologies have been used to prepare the data for modeling.
The aim of the present study was to assess the clustering of chronic diseases and their risk of hospitalization and/or mortality in order to guide physicians in the complex task of take decision when several diseases coexist. The design of the digital approach method used is original and non-previously have been used in the kind of studies such it is the present. The chronic disease selected to develop the algorithms of risk are the 19 more frequent recorded with the exception of cancer, that was excluded since the natural risk for hospitalization is significantly higher that the other processes. Some statistics about these 19 considered diseases are shown in Supplementary Appendix S4.
Materials and methods
Ethics
Patient data firstly underwent a process of pseudo-anonymization and after that a second anonymization by masking or deleting variables that could lead to the reidentification of patients. Spanish Law 3/2018 for Data Protection and Guaranty of Digital Rights and corresponding European norms 9 were followed. The Committee for Ethics and Clinical Trials of the Hospital Clínico of Valencia approved the study (Registration Number: F-CE-GEva-15).
Study population and data collection
The sample was recruited from the universal health care system of the Valencian Community with a population of 3799885 people older than 18 years in 2012. Total population data was extracted for the period of time between 1 January, 2012 and 31 December, 2016. There was one unique electronic centralized clinical record per patient. Registry included patient demographics, medications, vital status, past medical history and laboratory data.
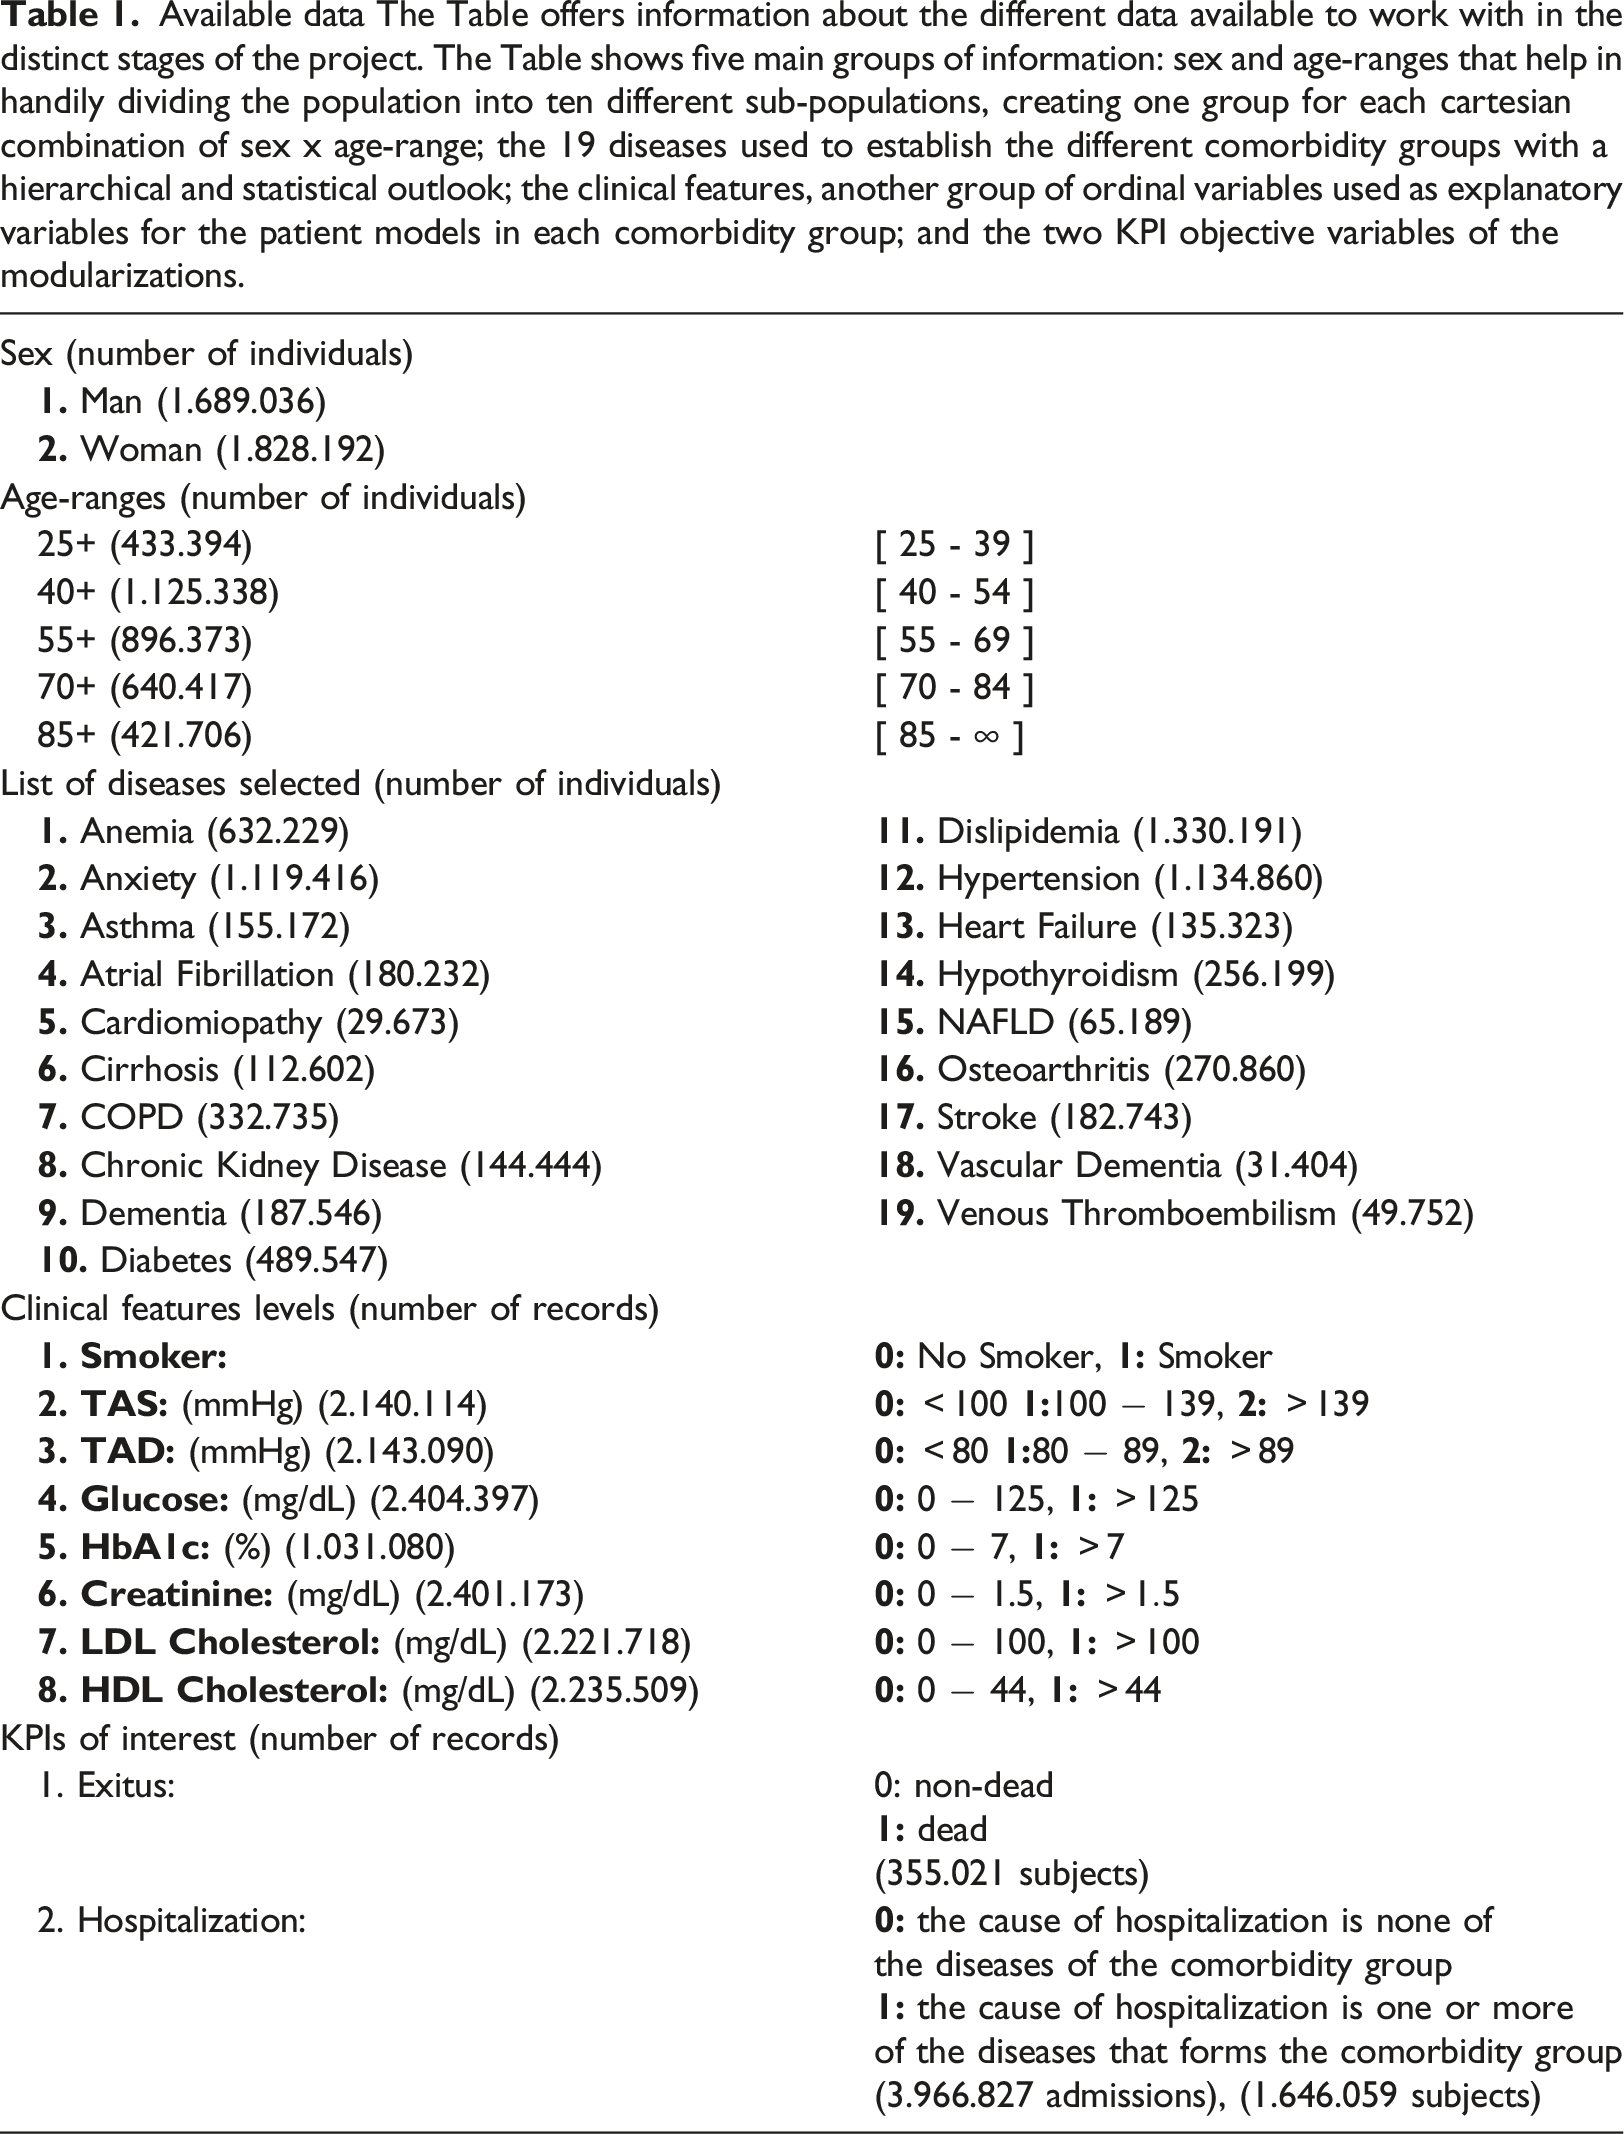
Available data The Table offers information about the different data available to work with in the distinct stages of the project. The Table shows five main groups of information: sex and age-ranges that help in handily dividing the population into ten different sub-populations, creating one group for each cartesian combination of sex x age-range; the 19 diseases used to establish the different comorbidity groups with a hierarchical and statistical outlook; the clinical features, another group of ordinal variables used as explanatory variables for the patient models in each comorbidity group; and the two KPI objective variables of the modularizations.
Modeling
The mathematical modeling consisted of two different stages. The first, the hierarchical clustering, aimed to identify the distinct comorbidity groups that produced an increment in the key performance indicators (KPI) objective (all-cause mortality, hospitalization), from a total of 19 diseases, with up to at most four diseases per group, the decision to select the diseases was based on the prevalence of them and had two steps: (1) identify the more frequent chronic conditions in the study population, and (2) the prevalence given that the 19th was decided since the prevalence of the 20th was much lower than the previous. The number of clusters analyzed are shown in Table 1. The second, the patient model, aimed to offer a detailed report on each cluster of comorbidities previously generated for the different KPI that contain a significant number of individuals. Previously determined, the risks studied were sex- and age-dependent, and a prior manual stratification of these factors was established. For this, each sex population was divided into five different age groups.
First stage: Hierarchical clustering
The system established independent divisive hierarchical comorbidity clusters for each KPI, sex and age group. Comorbidity group creation was based on statistical inference by using a Bonferroni binomial proportion confidence interval 10 in such a way that it was built only when a statistically significant change worsening KPI appeared concerning an immediate less complex comorbidity group. Bonferroni test is introduced trying to minimize possible statistical I risk species (α) problems with cardinality, what could produce a decrease in comorbidity group discovering for higher cardinalities.
Figure 1 shows the example of a divisive hierarchical cluster for a specific KPI, sex and age group. The deeper the group was in the tree, the more specific were the models for the patient, but the lower the number of individuals there were for training the model. The study created all possible comorbidity groups, for a total number of 19 diseases up through a cardinality of four. This way of proceeding made it possible to introduce a certain degree of fuzzy knowledge
11
which allowed for the analysis of a patient belonging to several groups and not just one. A comparison between Hierarchical and Independent clustering approximation is shown in Supplementary Appendix S6. Divisive hierarchical cluster. Each level in this cluster, columns from left (shallower) to right (deeper), represents a divisive split of the population depending on the diseases considered into the boxes under an and operation. The deeper within a level, the lower the number of individuals in the corresponding group with respect to the related low-level comorbidity groups.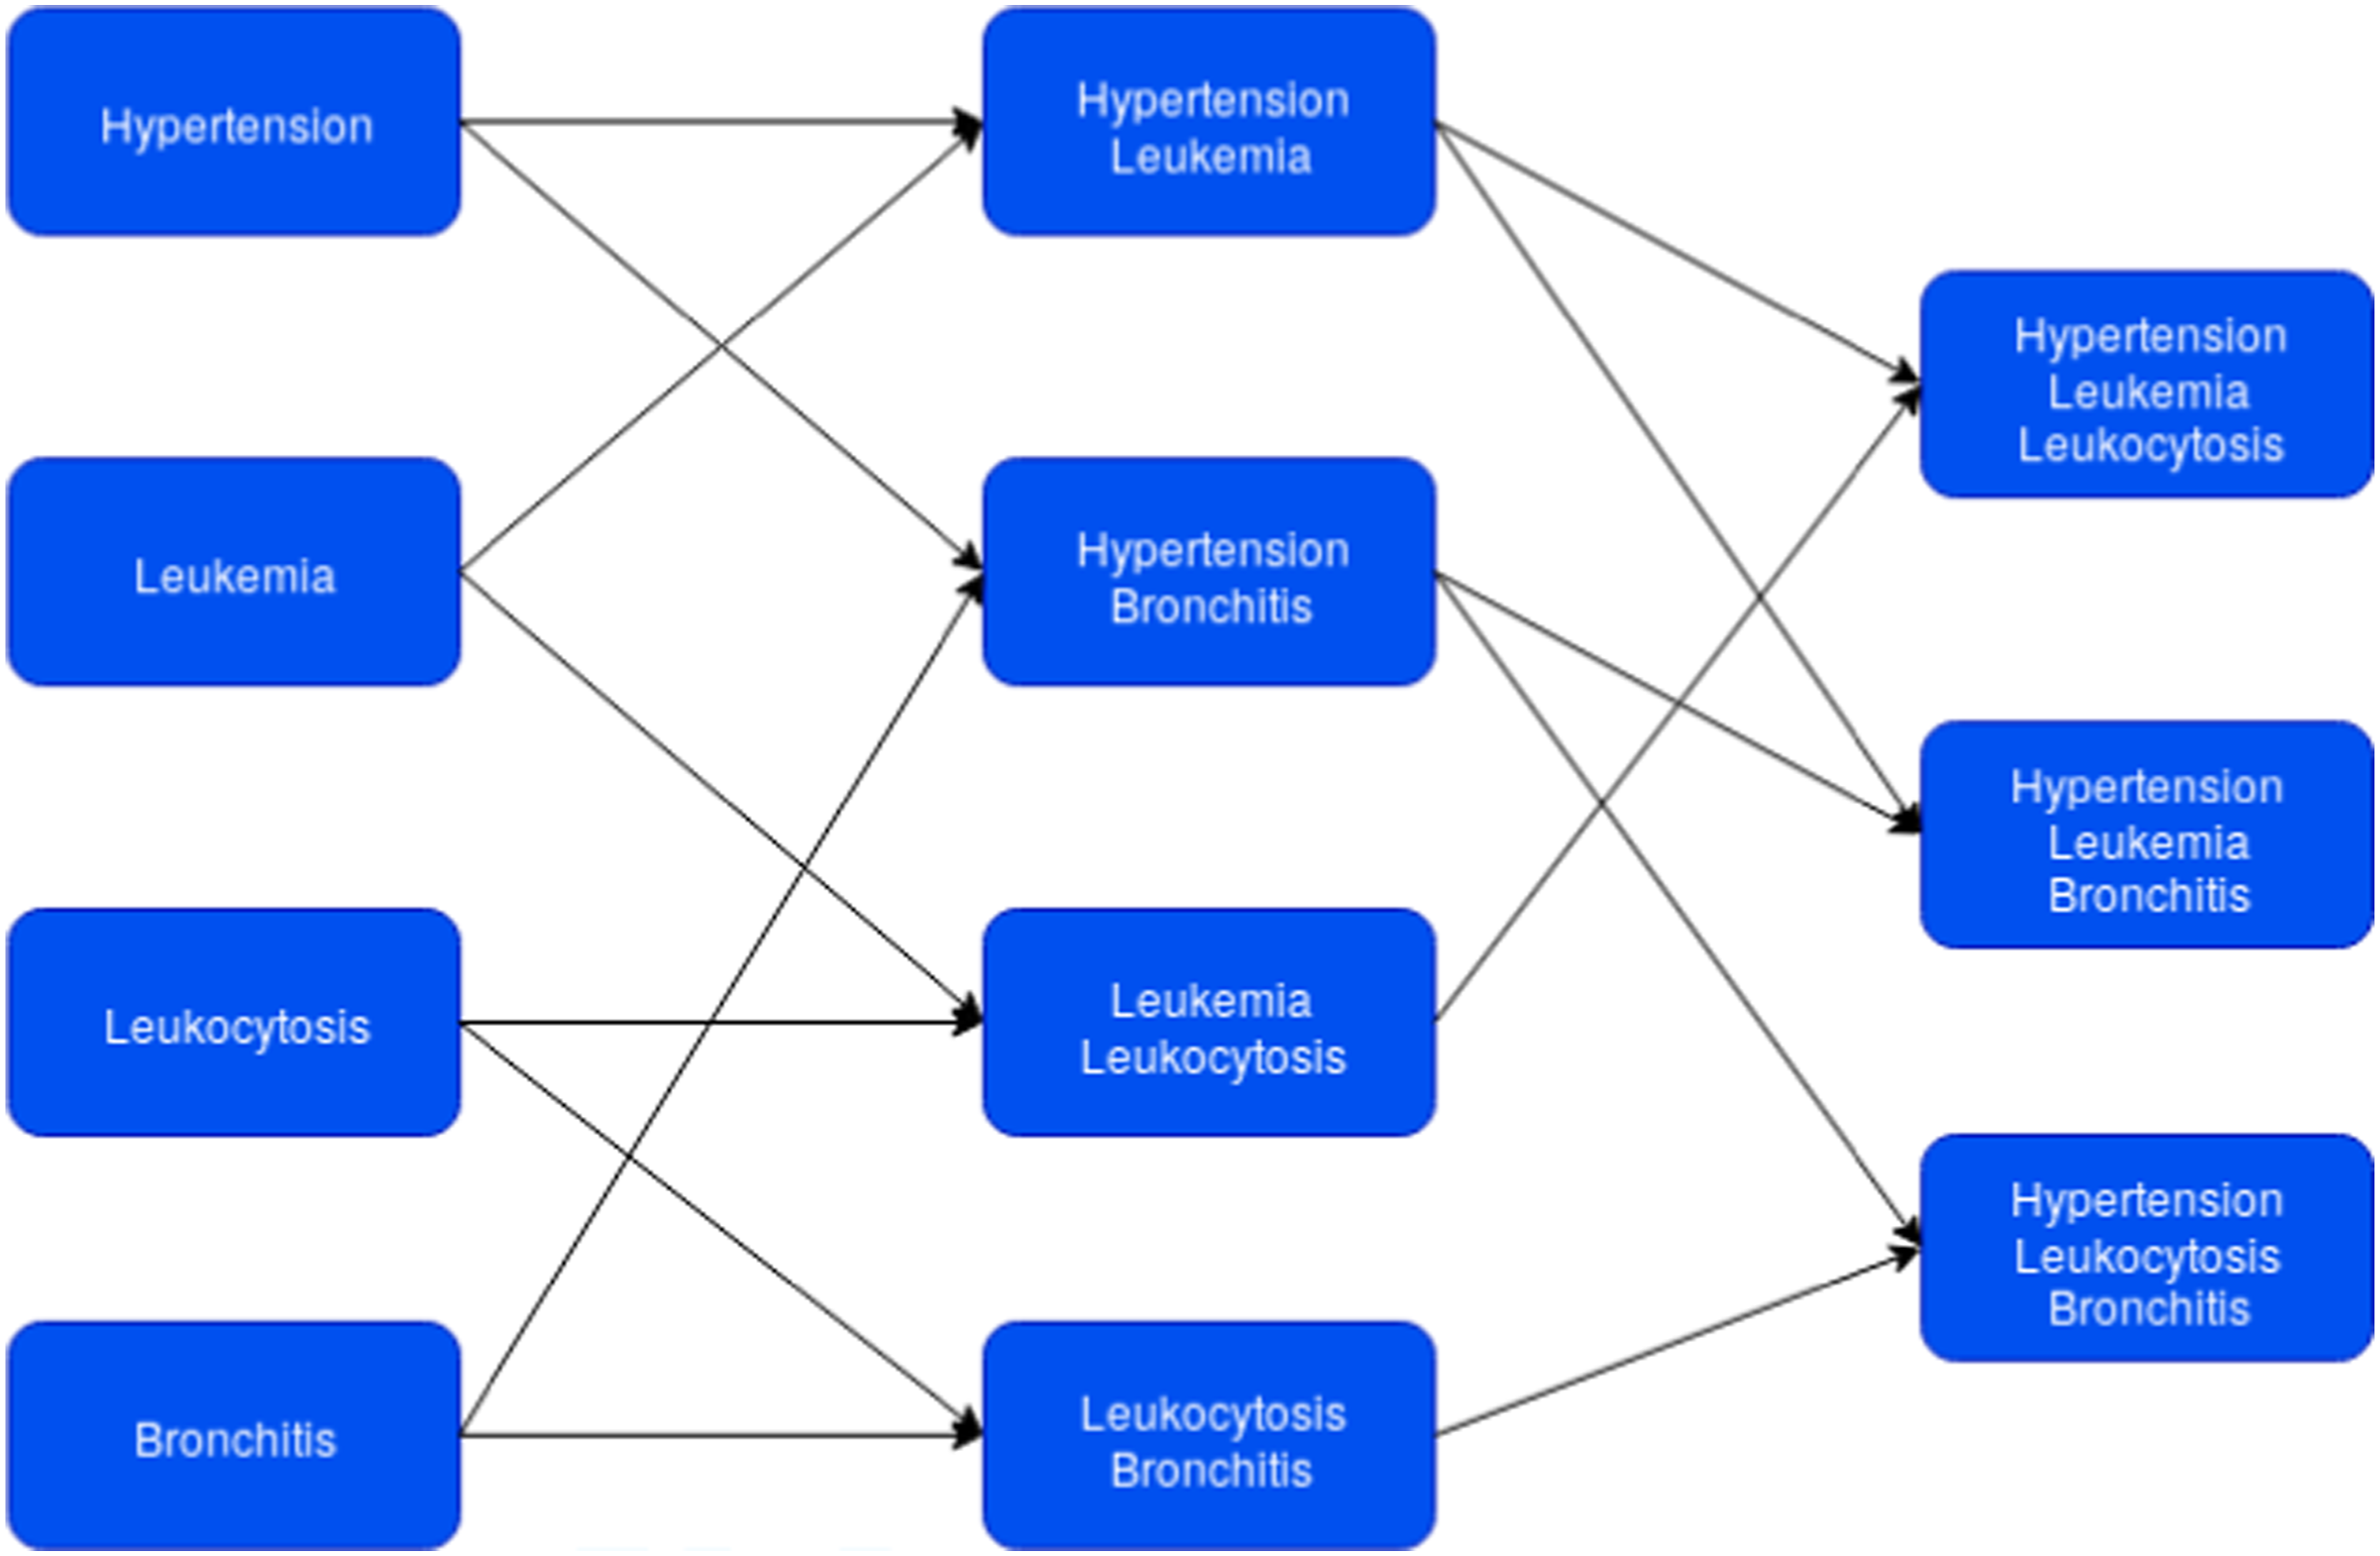
Second stage: Patient models
Specific models for each one of the KPIs of interest into a comorbidity group was created to cover the different stages of the required machine learning pipeline in this work. These particular pipeline produced predictions about the risk of KPI per patient that belonged to a group and information about the most important clinical features for each one of the KPIs inside a comorbidity group. The development of this part used models for feature selection, missing data imputation and, finally, KPI risk prediction for a given patient. It was also possible to measure the relevance of the previous filtered features to get the final KPI risk prediction in order to help know what clinical variables should be changed in a patient to improve their specific KPI risk inside a group. Finally, the error estimation for each risk prediction model and statistical inference for the predictions permitted the introduction of confidence measures that could help a physician know the confidence estimation in the KPI risk prediction. As an individual with several diseases can belong to multiple comorbidity groups, it is necessary to look for a way to offer only a risk value by aggregating all the information from the different belonging groups. There are several ways to make this aggregation: minimum error, weighted average, etc. Once we choose the corresponding aggregation system, it will be evaluated using a blind test with new individuals.
Missing values
Some of the feature explanatory values required for a specific model had no available values for the pre-established period of 6 months. Consequently, a specific model for missing data imputation into each comorbidity group was used taking into consideration the heterogeneous nature of the variables and their relations with each one of the comorbidity groups. Therefore, a general hybrid imputer model was implemented. This included unidimensional imputers for variables with low multicollinearity and multidimensional ones for variables with a high multicollinearity. 12 The level of collinearity (ρ) took values from 0 to 100, where 0 and 100 meant non-multicollinearity and multicollinearity respectively (see Supplementary Appendix S2).
Feature selection
For each comorbidity group and different KPIs, the relevant features for each group were selected. As this is a common task for a great quantity of machine learning pipelines, an independent and easily configurable function was created for this subject. Different algorithms could be applied for this purpose like genetic algorithms, decision trees, logistic regression, etc. Concretely, this work seeking the ease interpretability of results used a general univariate logistic model with the available features to finally offer the list of relevant variables to be used in the next risk prediction model estimation under a classical statistical inference point of view. As each comorbidity cluster had different number of individuals and aiming for a general criterion to detect the significative explanatory variables a general p-value lower than 0.05 was established for all them. Then, this model only considered an explanatory variable as significant when the logistic model, with the KPI of interest as the dependent variable, obtained a p-value lower than 0.05.
Risk prediction
The selection process arrived at a set of explicative clinical features for a specific KPI risk value for sex, age-range and comorbidity group. A decision tree
13
was estimated to predict the corresponding KPI risk value for a group of patients taking only as input the elected clinical features. Although a heterogeneous set of models could be more interesting to improve model accuracy in the different comorbidity groups, this first study only uses decision trees for all the groups, not only looking for explainability, but also trying to isolate the risk estimation model. This approach allows the study of model accuracy related to other general parameters, such as Age, Genre, number of explanatory variables and comorbidity group cardinality. Figure 2 shows a decision tree model for hospitalization risk in women, age range 85+ and the comorbidity group composed of Stroke-Diabetes-Hypertension. The work is mainly looking for differences in the model accuracy conditioned to features like genre, age rank, comorbidity cardinality and number of explanatory variables into a model. Under this approximation a different model is created for each comorbidity group but the kind of model and training parameters for them are similar and no different parameter optimization has been applied to each one of the models. The hyperparameters used to estimate the different decision trees have been the selection of Gini impurity score for space partition and fix a minimum of 50 inviduals by node. As the number of individuals, in hierarchical approximation, decreases as more significant was the tree depth, which sometimes impossibilities a general train-test split, a general cross-validation K-Fold technique was used to validate the model using disjoint K-fold and computing the mean accuracy for all K-folds. Concretely, in the major part of models a general 100-fold is applied. However, in a few models, where there is a very low number of individuals, we allow the possibility to validate with a lower K, constraining the K to maintain a minimum number of 4 individuals by folder. Decision tree classifier. Model for hospitalization risk prediction for women, age-range 85+ and comorbidity group composed of diseases 1,20,40. The encoded explanatory variables (CVx) in the model are the clinical features for a patient.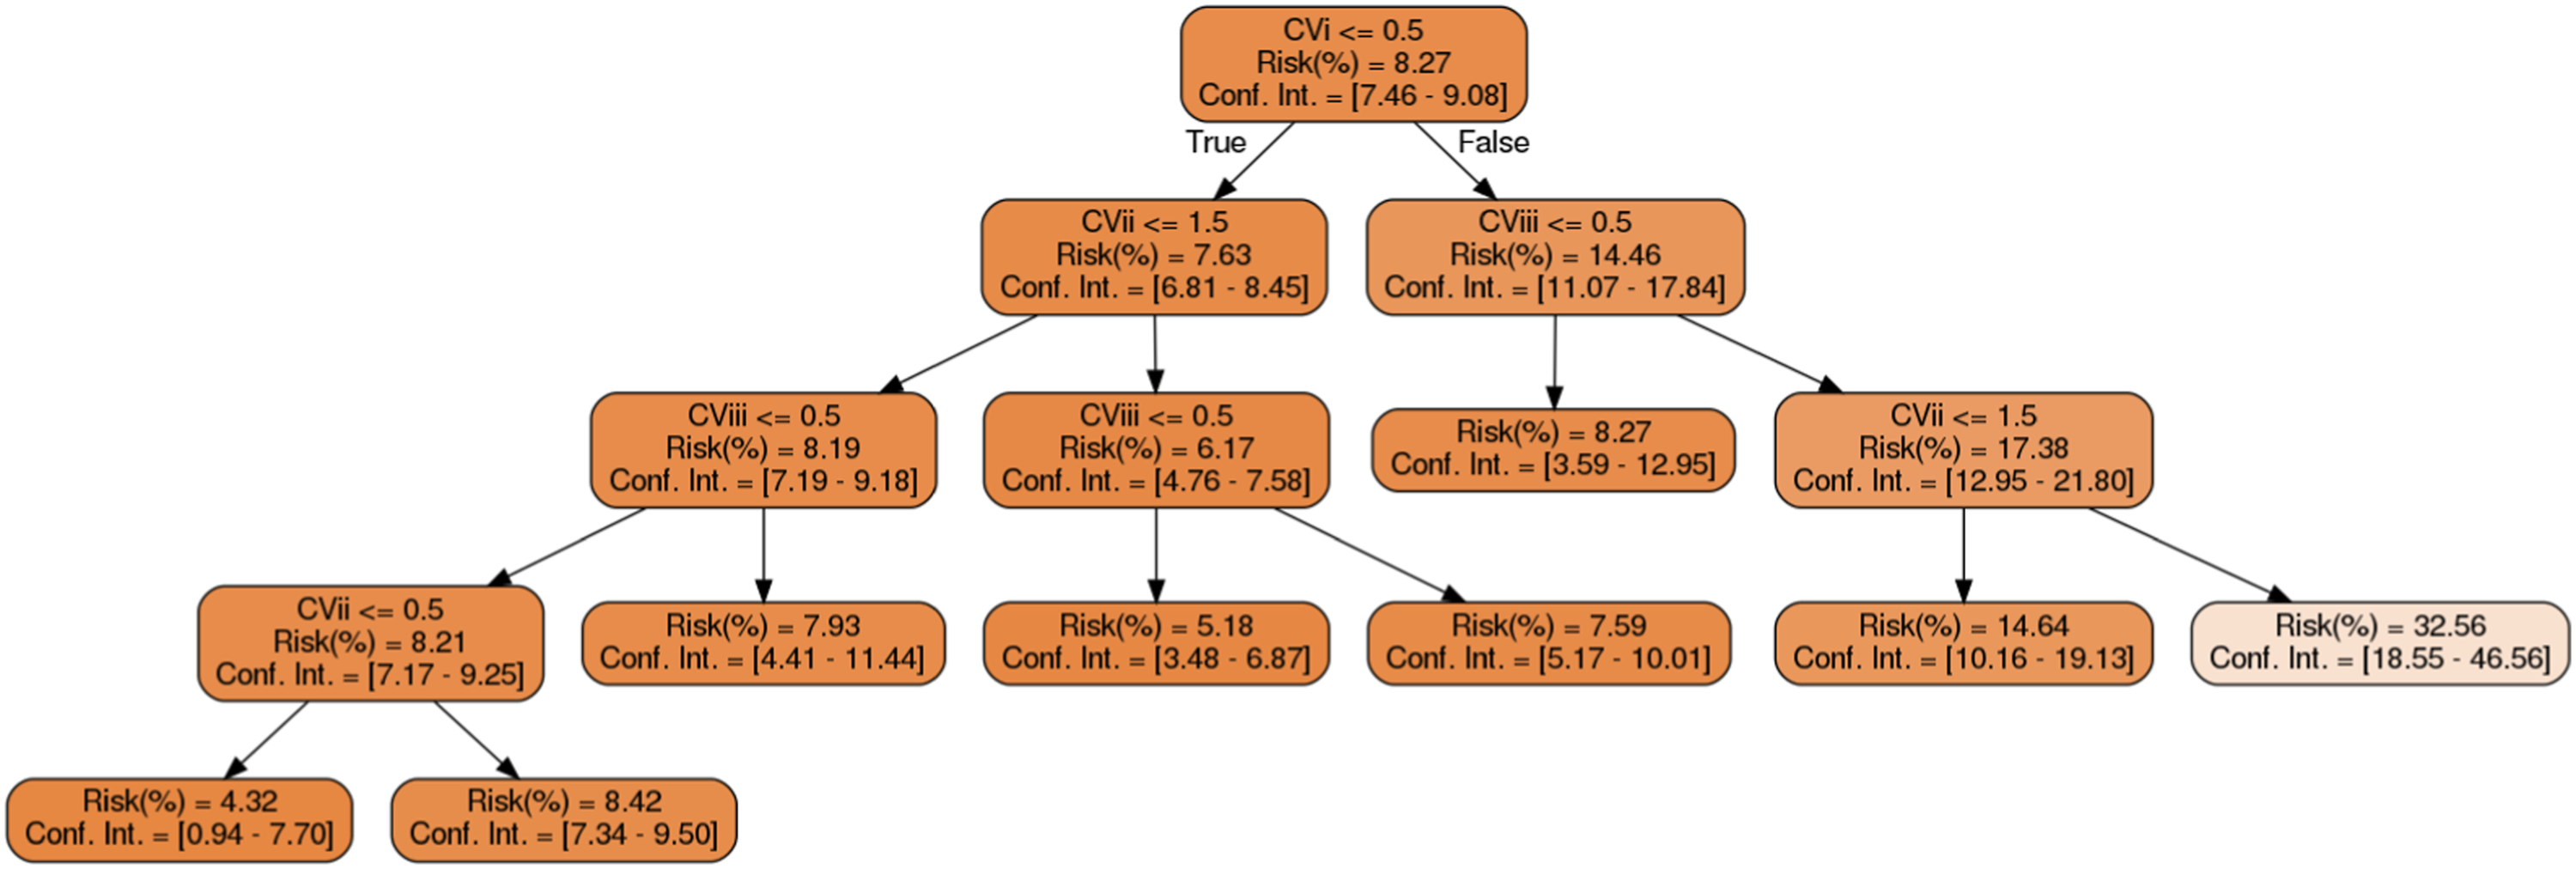
The decision tree model consists of a hierarchical binary tree formed by a set of nodes and elements. The model aimed to offer nodes with more accurate disjoint patient partitions for the best prediction of the desired KPI risk, taking the clinical explanatory features as those that allowed partitioning. All the individuals that belonged to a node came from the nearest nodes in the tree or were the global set of individuals at the initial.
There were three different kinds of nodes. The non-final ones were formed by nodes with both input and output elements. Then, there were initial and final nodes, formed by nodes with only output or input elements respectively. Each node had information about the explicative feature selected to obtain a new individual partition from patients that came from their previous node. The hospitalization risk percentage and confidence interval for some of these diseases. The feature selected in each node was the explicative feature that gave the best binary individual partition for patients that belonged to this node under the Gini impurity score 14 that permitted establishing the divisions. The color of the nodes offered information about the KPI: blue for class 1 (hospitalitation) and orange for class 0 (non-hospitalitation), in the case of Figure 2. Moreover, the hue offered information about the certainty for class prediction. The darker the hue, the truer the classification. Finally, the model in production produced a KPI risk prediction and a degree of confidence for each new patient that belonged to the group conditioned to its selected clinical feature values. These predictions came from the final node of the individual, given its selected clinical features.
Overall, a large number of different risk models, one for each KPI and comorbidity group, were produced. Each comorbidity group was modeled differently, with heterogeneous variables and individuals. Then, it was possible to observe different dynamics in risk predictions (Supplementary Appendix S1) depending on the comorbidity group the model belonged to and the clinical feature values for the individual. Measuring the dynamics of each one of the easily observing relevant things like predictions that were remote from others. Furthermore, these measures of dynamics could help filter several critical models automatically so their final study and validation could be well performed before putting the models to use.
The results of the different models were put to use employing a mobile application and a web dashboard (Supplementary Appendix S3).
Data management
This project worked with an anonymized 5-year dataset, from 2012 to 2016, which data consisted of medical records for a population of about four million patients ≥ 25 years old. Table 1 shows the dataset had information about diseases, health measurements and values for the hospitalization and death KPI.
The work was divided into two different phases. The first one sought to obtain the different comorbidity groups, hospitalization and death KPI from a total of 19 diseases, with up to at most four diseases per group for the hospitalization and death KPI. The second one consisted of the creation of specific models for all the comorbidity groups, previously generated for the different KPI that had a significant number of individuals. It was already known that the risks studied were sex- and age-dependent, a prior manual stratification of these factors was established. To this purpose, each sex population was divided into five different age groups, as shown in Table 1. For each patient, there was a set of clinical values. Since the values for each one of the clinical features were not usually obtained at the same moment, we assigned the closest value for a 6-months window. If during this past or future 6-month period we did not observe a value for a clinical feature in a patient, a missing value was assigned. Those variables were treated as ordinals, as shown in Table 1, in order to facilitate the introduction of the patient’s data into the app.
Results
General characteristics of the study population and model statistics
The study was performed on a total of 3799885 people (age and sex distribution in Supplementary Appendix S4). The list of diseases and their corresponding ICD-codes included in the analysis are in Table 1. To analyze the effect of several factors over the accuracy of the models for the two KPIs, a sample of 397 models for all-cause mortality and 431 models for hospitalization was obtained and evaluated. The models included a total number of 6 diseases (Stroke, Diabetes, Chronic Kidney Disease, Atrial Fibrillation, Hypertension, Heart Failure) with individuals from both sex and all age ranges. Models for comorbidity groups that had a minimum number of < 51 patients were eliminated. Cross-validation mean accuracy for the models was analyzed and the impact of several factors (missing value imputer, comorbidity group cardinality, sex, age range, and the number of clinical features used to estimate the model) were assessed. Multifactor boxplots and 95% confidence intervals of the estimated models obtained for all-cause mortality and hospitalization were plotted.
Evaluation impact of missing values imputation model
Figure 3 shows boxplots with the mean cross-validation accuracy and their 95% confidence interval, for the estimated models obtained for all-cause mortality and hospitalization KPI applying multivariant imputer (mv), hybrid imputer with a multicollinearity factor of 90 (hy90) and 70 (hy70), and finally, a univariant imputer (uv). There were no great differences for all-cause mortality independent of the imputer used. In the case of hospitalization KPI, however, the multivariant imputer (mv) improved, although not significantly. Since the observed results for the multivariant imputer were equal to or better than those for the rest of the imputers, this was the imputer finally selected for the rest of the evaluations. Missing value imputer evaluation. Accuracy mean from risk models to evaluate the effect of multivariant (mv), hybrid (hy90, hy70) and univariant (uv) imputers for mortality and hospitalization KPI model prediction.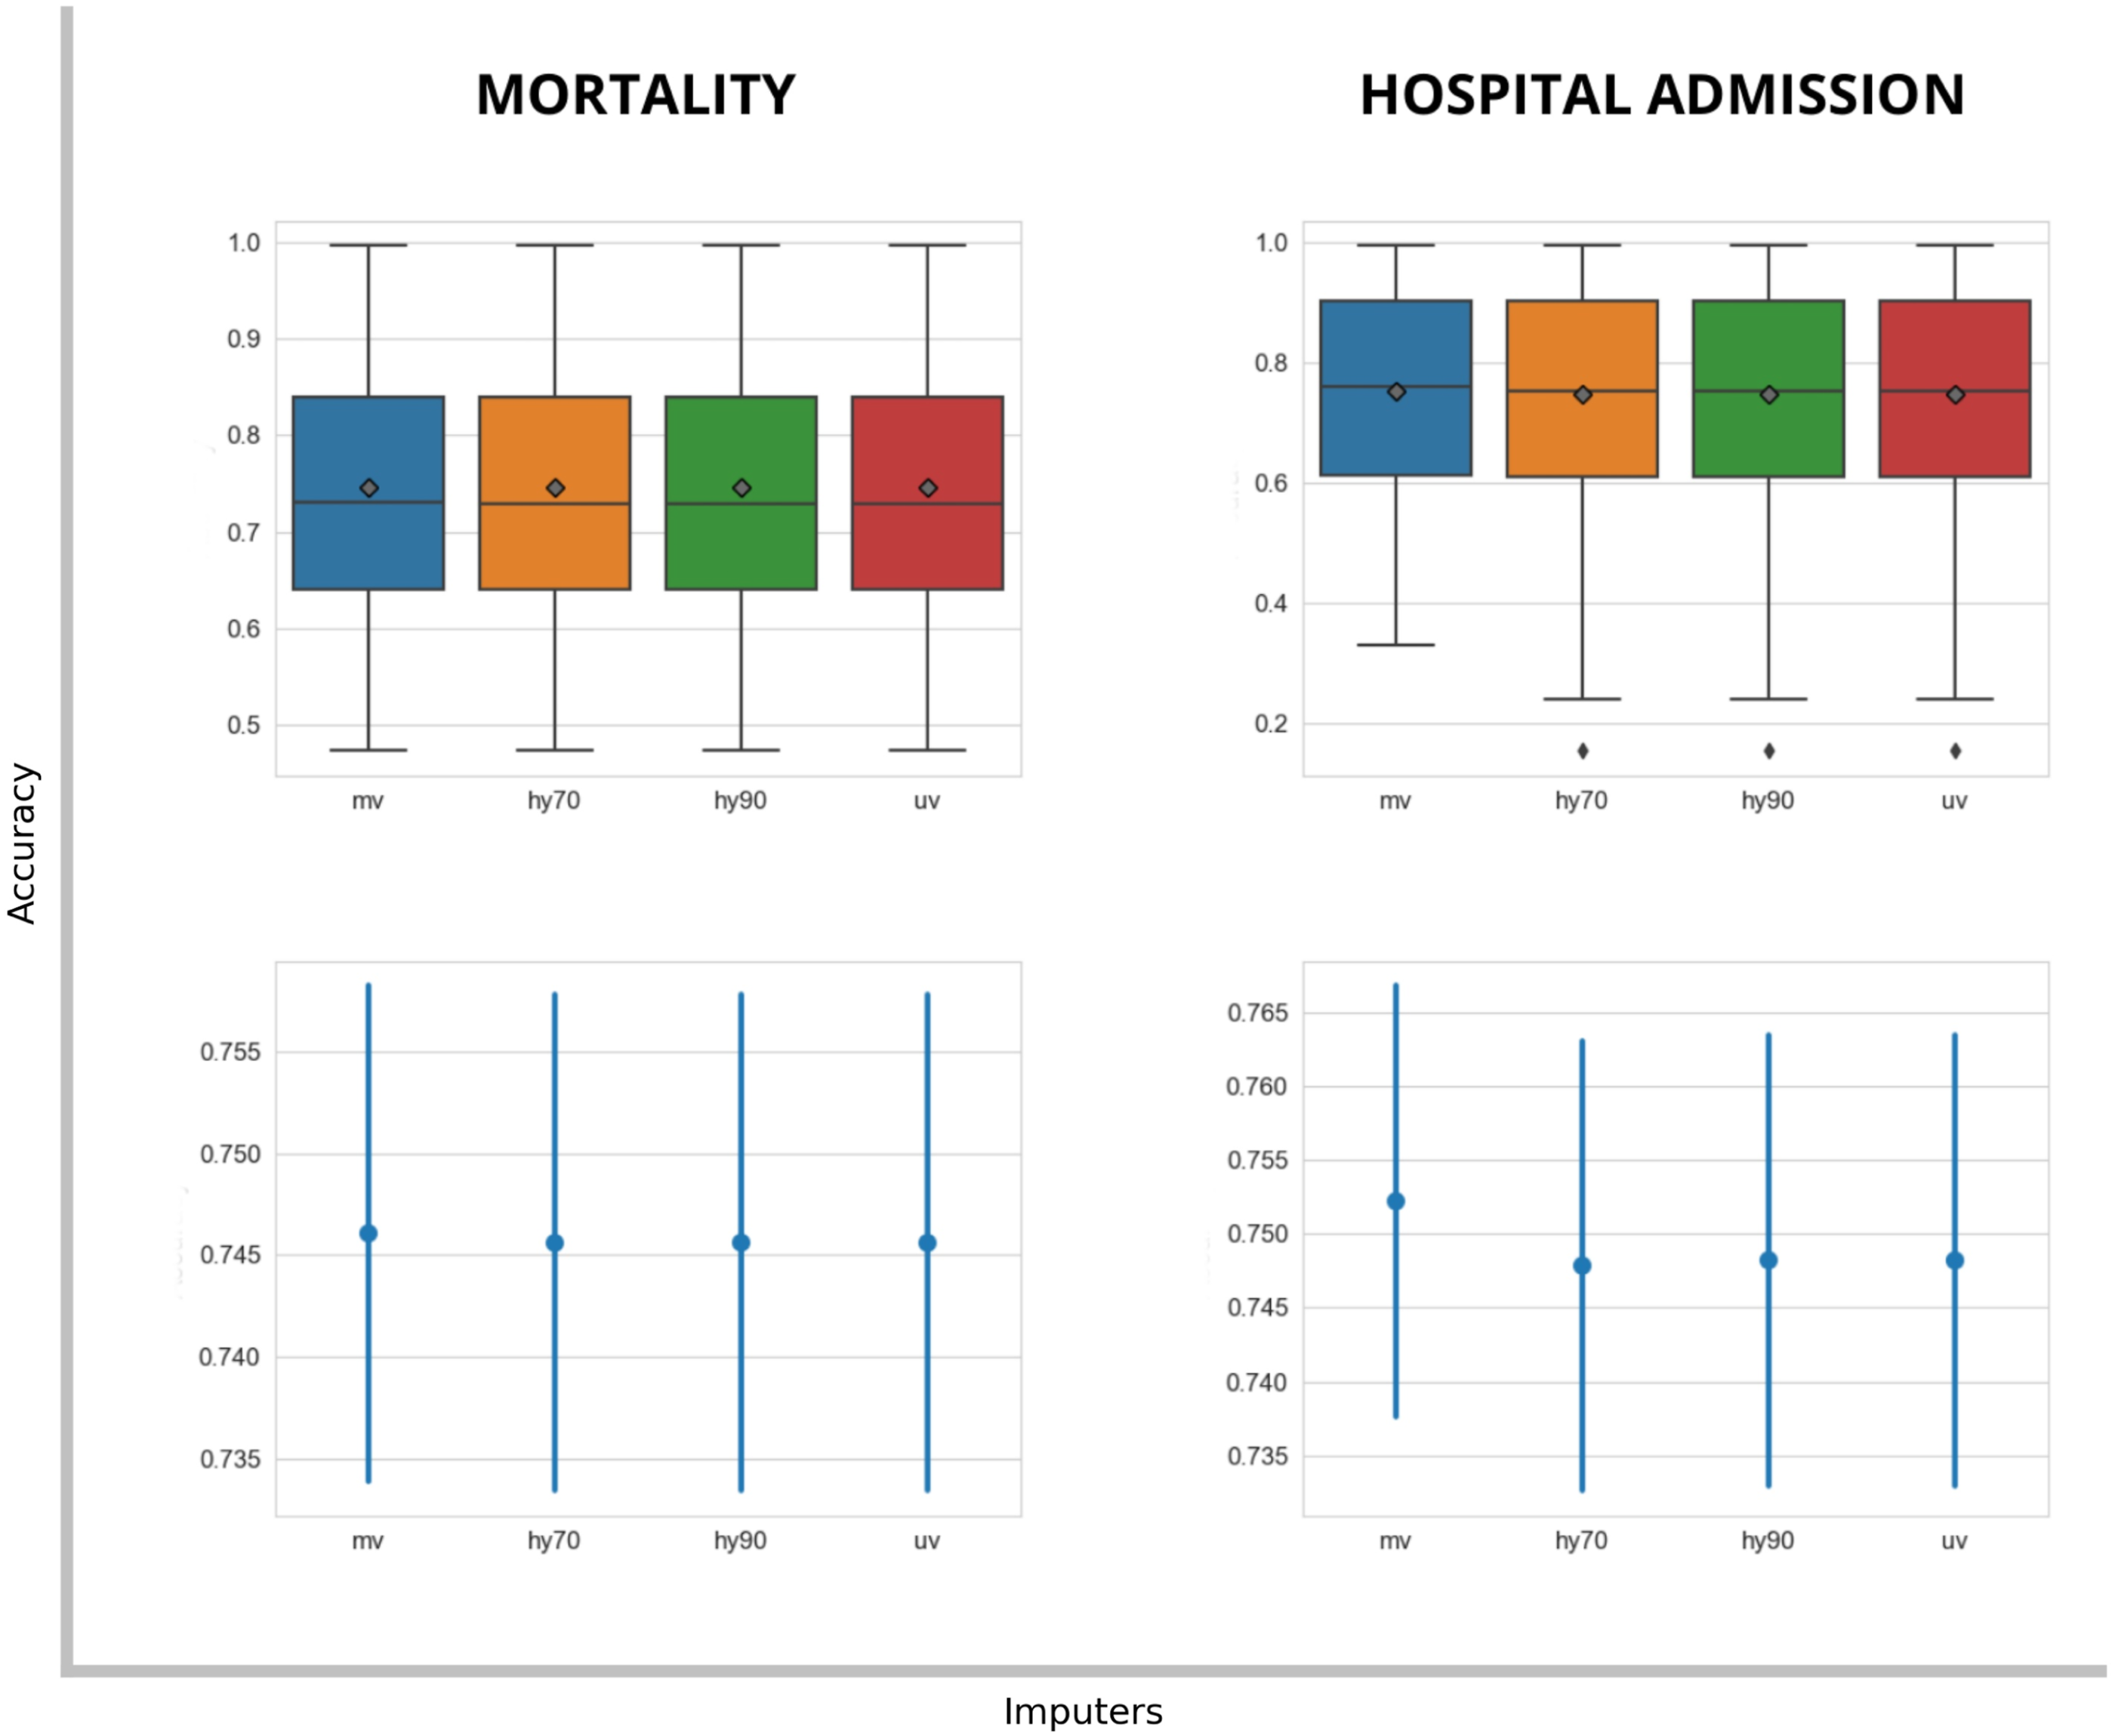
Evaluation of models for groups of sex and age
Figure 4 plots show the distribution for mean cross-validation accuracy for the models related to sex and age range. There were differences for model accuracy in both KPIs for the different groups of sex and age range. It showed decreases in all-cause mortality accuracy in the older group, with this behavior repeating for both sexes. Probably because a greater cardinality in comorbidities, increases the illness complexity what would require for a wider set of clinical variables to study. Also relevant was the lower model accuracy anomalies for the two youngest groups for both KPIs, although the results differed according to sex: hospitalization for men, and all-cause mortality for women. Sex and age-range model performance evaluation. Accuracy mean from risk models to evaluate the effect of sex [men (1), women (2)] and age-range (25+,40+,55+,70+,85+) for mortality and hospitalization KPI model prediction.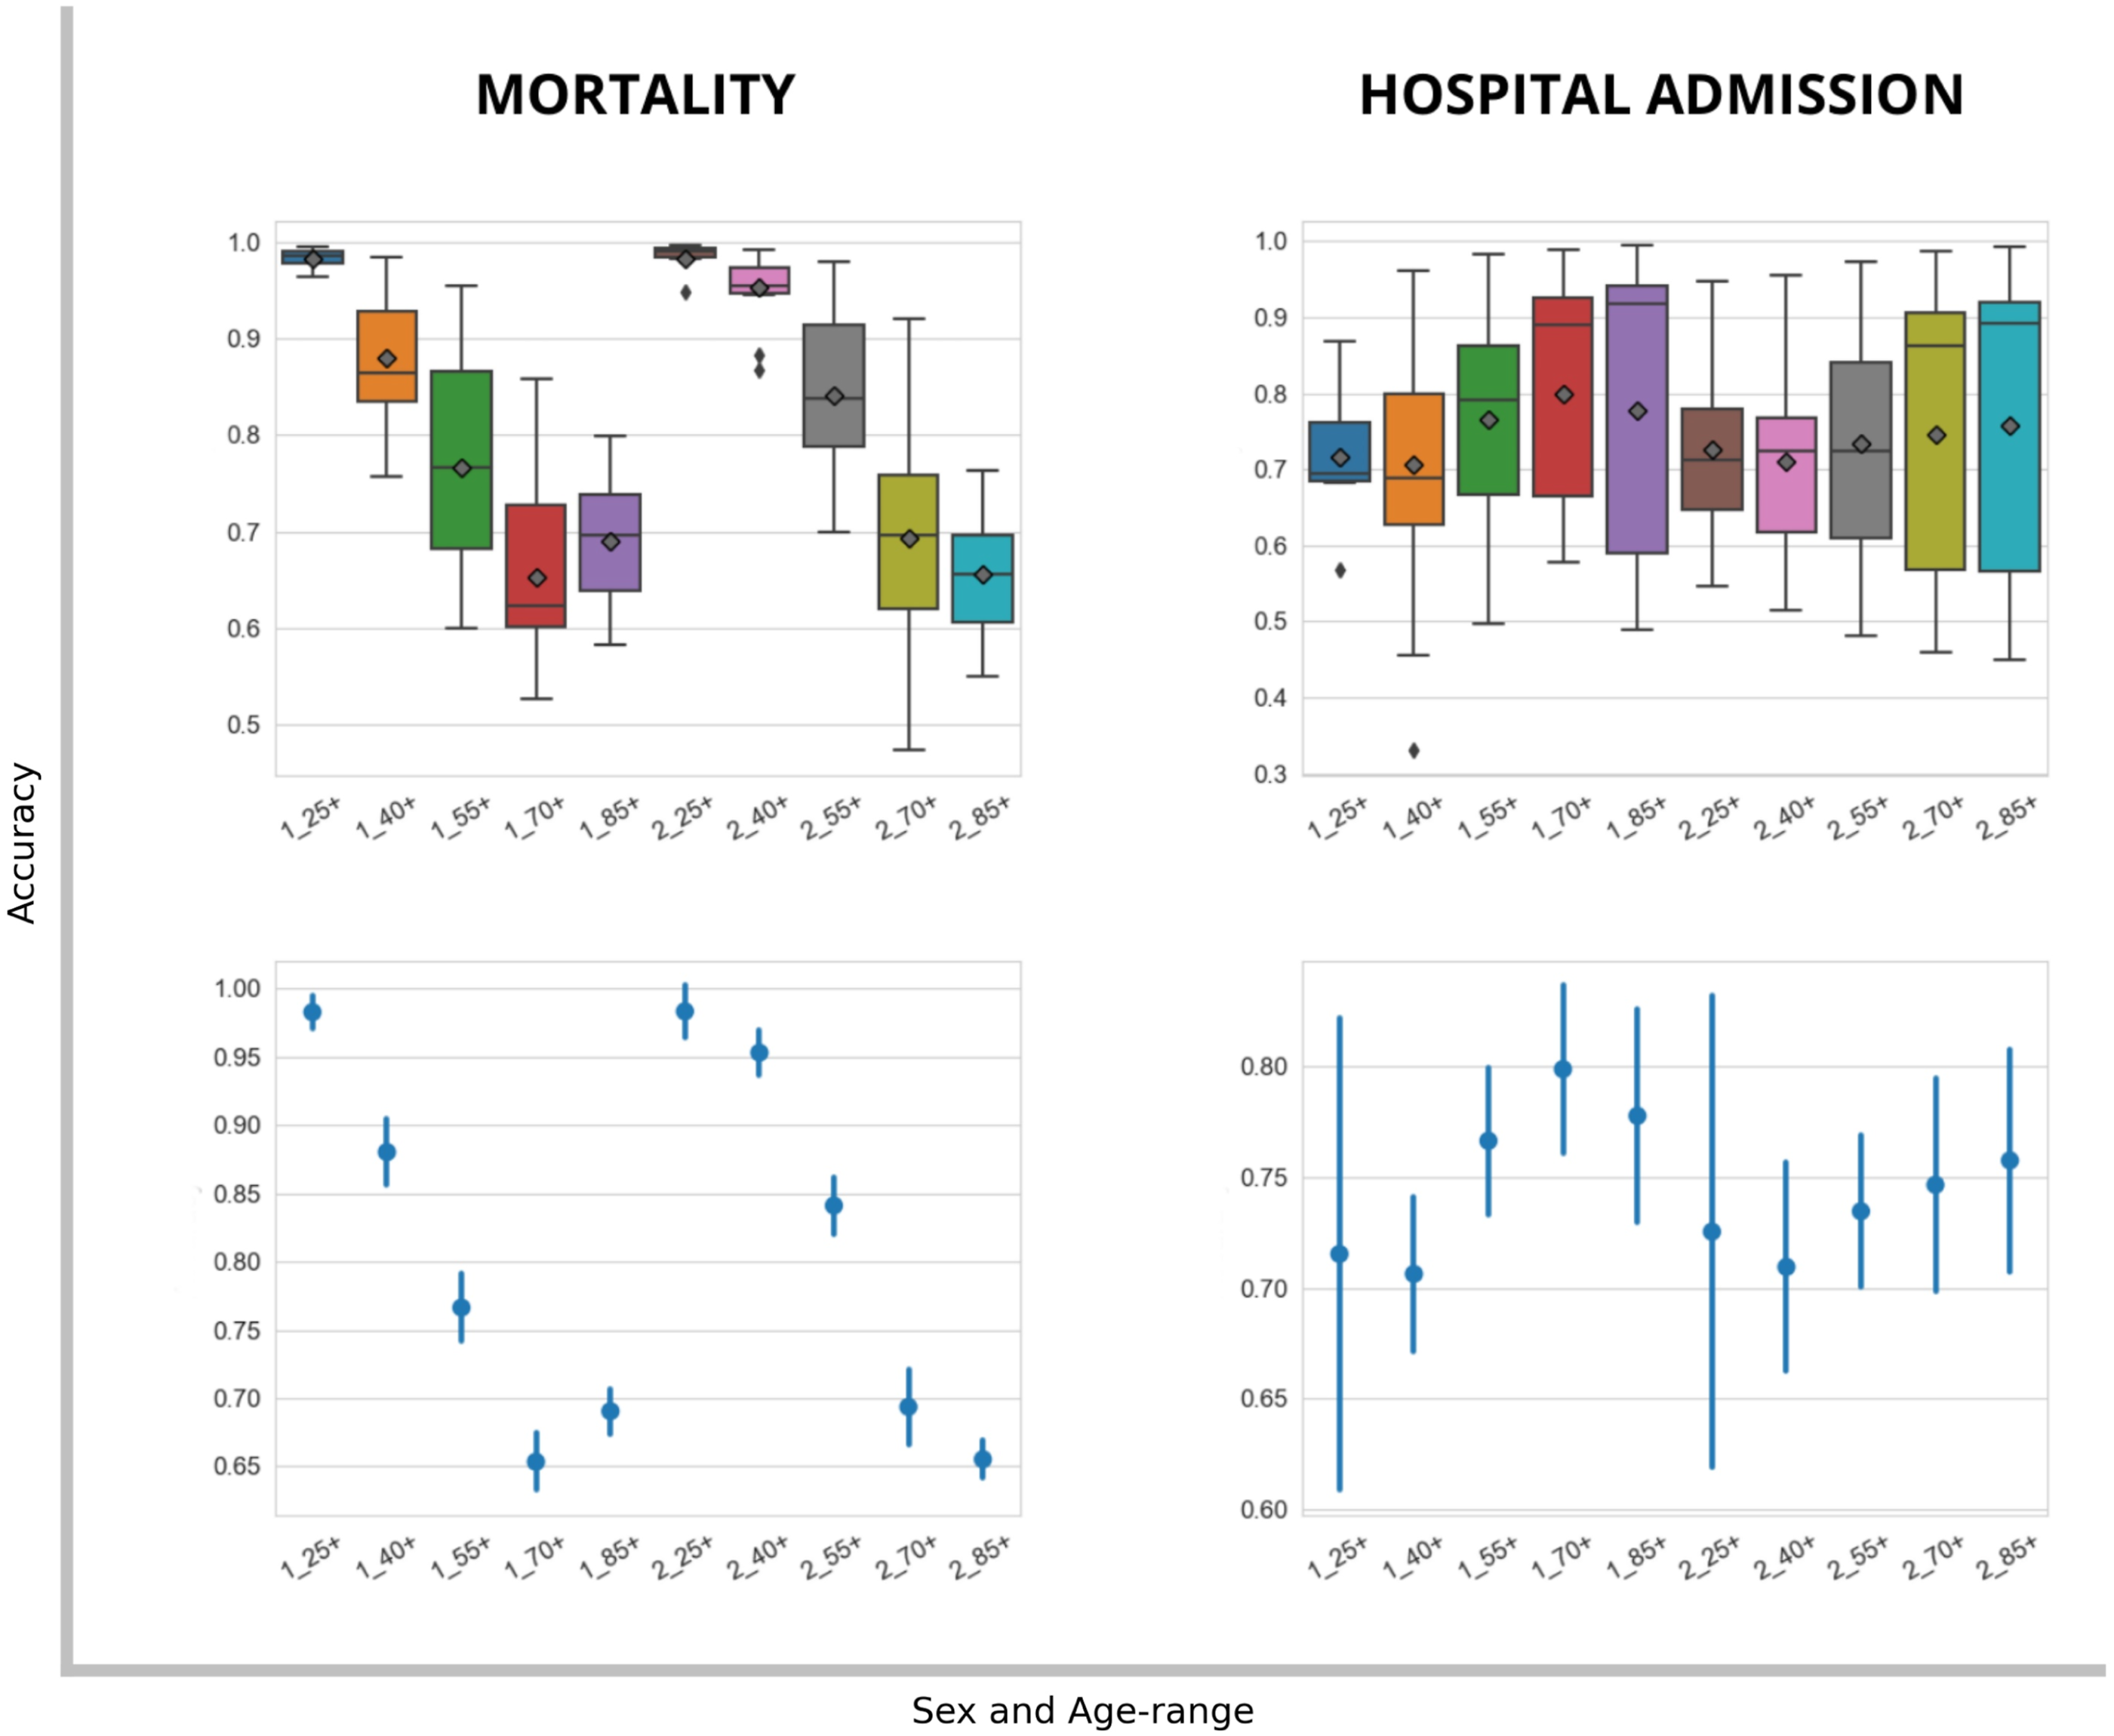
Evaluation of general factors
The relevance of the factors (age group, sex, cardinality and number of features in each model) assessed by regression models was calculated. For each model, regression included as independent variables the factors while the dependent variable was the mean accuracy of the models. In each subgroup of the population (men, women, age groups, number of comorbidities and the clinical variables relevant to the model), the impact of the other factors (Figure 5) and their accuracy (Figure 6) were assessed. While Figure 5 shows the relevance of each factor in the context of the other in relation to the accuracy, Figure 6 gives a quantitative estimation of the improvement in or worsening of the accuracy for each unit of increment of the factors (for sex (women), for each a group of age, for cardinality number of comorbidities, for the number of clinical variables relevant in the model). A positive value indicated an improvement in the precision and a negative value a worsening. Feature importance. Accuracy mean from risk models of mortality and hospitalization to evaluate the importance of sex (Sex), age (Age), comorbidity group cardinality (Card) and number of clinical features (Clin) used to train the model. Factors effect. Accuracy mean from risk models of mortality and hospitalization to evaluate the effect of sex (Sex), age (Age), comorbidity group cardinality (Card) and number of clinical features (Clin) used to train the model.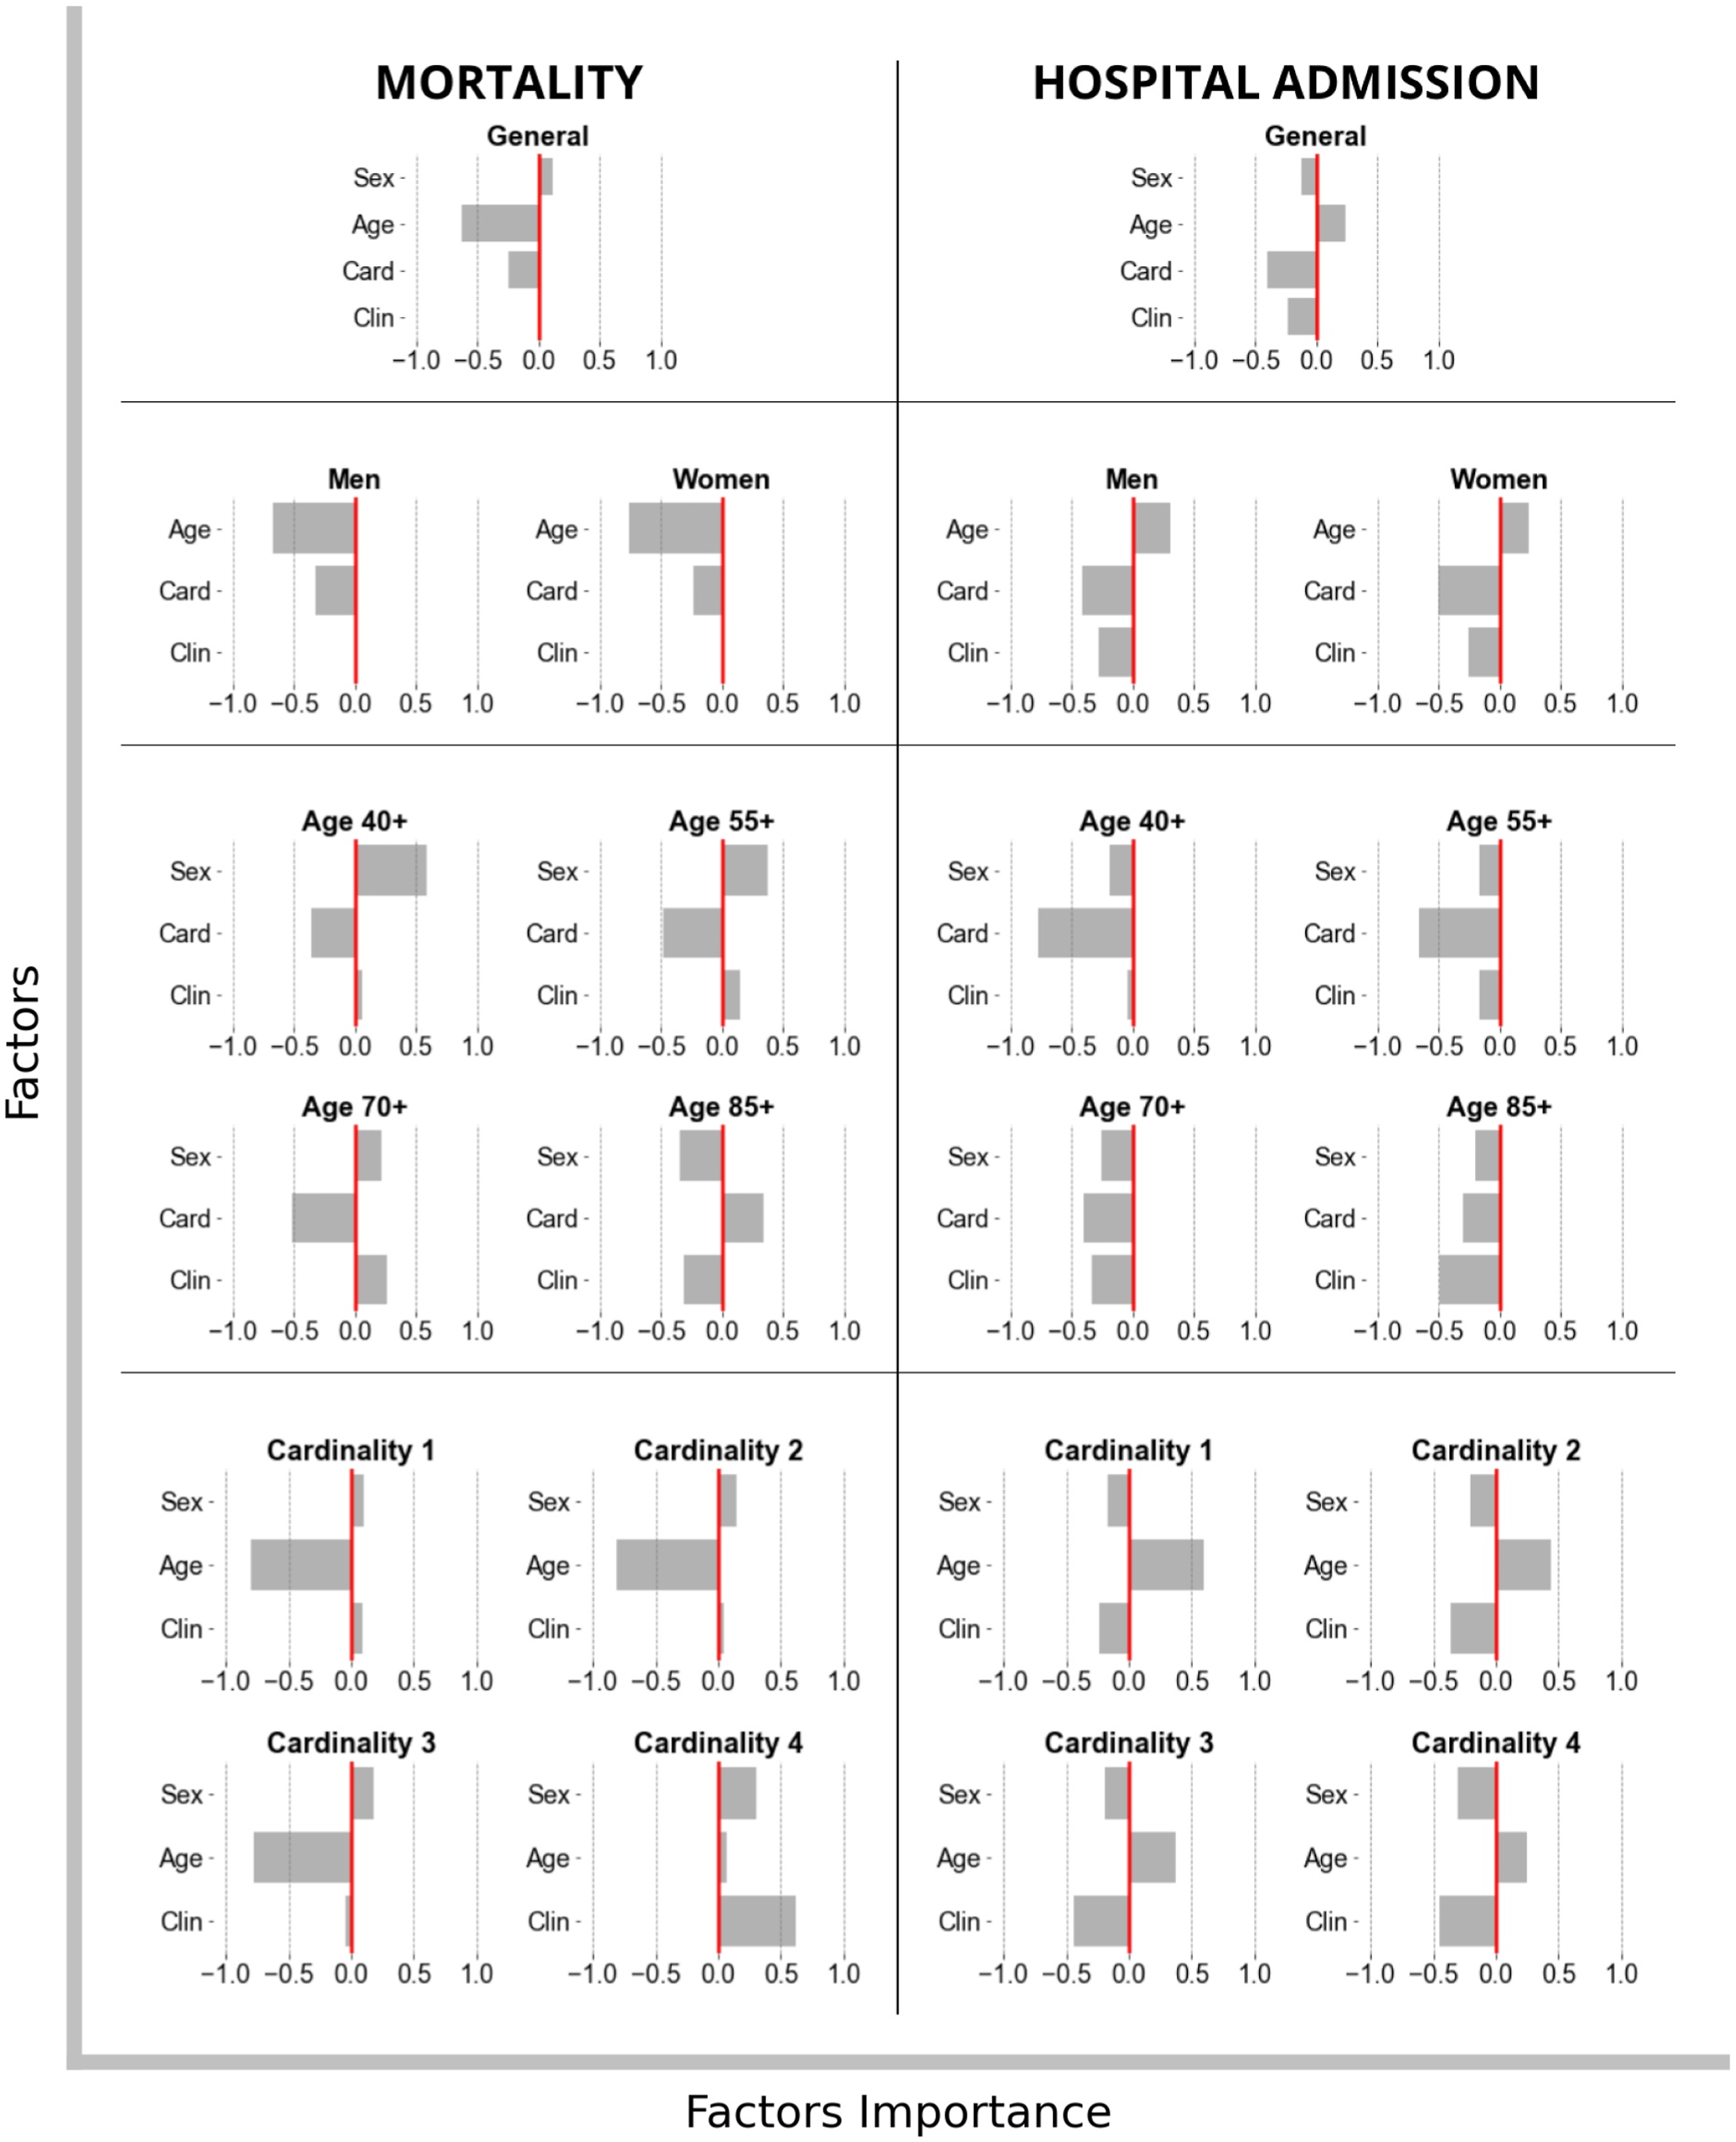
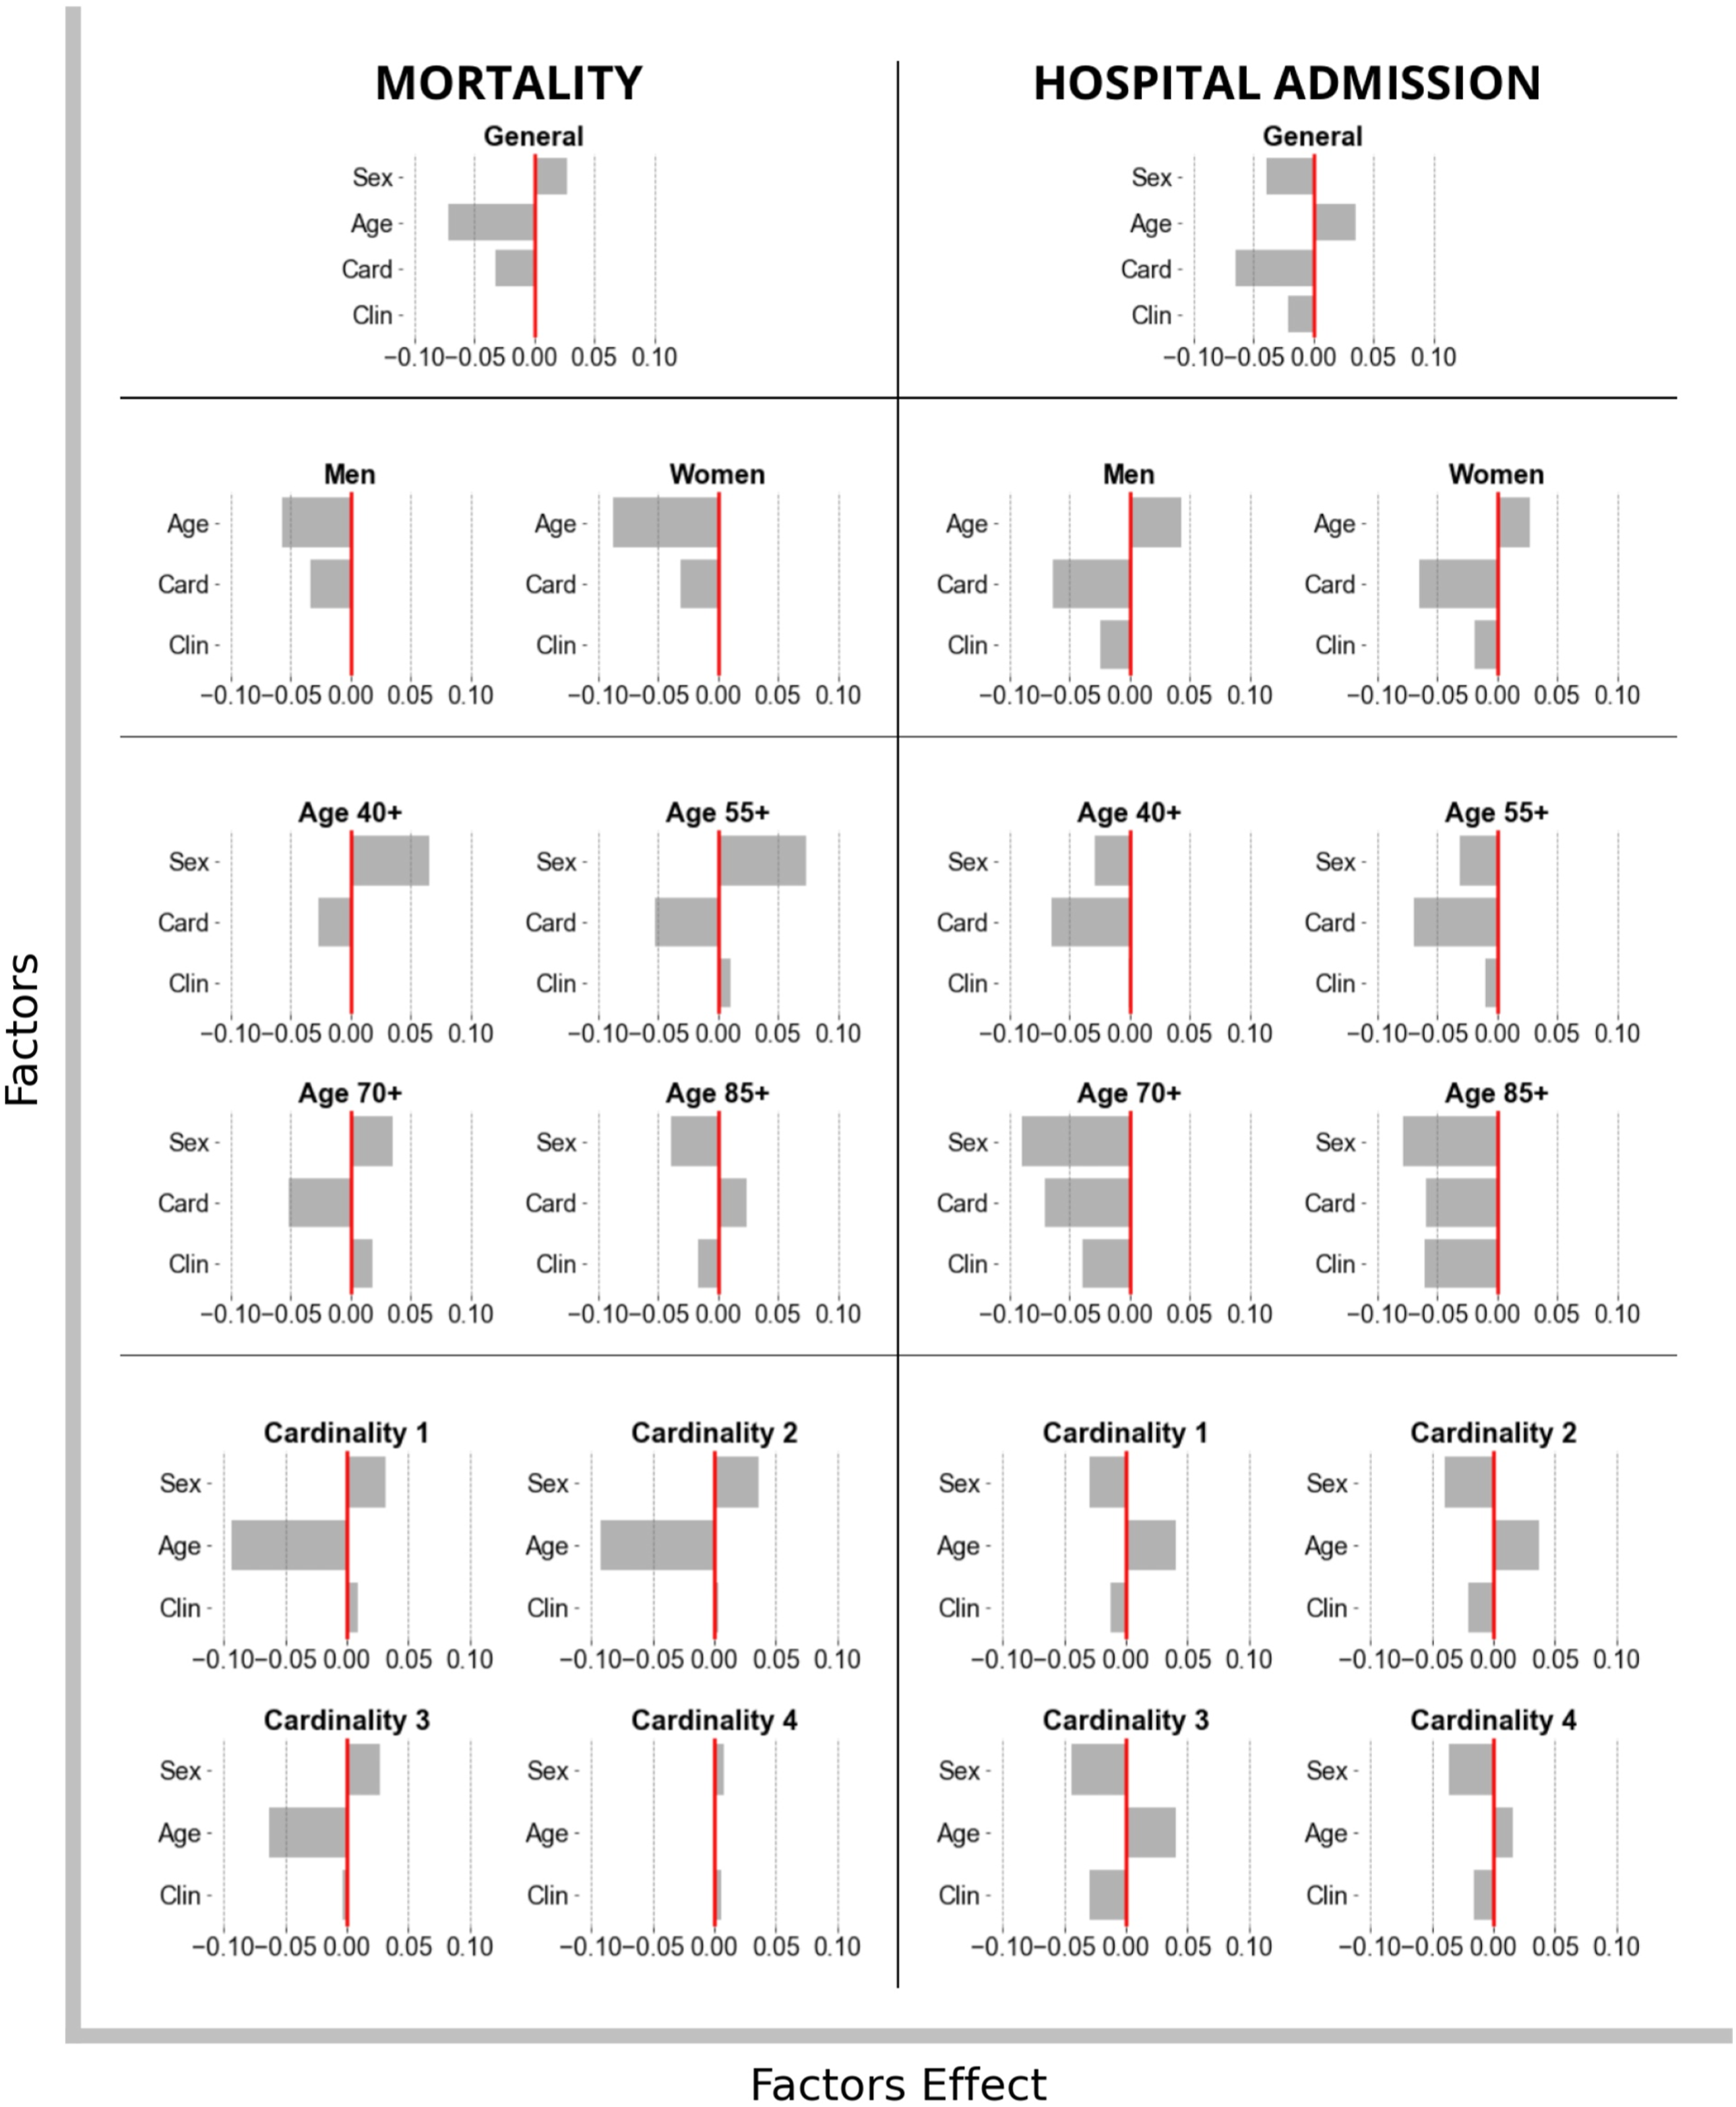
In general, accuracy for all-cause mortality KPI was negatively influenced by age and cardinality, but positively so for sex. The most relevant factors were age followed by comorbidity cardinality and sex, respectively. There was better accuracy in the models for young people, lower cardinality and women. Nevertheless, the number of features became relevant after introducing hospitalization KPI. Cardinality, features, and sex had a negative influence while age had a positive relation. Consequently, the model accuracy improved the lower the cardinality and the number of features for men and older people in general. The relevance order for hospitalization model accuracy was cardinality, age, number of features, and sex, respectively.
When the study was conditioned to sex, for all-cause mortality, the most relevant factor was age and then cardinality, despite cardinality’s being more relevant for men than for women in comparison to age. There was a negative relation for hospitalization with accuracy for cardinality and the number of features, but a positive relation for age in both sexes.
With respect to the different age ranges, for all-cause mortality, sex, number of features, and cardinality of the comorbidity group, all of them influenced, but to different degrees according to the age groups. Figures 5 and 6 are worth noting since the 85+ age group’s direction for cardinality, sex and features was different from those of the rest of the age groups. That notwithstanding, for hospitalization, sex, number of features, and cardinality of the comorbidity group, the influence differed according to age group over the mean accuracy hospitalization KPI. Interestingly, for the 40+ and 55+ age ranges, cardinality was the only relevant factor, and the greater the cardinality, the lower the accuracy. For the 70+ and 85+ age groups, however, women had a lower model accuracy which decreased the larger the number of features considered and the higher the cardinalities. Furthermore, no accuracy for the group with a cardinality of four was observed in contrast with groups that had cardinalities of 2 and 3, however, age shows a great negative relevance on the models’ accuracy mainly for women.
Finally, for hospitalization, sex, age range and number of features were conditioned to the cardinality of the group. Similar to the results for all-cause mortality, no factors were relevant to explain the models’ accuracy for the group with a cardinality of 4, even though they were present in those with cardinalities of 2 and 3.
Software applications
An application and a dashboard allow the exploitation of the estimated model, as explained below.
Mobile
The fast calculation of risk in an individual subject was obtained on a mobile app that has been developed. The first step was for the physician to select the sex, then the age-range, the set of diseases that establishes the comorbidity group to be studied, and finally, the values for the relevant clinical features. The application took 10 s to generate a report with general and specific KPI risks for the group and the individual patient. Furthermore, the physician could obtain the impact of each disease on hospitalization and mortality risk (see Supplementary Appendix S3: Figure 1).
Dashboard
The goal of the dashboard was to provide an easy and intuitive way of exploring the data, such as how the hospitalization and all-cause mortality KPIs changed across different comorbidity groups or clusters. The dashboard had a panel for each KPI. Each panel showed different charts displaying information related to the selected comorbidity group. First, bar charts displayed information about the sex and age distributions of the specific comorbidity cluster selected and the number of patients affected (Supplementary Appendix S3: Figure 2). Second, a chart displayed each cluster as a different data point, with the number of patients on the Y-axis and KPI rate on the X-axis. Once the user selected a set of up to four diseases, the chart would update to show both the comorbidity cluster of the selected diseases, as well as all the clusters that contain them. The user could also filter by age group and/or sex in order to see more specific data or zoom in/out (Supplementary Appendix S3: Figure 3). Finally, a diagram showed the relations between the different comorbidity clusters. The user could select a specific comorbidity of up to four diseases, and optionally filter by age group and/or sex (see Supplementary Appendix S3: Figure 4).
Discussion
In the present study, a system showing stratification of risk for hospitalization and all-cause mortality in chronic disease clusters has been developed which includes 19 chronic diseases, five age groups, and both sexes. The system is implemented in two stages. The first stage identifies the different significative comorbidity clusters for each sex, the age ranges, up to a cardinality of 4 diseases, and their respective KPIs. The second stage identifies the most relevant general clinical features for each cluster from a set of 8 and introduces prediction into the model. The system provides information about the risk of each cluster, the contribution of each disease, and the clinical features associated, thereby allowing the physicians to make individually-tailored decisions for treatment.
The present study has been conducted using the data from an EHR of the general population in a Mediterranean population (Valencian Community, Spain). The main limitation of the EHR, that is the level of quality and the diagnosis recorded, seems to be that less relevant chronic disease were considered. In two recent reviews, the prevalence of chronic health conditions was higher in medical records than in other data sources such as administrative data or even health surveys (HS)15,16, while the more symptomatic chronic diseases are more poorly recorded17,18.
The different approaches to obtain clinical risk groups have focused mainly on stratifying severity of comorbid diseases and getting information on potential costs, regardless of sex or age. Examples of the former were CIRS, ICED and Kaplan Index, while of the latter, ACGs, DRGs and HRGs. The procedure for group creation has differed depending on the objectives pursued and the kind of algorithm used.19,20 While one approach 21 has used an agglomerative hierarchical clustering method, dependent on the similarity considered for this aggregation, another automatically establishes the groups of comorbidities searching for similarities in the clinical measures of patients. 22 An unsupervised disease clustering technique based on a multidimensional non-lineal projection (UMAP) 23 has also been used. 24
The divisive hierarchical risk clustering of the present study uses a two-step approach to achieve the target as compared to the more general modularization that considers all the information in only one model. The two-step method permits creating specific models for each one of the comorbidity groups identified which also include only the clinical features required by the group. This method can save time because it evaluates only the clinical features needed for the corresponding group. The results show that the accuracy of the different models depends on sex, age range, the cardinality of the group and the relevant features specific for the group. Likewise, with in the same cluster, the clinical features are different for the two KPIs considered, risk of hospitalization and mortality.
The present method is also able to measure the dynamics of each cluster, which consists of obtaining all the different predictions for each one of the multidimensional explicative variable combinations observed in the group. As an example, Supplementary Appendix S1: Figure 1, shows a prediction model dynamic comparison between two comorbidity groups (stroke-diabetes-hypertension versus diabetes-atrial fibrillation-hypertension). In this example, there are more prediction risk dynamics in the diabetes-atrial fibrillation-hypertension comorbidity group than in the stroke-diabetes-hypertension one, and there is different variability in predictions between the two comorbidity groups.
The creation of divisive hierarchical groups permits an individual that belongs to a specific group to pertain as well to another of the more general relevant groups from which an individual comes. Moreover, the use of interpretable models like decision trees 13 also allows for their use as recommender systems. With these models, it is possible to obtain a specific location for a patient in the tree and know the clinical variables to enhance in order for a patient to improve their risk position within the group. Furthermore, it can help to know the new diseases which are likely to occur in a patient in order to improve the patient’s allocation into a more specific group. In addition, this methodology permits the discovery of conditioned knowledge in a natural way, something that could help physicians discard other relevant diseases that would get worse for the considered KPI. That notwithstanding, it allows different predictions for a patient that is in a sparsely populated group for which it has not been possible to obtain models.
Limitations and future research
Despite its strengths, the current method has limitations, though these can be improved in further studies. The divisive hierarchical approach implemented to obtain the different comorbidity groups creates a situation where the higher the cardinality, the lower the number of patients that belongs to the group. This sometimes results in a lower number of samples for model estimation in higher cardinality groups. Consequently, we excluded those with less than 51 subjects. Increasing the number of individuals and including more data from other EHR will make the high cardinality comorbidity groups more precise. Collecting more data will also increase the capacity to study more complex groups with a higher cardinality and, in the future, expand the number of diseases included into in the research.
The number of clinical parameters is not that large, although those included have demonstrated their impact on prognosis. Since it is possible to previously select the independent variable for each one of the comorbidity groups, having a more diverse set of clinical variables available would improve the results of the estimated models, providing the model with a gain in accuracy. Along with the number of clinical features, another relevant point is the temporal frame. Nowadays, assigning a corresponding value does not take into consideration the variability of each parameter, introducing bias into the assignment of variables with higher variability. A way to improve the problem could consist of the establishment of a dynamical time interval related to the natural variability of the clinical variable that is different for each one.
Finally, needs to be to take in account that important factors such as genetic factors, compliance with the medication, social determinants and others will jeopardize the risks obtained with the models.
Conclusion
The present study has developed a divisive hierarchical tree strategy for stratifying hospitalization and mortality risk into clusters of chronic diseases and their corresponding relevant clinical features. This methodology allows for getting closer to a specific patient model by conditioning the KPI estimations to the pertinent comorbidity group and the selected relevant explicative variable values for that group. The information obtained for a given patient is useful for intensifying treatment in order to reallocate the patient into a better risk subset in the corresponding comorbidity group. Likewise, the potential impact of a newly developed disease is observable. Furthermore, the software created can be launched over a big data cluster in a transparent way, thus increasing the computational power transparently and dynamically. In the near future, a case/control study will evaluate performance in terms of treatment selection and risk reduction.
Supplemental Material
Supplemental Material - Towards a personalized health care using a divisive hierarchical clustering approach for comorbidity and the prediction of conditioned group risks
Supplemental Material for Towards a personalized health care using a divisive hierarchical clustering approach for comorbidity and the prediction of conditioned group risks by J Ramón Navarro-Cerdán, Manuel Sánchez-Gomis, Patricia Pons, Santiago Gálvez-Settier, Francisco Valverde, Ana Ferrer-Albero, Inmaculada Saurí, Antonio Fernández and Josep Redon in Health Informatics Journal
Ethical Aproval
• Spanish Law 3/2018 (X-Country Law 3/2018). • The Committee for Ethics and Clinical Trials of the Hospital Clínico of Valencia approved the study (Registration Number: F-CE-Geva-15). • Informed consent was deemed not necessary by the Ethical Committee due to the characteristics and design of the study. • Study population and data collection: Valencian Community (X-Region).
Footnotes
Acknowledgements
We acknowledge the Health Authorities of the “Conselleria de Salud Universal” Generalitat Valenciana for allowing us to use the data.
Declaration of conflicting interests
The author(s) declared no potential conflicts of interest with respect to the research, authorship, and/or publication of this article.
Funding
The author(s) disclosed receipt of the following financial support for the research, authorship, and/or publication of this article: This study has received funding from the European Union’s Horizon 2020 research and innovation programme under BIGMEDILYTICS project under grant number (ICT-15-780495), Generalitat Valenciana - IVACE (IMAMCA/2023/11) and BigData@heart project under grant number (IMI2-FPP116074-2).
Supplemental Material
Supplemental material for this article is available online.
References
Supplementary Material
Please find the following supplemental material available below.
For Open Access articles published under a Creative Commons License, all supplemental material carries the same license as the article it is associated with.
For non-Open Access articles published, all supplemental material carries a non-exclusive license, and permission requests for re-use of supplemental material or any part of supplemental material shall be sent directly to the copyright owner as specified in the copyright notice associated with the article.