
Abstract
Calorie counting mobile apps claim to assist in weight management by helping users monitor their diets and track activity. This study assessed quality and effectiveness of popular calorie counting apps in weight management and behaviour change. Top 20 apps were selected from Google Play store and their quality was assessed using a 55-point scoring scale on attributes like standards used, content accuracy, user interface and sources of database. The mean (±SD (standard deviation)) quality score was 36.95 (±5.65). The calorie and activity recommendations were compared with standards and over 65 per cent apps over/underestimated calorie intake. To assess effectiveness, 60 young volunteers were recruited and divided into two groups. The intervention group (n = 30) was asked to use one of the top 3 apps for 8 weeks. Pre- and post-comparisons were made with the control group (n = 28). No significant difference was noted in anthropometry or food consumption. There was increasing trend (13.33%) in physical activity in the intervention group.
Introduction
Globally, the prevalence of obesity has increased from 28.8 to 36.9 per cent in men and from 29.8 to 38.0 per cent in women between 2008 and 2013. 1 Physical inactivity and nutritional transition along with increased consumption of refined carbohydrates, processed foods, change in the type and amount of fats has led to the increased prevalence of overweight and obesity in India over the past decade. 2 While on one hand proliferation of information and communication technologies (ICTs), more profusely that of mobile phones, is blamed in part for physical inactivity and associated lifestyle diseases, on the other, researchers have been increasingly documenting the use of mobile phones as Behavior Change Communication (BCC) tools for encouraging physical activity and healthy diets, fight depression, quit smoking and manage diabetes and other non-communicable diseases (NCDs). The advances in mobile technology have led to the concept of mobile-health (mHealth) and use of mobile phones as an important platform for the delivery of health communication interventions. Multiple studies have shown the successful use of mHealth in managing various health conditions. 3 , 4
With 220 million users, India ranks second in world smart phone market surpassing the US market. 5 Indian Council for Research on International Economic Relations has reported that 90 per cent of smartphone users use apps (mobile applications). 6 It was estimated that the number of mobile health applications available to consumers was more than 165,000 in 2015. 7 Thousands of calorie counting apps developed in various countries are available in the mobile play stores claiming to help in weight management. However, the number of studies that analysed their quality and effectiveness is very limited in developing countries, and no such study has been done in India. This study aimed at analysing the quality of the calorie counting apps to find out the effectiveness of globally available apps in Indian scenario and to get an understanding of their perceived usefulness among the users.
Material and methods
Sample apps collection
Calorie counting apps (n = 20) were searched using the keywords ‘calorie counting’ and ‘weight loss’ in the Google Play store in March 2016. The first 20 apps that were identified to meet the inclusion criteria, that is, calculating both calorie intake and expenditure, available in English and free to download were included. The apps were ranked according to their popularity in the app store, that is, number of downloads and user star ratings. The first three most popular apps (i.e. S Health® developed by Samsung electronics Co. Ltd; Calorie Counter – MyFitnessPal® developed by MyFitnessPal, Inc; and Calorie Counter developed by FatSecret®) were selected for the first phase of the study considering that apps with higher user ratings and number of downloads are more likely to be downloaded by the users. The effectiveness and user perceptions of these apps were noted. In the second phase, the quality of information provided by all 20 apps was examined.
Study design
To assess the effectiveness and user’s perception about the apps, a prospective controlled trial was designed.
Participants and recruitment
Participants were approached by snowball sampling method. Apparently healthy, young adults of both sexes (18–45 years), with a body mass index (BMI) of 23 kg/m2 or above, willing to reduce weight but not undergoing weight loss treatment were recruited from a campus community of a south Indian city, Hyderabad. Participants (n = 58) were randomised into intervention (n = 30) and control group (n = 28). When compared at baseline, the groups were found to be comparable in terms of age, sex, BMI and physical activity.
Written informed consent was obtained from all participants as per the guidelines of Institutional Ethical Committee of National Institute of Nutrition (ICMR).
Data collection
Anthropometric measurements like height, weight and waist-hip circumference were measured and BMI was calculated at baseline and endline (8 weeks), using standardised equipments. A pre-coded closed ended questionnaire was developed, and after content validation by a group of experts and pretesting, it was used to collect data from the study subjects. The questionnaire was used to obtain information about socio-economic details, mobile phone usage, Internet usage, food frequency of a month, physical activity and lifestyle. In addition, questions related to experience and feedback, perceived usefulness/non-usefulness of the apps and deterrents of usage of the apps were included in the post-intervention questionnaire.
The control group followed their routine lifestyle while the intervention group was asked to select and use any one of the top three popular apps (S Health® developed by Samsung electronics Co. Ltd; Calorie Counter – MyFitnessPal® developed by MyFitnessPal, Inc; or Calorie Counter developed by FatSecret®). Instead of asking the participants to use the ‘good quality’ apps as per our assessment in the study, they were asked to choose from the most popular apps in the app store, since user ratings and number of downloads are used by general users as a measure of quality. The participants were explained about the usage of the apps but not informed about the ranking or quality of the apps. Participants were asked to track their food intake and physical activity on a regular basis in the app of their choice for a period 8 weeks. At the end of the study, the records of food intake and physical activity were collected from their respective app data history.
Data analysis
The data were entered in excel sheet, checked for consistency and analysed using SPSS® for Windows, version 19.00 (IBM, Chicago, USA). Descriptive statistical percentages, frequency distribution, cross tabulations, regression analysis, chi-square test and Mann–Whitney’s test were performed. The significance of association between variables was assessed at 95 per cent confidence interval (p ⩽ 0.05).
Development of scoring scale
Since there are no reference standards for assessment of app quality, a scoring scale was developed in reference to the pro forma developed by Gan and Allman-Farinelli 8 for quality assessment of mobile applications. This pro forma is based on guidelines and references laid by scientific bodies of Australia. Some researchers have developed context-specific scales based on this. 9 , 10 Similarly, a scale was developed in the current study by modifying the quality assessment features and using Indian references as standards to suit Indian context.
The scale consisted of 55 points, out of which 26 points were allotted for various aspects of scientific information, 5 points for inclusion of cognitive behavioural therapy, 11 points for content accuracy, 11 points for inclusion of technological features and 2 points for source of contents. All the apps were downloaded and reviewed onto a smartphone device running Android version 4.4.4 KTU84P. The apps were awarded with a score of ‘1’ for possessing each quality and ‘0’ for not possessing it (Table 1).
Assessment of quality of calorie counting apps using summarised scoring scale.
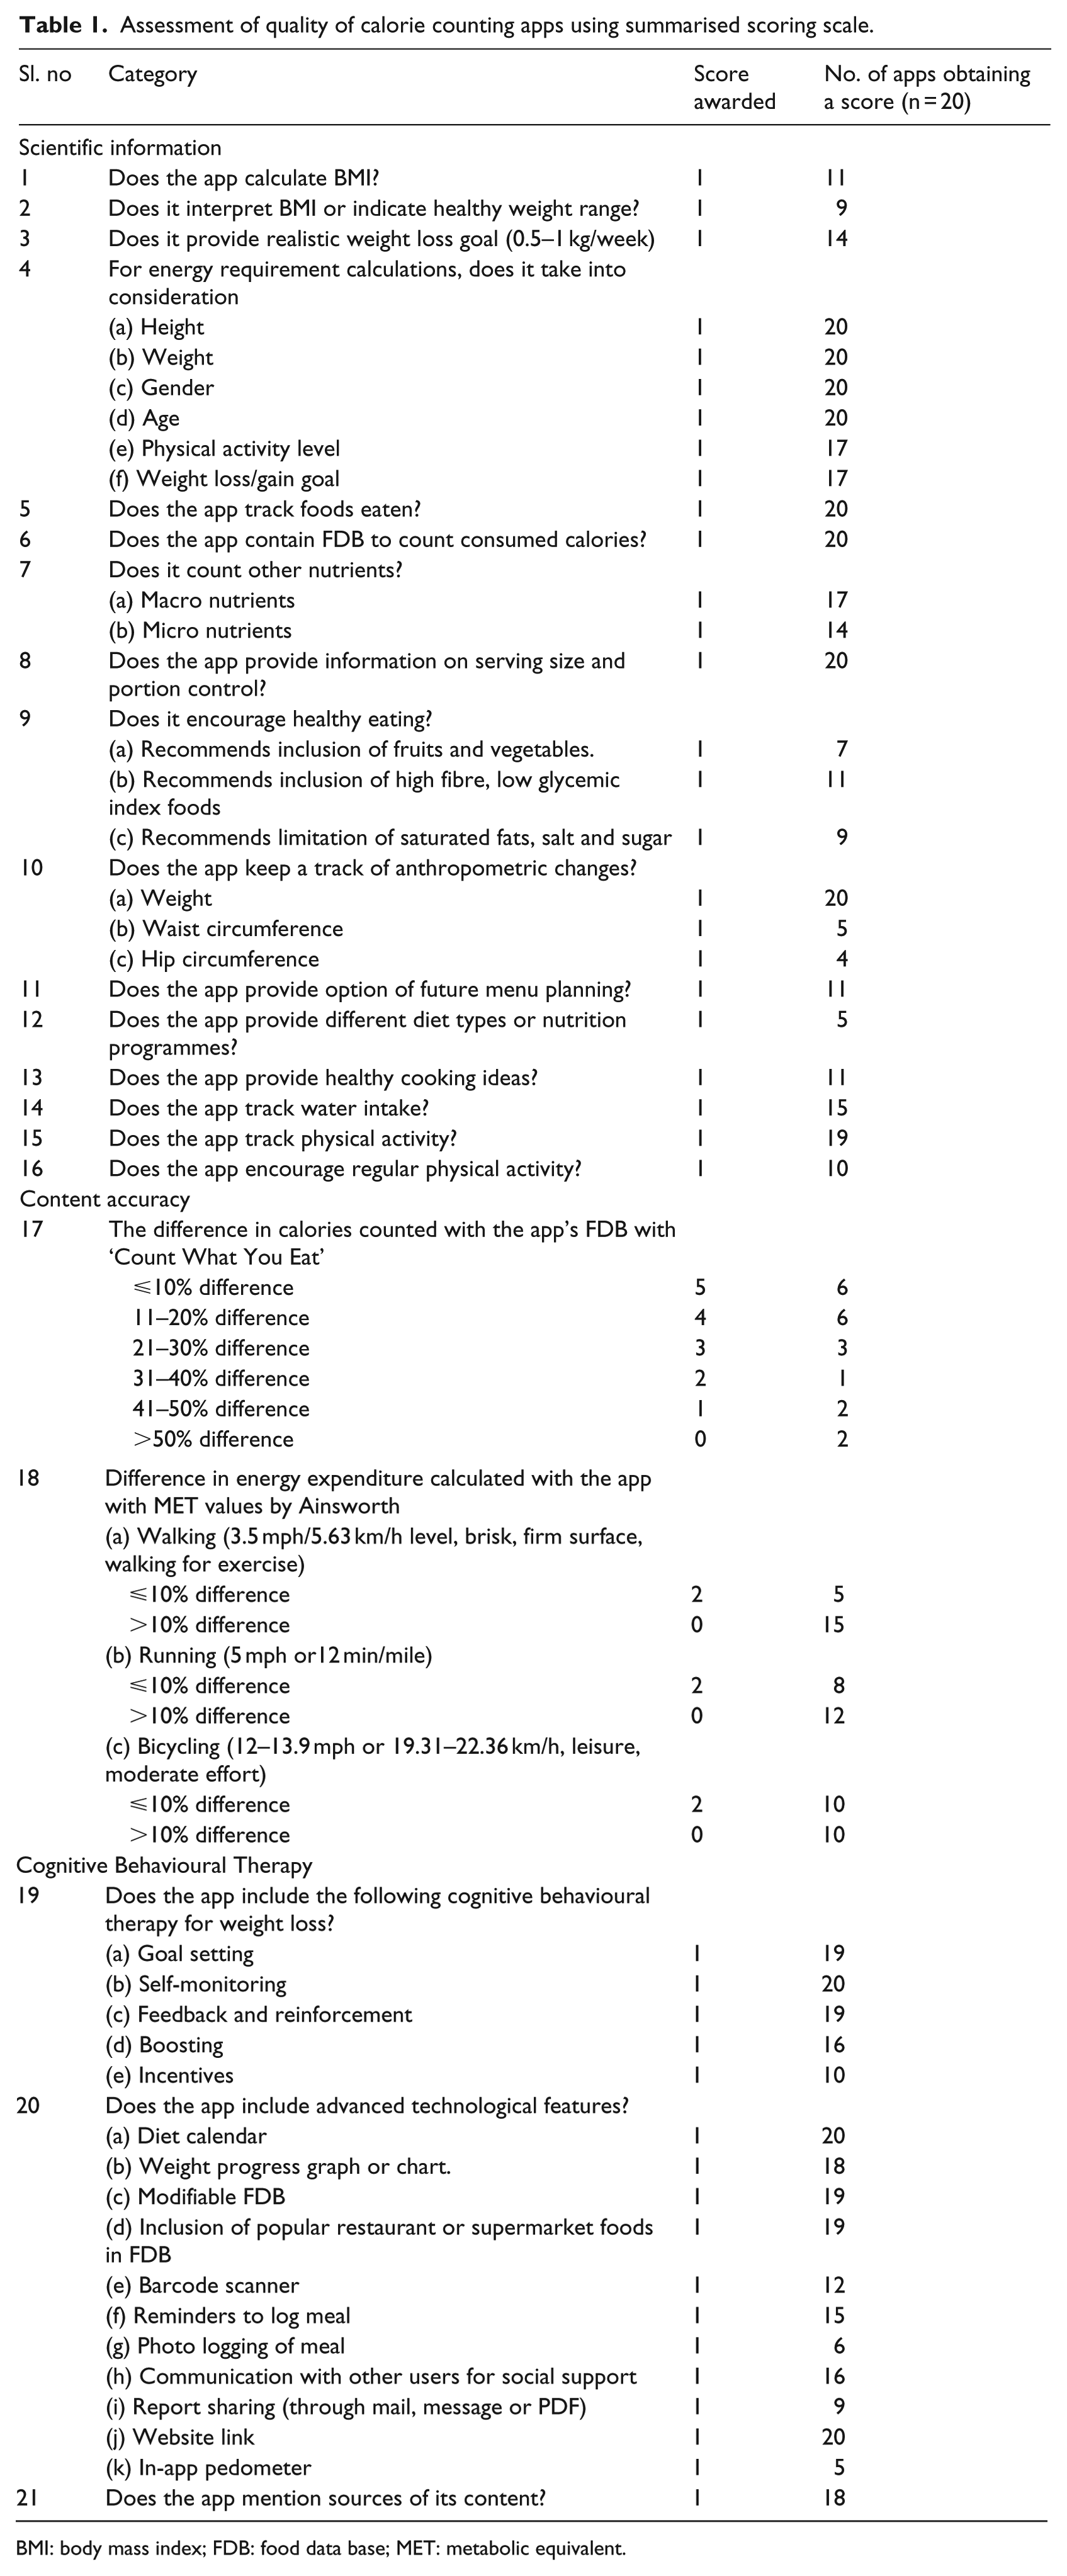
BMI: body mass index; FDB: food data base; MET: metabolic equivalent.
Comparison of calorific information provided by the apps
The internal food data base (FDB) of the apps consists of wide range of food items and provides their nutritional content. The FDB of each app was compared with an Indian standard ‘Count What You Eat’ by Pasricha, 11 which provides nutritive value of cooked Indian recipes based on ‘Nutritive Value of Indian Foods’ (1982) proposed by National Institute of Nutrition, Indian Council of Medical Research (ICMR).
The investigator entered the same items with exact weighed serving sizes in the apps possible, where the option was unavailable, serving sizes were entered in terms of common household measures or default serving sizes provided by the app. The deviation in calorie content from the standard book was noted in terms of percentage and given a score of maximum 5 points for a deviation of ⩽10 per cent, 4 for 11–20 per cent deviation and 0 points were given for a deviation of more than 50 per cent. Likewise, the calorie expenditure of some common exercises calculated by the apps was compared with the metabolic equivalent (MET) intensity values of those exercises by Ainsworth et al. 12
The apps were scored for all other categories included in the scoring scale by the investigator on the basis of features and information provided by individual app.
Results
Quality of the apps
Calorie Counter by CalorieCount.com® received the highest rank with an overall score of 48 out of 55. FitDay® received the lowest score of 23. The mean overall score of all apps was 36.95 (SD = ±5.65). The total score obtained by each app was converted to a percentage score and an app scoring ⩾70 per cent, that is, 38.5 points, was considered to be of ‘good quality’ as categorised in a study by Gan and Allman-Farinelli. 8 The most popular app, S Health® with 100 million downloads and user rating of 3.9 obtained a score of 36 in the study. The second most popular app, Calorie Counter – MyFitnessPal® with 10 million downloads and user rating of 4.6 stars had scored 46, while the third most popular app Calorie Counter developed by FatSecret® with 10 million downloads and user rating of 4.3 had obtained 31 points in the study. In terms of composite scoring, 13 out of 20 apps had a score below 70 per cent. Popularity of the apps in the app store was not significantly associated with their quality scores obtained in the study (R2 = 0.109, P = 0.153). Hence, most of the apps are of average quality and their popularity in the app store does not ensure a good quality (Figure 1).
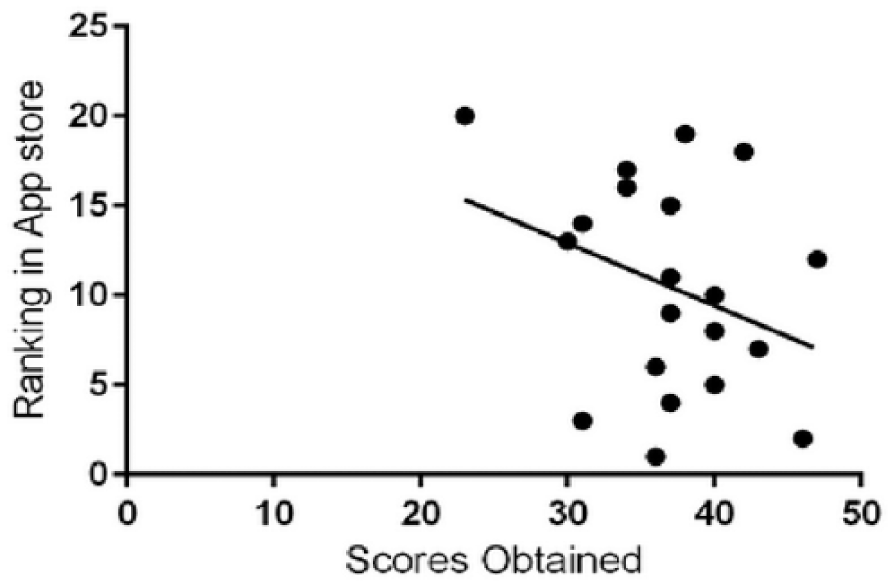
Relation between rank of the apps in the app store according to their popularity (depending on the number of downloads and then by user ratings) and total quality score obtained by them in the study.
BMI was not calculated by 9 out of 20 apps (45%). Unsafe weight loss goal such as more than 500 g–1 kg per week (National Institute of Health (NIH)) was advised by 30 per cent of the apps. Physical activity levels and weight loss goal which are important determinants of energy requirement (ICMR, 2010) were not considered by 15 per cent apps. There was a huge variation in calorie goal suggested by the apps selected in the study. For example, a 22-year-old female with sedentary lifestyle, with a height of 163 cm, weighing 66 kg, and a weight loss goal of 500 g/week, was suggested 20 different calorie requirements varying between 1191 and 1955 Kcal by 20 apps. Healthy eating practices like inclusion of fruits and vegetables, limiting saturated fatty acids and inclusion of high fibre fruits were encouraged by only eight apps (40%), and regular physical activity was encouraged by 50 per cent. All the apps kept track of weight change, but waist or hip circumferences were recorded by only five apps (25%). As the apps have been developed in different countries, many common Indian recipes were not available in FDB of some apps. The variation in the calorie counted by the FDB of different apps from the Indian standard is shown in Figure 2.
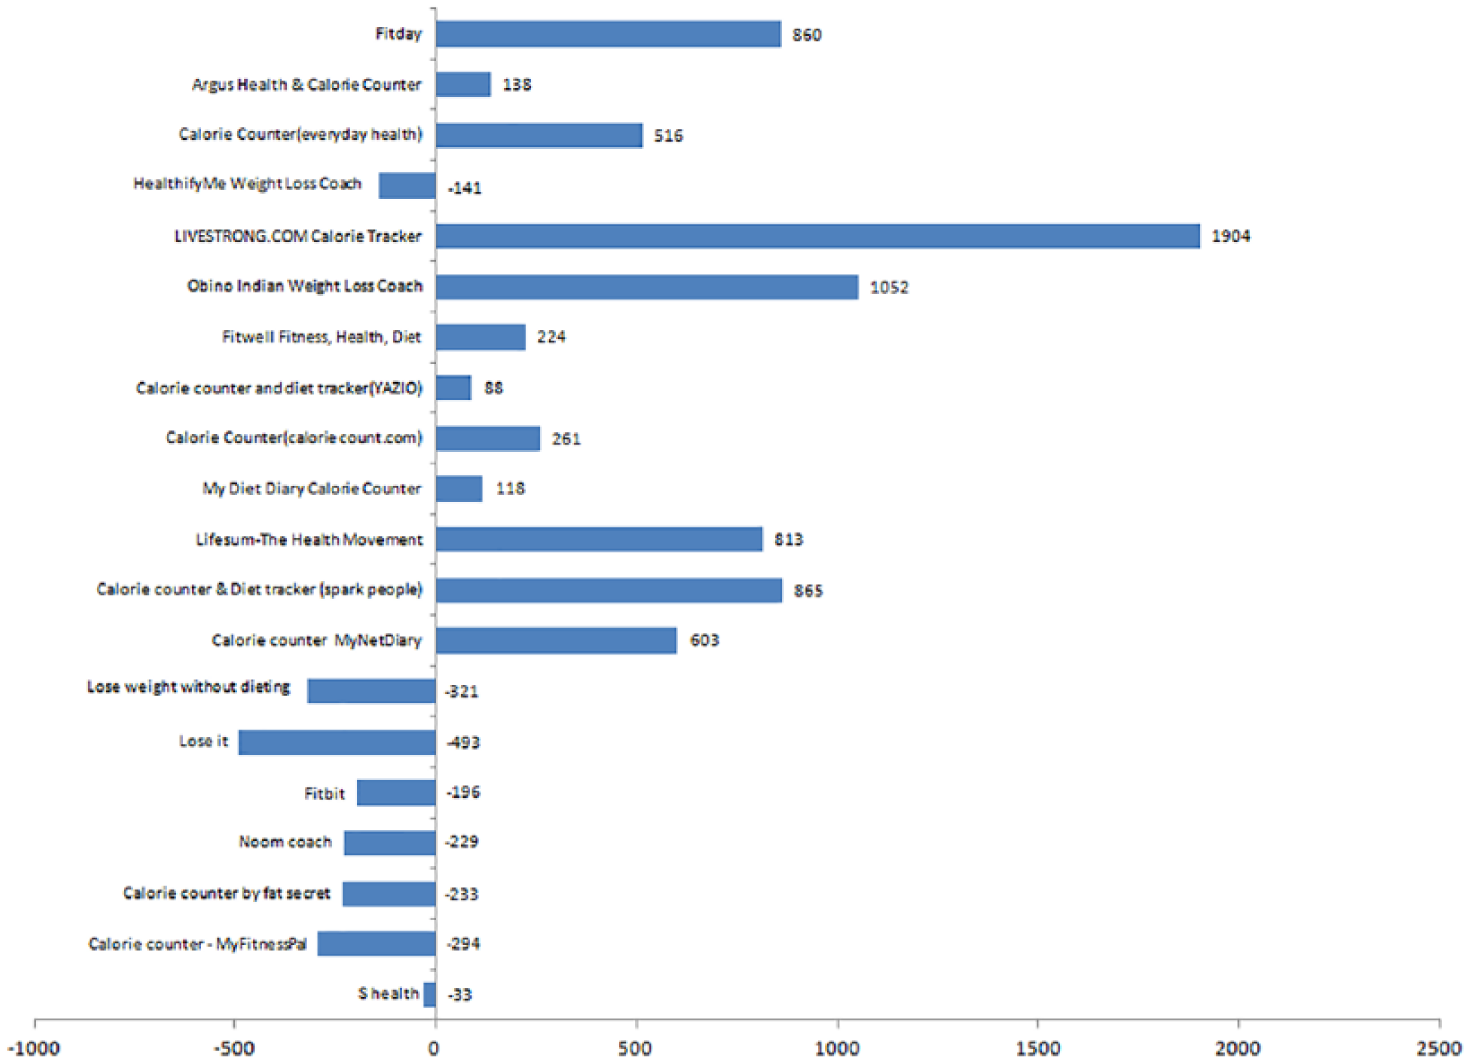
The difference between calorie estimation of a 2058 Kcal meal, consisting of some common Indian dishes counted with ‘Count What You Eat’ based on Nutritive Value of Indian Foods and that by the FDB of 20 apps included in the study. The same items with exact same weighed serving sizes were entered in each of the apps, where the exact serving sizes were not available, default serving sizes suggested by the apps were considered.
The FDB of S-Health® showed least variation (1.6%) from the Indian standards. Majority apps (65%) either over- or underestimated the calorie intake and only five apps showed less than 10 per cent variation in calorie expenditure when compared to MET values suggested by Ainsworth et al. 12 (Figure 3).
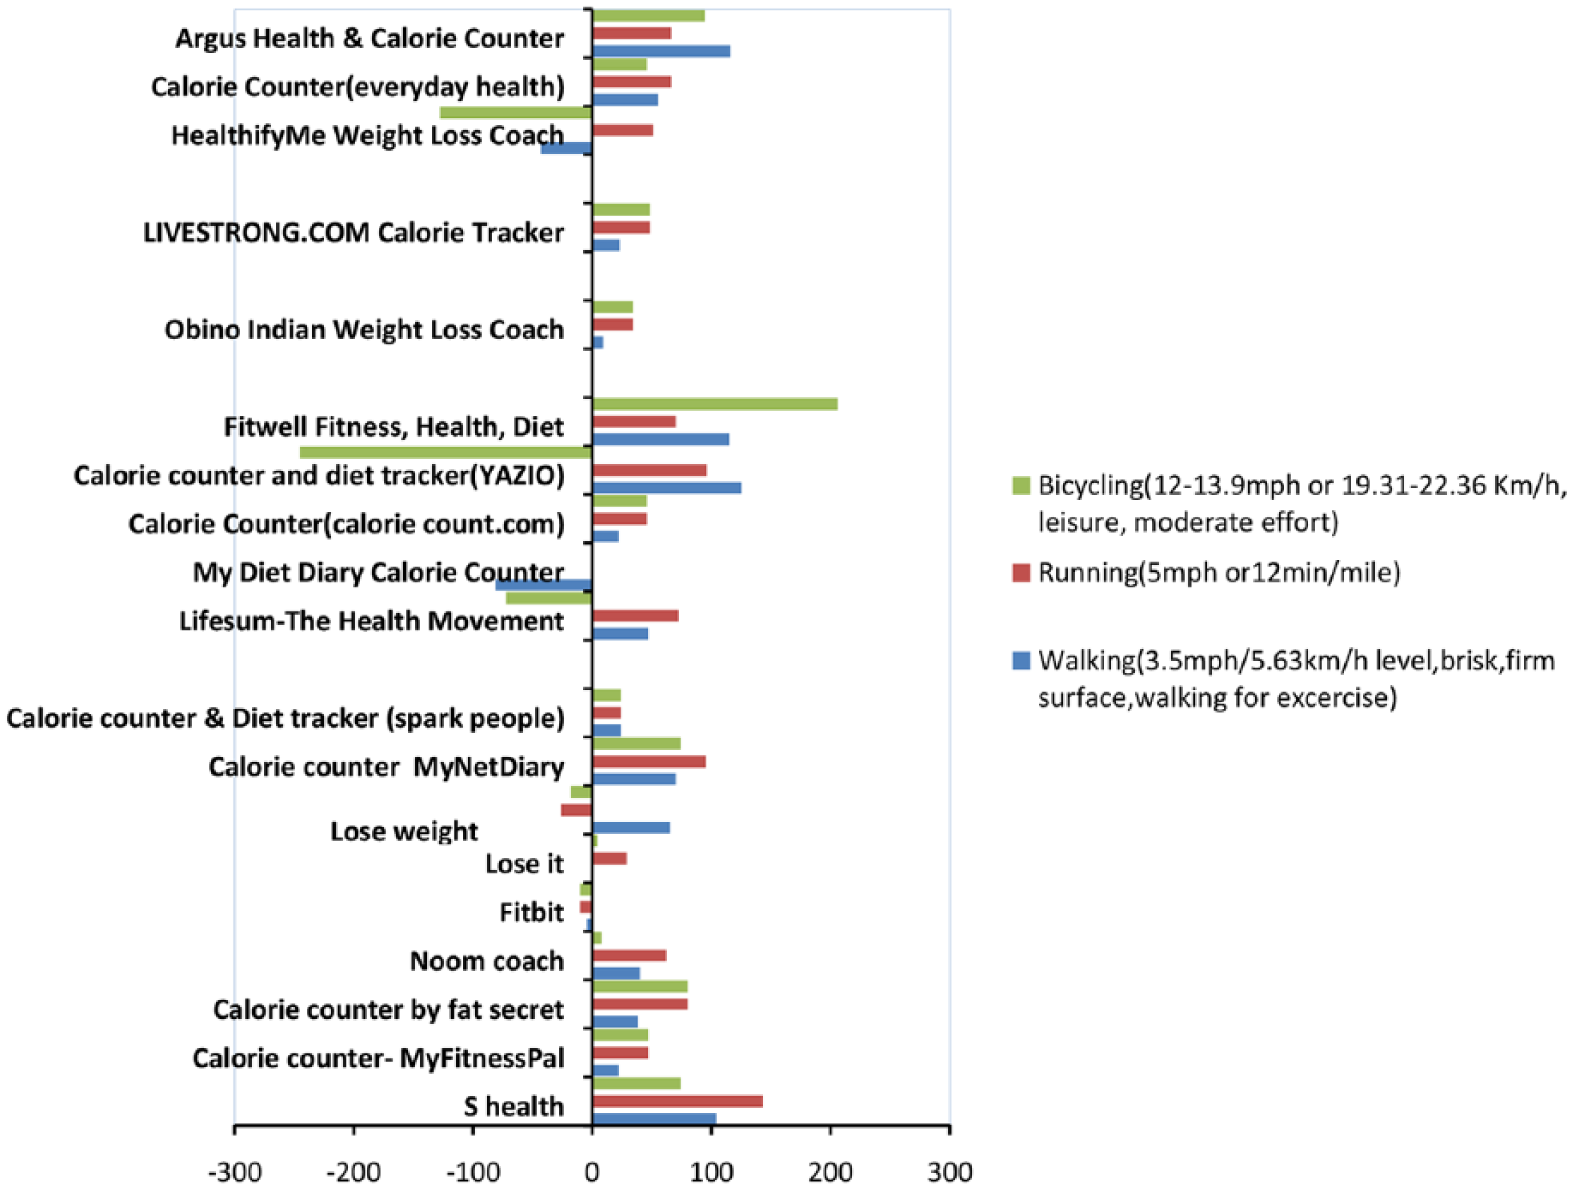
Difference between calorie expenditure estimation by the 20 apps included in the study and MET values by Ainsworth multiplied by duration of exercises. Same duration of exercises were entered in each app.
Effectiveness of calorie counting apps
Demographic profile of the subjects
All the participants were between 18 and 45 years of age. They (n = 58) were divided randomly in two groups: intervention and control group with 30 members in intervention and 28 members in control group. There were 11 men and 19 women in the intervention group while there were 15 men and 13 women in the control group. All the participants in the study had a BMI of above 23 (World Health Organization (WHO) cut-off for Asian for overweight) (Table 2).
Demographic details of participants.
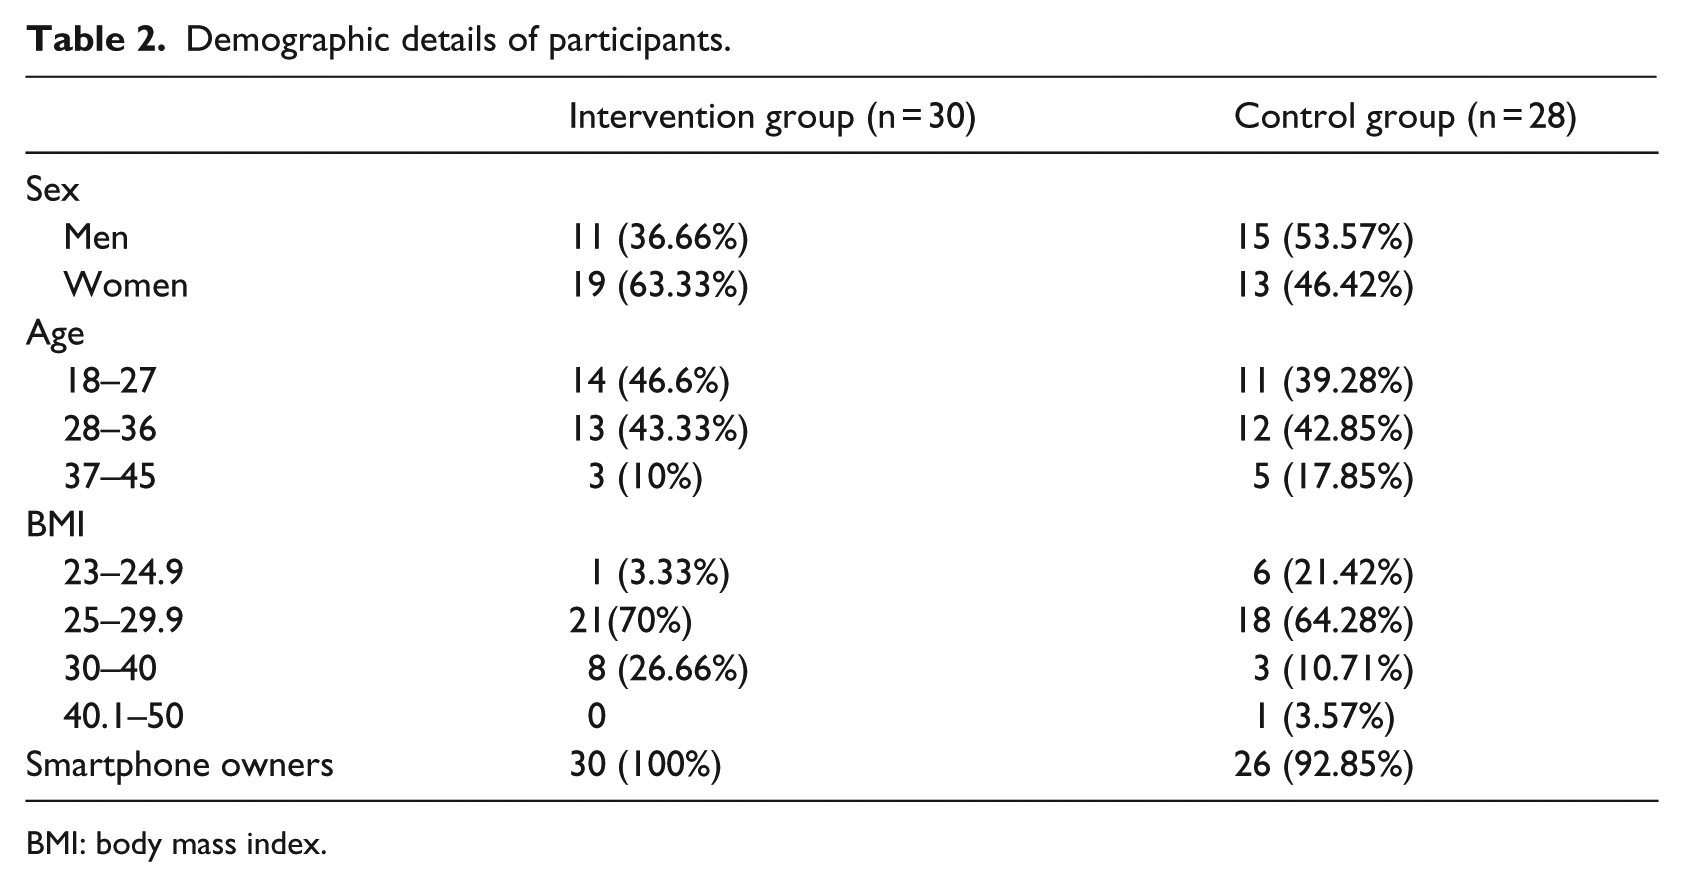
BMI: body mass index.
Changes in anthropometry
No significant anthropometric change was noted in both the groups at the end of intervention period. A mean weight change of 0.103 g (±1.83 g) was observed in the intervention group while the mean weight change in the control group was −0.248 g (±1.13 g). Changes in waist circumference were 0.247 cm (±1.88 cm) and −0.359 cm (±2.55 cm) in the intervention group and control group, respectively. Changes in hip circumference were −0.017 cm (±1.20 cm) in the intervention group and −0.344 cm (±1.46 cm) in the control group. None of the anthropometric changes in either group was statistically significant.
Changes in physical activity
An increasing trend of involvement in intentional physical activity was found in the intervention group. At baseline, 9 out of 30 (30%) members ‘never’ included intentional physical activity in their routine, it reduced to 5 (16.66%) and the number of people involved in ‘daily’ intentional physical activity increased from 10 (33.33%) to 13 (43.33%) at the end of the intervention period, while a decreasing trend of intentional physical activity was found in the control group (Figure 4).
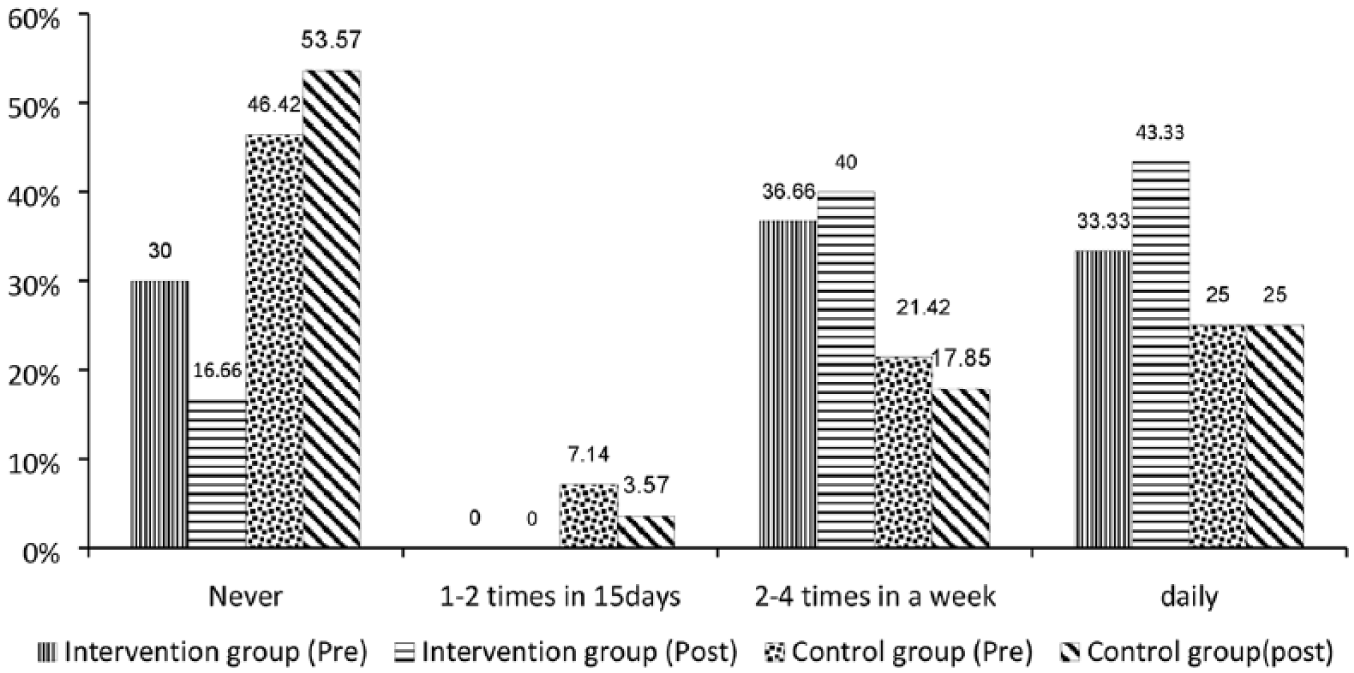
Comparison of changes in the participants’ (%) involvement in intentional physical activity in the intervention (n = 30) and control groups (n = 28) before and after the intervention period.
Automatic step counting feature of ‘Pedometer’ was perceived to be useful by 26 out of 30 people (86.66%). This might have motivated the participants of intervention group to be more physically active since it can automatically track user’s activities and does not require manual entry of data.
Changes in dietary pattern
Some reduction in consumption of High Fat Sugar Salt (HFSS) foods was observed in both the groups. While there was significant decrease in consumption of deep fried snacks (p = 0.04) and fats and oils (p = 0.003) in the control group, a decrease in consumption of sweets and savouries, deep fried snacks and fast foods was observed in the intervention group in comparison to the control group. Mann–Whitney test showed greater trend of reduction in consumption of sweets and savouries in intervention group. These changes might not be attributed to the usage of the app and may be because of evoked consciousness caused by inclusion in the study (Table 3).
Comparison of changes in dietary scores of experimental and control group after usage of calorie counting apps for 8 weeks.
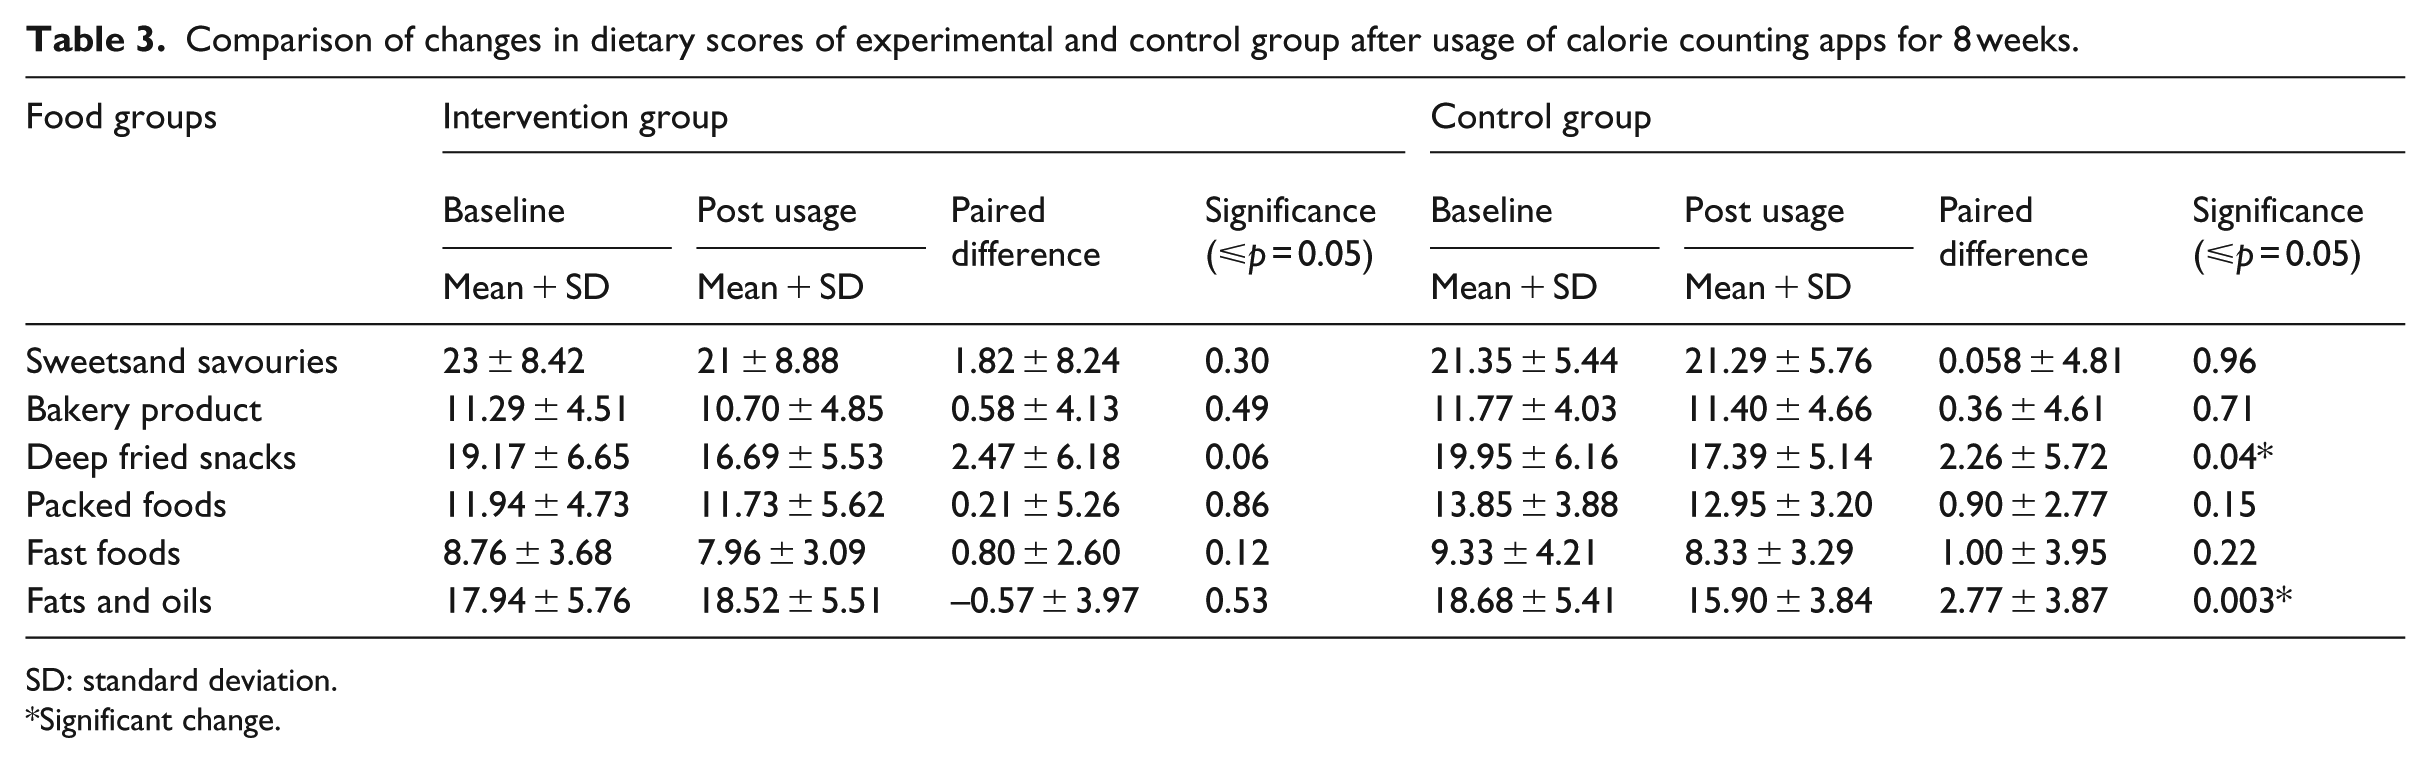
SD: standard deviation.
Significant change.
Users’ perceptions about the apps
Among the three given choices of apps, 23 out of 30 participants had selected My-FitnessPal®; the most common reason (66.6%) behind choosing an app was mentioned to be star ratings and user reviews in the app store.
Out of 60 days of study, the apps were used for maximum of 25–30 days by 13 (43.33%) participants, while the usage was further low for rest. The adherence to usage was found to be positively co-related with the level of desire for weight loss (r = 0.72). Twenty-one of 30 participants reported to be motivated to stay within their calorie limits by seeing the app data. While 100 per cent reported to be motivated to be ‘more active than before’. The major deterrent of usage among app users (n = 30) was lack of interest in manual entry of food consumption data, followed by unavailability of Internet (30%), since data entry in these apps was not possible when the apps were not connected to Internet. Some participants mentioned about confusion with portion sizes and unavailability of their consumed food in the app. Pedometer was the most interesting feature and meeting the goals motivated them to be more active.
Discussion
The effectiveness and feasibility of smart phone applications over paper diary or website methods in weight loss, maintenance of diet records and adherence has been shown in a study by Carter et al. 13 In this study, though the apps were well accepted by the participants as a motivational and self-monitoring tool, their effectiveness in bringing weight change or dietary pattern was limited. The limited effectiveness noted is mostly due to inappropriate calorie estimation and no dietary guidelines provided by the apps. Similarly, Wharton et al. 14 stated that a calorie counting app encourages self-monitoring but does not improve dietary quality for which continuous counselling and encouragement is required. The adherence to app usage was found to be directly associated with the self-motivation of weight loss or health consciousness. Similar results were put forward by Jaehee et al. 15 wherein the authors stated that ‘health consciousness’ is an important cognitive factor of continuation of usage of health apps. Another important determinant reported was health-app use efficacy. In our study, participants mentioned confusion with portion sizes, unavailability of data of commonly consumed foods or burden of manual entry as major deterrents for usage of the apps. The only positive impact seen was an increasing trend of physical activity which was probably an effect of motivation to be active because of the ‘pedometer’ feature. It does not require manual entry and can automatically track exercise of the users. The exponential advancement in technology in recent years has made the communication through mHealth user-friendly and easy. It has been accepted as an intervention tool to bring positive behavioural changes among users in various conditions like diabetes, pregnancy, depression, smoking cessation and so on. With the help of an app it becomes easy to store medical records, monitor changes over time and get personalised feedbacks and be motivated. A systematic review by Stephens and Allen 16 concluded that in all studies where technology interventions were supported by education or additional interventions, they had more beneficial impact in terms of decreasing physical inactivity or promoting weight reduction. The review also pointed out that potential usefulness of mHealth is being hampered by the quality of scientific information delivered through it. The quality of information provided showed variation and difference from recommendations. Evaluation of the quality of information is very essential to bring out the positive impact of this mode of effective communication. Setting up guidelines for development of useful mobile applications for a target audience in relevance to the country’s dietary guidelines and proper scientific information is necessary. The success of calorie counting apps depends on self-monitoring by regular entry of data. However, the two major deterrents of usage of the apps – manual entry of data which was perceived to be a burden and unavailability of Internet connectivity – could hamper the motivation for self-monitoring. Inclusion of easier ways to enter consumption data through advanced technological features such as photo logging of meals and ‘offline’ functioning may help overcome these problems to an extent. It is essential to follow an interdisciplinary scientific approach to improve the quality of information along with advanced technology for mHealth to be used as a standalone tool of BCC. This study certainly is an important contribution to the existing body of knowledge especially in the context of limited studies in the Indian context, but points at the need for large-scale studies to test similar applications to address trending obesogenic behaviours.
Study limitations
Since the sample size in this study was small, results cannot be generalised. The intervention period of 8 weeks might not have been enough for bringing out perceptible changes in the anthropometric measures. The food frequency taken for a month might have given rise to some reporting errors, but memory problems are inherent limitation of all food recall methods. The inconsistent usage of the apps by the participants, irregular data entry and inaccurate calorie estimation by different apps might also be the possible reasons for the limited effect of the apps in the intervention group. The internal FDBs of the apps were being compared with an Indian standard, 11 which is the only Indian reference that provides nutritive values of cooked foods and was based on the available food composition data from the National Institute of Nutrition, India. The latest version of Indian Food Composition Tables (IFCT) was yet to be published at the time of the study; however, even this database provides nutritive values of raw foods only.
Conclusion
The 55-point scoring scale developed and used in the study is a contribution that can be used as a tool for assessing the quality of such apps in future studies. The choice of app should be made intelligently by the users since these are being developed in different countries. The nutritional recommendations, FDB and serving sizes vary from country to country. Usage of an app of foreign origin might not have the same impact on the users from some other country. A good quality calorie counting app based on national guidelines and culturally relevant FDB for the target audience, proper scientific information and ease of data entry may be considered as feasible but does not seem to be a good stand-alone tool for nutrition communication or lifestyle modification and should be supplemented with other behaviour interventions for improved impact.
Footnotes
Acknowledgements
The authors are grateful to the National Institute of Nutrition (NIN), Hyderabad, for supporting this study. They are thankful to all the participants of the study for their co-operation. Technical support provided by Mr. Hrusikesh Panda, Technical Assistant, NIN, is gratefully acknowledged.
Author contributions
P.B. was involved in development of the study protocol, data collection and manuscript preparation; V.V.R.M. provided the statistical design and supported in data analysis; D.K. helped in preparation of the questionnaire and interpreting the data and G.M.S.R. was the study supervisor and responsible for study protocol development, interpretation of results and contributed to manuscript preparation.
Declaration of conflicting interests
The author(s) declared no potential conflicts of interest with respect to the research, authorship, and/or publication of this article.
Funding
The author(s) received no financial support for the research, authorship, and/or publication of this article.