
Abstract
Although mobile applications bring potential benefits of metabolic control for patients with diabetes, their effect on glycemic fluctuation has been less widely explored. The goal of this study was to utilize data from the Mobile Self-Monitoring of Blood Glucose System to obtain a picture of the metabolic progression. Twenty-seven adults with type 2 diabetes mellitus were recruited to receive a mobile diabetes self-care system for a six-week period. The approach to the interpretation of glycemic control patterns, utilizes the following methods: 1) Graphical displays of the percentage of hyper-and-hypoglycemia episodes; 2) Pattern recognition of glycemic variability based on a simple equation involving both the standard deviation and the mean. Analytical results reveal that short-term usage of the developed system stabilizes the week-by-week glycemic fluctuations. Four categories were established to distinguish different patterns of patients’ glycemic variation. If patterns of glycemic control can be recognized or interpreted by newly designed mobile applications, then the collection and analysis of metabolic variation will greatly help both health care providers and patients in effective diabetes management.
Keywords
Introduction
Diabetes management is a difficult task for both the patients who must monitor their blood glucose levels and daily activities and the healthcare professionals involved in the management teams who recommend pharmacologic and lifestyle adjustments based on glycemic data. Task complexity stems from patients who need to find effective ways to stabilize daily glycemic status by keeping diet, medications, and exercise all working together while monitoring blood glucose. 1 Self-monitoring of blood glucose (SMBG) in patients undoubtedly is a critical factor toward either successful diabetes management or failed glycemic control. 2 Patients’ knowledge increases their engagement in active monitoring of blood glucose. Patients also need professional support and multiple strategies such as health technology to engage them in diabetes management.
In the digital era, mobile health technology (m-health) has intensively emerged over the last decade, bringing the dawn of a new era of diabetes management. 3 Promising functions embedded in mobile technology include nutrition information, calorie calculation, medication, and assisting the practice of patients’ SMBG.4–6 These promising functionalities have been studied in a vast amount of literature to prove that m-health has positive multidimensional outcomes including lifestyle modification and physiological parameters of metabolic control. 7 Nowadays, diabetic m-health technologies are being continually studied in order to find optimal designs which fit patients’ demands and professionals’ expectation with regard to glycemic analysis, effectiveness, and utility in real practice.3,8–10
Studies on the glycemic analysis and episodes of hypo- and hyperglycemia have been a rising interest of SMBG because the prevailing level of hemoglobin A1c (HbA1c) is not adequately reflecting blood glucose levels on a daily basis.11,12 The glycemic variability (GV) indicates the levels of oxidative stress, which is linked with glucose-mediated vascular damage,13,14 possibilities of diabetes complications and mortality, 14 and prediction of episodes of hyper- or hypoglycemia.15,16 Kovatchev et al. 17 performed promising work by classifying standard deviations (SDs) of SMBG into different risk types for hypoglycemia. SD is a statistical measure that is also used to quantify the amount of glycemic variation. 18 In addition, the quality of glycemic control can be measured simply by finding the percentages of glucose values falling within any specified range, 19 including the number of hypo or hyperglycemia episodes, mean blood glucose, and the SD of glycemic excursion. 20 In other words, GV quickly provides information about diet control and therapy outcomes to both patients and healthcare providers, thus enabling responsive adjustments. 21
Like traditional interventions, most of the studies of m-health technology also demonstrate the effect on glycemic control by decreasing “HbA1c” levels—an indication of individual’s 3-month average blood glucose. 13 In other words, patients as m-health technology users would recheck their HbA1c value in every 3-month period. During the period, using diabetes mobile technologies, patients get the results of their calorie intake or expenditure from entering dietary intake and physical activities. Besides that, social support and medication reminders can also be helpful for users under the assumption that patients have to take extra effort to use these functions. However, the contribution of m-health technology in blood glucose patterns in literature is limited.
Assessing GV and the quality of glycemic control is not new, but few studies describe blood glucose distribution provided by m-health technology. Understanding which patterns of blood glucose variation with mobile-based interventions are important can enable further refinement of m-health tools. In addition, this study aims to explore the GV and patterns in SMBG profiles of patients with diabetes during the use of a mobile diabetes self-care system (DSCS), so that health professionals can have a clear picture of which patient condition they are addressing.
Methods
Dataset source and selection of subjects
Data were derived from mobile DSCS database including 30 patients with type 2 diabetes recruited from the outpatient department of endocrinology and metabolism at three tertiary hospitals in Taiwan. Each outpatient department was asked to recruit 10 patients. The researchers screened potential subjects referred by endocrinologists to determine their eligibility. Eligible subjects were then asked whether they were willing to participate in the project. The inclusion criteria were as follows: (1) at least 20 years of age, (2) ability to read and write, (3) ability to use a mobile device, and (4) agree to regularly undergo blood glucose tests and record the data to the DSCS Support Application.
Subjects were excluded if they had severe vision or dexterity problems or if they had alcohol or drug abuse problems. A researcher then called the interested patients to schedule a research orientation visit, which included explanations of the study aims and process and the operation of mobile DSCS. Written consent was obtained from the subjects before enrollment in the study. A total of 30 diabetic patients were recruited as subjects. Overall, 27 patients were available for the final analysis of the SMBG data based on data entries; three patients were excluded in the final analysis because their SMBG profiles were incomplete.
The mobile DSCS
The mobile DSCS study is a multi-method project designed to assist patients managing their diabetes. The system consisted of a DSCS Service Center and a DSCS Support Application embedded in a mobile device. All subjects received at least 30-min face-to-face orientation in using the mobile DSCS and a set of instruction manuals for using the mobile DSCS Support Application, blood pressure meters, and glucometers. After 6 weeks of the study, the subjects met with the investigator and returned the devices and received complimentary diabetes self-care handbooks. The personal data in the mobile DSCS were further de-identified to keep it confidential in SMBG analysis and was labeled as subject 1, 2, and so on.
The design and evaluation of the DSCS project have been described in detail elsewhere,22,23 including the system development and the intervention effect measured using a questionnaire. The DSCS system has been found to increase knowledge and behavioral change, 23 and patients have positive attitude toward using the system. 22 The SMBG data of the project have not been addressed in depth elsewhere. As part of the project, this retrospective study focuses on the physiological measured component of the study, particularly SMBG data analysis.
Analysis of SMBG data
Blood glucose profiles were captured from the DSCS system in user mobile devices. The uploaded individual’s physiological data comprised pre- and post-prandial blood glucose, blood pressure, body weight, and body mass index (BMI). Group’s glycemic control was presented in graphical forms. The percentages of blood glucose values falling within three specified ranges (hyperglycemic, hypoglycemic, and normal) were presented in a bar chart.
GV is defined as the extent to which there is acute short-term fluctuation of blood glucose.18,24 A simple formula proposed by Dr Hirsch 18 was used to calculate the degree of GV—the SD of blood glucose values, or the square root of the variance, indicates whether glycemia is being controlled consistently or with drastic variations indicative of suboptimal disease management. Optimal variability of blood glucose is that three times of the SD of blood glucose should be less than the average blood glucose level (“SD × 3” < average). 18 For example, if the value of average blood glucose is 123 mg/dL, then the optimal GV is the SD of blood glucose, which is below 41. For the purpose of this article, a cross-table was used to obtain the pattern recognition of blood glucose data that shows different results of SD corresponding to the values of average blood glucose. From the cross-table, the pattern of GV was categorized into four classes (i.e. GV I, II, III, and IV; Table 1).
Patterns classified by mean with GV.
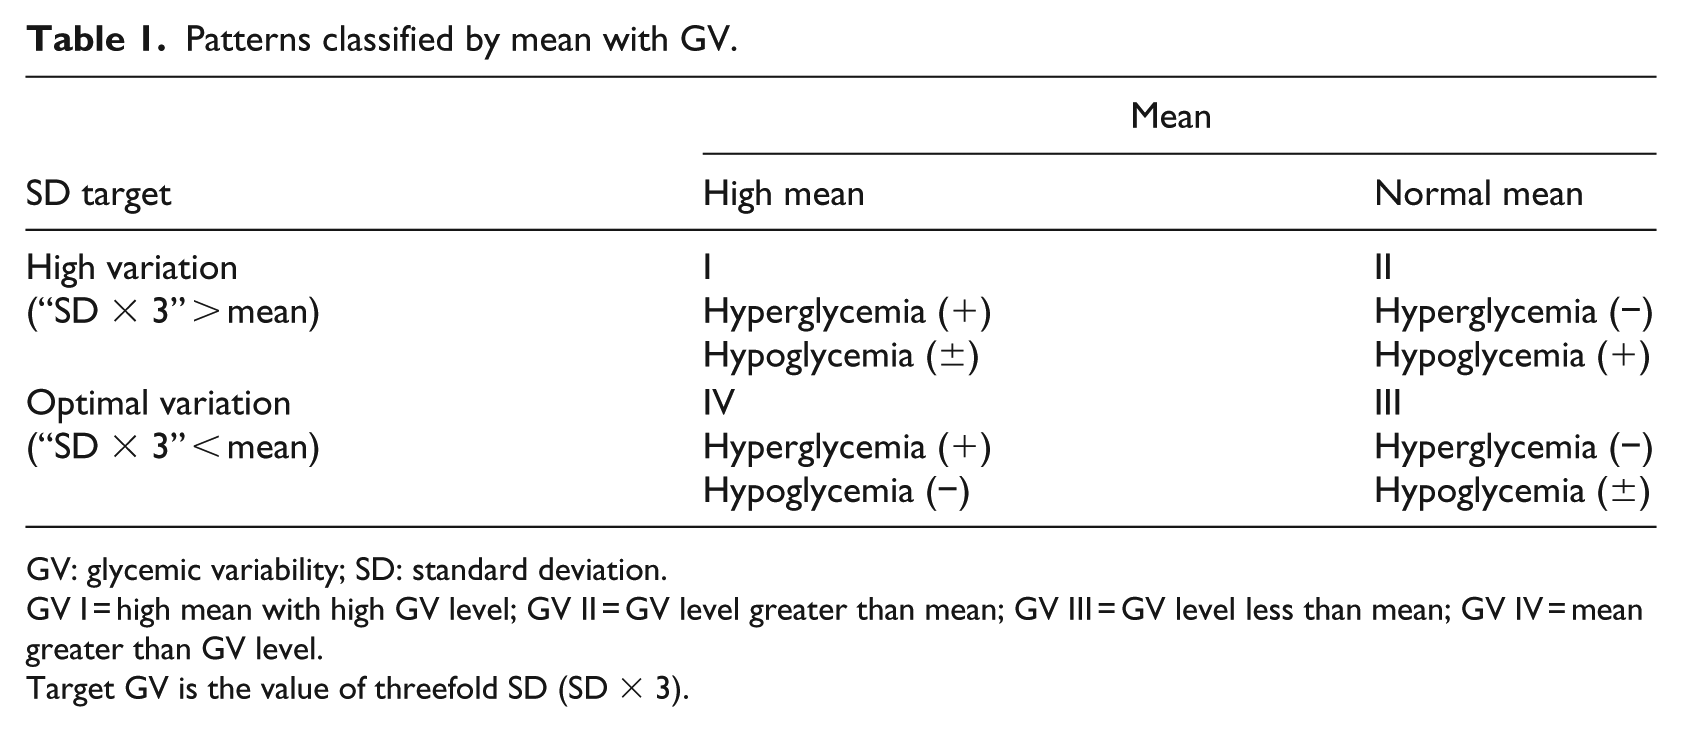
GV: glycemic variability; SD: standard deviation.
GV I = high mean with high GV level; GV II = GV level greater than mean; GV III = GV level less than mean; GV IV = mean greater than GV level.
Target GV is the value of threefold SD (SD × 3).
Results
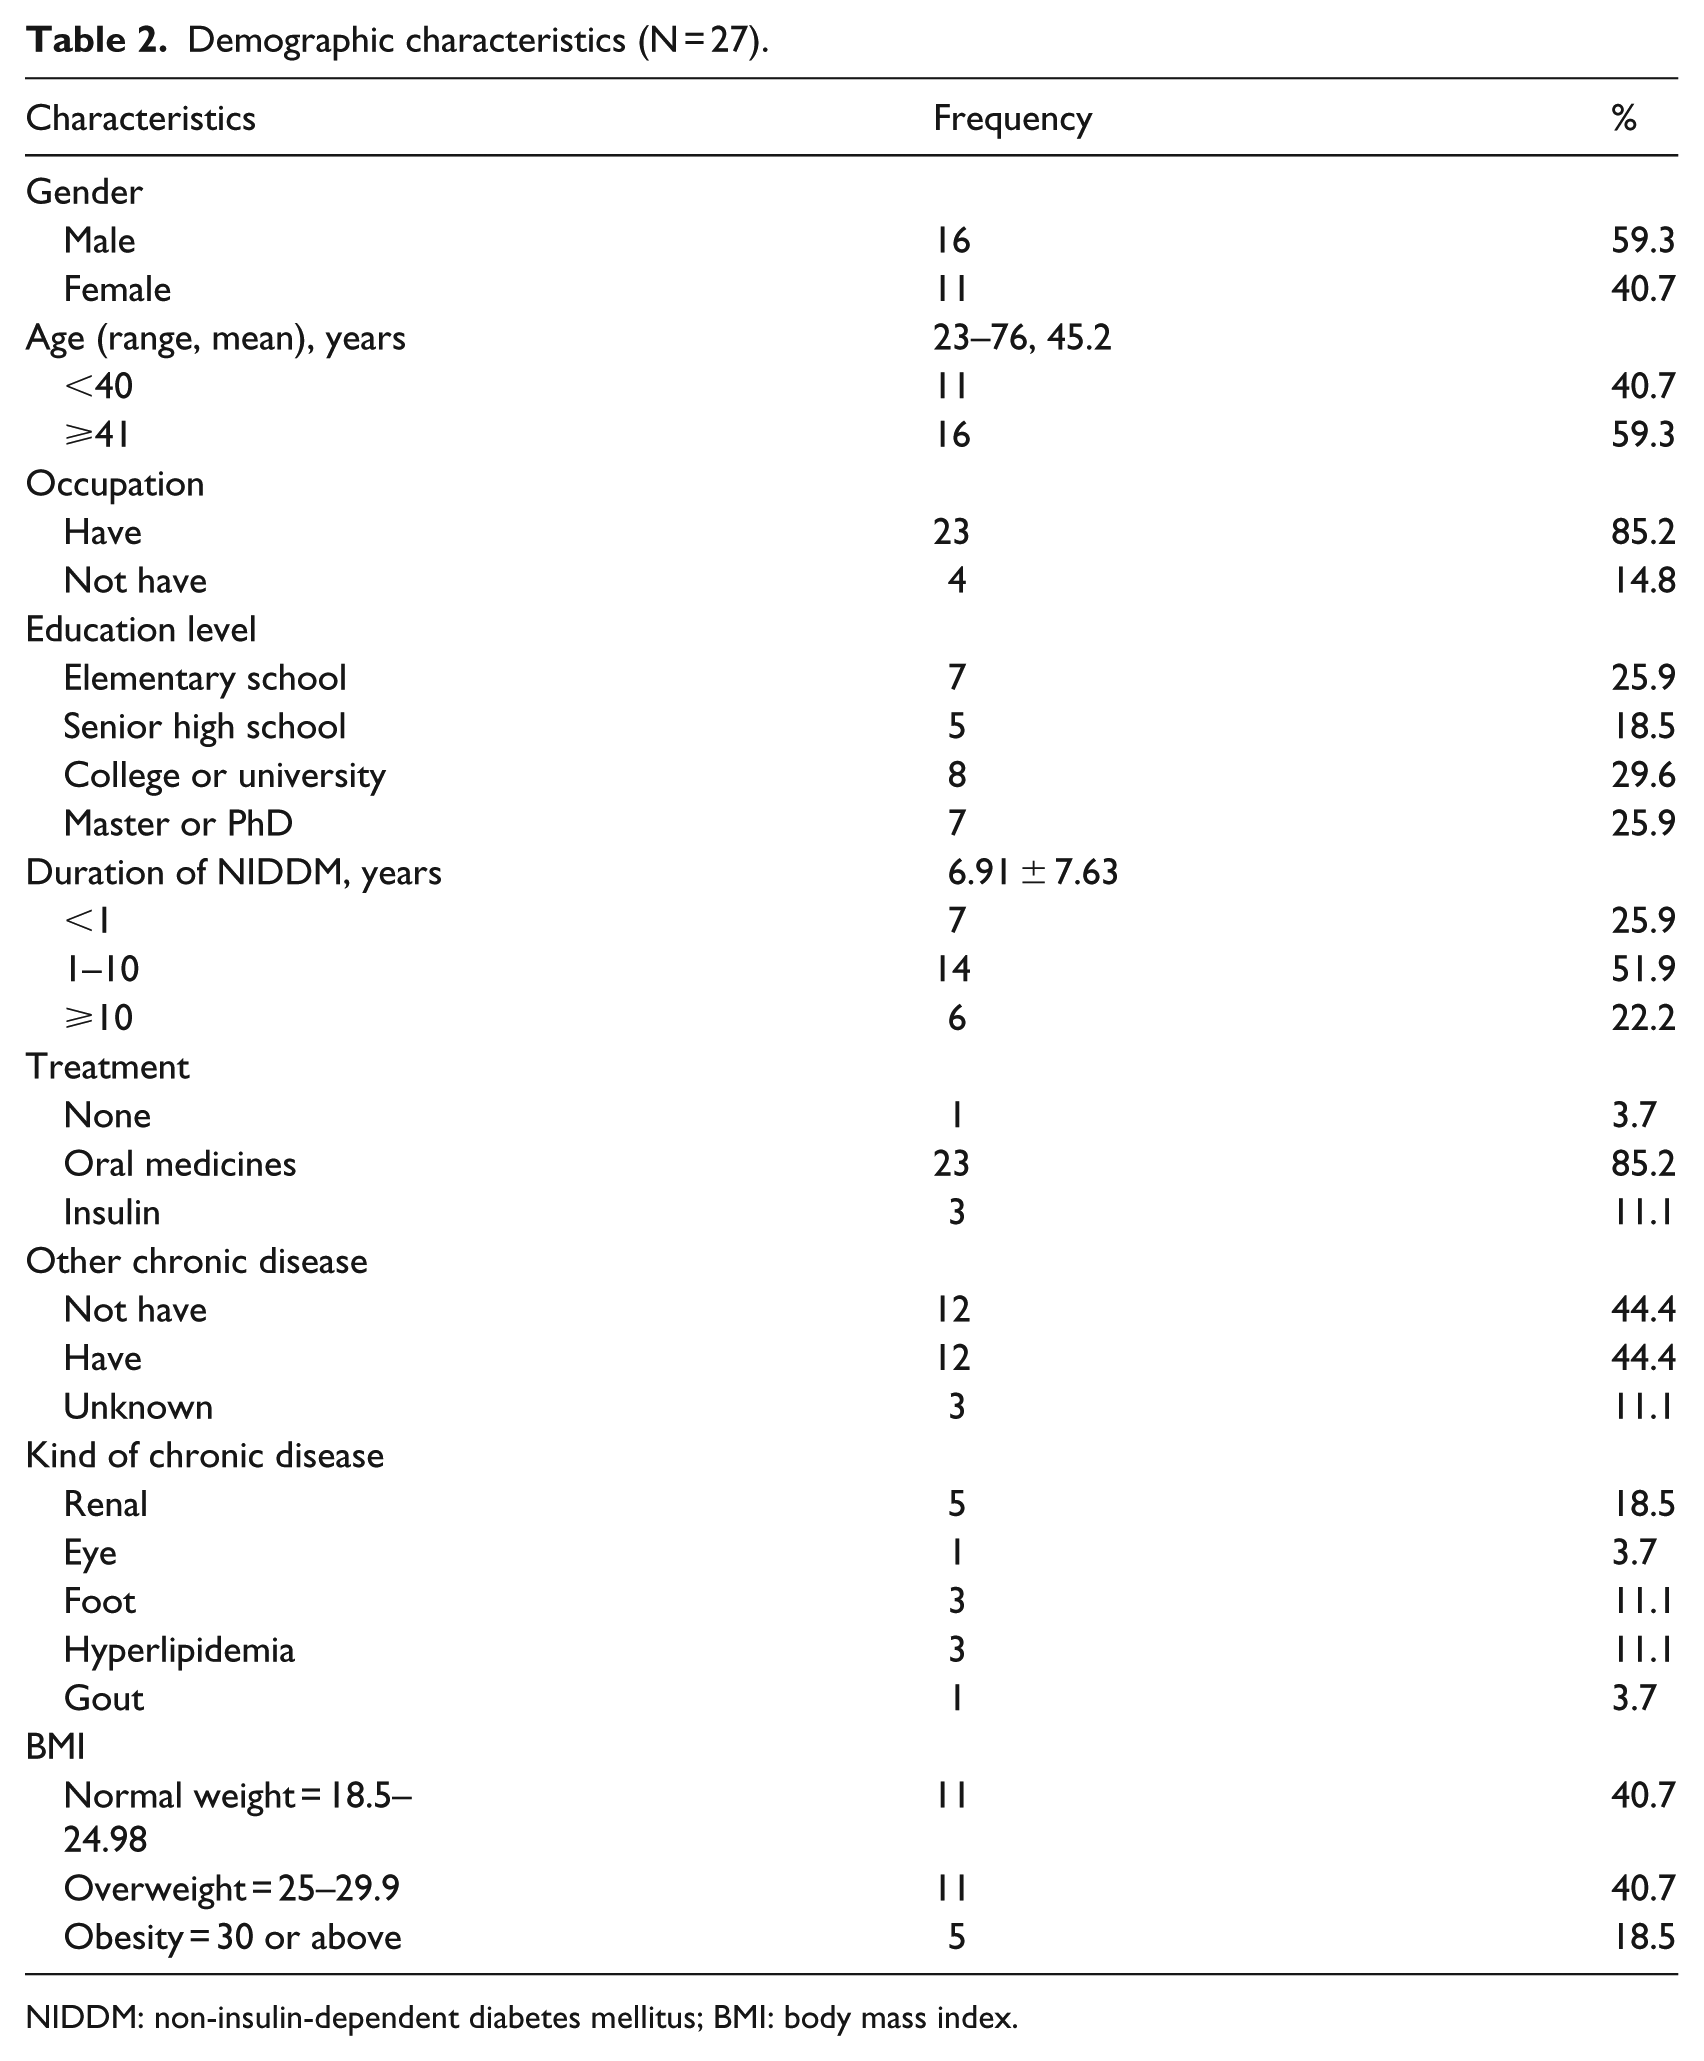
Demographic data of study subjects are presented in Table 2. Demographic characteristics of the subjects (N = 27) revealed that 59.3 percent (n = 16) were males, with their ages ranging from 23 to 76 (mean = 45.2) years, and 85.2 percent (n = 23) were employed. Notably, 55.5 percent (n = 15) of the subjects had at least a bachelor’s degree. The mean diabetes history duration was 6.87 ± 7.65 years, with 51.9 percent (n = 14) having diabetes from 1 to 10 years, 85.2 percent (n = 23) took oral medicines, and 44.4 percent (n = 12) also had other chronic diseases (i.e. renal, eye, foot, gout, and hyperlipidemia).
Demographic characteristics (N = 27).
NIDDM: non-insulin-dependent diabetes mellitus; BMI: body mass index.
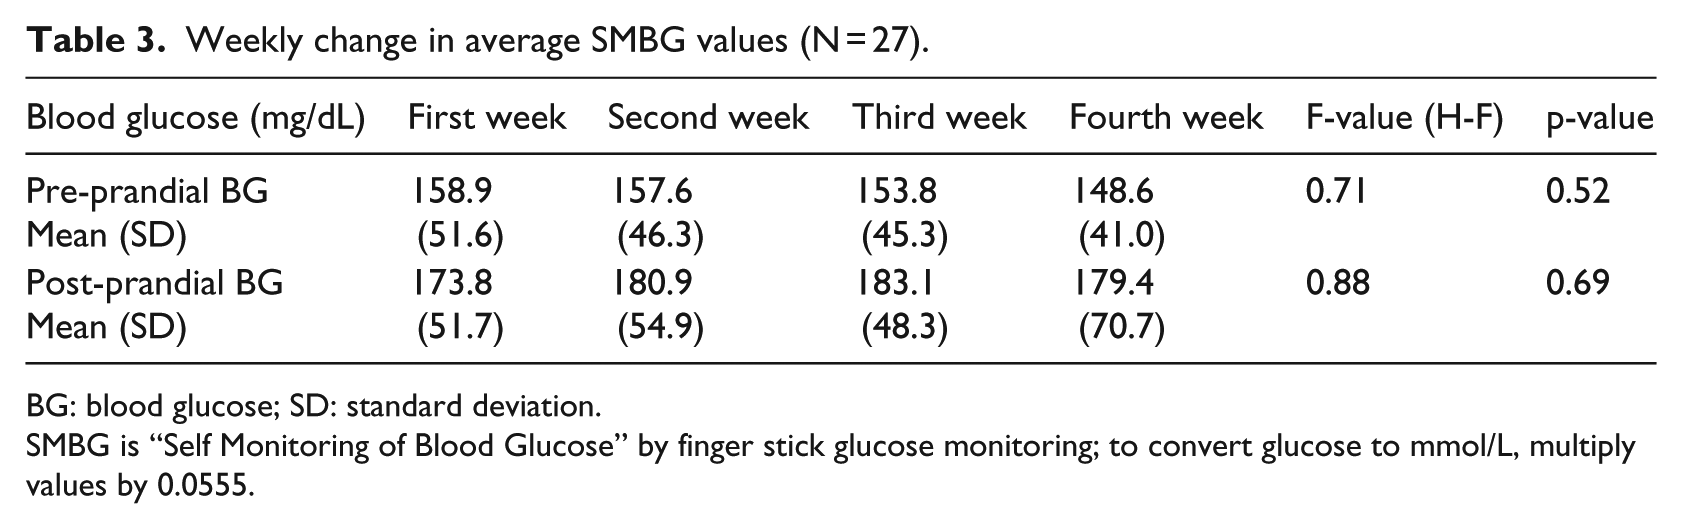
Week-to-week glycemic analytical results indicate that the mean pre-prandial blood glucose levels gradually decreased but the change was not significant during the intervention (Table 3). Figures 1 and 2 illustrate a graphical view of the distribution of pre- and post-prandial blood glucose values in Zones H to L. Zone H reveals variation in hyperglycemia values. The percentage of hypo- and hyperglycemia values outside the normal pre-prandial blood glucose range (the shaded area) fell from 70.8 percent (65.0% + 5.8%) to 48.0 percent over the 6-week period. The percentage of post-prandial hyperglycemia declined over the study period, being 59.6 percent at the beginning of the study, 43.2 percent after 4 weeks, and finally, 15.4 percent at the end of the study (Figures 3 and 4).
Weekly change in average SMBG values (N = 27).
BG: blood glucose; SD: standard deviation.
SMBG is “Self Monitoring of Blood Glucose” by finger stick glucose monitoring; to convert glucose to mmol/L, multiply values by 0.0555.
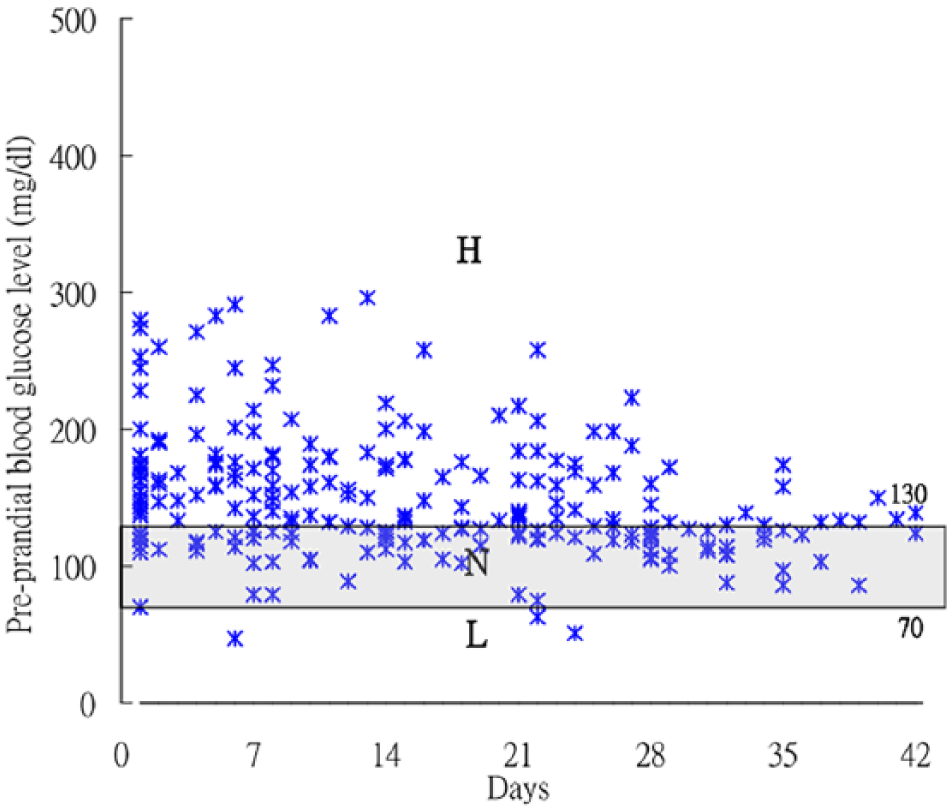
Scatter diagram of pre-prandial blood glucose values by subjects’ SMBG (mg/dL). All pre-prandial blood glucose of SMBG measures fell in Zones H to L, indicating that the slight hyperglycemia with hyperglycemia values were in Zone H (>130 mg/dL); SMBG values in the recommendation range (70–130 mg/dL) was in Zone N; and hypoglycemia values were in Zone L (<70 mg/dL). Recommendation range is set in accordance with the American Diabetes Association.
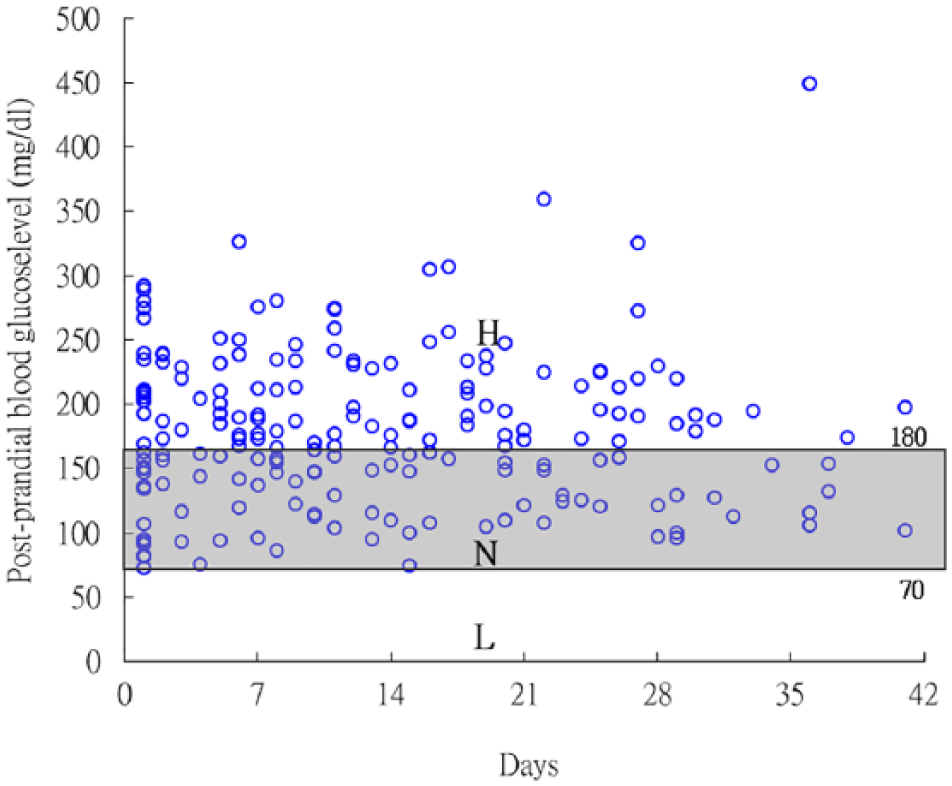
Scatter diagram of post-prandial blood glucose values by subjects’ SMBG (mg/dL). All post-prandial blood glucose of SMBG measurements fell in Zones H to L; hyperglycemia values were variously in Zone H (>180 mg/dL); SMBG values in the recommendation range (<180 mg/dL) were in Zone N; and hypoglycemia values were in Zone L (<70 mg/dL).
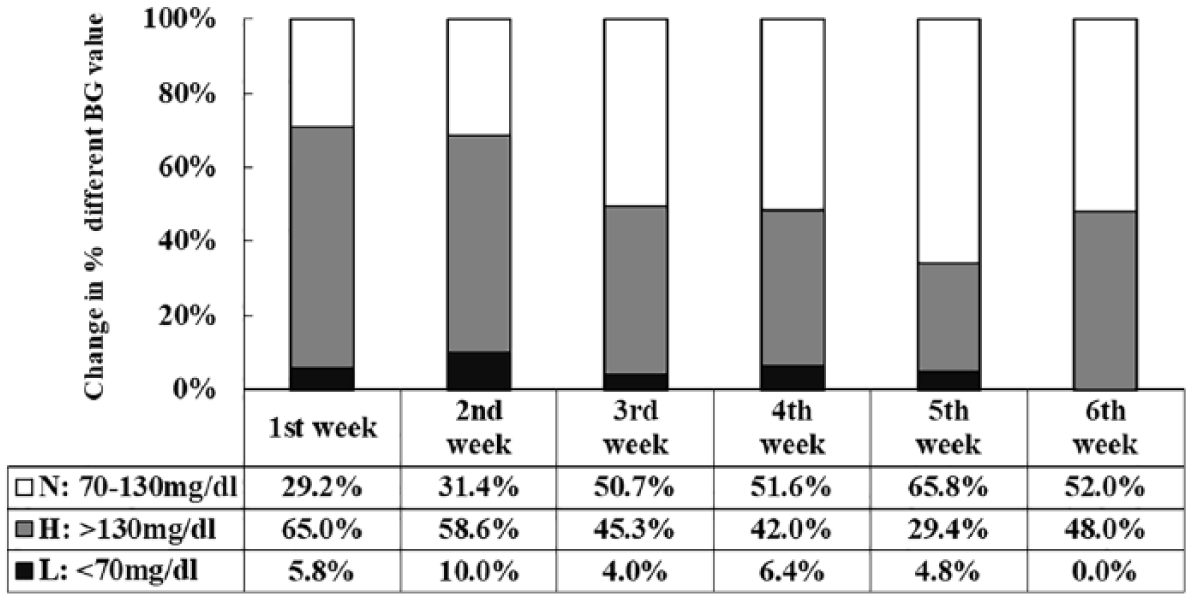
Percentage of pre-prandial blood glucose values fell within a given range.
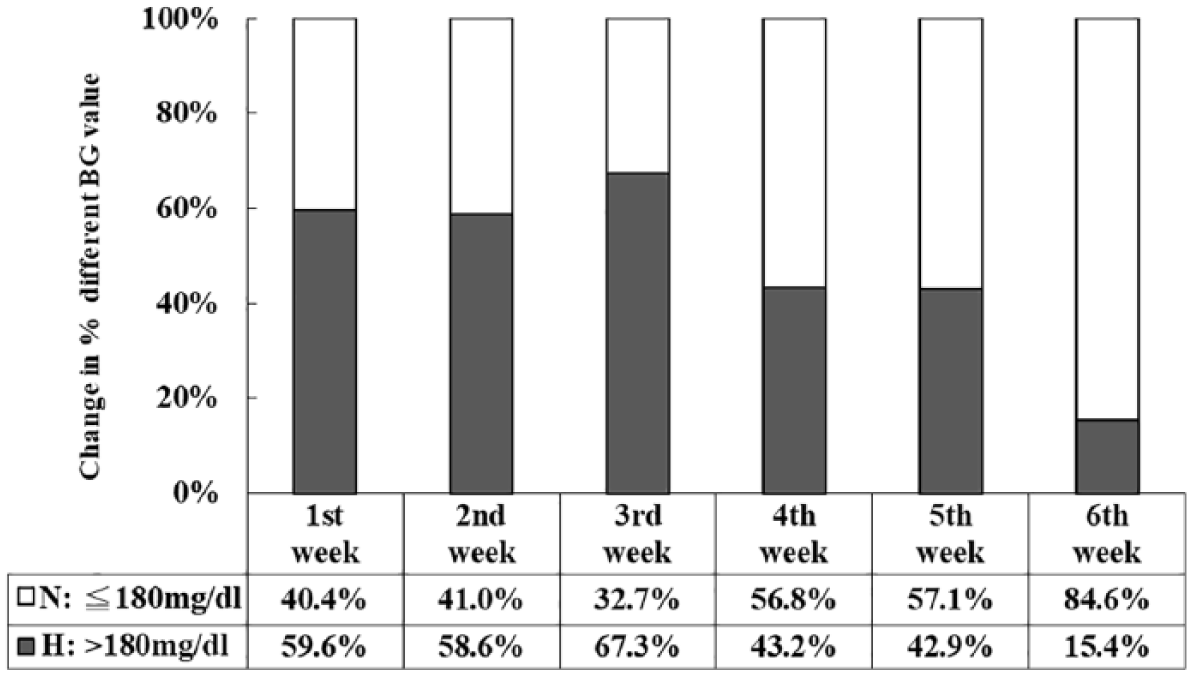
Percentage of post-prandial blood glucose values fell within a given range.
Table 4 shows the four patterns of study subjects according to the classified rule of GV. Mean blood glucose and SD were used to assess individual glucose variation. SD is an index of GV; its optimal range is SD × 3 < mean glucose. 18 Out of the 27 patients, 10 patients had mean blood glucose in the recommended range, but 2 of those 10 had high SD—that may indicate frequent events of hypoglycemia and/or hyperglycemia. Based on the review of blood glucose values of the 27 subjects, four categories of GV emerged:
GV type I: high mean with high GV level. Of the 27 patients, 2 were identified. For example, subject 2’s pre- and post-prandial mean glucose levels were 169.7 and 196.4 mg/dL, respectively, and SDs were 106.5 and 98.8 mg/dL, respectively (the target SDs should be less than 56.6/65.5 mg/dL).
GV type II: normal mean blood glucose at target, but with high SD. Several patients were identified. For example, subject 14’s pre- and post-prandial mean blood glucose levels were 103.8 and 162.7 mg/dL, respectively, with SDs 36.6 and 46.3 mg/dL, respectively. The target SDs should be less than 34.6/54.2 mg/dL. The abnormal glycemic rates were 44.4 and 40.0 percent, respectively.
GV type III: normal both mean blood glucose and SD. Subjects in this category have good control. This category has the lowest blood glucose fluctuation. For example, subject 6 had pre- and post-prandial mean glucose of 122.87 (SD = 10.88) mg/dL and 122.53 (SD = 35.88) mg/dL, respectively.
GV type IV: high mean blood glucose but with normal SD. For example, subject 3 had pre- and post-prandial mean glucose of 191.4 and 242.0 mg/dL, respectively, and SDs were 25.9 and 43.4 mg/dL.
Types of subjects’ glycemic patterns based on mean and SD.
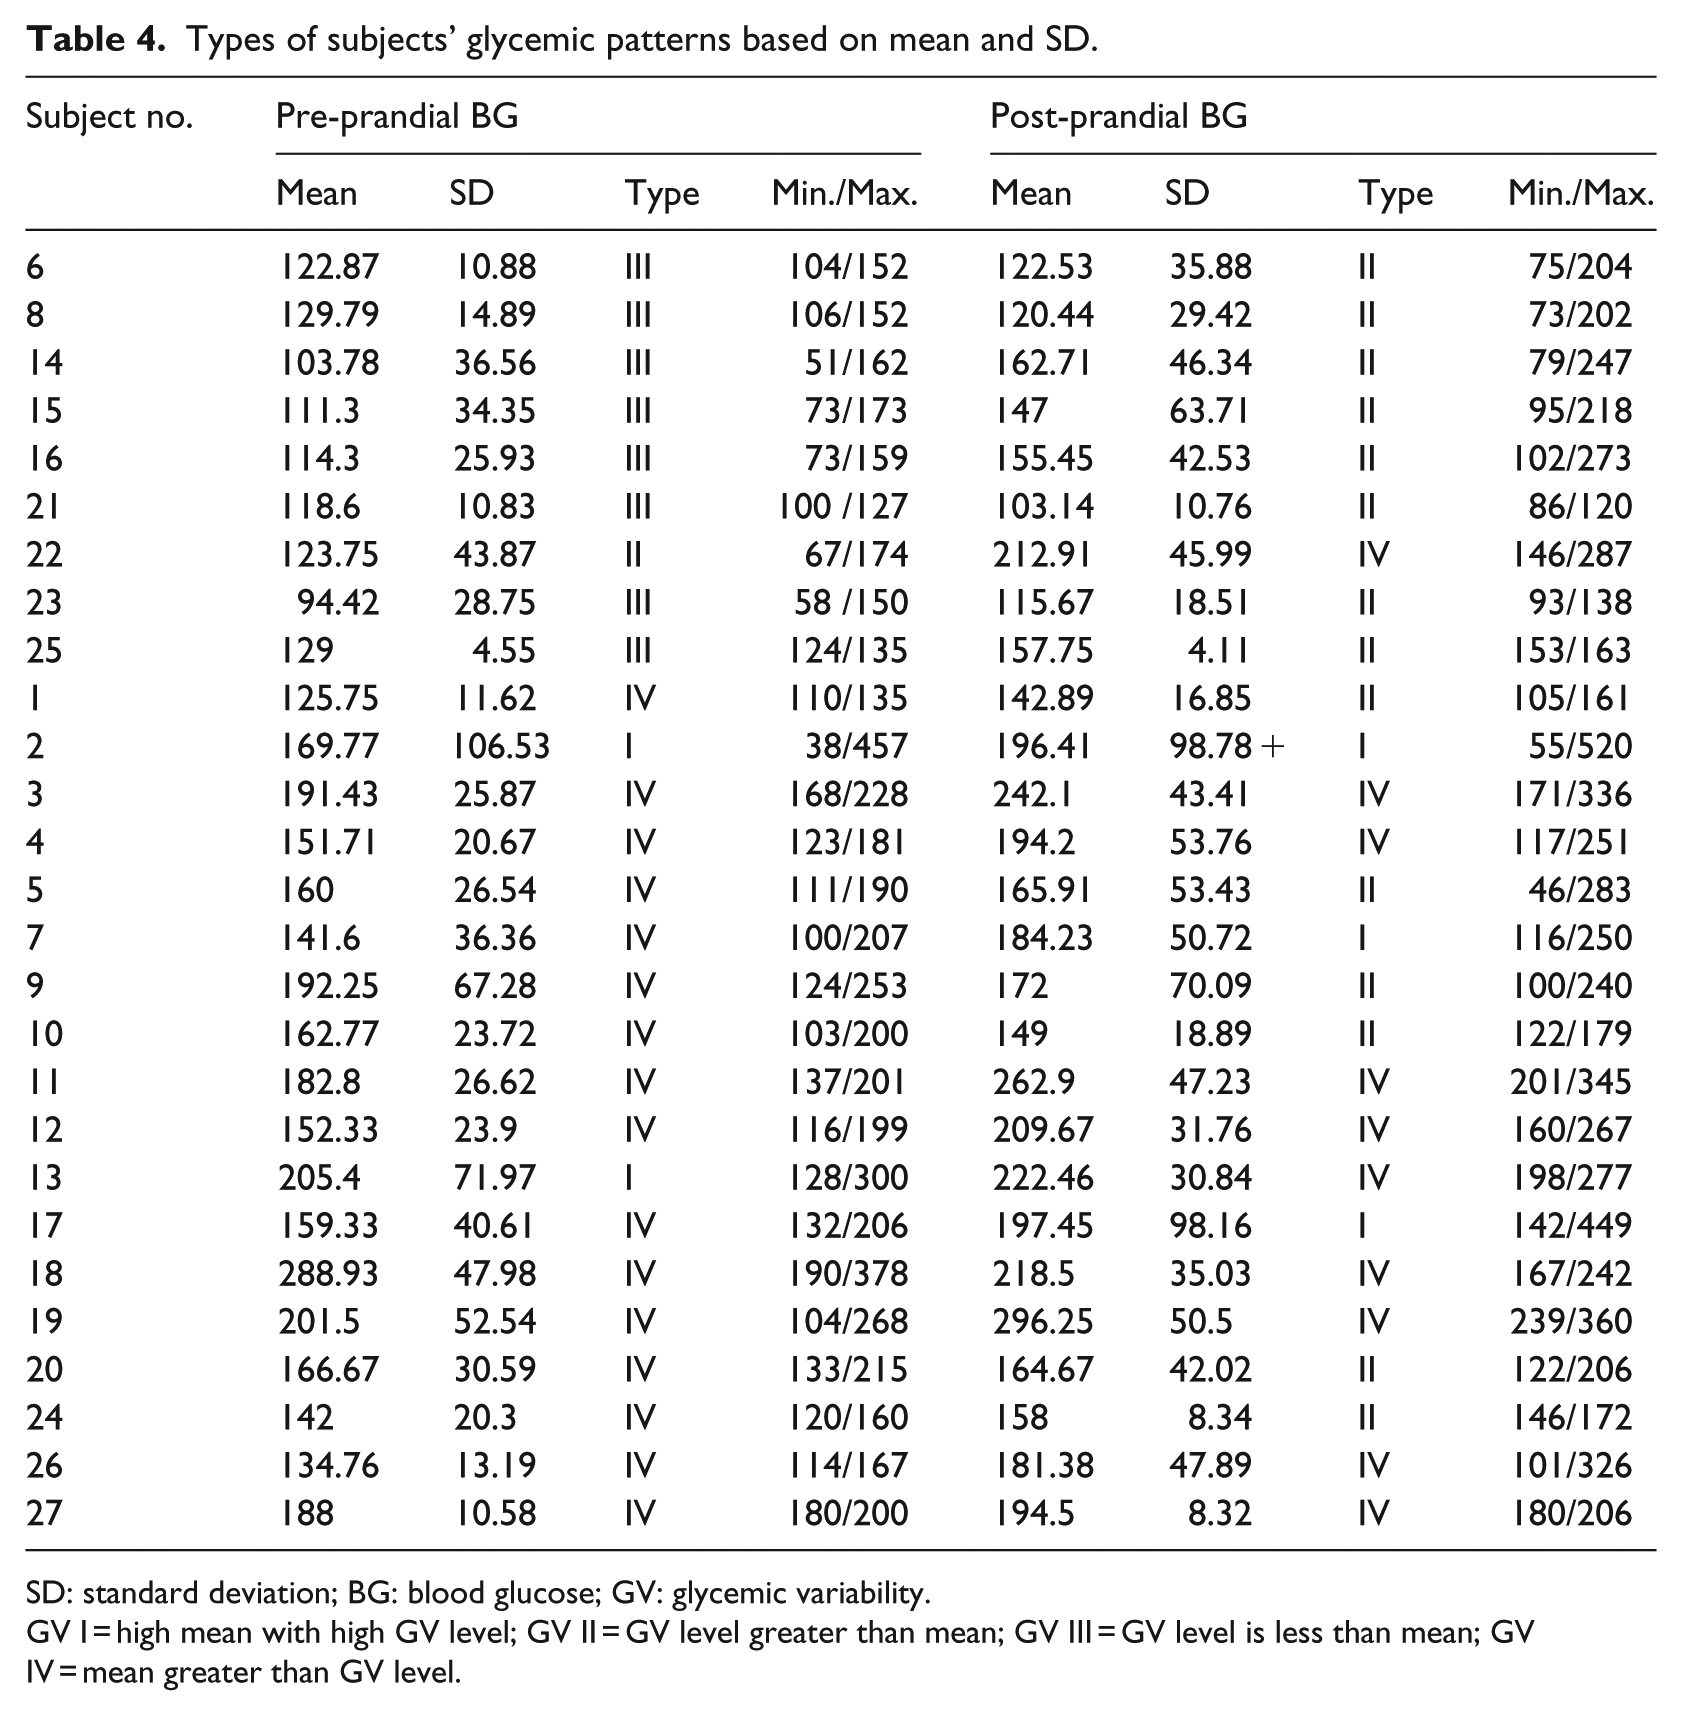
SD: standard deviation; BG: blood glucose; GV: glycemic variability.
GV I = high mean with high GV level; GV II = GV level greater than mean; GV III = GV level is less than mean; GV IV = mean greater than GV level.
Discussion
Analytical results showing downward changes in week-by-week glycemic fluctuation imply that the glycemic status was toward improved stability after the short-term use of the DSCS system. The four identified patterns describing significant GV refer to fluctuations in blood glucose levels throughout the week. These results revealed that pattern recognition can provide a rationale for poor outcome of diabetes management. These approaches can help one assess the magnitude and clinical significance of problems of hyper- and hypoglycemia while managing a great number of diabetic cases. Hirsch and colleagues12,18 indicated that patient with higher SD will have greater risk of diabetic retinopathy than one with lower SD even if both HbA1c are at same level. In addition, the variability itself could be a rich source of information. For example, a high blood glucose variation would indicate problems such as ineffective treatment and poor self-management.
The DSCS system also provides a longitudinal depiction of patient’s glucose control over time that can assist the healthcare providers in assessing whether a patient’s therapy is effective or needs adjustments. Identifying individual’s blood glucose patterns is required in order to design diabetes mobile system with personalized care. Similarly, Schwartz et al. 25 proposed a tool of case-based decision support for diabetes management. There is no gold standard, but there is a growing body of literature describing GV for intensive metabolic control. 14
Each glucose variation measurement has its own advantages and disadvantages; while some are easy to apply, others are more complex and are not practical for clinical use. 14 A simple method using mean and SD index to evaluate GV is as crucial as HbA1c measurement.12,26 While GV is a potentially useful starting point for understanding patients’ metabolic status, even it may not provide a complete understanding.
Limitations
Despite its contributions, this study has certain limitations. First, the SMBG level may not be objective data since it was measured and recorded in the system by patients themselves. Furthermore, the study group was small without a control group, and data were collected over a short period of time. The results obtained may not be an accurate reflection of blood glucose variability in patients with a chronic disease such as diabetes. Analysis of SMBG may be subjective; however, it has still valuable information. 13 In addition, this 1-month study was done without HbA1c comparison and that may diminish the powerful evidence of glucose control.
There exist opportunities to integrate the mobile self-care support system as a part of diabetes management when diabetes is newly diagnosed or metabolic control is poor. New features of the mobile app showing blood glucose fluctuation may contribute to patients’/providers’ mutual understanding of the details of metabolic control. 27 More novel inventions such as intelligent systems to support real-time monitoring blood glucose are emerging in recent studies. 28
Implication for management and research
The study showed that patterns of GV of SMBG data can be useful for both patients and providers in optimizing glycemic control. First, automated pattern recognition may be incorporated into mobile applications to enable patients to learn the blood glucose impact of diet, activity, or medication adjustment. Second, incorporating pattern recognition of SMBG in clinical practice may be a structured approach to effective diabetes management. Based on different patterns of GV, healthcare providers will be able to identify who has greater risk of complications among those who have same level of HbA1c.
For example, a patient with GV type IV (high mean blood glucose and minimal SD) indicates that continued hyperglycemia may be resulting from food choice. However, cases with GV type II (normal mean blood glucose with high SD) are not merely related to food but also require exploration of additional reasons such as severe distress or acute disease in life which can lead to higher GV. Although the mechanism driving wide glycemic variation is not well known, appropriate strategies for individualized treatment of these patients are absolutely required.
Third, patterns of GV from SMBG provide immediate, positive, and concrete feedback. Therefore, healthcare providers can identify patient educational needs and design necessary interventions. They will be able to consider not only the values of HbA1c or their own perspective but also have a complete picture of patterns of GV in daily SMBG when treating diabetic patients.
Researchers should be aware that solely relying on long-term glycemic indices such as HbA1c may lead to an incomplete picture of the level of glycemic control and factors influencing blood glucose fluctuation. Thus, adoption of multiple measures needs to be considered when conducting related research on diabetic populations.
Conclusion
The mobile DSCS has benefits both to establish a picture of GV and to minimize the excursion for the study subjects. Functions such as SD and mean of blood glucose as measures of glucose variability are suggested to explore mobile features to enhance the potential of mobile diabetes care. As mobile application continues to evolve its features, the utility of mobile devices in the healthcare area has increased but not for patients with chronic disease. While all mobile technology–delivered interventions emphasize following user-centered design, it is crucial to build the connection between patients and providers to facilitate the discussion of causes for glycemic fluctuation in order to improve diabetes control.
Footnotes
Declaration of conflicting interests
The author(s) declared no potential conflicts of interest with respect to the research, authorship, and/or publication of this article.
Funding
The author(s) disclosed receipt of the following financial support for the research, authorship, and/or publication of this article: This work was partly supported by the Mackay Medical College, under grant no. 1021A10, and the Ministry of Science and Technology (MOST; 105-2511-S-715-001).