
Abstract
The relationship of infections and glycemic control in diabetes has been previously investigated but no solid findings have been described. Meanwhile, the detection of any infection at the early stages of disease progression, i.e. during the incubation period, is critical. In order to study this topic, we used the infection evidence and the daily glycemic control data of 248 type-2 diabetics who participated in a large telemedicine study. The results showed that morning blood glucose was significantly elevated and that diabetics performed the measurements at a later time when infected. A simple model for predicting the occurrence of infection based on the glycemic control variables showed good performance (sensitivity: 56%, specificity: 92%). A set of variables that synthesize a diabetic’s profile could be included in a dedicated model and facilitate the early detection of infections; other aspects, such as continuous self-monitoring and personalized medical records, should be examined in this direction.
Introduction
Diabetics form a vulnerable population group that is under continuous risk of developing serious complications, such as eye, kidney and nerve damage. The morbidity/mortality associated with diabetes is related to specific conditions; infection is one of them. 1 Cystitis, pneumonia, cellulitis, and respiratory tract and enteric infections are the most commonly reported infections; 2 people with type-1 and type-2 diabetes are at increased risk for common community-acquired infections, such as influenza and urinary tract infections. 3 Specific infections, such as emphysematous pyelonephritis, occur almost exclusively in diabetics, while other infections occur with higher severity and are associated with an increased risk of complications. 4
Additionally, infections that are easily managed in the general population may cause serious health conditions in diabetics and, under some circumstances, lead to death. For example, the impact of diabetes on deaths associated with influenza and pneumonia is substantial. 5 Defects in immunity and multiple medical interventions in this patient group have been described as the possible causes for infections; they may also be responsible for their difficult course in diabetes. 6
The role of intensive blood glucose control strategies on the prevention of diabetes complications has been investigated in a few randomized controlled clinical trials, 7 such as the United Kingdom Prospective Diabetes Study (UKPDS) 8 and the Diabetes Control and Complications Trial (DCCT) 9 that involved type-2 and type-1 diabetics respectively. Although they all showed that lowering blood glucose was beneficial for the prevention and control of certain diabetes complications (retinopathy, nephropathy and neuropathy), they did not investigate the impact of self-management on reducing the risk of infections. Based on other studies, it seems that the relationship between blood glucose control and predisposition to specific community-acquired infections is generally weak. 10 On the other hand, acute infections lead to difficulty in controlling the blood glucose levels. 11 Consequently, it is important to detect an infection as early as possible and before the manifestation of disease symptoms, i.e. during the incubation period. 12
Various technologies have been developed for the management of diabetes, such as Web applications for population-based care13,14 and decision-support systems,15,16 as well as mobile phone-based systems combined with Web-based platforms for the self-management of diabetes. 17 Unambiguously, the early detection of infections could be supported by the existing technology.
In an early publication, Rayfield et al. suggested that acute infections affect the metabolic control in diabetes and lead to blood glucose elevation; however, their study was limited in terms of data collection and analysis. 11 Other studies investigated this association, but in the reverse way, i.e. whether elevated blood glucose levels were associated with an increased risk of infection for either hospitalized18,19 or non-hospitalized diabetics 20 . Working in the same research area, Davis et al. found no relationship between the incidence of infections and glycosylated hemoglobin (HbA1c) in type-2 diabetes. 21 However, they did not discriminate their observations over each period of the disease progression and, consequently, their findings were not informative for the incubation period. Also, HbA1c offers a long-term evaluation of glycemic control and, apparently adds no value to the early detection of infections, which has been one of the main issues in our study.
In a previous study, we indicated that blood glucose was elevated after infections in people with type-1 diabetes. 22 Here, we present experimental, early findings for the role of glycemic control as an indicator for the early detection (i.e. during the incubation period) of infections in people with type-2 diabetes. In combination with our aforementioned work on type-1 diabetes, 22 we introduce the proof of concept for the important role of glycemic control in the early detection of infections in diabetics.
Methods
Population study and sample definition
The population of this study consisted of people with type-2 diabetes who were enrolled in the Informatics for Diabetes Education and Telemedicine (IDEATel) study through the primary care practices in New York City. With the enrollment hub at the NewYork- Presbyterian Hospital, the study participants either received a set of telemedicine services (intervention group) or remained under the usual care of their primary care providers (control group).23,24 The intervention group measured and uploaded their blood glucose values into the NewYork-Presbyterian Hospital Clinical Information System Repository, while both groups used the in- and out-patient health services in the same hospital. Consequently, it was possible to access in- and out-patient healthcare data, as well as glycemic control data for a certain number of diabetics. The study population was categorized according to the available data as it is shown in Figure 1.
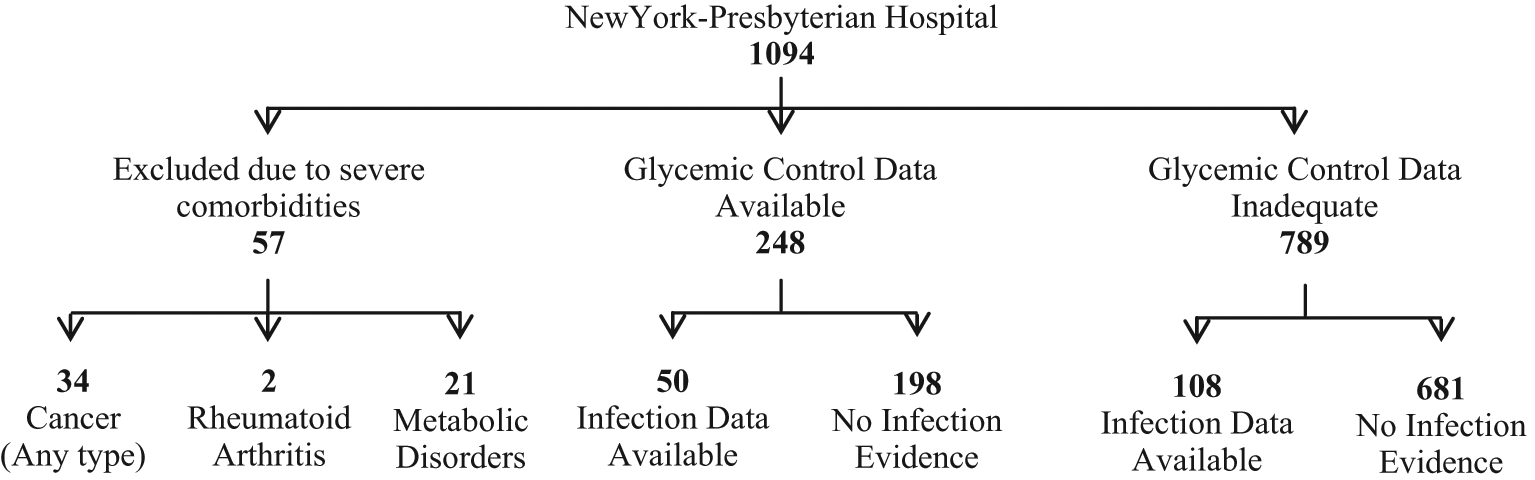
Categorization of study population according to the available data. Fifty-seven participants were excluded owing to severe comorbidities, while 789 study participants had inadequate glycemic control data [either did not record their morning blood glucose values regularly (≤180 values per year) or were lost to follow-up]; however, there was some infection evidence for 108 of them. Of the remaining 248 people with type-2 diabetes, 198 subjects had no infection evidence but adequate glycemic control data, while 50 subjects had some infection evidence and adequate glycemic control data; the latter group formed the cohort of this study.
For the purposes of our study it was important to evaluate both glycemic control data and infection incidences; the single available source for the latter was the in- and out-patient records stored in the NewYork-Presbyterian Hospital system. Diabetics who suffered from serious co-existing conditions (rheumatoid arthritis, any type of cancer and metabolic disorders) or had inadequate glycemic control data and infection evidence were excluded from any further processing; to be included they had to have had 1–2 infection incidences in a 1-year period. Subsequently, 50 diabetics were selected (Figure 1) and their data (infection evidence and glycemic control data) were assessed for the 1-year period. This group was also combined with the 198 diabetics having no infection evidence to further investigate the glycemic control alterations during the incubation period.
Data elements and definition of the incubation period
The positive cultures (both for in- and out-patients) and the infection-related clinical diagnoses (for in-patients) were evaluated for any infection evidence. Infections should be documented by a positive culture, a clinical diagnosis or both; healthcare-associated infections were not considered. Thus, only those infections documented on the day of admission were acceptable for the in-patients according to the following definition (25):
‘Healthcare-associated (hospital-acquired or nosocomial) infection is an infection that was not present or incubating on admission to a hospital or other healthcare contact; it occurs >48h after admission to the hospital, or within a specific period after healthcare contact, i.e. within ten days of hospital discharge or three days of an outpatient procedure’.
Based on that, the 3-day period after the infection documentation for out-patients and the 10-day period after the discharge date for in-patients, as well as the corresponding hospitalization periods, were discarded. Other hospitalization periods having no documentation of infection along with the 5 preceding and the 10 following days were also removed. The use of the electronic patient record as the single source for the appropriate data secured the reliable determination of infection incidents, as well as the specification of incubation period. The incubation period for each infection was determined according to the data availability and what has been stated in the literature so far.12,25–34 For example, Streptococcus B species are generally characterized by an incubation period of seven days; 29 having a corresponding positive culture for a participant, the blood glucose values that were collected during this 7-day period were considered as ‘diseased’ and the remaining (in the 1-year period) as ‘normal’. Regarding blood glucose, only the morning values were processed: the first blood glucose value that was measured in the 12-hour period between midnight and noon was defined as the morning blood glucose value, which was expected to be the value before the first meal. The data set for the first patient group included all the infection-related and glycemic control data elements while, for the second group, only the latter were considered.
In order to assess the glycemic control alterations during the incubation period, we used the data set of the first patient group (that had detailed documentation of infections) and compared the ‘diseased’ versus ‘normal’ glycemic control variables (blood glucose values and measurement times). The Wilcoxon signed rank test was used for the non-parametric paired comparison of the average ‘normal’ versus average ‘diseased’ BG values and measurement times.
Furthermore, the association between infections and glycemic control variables was investigated with the binary logistic regression method. Using the appropriate function of the statistical software, the diabetics of both groups (with and without infection documentation) were equally and randomly split into two subgroups that contributed to the synthesis of two data sets accordingly: training and testing data set. The training set was used for the conduction of the binary logistic regression analysis and included the mean ‘normal’ and ‘diseased’ BG values/measurement times per patient; the testing set was used for the evaluation of results and included randomly selected blood glucose measurements (one per patient, either ‘diseased’ or ‘normal’) for a specific time point.
All p values were based on two-sided testing and differences were considered significant at p < 0.05. SPSS for Windows (version 15.0, SPSS, Chicago, IL, USA) was used for the statistical analysis; this study was approved as part of the IDEATel study protocol by the Institutional Review Board.
Results
The first group, which had both infection and glycemic control data, included 37 females (age: 70.8 ± 6.2 years) and 13 males (age: 70.0 ± 7.2 years), and the second, with glycemic control data only, 97 females (age: 71.3 ± 6.3 years) and 101 males (age: 70.8 ± 6.5 years). The median blood glucose values in the first and second group were calculated using the average blood glucose value per diabetic and were equal to 131.86 mg/dl (SD: ±41.96) and 130.40 mg/dl (SD: ±22.89) respectively.
After observing the individual patterns in the diabetics of the first group, we concluded that, generally, diabetics followed a certain plan for measuring their first morning blood glucose. The corresponding times varied under non-diseased conditions (mean ± SD: 8:21 a.m. ± 1:56 hours) and their distribution presented many outliers in the early hours (left-skewed distribution). The ‘diseased’ distribution was also asymmetric (left-skewed) but approached the Gaussian (kurtosis was equal to 3.087). Additionally, the ‘diseased’ measurements were performed later (mean±SD: 8:46 a.m. ± 1:30 hours); the differences for the equality of means were assessed by the t-test (p = 0.001).
In order to assess the glycemic control during normal versus incubation periods, the corresponding mean values (blood glucose and measurement time) for each patient were used as independent variables; a non-parametric paired comparison of normal versus diseased values revealed that blood glucose levels and measurement times were significantly higher for the incubation period (differences assessed by the Wilcoxon signed rank test, p = 0.0001 for blood glucose and p = 0.046 for measurement time).
Subsequently, we aimed to build a model that could hypothetically predict an infection incidence based on the glycemic control variables, which were proved to be altered during the incubation period; binary logistic regression method was used for this purpose. Patients of both groups were randomly assigned by an SPSS function into two subgroups, each one consisting of 124 patients; the data of each subgroup formed the training and the testing data sets. Each patient represented a separate case in the training data set (number of cases: 124) with the absence/presence of infection being the binary response variable and the mean blood glucose values and measurement times being the independent variables.
As it is shown in Table 1, the results of the analysis indicated that blood glucose and measurement time contributed significantly to the dependent, i.e. the absence/presence of infection. Based on these results, the equation for calculating the probability of infection was:
Results of the binary logistic regression
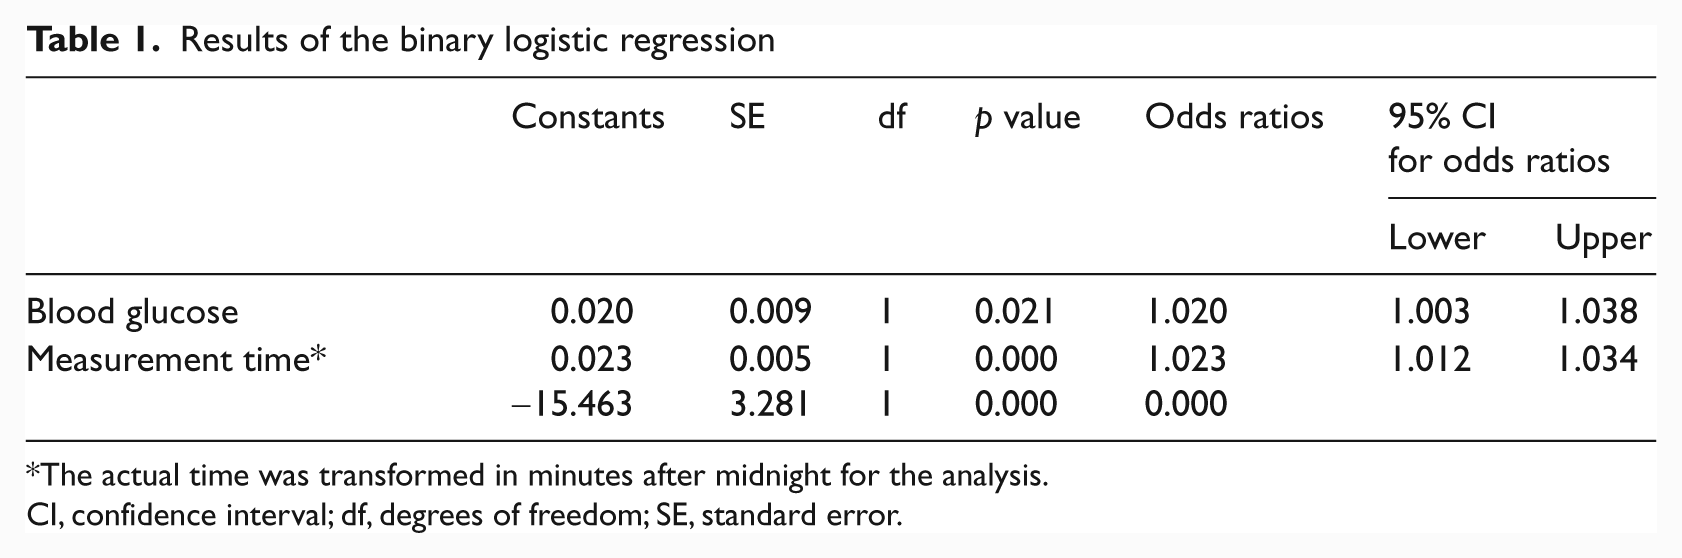
The actual time was transformed in minutes after midnight for the analysis.
CI, confidence interval; df, degrees of freedom; SE, standard error.
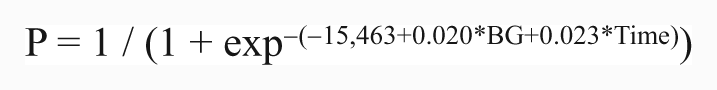
where BG = blood glucose.
In order to interpret the results of the equation, we set the cut-off point for defining a case as ‘diseased’ to 0.5. Subsequently, using the data of the testing set (one random blood glucose measurement per patient for a specific time point; number of cases: 124) the calculated positive predictive value (PPV) was equal to 74%. Evaluating further the performance of the binary logistic regression, sensitivity was equal to 56% and specificity equal to 92%. The receiver operating characteristic (ROC) curves for the training and testing data sets are shown in Figure 2.
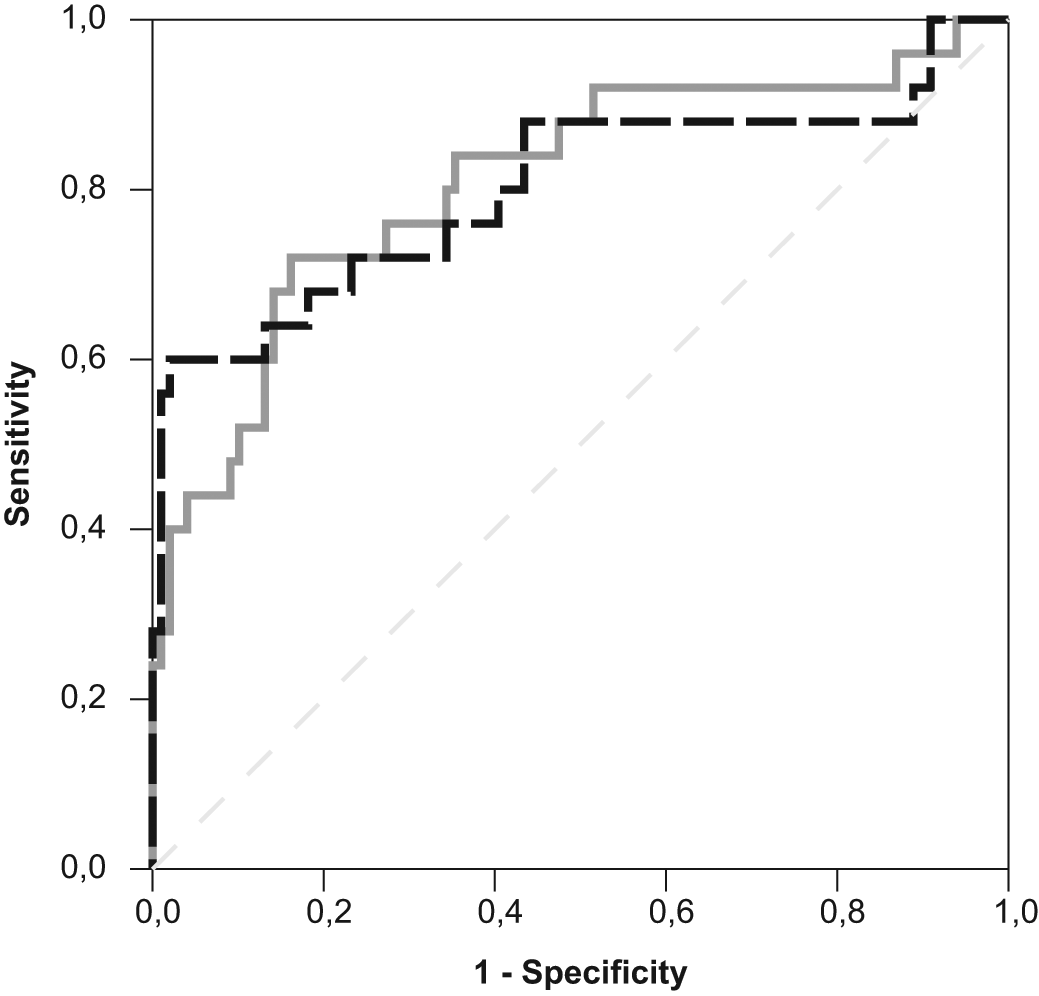
ROC curves for the training (grey line) and the testing set (dashed black line); the area under the curve (AUC) was 0.809 and 0.802 respectively.
Discussion
Our study was based on the assumption that the diabetics of our cohort sought consultation after the onset of symptoms and the fact that, on this occasion, they received the in-patient/out-patient health services of the NewYork-Presbyterian Hospital. Our results indicated that there was a strong correlation between infections and glycemic control; interestingly, blood glucose was predominantly elevated during the incubation period and before the disease manifestation. We also showed that diabetics performed the morning measurements at a later time when infected, probably as a result of the overall alterations in their physiology status. In order to develop a prediction model for diabetic’s condition (absence/presence of infection) based on the glycemic control variables, we used a training set containing data from the two groups of our study; the binary logistic regression method was applied to that set. Subsequently, the performance of the model was evaluated with the testing data set (also extracted from the study cohort). The PPV (76.5%) and specificity (92%) were found to be considerably high, while sensitivity was lower (56%) but quite satisfactory for the further exploitation of results.
The observed infections in our sample (urinary tract, respiratory and foot infections) are representative of common infections observed in diabetics. 35 It could be argued that we may have missed some infection incidences, which were either not documented properly or not treated at the NewYork-Presbyterian Hospital. However, this was not likely to have happened given that all examinations were performed at the New York-Presbyterian Hospital for the IDEATel participants that were recruited there in the first place. 36
In order to reduce the bias introduced by the exclusion of factors that affect glycemic control, such as food consumption, physical activity and insulin intake, it was decided to use only the morning blood glucose values, i.e. the first value that diabetics measured when they woke up. Unfortunately, the exact definition of the morning rising time was not possible as there is not a relevant rule or reliable findings. Duffy et al., who studied the sleep patterns in healthy subjects aged 64–81 years, reported 06:59 a.m. ± 50 minutes as the wake time; 37 Czeisler et al. made an observation close to that time (average, 06:36 a.m.). 38 However, in another study it was quite different (05:42 a.m. ± 1 hour) for the same age group. 39 The Sleep Heart Health Study revealed that diabetics suffer from various sleep disturbances, 40 while Skomro et al. reported high rates of insomnia among type-2 diabetics. 41 Consequently, it was decided to select the first measured value between midnight (00:00 a.m.) and noon (11:59 a.m.) as the first morning value.
Incubation period is related to the host and its immunology status; it may also be greatly dependable on the strain characteristics that could lead to variations for the same microorganism. Its exact determination requires the detailed description of patients’ profiles in association with their immune response to certain infections. Issues of this kind could not be treated other than in a dedicated study and it was not possible to address them in the current study owing to lack of the appropriate data elements. For the purposes of our research, it was necessary to rely on the available limited data sources (clinical diagnoses and positive cultures) only and interpret them based on the existing literature.
Another issue that should be discussed concerns the selection of the ‘diseased’ and the ‘normal’ blood glucose values. In the case of in-patients, any positive cultures that were not performed on the admission date were considered irrelevant to our purposes in order to avoid the risk of including hospital-acquired infections. For the same reason, the 3-day period after the infection documentation for out-patients, the 10-day period after the patient’s discharge from the hospital and any other no-infection-related hospitalization periods were discarded.
The very low number of ‘diseased’ values (only two for some diabetics) might appear as a limitation of our study. It is expected, though, that a diabetic without serious co-existing conditions could not have had many infection incidences in a 1-year period. For example, Davis et al. found that 51.7% of the participants in their study did not report any infection incidence in a 12-month period. 21 Also, the incubation period could not exceed a certain limit of days, for example for most bacteria it is between two and four days. 25 Thus, it was not possible to aggregate a number of ‘diseased’ values comparable to the ‘normal’ ones.
According to the IDEATel study protocol, participants were recruited for two years with those randomized to the intervention group collecting their blood glucose values daily for the whole period.24,42 However, they did not always adhere to this rule or could not manage to, for example as a result of a serious event that was treated in the hospital. Consequently, some of them had many missing blood glucose values, especially morning ones, which resulted in less than 100 morning measurements per year. Instead of excluding them, it was considered important to evaluate the infections/blood glucose association for some diabetics that did not always adhere to the rule of frequent measurement, which is a quite common for type-2 diabetics. Even in this case, the selected diabetics had concise evidence of infections and adequate data for their glycemic control during the period of interest.
In an early publication, Rayfield et al. suggested that acute infections affect metabolic control in diabetes and lead to blood glucose elevation; however, their study was limited in terms of data collection and analysis. 11 Other studies investigated this association, but in the reverse way, i.e. whether elevated blood glucose levels were associated with an increased risk of infection for either hospitalized18,19 or non-hospitalized diabetics. 20 Working in the same research area, Davis et al. found no relationship between the incidence of infections and HbA1c in type-2 diabetes. 21 However, they did not discriminate their observations over each period of the disease progression and, consequently, their findings were not informative for the incubation period. Also, as aforementioned, HbA1c offers a long-term evaluation of glycemic control and apparently adds no value to the early detection of infections.
Blood glucose is definitely a variable that is affected by a variety of factors and cannot always offer accurate information about the diabetic’s health status; however, it may offer an indication of their short-term condition. This instant evaluation may be critical in the case of a serious infection with any false positive ratio being balanced by the foreseen benefit for the patient.
Despite our encouraging findings, it is debatable whether blood glucose could be the unique indicator for the early detection of infections in diabetics and we are still far from making such conclusions. At the same time, the complete lack of the appropriate technology tools requires the examination of alternative solutions, especially in the case of diabetics that suffer a lot and are at high risk when infected. The monitoring technologies that have been used in dedicated studies like the IDEATel are rather generic and inadequate to support this task alone.
On the other hand, the existing tools could be used for data collection which would facilitate the development of dedicated multi-models. These models could enhance a set of variables (apart from blood glucose) that synthesize the diabetic’s profile, such as the morning measurement time. The calculated high PPV (76.5%) of glycemic control in the testing set is a strong indication for our claim. Doubtless, the combinatorial use of such variables would not be a simple task and could definitely not be implemented using only traditional approaches.
The proposed strategy would require continuous self-monitoring and input from the patient’s side; it may also require the use of point-of-care medical devices for the collection of their physiology values and interoperability with personalized medical records. Also, dedicated models could be developed for the identification of disease patterns, both at the individual and at the group level. Eventually, this would lead to the investigation of other directions in medical informatics research, such as the development of personalized disease surveillance systems that would alert diabetics to a change in their health status or an epidemic threat in their region. Prior to working on these aspects, there are many elementary issues that should be examined—the most important were discussed above.
Footnotes
Acknowledgements
We thank Professor Steven Shea (Principal Investigator of IDEATel) for welcoming the idea for this study, Dr Valsamo Anagnostou for her medical advice and fruitful discussions and Mr. Sean Mota for his assistance in obtaining the appropriate data.
This study was supported, in part, by the Research Council of Norway Grant 174934.